Download to read offline
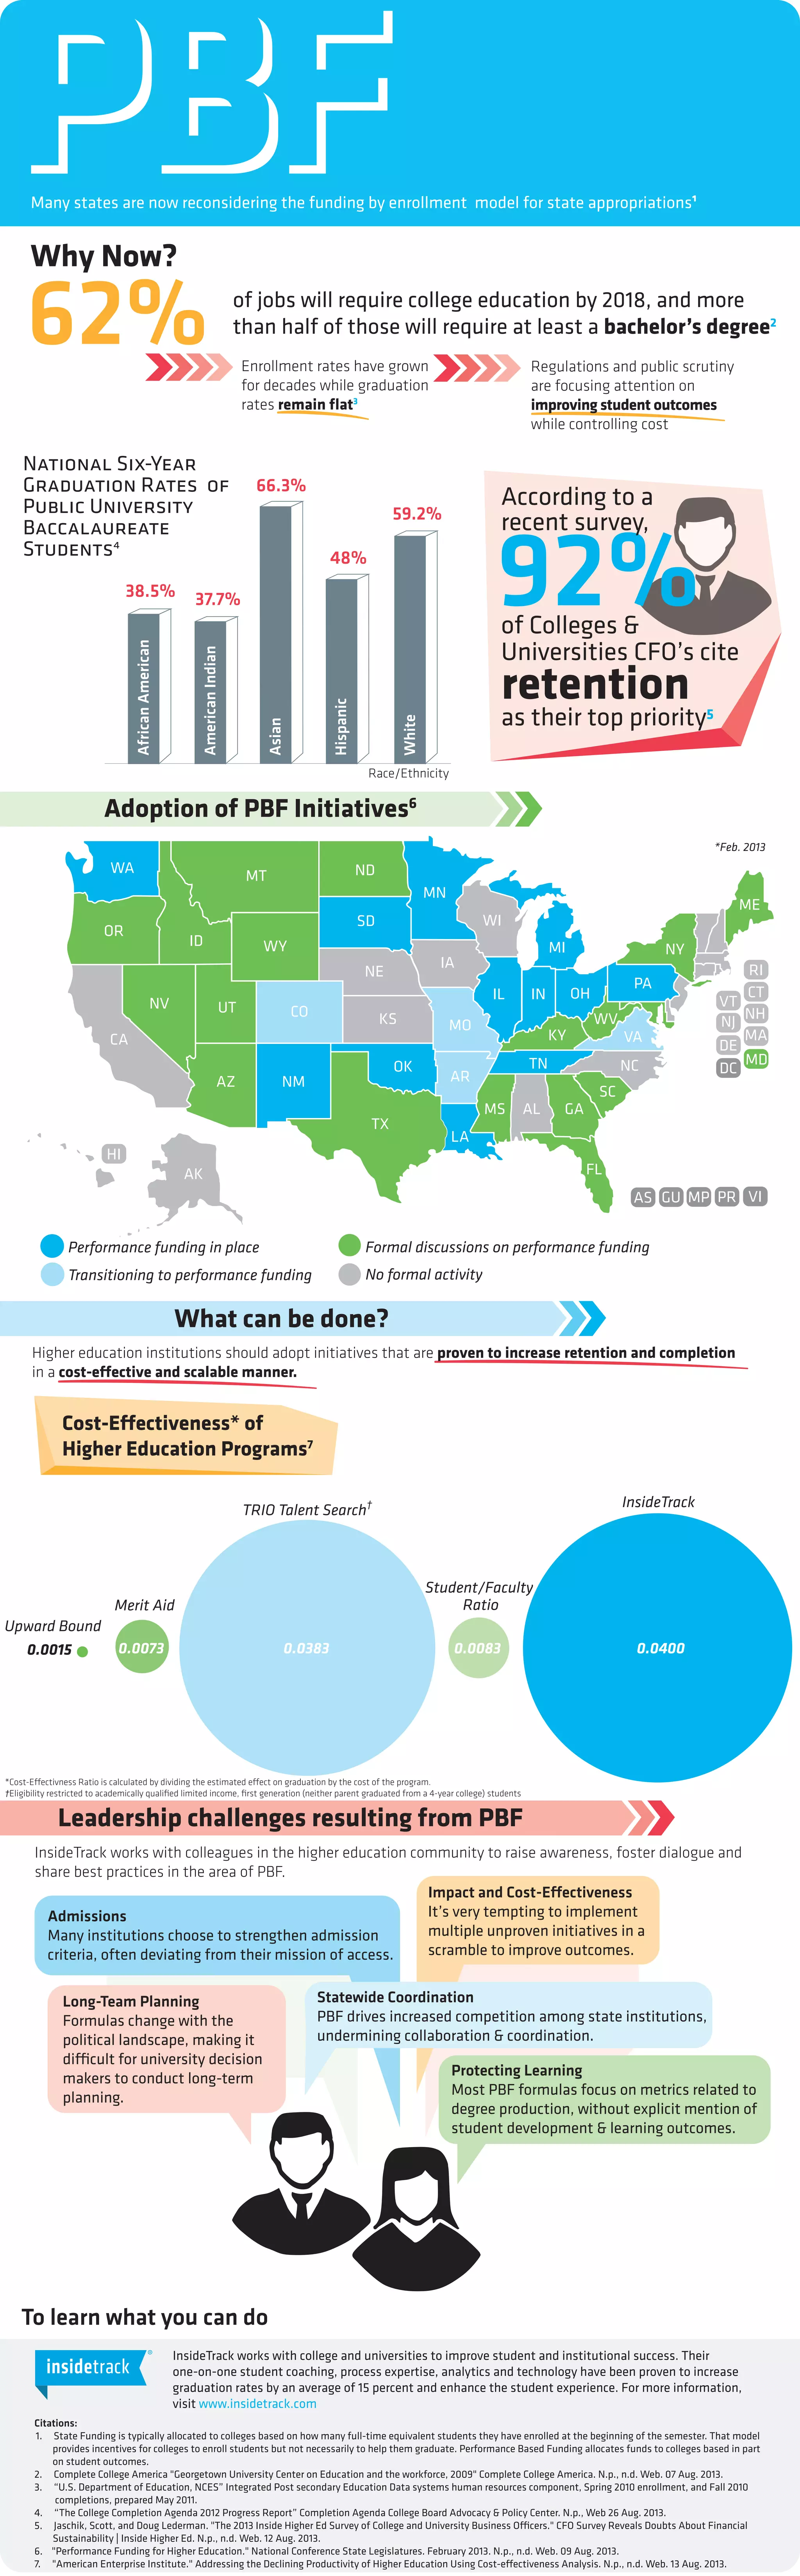

Many states are reevaluating the funding model for higher education as they recognize that 62% of jobs will require some level of college education by 2018. Performance-based funding (PBF) is being implemented, focusing on student outcomes, which poses challenges for institutional collaboration and may inadvertently drift from the goal of student development. Insidetrack offers strategies and support to improve student graduation rates and experiences by leveraging coaching and analytics.


