Download as PDF, PPTX


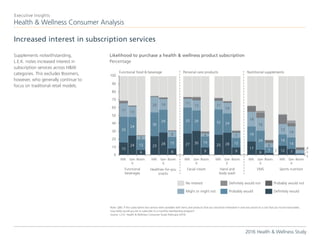
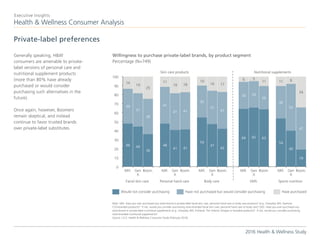
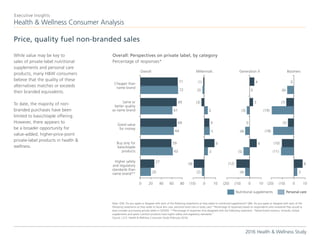

The document summarizes key findings from the 2016 Health & Wellness Study conducted by L.E.K. Consulting. The study examined consumer spending on nutritional supplements, personal care products, and healthy groceries. It found that while millennials are more open to new categories and channels, traditional retailers like drugstores and supermarkets still capture the majority of health and wellness spending, even among millennials. The study also found that most consumers are open to private label products but that boomers remain more loyal to brands.


![[Kantar] Consumer insights asia Q1/2017](https://cdn.slidesharecdn.com/ss_thumbnails/317consumer-insights-asia-q1-20171500968511-171227160227-thumbnail.jpg?width=640&height=640&fit=bounds)


![2016 Candidate Trends in Southeast Asia [Webcast]](https://cdn.slidesharecdn.com/ss_thumbnails/2016candidatetrendssoutheastasia-160727163615-thumbnail.jpg?width=640&height=640&fit=bounds)


