Download as PDF, PPTX
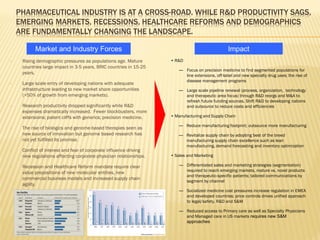
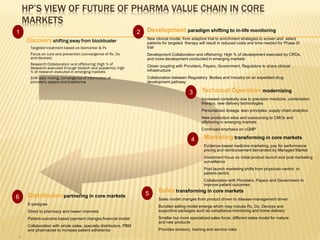
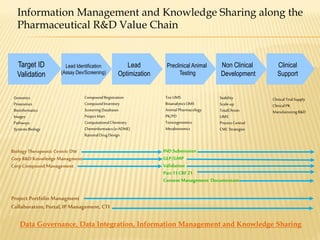
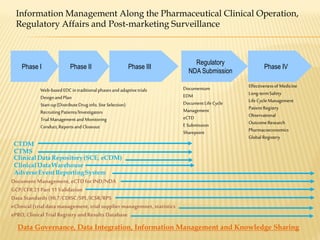
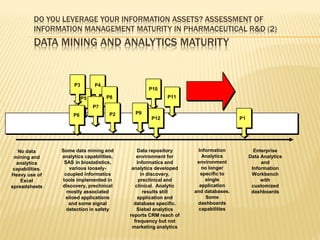

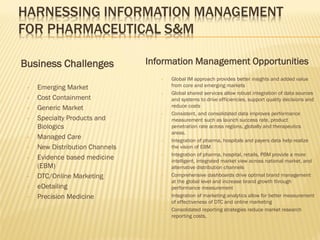
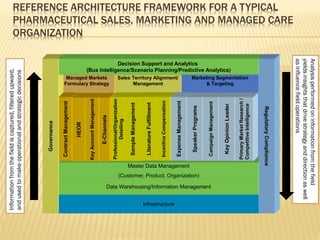
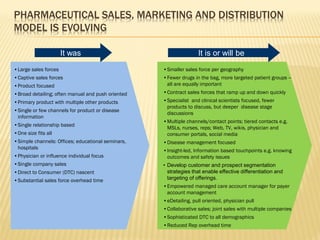
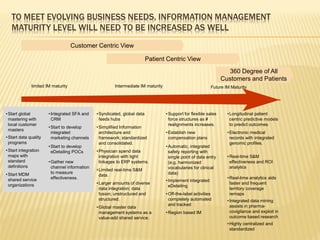
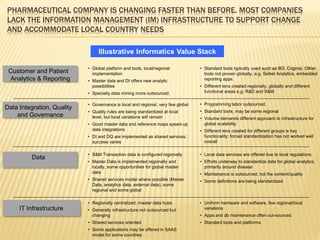

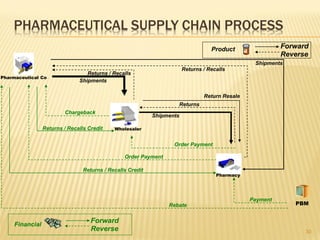
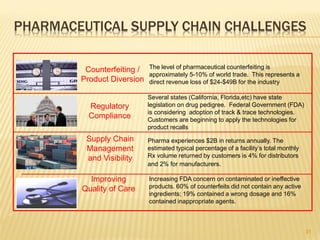
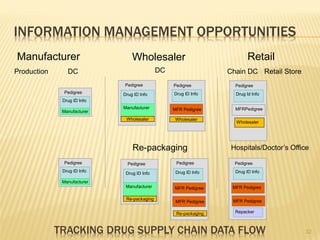
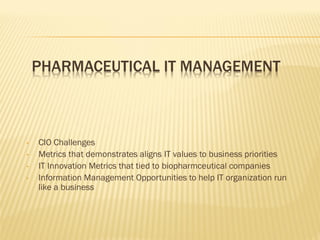

The document discusses the challenges and opportunities faced by the biopharma industry, emphasizing the need for improved information management across various sectors, including R&D, clinical trials, and sales and marketing. It highlights the impact of emerging markets, healthcare reforms, and demographic changes on pharmaceutical productivity and strategy, advocating for a shift toward precision medicine and better integration of data and collaboration among stakeholders. The document also outlines the importance of advanced information systems for enhancing operational efficiency, regulatory compliance, and patient outcomes.


![CASE_PRESENTATION_ON_subdural_hematoma(SDH)[1 FINAL PPT]-1.pptx](https://cdn.slidesharecdn.com/ss_thumbnails/casepresentationonsubduralhematomasdh1finalppt-1-260129172522-d405d375-thumbnail.jpg?width=640&height=640&fit=bounds)


