SlideShare a Scribd company logo
Article Citation:
Etobo Innocent AHOUNOU, Koffi Mathias YAO, Kobenan Fiéni Jean-Baptiste ADOU,
Némé Antoine TAKO and Bialli SERI.
Influence of alcohol on vigilance levels for a driving test.
Journal of Research in Biology (2015) 5(7): 1874-1884
JournalofResearchinBiology
Influence of alcohol on the vigilance levels for a driving test
Keywords:
Alertness, alcohol, acute consumption, errors.
ABSTRACT:
In order to determine the maximum alcohol to remain sufficiently vigilant
during a driving, sixty (60) male volunteers divided into two groups of thirty, including
a control group and an experimental group previously submitted to acute
consumption of alcohol, were chosen and participated in a driving test. Each subject
shall drive a vehicle on a straight track for 500 meters with a circular terminal after 80
meters, enabling him to return to the starting point. The speed was imposed by an
instructor and obstacles (balls) may be set to arise on the way. Ten centimeters were
added on the side edges of the vehicle to plot the width of the road ahead. Thus, any
excess of the lateral edges is a lateral error and any ball reached, arising in front of the
driver, is a frontal error. The test is performed each hour for five consecutive hours.
The results indicated that the number of errors increases with speed, the side that
errors outnumber frontal errors and the acceptable blood alcohol for driving test
would be 0.3 g of alcohol per liter of blood. Thus, the state should reduce the
permitted blood alcohol, currently at 0.8 g / l, at a rate less than or equal to 0.3 g / l.
The state must also equip the police forces of devices adapted to make systematic
control.
1874-1884 | JRB | 2015 | Vol 5 | No 7
This article is governed by the Creative Commons Attribution License (http://creativecommons.org/
licenses/by/4.0), which gives permission for unrestricted use, non-commercial, distribution and
reproduction in all medium, provided the original work is properly cited.
www.jresearchbiology.com
Journal of Research in Biology
An International
Scientific Research Journal
Authors:
Etobo Innocent AHOUNOU,
Koffi Mathias YAO,
Kobenan Fiéni
Jean-Baptiste ADOU,
Némé Antoine TAKO and
Bialli SERI
Institution:
Laboratoire de
Neurosciences, UFR
Biosciences, Université Félix
Houphouët-Boigny,
22 BP 582 Abidjan 22,
République de Côte d’Ivoire.
Corresponding author:
Koffi Mathias YAO
Email Id:
Web Address:
http://jresearchbiology.com/
documents/RA0571.pdf
Dates:
Received: 01 November 2015 Accepted: 09 November 2015 Published: 15 December 2015
Journal of Research in Biology
An International Scientific Research Journal
Original Research
ISSN No: Print: 2231 –6280; Online: 2231- 6299
INTRODUCTION
Alcoholism is one of the major health risks in
the world (Yao et al., 2012). According to the 2006
report by the World Health Organization (WHO), the
harmful use of alcohol was responsible for 4% of the
disease burden and 3.2% of premature deaths worldwide.
These statistics also contain traffic accidents, which are
resulted from the combination of multiple factors
including health status, values, attitudes and behavior of
drivers; all that constitutes the human factor are known
to be involved in the conduct.
Toxicological data indicate that about 25% of
drivers involved in road accidents are under the influence
of drugs and in general, a high rate of alcohol was
detected (Brady and Li, 2013). Variations in individual
tolerance (Alvarez and Del Rio, 2003) depending on the
regularity of consumption do not allow alcohol to
indicate a stable, maximum for which there could be no
observable effect on an individual (Dupont et al., 2012).
So, if we agree to accept that the substance is dangerous
for the driver when it reduces its capacity to lead by
decreasing motor skills, reaction time and changing the
perception (Kelly, et al 2004), the safety threshold in
consumption remains variable from one State to another.
Indeed, some studies showed that acute alcohol is
attained only from a BAC of 0.8 g / liter of
blood (INSERM, 2001). However, for some authors, a
BAC of 0.5 gram per liter of blood led to observable
effects on human behavior (Oscar-Berman and
Marinkovic, 2007). Thus, according to studies, the
minimum acceptable alcohol is still debated. Therefore
the BAC limits vary from 0 to 0.8 g per liter of blood
based on the considerations of each state.
For these reasons, the objective of this study is
to estimate the maximum alcohol to which one might be
able to drive a vehicle with less risk, to contribute to the
prevention of accidents related to the consumption of
alcoholic beverages
MATERIALS AND METHODS
Threads
These 60 subjects having 30 control subjects
and 30 male test subjects aged 26 to 37 years with a
mean of 34.3 years investigated for the study. Each
subject has a valid driving license with at least three
years of regular driving without accident and a vehicle at
his disposal at the time of the experiment. 30 other
participants in the experiments were selected to help to
achieve the tasks. These two driving instructors and 28
others have to pass on the obstacles on the path while
they were driving. They are all male, aged 25-54 years,
with an average of 32.7 years. Insurance coverage has
been contracted for all participants in these experiments.
Following the recommendations of Helsinki (2000),
these works were carried out with the authorization of
the Ethics Committee of the training and research unit of
the University bioscience, Felix Houphouet-Boigny,
Abidjan, Cote d'Ivoire (Coast)
Materials
A vehicle brand Toyota Corolla VE 4.80 m
long, 1.695 m wide and 1,385 m high, with a 1095 kg
unladen mass, manual transmission and front-wheel
drive, equipped with dual controls ( pedals) for driving
school; electronic breathalyzer SERES kind E 679; of
scales; alcohol at 96 degree; a hydrometer type
centesimal Gay Lussac, a graduated cylinder of 1,000
milliliters (ml); a paint bucket of 20 kg; and a tape
measure.
Alcoholic solutions
Having assessed the degree (concentration) of
alcohol using the centesimal GAY LUSSAC hydrometer
which indicated 96°, preparing alcoholic solutions was
through dilutions to obtain concentrations sought. These
dilutions are operated in accordance with the formula
Civi = CfVf where, Ci is the initial concentration; Cf is
the final concentration; Vi is the initial volume; and Vf
indicates the final volume.
AHOUNOU et al., 2015
1875 Journal of Research in Biology (2015) 5(7):1874-1884
Journal of Research in Biology (2015) 5(7):1874-1884 1876
AHOUNOU et al., 2015
Thus, from 91 ml of a stock solution of 96 ° alcohol,
contained in a graduated cylinder, obtaining a diluted
solution at 39° was done by adding 224 ml of distilled
water. Similarly, an alcohol solution at 0.5° was prepared
to serve as a placebo control subject.
Methodology
The mass of the subject is taken at the
laboratory. It is used for the experiments the weight is in
the range of [65-70] kg. This restriction makes it possible
to have approximately the same amount of alcohol after
the consumption of the same amount of alcohol, as the
alcohol also depends on the mass of the subject.
Furthermore, the chosen interval [65-70] kg allows to be
certain that all subjects who consumed 125 ml of alcohol
at 39° alcohol are acute. This assurance is given by the
calculation of the alcohol in the words of Widmark
(1932), which is as follows: T = (Volume percentage of
alcohol * * 0.8) / (K * mass of the individual) where as
T is the value of the alcohol; The volume corresponds to
the volume of alcohol consumed by the individual in ml;
The mass of the individual in kg and K is the diffusion
coefficient (K = 0.7 for human and K = 0.6 for women).
Thus, for a quantity of 125 ml of alcohol at 39°, a man of
65 kg gets a BAC of T = 0.86 grams per liter of blood for
a man of 70 kg, the alcohol is T = 0 80 grams per liter of
blood. Similarly, for a quantity of 125 ml at 0.5°, a man
with a mass of 65 to 70 kg gets a BAC of about 0.01
grams per liter of blood.
After raising the mass, each subject must drive the
vehicle on a straight track of 500 meters with a circular
terminal after 80 meters (Figure 1), enabling him to
return to the starting point. The vehicle is parked at the
starting point by an instructor leaving 10 cm margin on
the left and 10 cm to the right of the vehicle. The limit is
marked by a white band made of paint. The driver was
instructed not to overflow the white side bands and
watch out for obstacles that will come during the
journey.
The instructor goes up with the driver, gives him the
speed to reach: it is on average 40 kilometers per hour
(km / h) in the first round 60 km / h in the second round
and 80 km / h in the third round. Any infringement of the
white band is considered an error (lateral error). In
addition, 28 people are arranged along the path (stakes)
at a rate of one in every 20 meters, each with a balloon
(obstacle) in hand. The second instructor gives
instructions to the stakes for the release of obstacles on
the road. Each time, when a person released 10 obstacles
in the path unpredictable for the driver, at a distance of at
least 20 meters from the vehicle it is noted, After the first
three rounds, each about five minutes to consume either
125 ml of alcohol at 39 degrees for testing subjects or
125 ml of alcohol to 0.5 degrees for controls. A
breathalyzer is used to check the dose of alcohol at each
levels (before eating and before each new round of
Conduct).
After drinking alcohol, new driving sessions are held
every five hour (1 hour, 2:00, 3:00, 4:00 and 5:00).
Error Handling
The lateral errors
The total distance traveled by each turn is about
D = 1.080 meters (m). The Mean number of errors is a
function of the vehicle length. Thus, the maximum
number of errors is Em = D / L (L being the length of the
vehicle: 4.80 m). [Thus, the percentage of lateral mean
errors E L is E L = E m E * 100 L = number of errors, 100 /
E L = E m is the number of errors * 100 / (1080/4.80) that
is to say, E L = number of errors * 100/225.]
Front Errors
The total number of barriers released at each
passage is 10, the maximum number of errors is also 10.
Thus, the percentage of frontal errors is: E f = number of
errors * 100/10.
Statistical analysis
Before drinking alcohol and every hour after
ingestion, the control group is compared to the test
AHOUNOU et al., 2015
1877 Journal of Research in Biology (2015) 5(7):1874-1884
A
B
C
Figure 2.
Percentage of lateral errors and expired alcohol content prior to the alcohol (T0), and every hour for 5 hours.
At ‘A’ the speed is 40 km / h;
At ‘B’, the speed is 60 km / h;
And at ‘C’, at a speed is 80 km / h.
Errors of control subjects
Blood Alchol Level Blood Alchol Level
Errors of text subjects
Alchollevel(mg/ld’airexpiringlevel
PercentageoferrorsPercentageoferrorsPercentageoferrors
Alchollevel(mg/ld’airexpiringlevelAlchollevel(mg/ld’airexpiringlevel
Figure 1. Schematic representation of driving terrain.
The vehicle having 1.695 m in width, a space of 10 centimeters is granted each lateral side (for a total of 20 cm)
to chart the way to use.
Arrival
Departure
Round Point
Width of A = Width of B = 1.895
Time (hours)
Time (hours)
Time (hours)
AHOUNOU et al., 2015
Journal of Research in Biology (2015) 5(7):1874-1884 1878
Figure 3.
Percentage of frontal errors and expired alcohol content prior to the alcohol (T0), and every hour for 5 hours.
At ‘A’ the speed is 40 km / h;
At ‘B’, the speed is 60 km / h;
And at ‘C’, the speed is 80 km / h.
A
B
C
Errors of control subjects
Blood Alchol Level Blood Alchol Level
Errors of text subjects
Alchollevel(mg/ld’airexpiringlevel
Percentageoferrors
PercentageoferrorsPercentageoferrors
Time (hours)
Time (hours)
Time (hours)
group. The character is considered the number of errors
whose details were exposed above. This is to analyze the
behavior of each group together through their
performances and to compare them. One should check
the significance of any differences between the errors
obtained in each group, that is to say whether in each
event the performance difference between the two groups
given is significant or not. To do this, an analysis of
variance (ANOVA) (univariate), using the software
Statistica 10.0, to make comparisons, every hour.
Probability (p) of 0.05 was considered as the significance
limit. Thus, if "p" is less than or equal to 0.05, then the
difference between the compared variables is significant.
By cons, if "p" is greater than 0.05, then the difference
between the two compared variables is not significant.
RESULTS
Errors side
Before alcohol consumption and every hour
after alcohol, the group of test subjects were compared to
the group of control subjects. Also, they have all been
assessed taking into account the speed limits imposed by
the instructor. These are of 40 km / h, 60 km / h and 80
km / h. To recall, the number of errors committed by the
subject is the determining factor in this assessment.
Thus, it appears from these investigations, the following
results:
A 40 km/h speed in structed, before
consumption of alcohol (T0) showed identical
performence in, the control group and those for the
consumption of alcohol, (Figure 2A). In this respect, the
comparison between the witnesses and the subjects to
consume alcohol gives F (1.58) = 0.52 and p = 0.47. This
difference is not significant. An hour after the
consumption of alcohol, the comparison between the
groups of subjects gives F (1.58) = 2649.6 and
p <0.0001. The difference is very significant. Two hours
after the consumption of alcohol, the comparison
between the control group and the test group shows
difference in the range of F (1.58) = 2524 p <0.0001. The
difference is very significant. In the third hour to the fifth
hour, no difference between the two groups is
significant. The results are as follows for three hours: F
(1.58) = 2.46 and p = 0.12; for four hours: F (1.58) =
1.04 and p = 0.31 and for five hours: 1.04 and p = 0.31
and for five hours: F (1, 58) = 0.82 and p = 0.37.
In a test of 60 km / h, before consumption of
alcohol the control group (T0) and those for the
consumption of alcohol, have nearly identical
performance (Figure 2B). Thus, the comparison between
the witnesses and the subjects to consume alcohol gives
F (1.58) = 0.89 at p = 0.35. This difference is not
significant. An hour after the consumption of alcohol, the
comparison between the groups of subjects are
significant and gives F (1.58) = 5069 at p <0.0001. Two
hours after the consumption of alcohol, the comparison
between the control group and the test group gives F
(1.58) = 848.39 and p<0.0001. The difference is very
significant. From the third hour to the fifth hour, no
difference between the two groups are significant. Found
to be the data obtained for three hours were as follows: F
(1.58) = 2.13 at p = 0.15; for four hours: F (1.58) = 1.20
at p = 0.28 for five hours: F (1.58) = 1.25 at p = 0.27. A
80 km / h. Before the consumption of alcohol (T0), the
control group and those for the consumption of alcohol,
have nearly identical performance (Figure 2C). Also, the
comparison between the witnesses and the subjects to
consume alcohol is as follows F (1.58) = 1.80 and p =
0.18. This difference is not significant. An hour after the
consumption of alcohol, the comparison between the
groups of subjects shows F (1.58) = 1995.7 at
p <0.0001. This difference is very significant. Two hours
after the consumption of alcohol, the comparison
between the control group and the test group showed F
(1.58) = 2946.7 and p <0.0001. This difference is also
very significant. Similarly, three hours after alcohol
intake, the performance difference between the two
groups gives F (1.58) = 15.52 at p = 0.0002. This
1879 Journal of Research in Biology (2015) 5(7):1874-1884
AHOUNOU et al., 2015
difference is also significant. Four hours after the
consumption of alcohol, the comparison between the
control group and the test group showed F (1.58) = 9.92
at p = 0.0026. This difference is also found to be
significant. At the fifth time, the two groups did not
showed any significant difference. Indeed obtained: F
(1.58) = 1.58 at p = 0.21. as a measure of this difference.
Front errors
At 40 km / h, before consumption of alcohol
(T0), the control group and those for the consumption of
alcohol, have almost similar performance (Figure 3A). In
this respect, the comparison between the witnesses and
the subjects to consume alcohol gives F (1.58) = 1.91
and p = 0.17. This difference is not significant. An hour
after the consumption of alcohol, the comparison
between the group of subjects gives F (1.58) = 170.29 at
p <0.0001. The difference is very significant. In the
second hour to the fifth hour, no difference between the
two groups is significant. For two hours: F (1.58) = 1.22
at p = 0.27 for three hours: F (1.58) = 0.02 at p = 0.88;
for four hours: F (1.58) = 0.24 at p = 0.62 and for five
hours: F (1.58) = 2.50 at p = 0.12 Obtained successively.
At 60 km / h, before consumption of alcohol
(T0), the control group and those for the consumption of
alcohol, have nearly identical performance (Figure 3B).
In this respect, the comparison between the witnesses
and the subjects to consume alcohol gives F (1.58) =
1.05 at p = 0.31. This difference is not significant. An
hour after the consumption of alcohol, the comparison
between the group of subjects give F (1.58) = 137.21 at
p <0.0001. in the difference is very significant. The
second hour to the fifth hour, no difference between the
two groups as significant. For two hours: F (1.58) = 0.79
at p = 0.39; for three hours: F (1.58) = 2.97 at p = 0.09;
for four hours: F (1.58) = 0.06 at p = 0.80 for five hours:
F (1.58) = 2.04 at p = 0.16 were obtained respectively.
At 80 km / h before the consumption of alcohol
(T0), the control group and those for the consumption of
alcohol, have almost similar performance (Figure 3C). In
this respect, the comparison between the witnesses and
the subjects to consume alcohol gives F (1.58) = 0.94 at
p = 0.33. This difference is not significant. An hour after
the consumption of alcohol, the comparison between the
groups of subjects gives F (1.58) = 492.95 at
p <0.0001. The difference is very significant. Two hours
after the consumption of alcohol, the comparison
between the control group and the test group gives F
(1.58) = 9.35 at p = 0.003. The difference is significant.
Similarly, three hours after alcohol intake, the
performance difference between the two group gives F
(1.58) = 9.04 at p = 0.004. This difference is also
significant. Four hours after the consumption of alcohol,
the comparison between the control group and the test
group gives F (1.58) = 17.13 at p = 0.0001. This
difference is also significant. At the fifth time, both the
two groups did not showed any significant difference.
Indeed obtained: F (1.58) = 0.54 at p = 0.46.
DISCUSSION
This study involved male subjects of weight
between 65 and 70 kg. The need to use a mass range is
because body size is involved in the distribution of
alcohol in the body. According to some studies, the
amount of fat influences the metabolism of the alcohol
(Jones et al., 1997). Thus, if one relies on the dose to
give the quantities in function inrespective of the mass of
the individual, it will appear in misinterpretations
between the high mass of people and other lighter
persons. Moreover, the choice of male is recommended
(Ettorre, 2004) because of the fragility of women to
alcohol. Indeed, the hormonal changes caused by the
menstrual cycle, does not allow to draw effective
conclusions in case of group comparisons (Perry, 2004).
Also, a placebo was used by need for all investigations in
the same psychological experience conditions. Indeed,
there also exists an effect of alcohol consumption
Expectation (O'Boyle et al., 1994). In other words, the
behavior of a person is changed differently depending on
Journal of Research in Biology (2015) 5(7):1874-1884 1880
AHOUNOU et al., 2015
whether it knows whether or not it absorbs alcohol.
This study compared the performance of
control subjects who are the placebo to the test subjects
consuming alcohol. If it is accepted that the minimum
dose of alcohol for an observable effect on human
behavior could be below 0.5 g / l of blood (Oscar-
Berman and Marinkovic, 2007). No significant in the
difference performance before consumption by the test
subjects showed that with a dose of about 0.01 g / l of
blood for control subjects, alcohol does not significantly
influences behavior tested. For cons, the 125 ml of 39°
alcohol consumed by the test subjects alter their blood
alcohol within a range of [0.80 to 0.86] g / l of blood.
This proves that the alcohol test subjects have showed an
acute dose of alcohol since the alcohol levels to achieve
an acute consumption is 0.8 g / l of blood (INSERM,
2001).
Furthermore, depending on the speed (40 km /
h or 60 km / h or 80 km / h) required by the instructor,
the errors of all subjects were evaluated. The results
obtained before alcohol consumption by the test subjects
(T0), the errors of these latter pass from 8% to 10% then
19% respectively for the 40 km / h, 60 km / h and 80
km / h. Likewise the errors of the control subjects
increased from 6% to 12% then 22% respectively for the
40 km / h, 60 km / h and 80 km / h. These results clearly
showed that the number of errors augment with speed.
Thus, this observation is in agreement with the data
collected by other authors (Finch et al., 1994). In fact,
these authors have demonstrated that the probability of
an accident is proportional to the square of the speed. In
addition they point out that for every increase of 1 km /
h, the incidence of accidents increased by 3%. In the
same way, some authors conclude that whenever average
speed gets decreased (1.6 km / h), the number of accident
decreases accidents decreases by at least 6% on urban
roads with heavy traffic (Taylor et al., 2002). In addition,
in a meta-analysis of 36 studies on speed limit changes
revealed that above 50 km / h, accidents were decreased
by 2% when the average speed is reduced by 1 km / h
( Elvik et al., 1997). Also, other authors showed that in
rural areas where the speed limit is 60 km / h, the relative
risk of accident is at least twice at each speed increase of
5 km / h above 60 km / h (McLean and Kloeden, 2002).
So when alertness levels are not altered, it is known that
a high-speed, only complicates the many motor
coordination need to involve or to avoid danger when it
appears more or less suddenly.
At 40 km / h and 60 km / h the difference in
performance between the two groups (control and test) is
significant at one hour and two hours after drinking,
regarding the lateral errors while it is significant only at
one hour after alcohol consumption for the front errors.
Therefore, it is certain that there are more errors than
lateral end errors. Thus, after an alcohol, if the
elongation of reaction time (West et al., 1993), could
explain the end errors, the narrowing of the visual field
(Mura, 1999) would cause side errors. However, the risks
of the alcohol-related accidents are mainly due to its
disinhibiting effect which results in the behavior change
and risk taking (Deery and Love, 1996). Indeed, as
revealed by the National Institute (in France) of Health
and Medical Research (INSERM, 2001), when
volunteers perform a cognitive task with a BAC of about
0.50 g / l, they proceed more quickly than fasting but
with a significant increase in the number of errors; these
results oppose alcohol with benzodiazepines recent
slowing the contrary and the execution of the task, but
without increasing the number of errors (Girre et al.,
1991). It has been shown that errors in were similar and
repetitive errors to those who observed from the front
with (Lyvers and Maltzman 1991). The hypothesis of a
specific effect of alcohol on the frontal functions is also
suggested by a number of clinical data (Peterson et al.,
1990) and brain imaging (Sano et al. 1993).
An hour after the consumption of two groups
of subjects, the test subjects make many more errors than
controls inrespective of the speed. This observation
AHOUNOU et al., 2015
1881 Journal of Research in Biology (2015) 5(7):1874-1884
demonstrates a transient disorder of vigilance levels, an
hour after drinking. The existence of the effects of
alcohol one hour after consumption is explained by the
work of some authors (Ben Amar, 2007; A pfelbaum et
al., 2009). In fact, these authors show that the alcohol
reaches its maximum diffusion between thirty minutes
and one hour. This rapid spread mainly concerns the
most irrigated areas like the brain which is the seat of the
attention (Ruitenberg et al, 2005).
Two hours after alcohol consumption, the
performance difference between the two groups was
significant for lateral errors, while for the front errors the
difference is significant only at 80 km / h. This result
showed a continuing effect of alcohol on vigilance in the
second hour after alcohol. Indeed, having peaked in the
first hour, the metabolism of alcohol gradually reduces
its effect during the next hour. Since the work of
Widmark (1932), an estimated value of the degradation
of ethanol at a rate of 0.15 g / l / hr. Thus, from the
second hour, the blood alcohol test subjects ranging from
[0.65 to 0.71] g / l, it is possible to say that the blood
alcohol limit of 0.8 g official / l blood is a problem for
safety in driving.
From the third to the fourth hour after alcohol
consumption, the difference is significant for the lateral
and front mistakes to 80 km / h. In this time interval the
BAC is between [0.35 to 0.56] g / l. Also, at the fifth
hour, the performance difference is not significant
regardless of the speed and the type of error considered.
With an estimated blood alcohol concentration to 0.30 g /
l of blood, this result indicates a return to a normal level
of vigilance hours after alcohol consumption. Indeed, a
statistical study indicates that accidents become
numerous from 0.4 g / l of blood alchol itself (Campton
et al., 2002). Furthermore, the results of analyzes of
studies concluded that there is no lower threshold below
which the impairment does not exist for
alcohol" (Moskowitz and Fiorentino 2000). Indeed, some
authors were able to identify cognitive changes for lower
blood alcohol concentrations of 0.50 g / l, including a
drop in maintaining vigilance when it is measured from
space stimuli (Koelega 1995). These results raise the
question of acceptable blood alcohol limit when
performing cognitive tasks such as driving vehicles
(INSERM, 2001).
CONCLUSION
This work was initiated to assist in determining the
minimum alcohol to which we might be able to drive a
vehicle without a major risk of causing accident. For a
driving test, the results of this studyed allowed to
remember that the number of errors increases with speed.
Furthermore, due to the decline in vigilance by the
effects of alcohol, leading to a narrowing of the visual
field, the side errors are more frequent than frontal
errors. The metabolism of alcohol allows a return to a
normal alcohol function of time. Also, this study shows
that a lower blood alcohol or equal to 0.3 g / l of blood
would be more appropriate to reduce accidents related to
alcohol consumption. Thus, the legal limit of 0.8 g / l of
blood should be reviewed.
REFERENCES
Alvarez FJ, Del Rio MC. (2003). Response to
Ramaekers: pitfalls in estimating drug related crash risk.
Trends in Pharmacological Sciences, 24(3):115, .
Pfelbaum AM, Romon M, Dubus M. (2009).
Diététique et Nutrition, 7th ed. Elsevier Masson, Paris.
Ben-Amar M. (2007). Les psychotropes criminogènes.
Presses Univ. Montréal, 40(1):11-30.
Brady JE, Li G (2013). Prevalence of alcohol and other
drugs in fatally injured drivers. Addiction, 108(1):104–
114, .
Campton RP, Blomberg RD, Moscowitz H, Burns M,
Peek RC, Fiorentino D. (2002). Crash risk of alcohol
impaired driving. In: Mayhew DR, Dussault C, eds.
AHOUNOU et al., 2015
Journal of Research in Biology (2015) 5(7):1874-1884 1882
Proceedings of the 16th International Conference on
Alcohol, Drugs and Traffic Safety, Montreal, 4–9 August
2002. Montreal, Société de l’assurance automobile du
Québec, 39–44.
Deery HA, Love AW. (1996). The effect of a moderate
dose of alcohol on the traffic hazard perception profile of
young drink-drivers. Addiction, 91(6):815-827.
Dupont RL, Voas RB, Walsh JM, Shea C, Talpins
SK, Neil MM. (2012). The need for drugged driving per
se laws: a commentary. Traffic Injury Prevention, 13
(1):31–42.
Elvik R, Mysen AB, Vaa T. (1997). Trafi
kksikkerhetshåndbok, tredje utgave [Handbook of traffi c
safety, 3e edition, Oslo (Norvège), Institute of Transport
Economics.
Ettorre E. (2004). Revisioning women and drug use:
gender sensitivity, embodiment and reducing harm.
International Journal of Drug Policy, 15(5-6):327-335.
Finch DJ, Kompfner P, Lockwood CR, Maycock G.
(1994). Speed, speed limits and accidents. Crowthorne
(Royaume-Uni), Transport Research Laboratory, Project
Report 58.
Girre C, Hirschhorn M, Bertaux L, Palombo S,
Fournier PE. (1991). Comparison of performance of
healthy volunteers given prazepam alone or combined
with ethanol relation to drug plasma concentrations.
International Clinical Psychopharmacology, 6(4):227-
238.
[INSERM] Institut National de la Santé et de la
Recherche Médicale. (2001). Alcool : effets sur la santé.
Expertise collective ; France, Septembre, 119-129 ; 267-
273.
Jones AW, Jönsson KA, Kechagias S. (1997). Effect of
high-fat, high-protein, and highcarbohydrate meals on
the pharmacokinetics of a small dose of alcohol. British
Journal of Clinical Pharmacology, 44(6):521-526.
Kelly E, Darke S, Ross J. (2004). A review of drug use
and driving: epidemiology, impairment, risk factors and
risk perceptions. Drug and Alcohol Review, 23(3):319–
344.
Koelega HS. (1995). Alcohol and vigilance
performance: a review. Psychopharmacology, 118
(3):233-249.
Lyvers MF, Maltzman I. (1991). Selective effects of
alcohol on Wisconsin card sorting test performance.
British Journal of Addiction, 86(4):399-407.
McLean J, Kloeden C. (2002). Alcohol, travelling
speed and the risk of crash involvement. In: Mayhew
DR, Dussault C, eds. Actes de la 16e Conférence
internationale sur l’alcool, les drogues et la sécurité
routière, Montréal, 4–9 août 2002. Montréal (Canada),
Société de l’assurance automobile du Québec, 73–79.
Moskowitz HA, Fiorentino D. (2000). A review of the
literature on the effects of low doses of alcohol on
driving-related skills. Washington, DC: US National
Highway Traffic Safety Administration, Report n°. DOT
HS 809 028, April
Mura P. (1999). Alcool, médicaments, stupéfiants et
conduite automobile. ed. Elsevier Paris.
O’Boyle DJ, Binns AS, Sumner JJ. (1994). On the
efficacy of alcohol placebos in inducing feelings of
intoxication. Psychopharmacology, 115(1-2):229-236.
[OMS] Organisation Mondiale de la Santé. (2006).
Problèmes de santé publique imputables à l'abus d'alcool.
Cinquante-septième session du bureau régional du
pacifique occidental ; point 12; 18 au 22 septembre.
Oscar-Berman M, Marinkovic K. (2007). Alcohol:
Effects on neurobehavioral functions and the brain.
AHOUNOU et al., 2015
1883 Journal of Research in Biology (2015) 5(7):1874
Neuropsychol Review, 17(3):239-257.
Perry BL. (2004). Premenstrual symptomatology and
alcohol consumption. Journal of Studies on Alcohol and
Drugs, 65(4):464-468.
Peterson JB, Rothfleisch J, Zelazo PD, Pihl RO.
(1990). Acute alcohol intoxication and cognitive
functioning. Journal of Studies on Alcohol and Drugs, 51
(2):114-122.
Ruitenberg A, Den Heijer T, Bakker SL, Van Swieten
JC, Koudstaal PJ, Hofman A, Breteler MM. (2005).
Cerebral hypoperfusion and clinical onset of dementia:
the Rotterdam Study. Annals of Neurology, 57(6):789-
794.
Sano M, Wendt PE, Wirsen A, Stenberg G, Risberg J,
Ingvar DH. (1993). Acute effects of alcohol on regional
cerebral blood flow in man. Journal of Studies on
Alcohol and Drug, 54(3):369-376.
Taylor MC, Baruya A, Kennedy JV. (2002). The
relationship between speed and accidents on rural single
-carriageway roads. Crowthorne (Royaume-Uni),
Transport Research Laboratory, Rapport 511 du TR.
West R, Wilding J, French D, Kemp R, Irving A.
(1993). Effect of low and moderate doses of alcohol on
driving hazard perception latency and driving speed.
Addiction, 88(4):527-532.
Widmark EMP. (1932). Die theorischen Grundladen
und die praktische Verwendarbeit der
gerichtlichmedizinischen Alkohol Bestimmung. Fortsch
Naturw Forshung, 11:140.
Yao KM, Camara PA, Adou KFJB. (2012). Types de
boissons alcooliques consommées en Côte d’Ivoire.
Préférence et consommation effective. Alcoologie et
Addictologie, 34(3):185-193.
AHOUNOU et al., 2015
Journal of Research in Biology (2015) 5(7):1874-1884 1884
Submit your articles online at www.jresearchbiology.com
Advantages
Easy online submission
Complete Peer review
Affordable Charges
Quick processing
Extensive indexing
You retain your copyright
submit@jresearchbiology.com
www.jresearchbiology.com/Submit.php

More Related Content

Similar to Influence of alcohol on the vigilance levels for a driving test

Evaluation of Haematological, Hepatic and Renal Function of Auto Drivers in T...
Evaluation of Haematological, Hepatic and Renal Function of Auto Drivers in T...Evaluation of Haematological, Hepatic and Renal Function of Auto Drivers in T...
Evaluation of Haematological, Hepatic and Renal Function of Auto Drivers in T...
IOSRJPBS
 
Presentation mekong conference
Presentation mekong conferencePresentation mekong conference
Presentation mekong conference
BinhThang
 
Comparative Haematology and Urinary Analysis of Passive Inhalers of Petrol Fu...
Comparative Haematology and Urinary Analysis of Passive Inhalers of Petrol Fu...Comparative Haematology and Urinary Analysis of Passive Inhalers of Petrol Fu...
Comparative Haematology and Urinary Analysis of Passive Inhalers of Petrol Fu...
Erhunmwunsee Osazee
 
Aatoxinconcentrationsinchiliesvarydepending.pdf
Aatoxinconcentrationsinchiliesvarydepending.pdfAatoxinconcentrationsinchiliesvarydepending.pdf
Aatoxinconcentrationsinchiliesvarydepending.pdf
Subburamu Karthikeyan
 

Similar to Influence of alcohol on the vigilance levels for a driving test (20)

Analysis of organic acetates in e-vapor products by GC-MS/MS
Analysis of organic acetates in e-vapor products by GC-MS/MSAnalysis of organic acetates in e-vapor products by GC-MS/MS
Analysis of organic acetates in e-vapor products by GC-MS/MS
 
Determination of Ethanol and Isopropanol Content in Hand Sanitizers Using Nit...
Determination of Ethanol and Isopropanol Content in Hand Sanitizers Using Nit...Determination of Ethanol and Isopropanol Content in Hand Sanitizers Using Nit...
Determination of Ethanol and Isopropanol Content in Hand Sanitizers Using Nit...
 
Bio toilets presentation
Bio toilets presentation Bio toilets presentation
Bio toilets presentation
 
The Prevalence of Alcohol Consumption among Commercial Drivers in Uyo Local G...
The Prevalence of Alcohol Consumption among Commercial Drivers in Uyo Local G...The Prevalence of Alcohol Consumption among Commercial Drivers in Uyo Local G...
The Prevalence of Alcohol Consumption among Commercial Drivers in Uyo Local G...
 
Evaluation of Haematological, Hepatic and Renal Function of Auto Drivers in T...
Evaluation of Haematological, Hepatic and Renal Function of Auto Drivers in T...Evaluation of Haematological, Hepatic and Renal Function of Auto Drivers in T...
Evaluation of Haematological, Hepatic and Renal Function of Auto Drivers in T...
 
Presentation mekong conference
Presentation mekong conferencePresentation mekong conference
Presentation mekong conference
 
Comparative Haematology and Urinary Analysis of Passive Inhalers of Petrol Fu...
Comparative Haematology and Urinary Analysis of Passive Inhalers of Petrol Fu...Comparative Haematology and Urinary Analysis of Passive Inhalers of Petrol Fu...
Comparative Haematology and Urinary Analysis of Passive Inhalers of Petrol Fu...
 
1._1-8
1._1-81._1-8
1._1-8
 
cel-report
cel-reportcel-report
cel-report
 
Msc thesis defence power point
Msc thesis defence power pointMsc thesis defence power point
Msc thesis defence power point
 
Aatoxinconcentrationsinchiliesvarydepending.pdf
Aatoxinconcentrationsinchiliesvarydepending.pdfAatoxinconcentrationsinchiliesvarydepending.pdf
Aatoxinconcentrationsinchiliesvarydepending.pdf
 
cha_6_-_toxicologia y visión forense.ppt
cha_6_-_toxicologia y visión forense.pptcha_6_-_toxicologia y visión forense.ppt
cha_6_-_toxicologia y visión forense.ppt
 
Ch 6 -_toxicology
Ch 6 -_toxicologyCh 6 -_toxicology
Ch 6 -_toxicology
 
Analysis of alcohol
Analysis of alcoholAnalysis of alcohol
Analysis of alcohol
 
Evap 135-cxp gfn2017-evap-poster-170615
Evap 135-cxp gfn2017-evap-poster-170615Evap 135-cxp gfn2017-evap-poster-170615
Evap 135-cxp gfn2017-evap-poster-170615
 
Enrichment of heavy oxygen isotopes
Enrichment of heavy oxygen isotopesEnrichment of heavy oxygen isotopes
Enrichment of heavy oxygen isotopes
 
Dr konstantinos farsalinos the royal society 11 13
Dr konstantinos farsalinos the royal society 11 13Dr konstantinos farsalinos the royal society 11 13
Dr konstantinos farsalinos the royal society 11 13
 
Research on Safety of Electronic Cigarettes - Dr. Konstantinos Farsalinos
Research on Safety of Electronic Cigarettes - Dr. Konstantinos FarsalinosResearch on Safety of Electronic Cigarettes - Dr. Konstantinos Farsalinos
Research on Safety of Electronic Cigarettes - Dr. Konstantinos Farsalinos
 
M.P. Kelly Law - Issues with Breath Testing
M.P. Kelly Law - Issues with Breath TestingM.P. Kelly Law - Issues with Breath Testing
M.P. Kelly Law - Issues with Breath Testing
 
environmental life cycle assessment.pptx
environmental life cycle assessment.pptxenvironmental life cycle assessment.pptx
environmental life cycle assessment.pptx
 

More from Journal of Research in Biology

Effect of sunflower extract to control weeds
Effect of sunflower extract to control weedsEffect of sunflower extract to control weeds
Effect of sunflower extract to control weeds
Journal of Research in Biology
 
Community structure of planktonic copepods in Hendijan harbor (NW Persian Gulf)
Community structure of planktonic copepods in Hendijan harbor (NW Persian Gulf)Community structure of planktonic copepods in Hendijan harbor (NW Persian Gulf)
Community structure of planktonic copepods in Hendijan harbor (NW Persian Gulf)
Journal of Research in Biology
 
Evaluating the effect of humic acid on the yield of three varieties of potato...
Evaluating the effect of humic acid on the yield of three varieties of potato...Evaluating the effect of humic acid on the yield of three varieties of potato...
Evaluating the effect of humic acid on the yield of three varieties of potato...
Journal of Research in Biology
 
The effect of regular home visits on the development indices of low birth wei...
The effect of regular home visits on the development indices of low birth wei...The effect of regular home visits on the development indices of low birth wei...
The effect of regular home visits on the development indices of low birth wei...
Journal of Research in Biology
 
Determination of heavy metal pollution in water, soil and plants of vegetable...
Determination of heavy metal pollution in water, soil and plants of vegetable...Determination of heavy metal pollution in water, soil and plants of vegetable...
Determination of heavy metal pollution in water, soil and plants of vegetable...
Journal of Research in Biology
 
Clay mineralogy and sediment grain-size variations as climatic signals in sou...
Clay mineralogy and sediment grain-size variations as climatic signals in sou...Clay mineralogy and sediment grain-size variations as climatic signals in sou...
Clay mineralogy and sediment grain-size variations as climatic signals in sou...
Journal of Research in Biology
 
Biological activity of biobras and Pectimorf-6 in each of the phases of micro...
Biological activity of biobras and Pectimorf-6 in each of the phases of micro...Biological activity of biobras and Pectimorf-6 in each of the phases of micro...
Biological activity of biobras and Pectimorf-6 in each of the phases of micro...
Journal of Research in Biology
 

More from Journal of Research in Biology (20)

Effect of sunflower extract to control weeds
Effect of sunflower extract to control weedsEffect of sunflower extract to control weeds
Effect of sunflower extract to control weeds
 
Survey of the consumption of okra (Abelmoschus esculentus and Abelmoschus cai...
Survey of the consumption of okra (Abelmoschus esculentus and Abelmoschus cai...Survey of the consumption of okra (Abelmoschus esculentus and Abelmoschus cai...
Survey of the consumption of okra (Abelmoschus esculentus and Abelmoschus cai...
 
Effect of vitamins on digestive enzyme activities and growth performance of s...
Effect of vitamins on digestive enzyme activities and growth performance of s...Effect of vitamins on digestive enzyme activities and growth performance of s...
Effect of vitamins on digestive enzyme activities and growth performance of s...
 
Examining the effect of physical, chemical and biological harmful factors on ...
Examining the effect of physical, chemical and biological harmful factors on ...Examining the effect of physical, chemical and biological harmful factors on ...
Examining the effect of physical, chemical and biological harmful factors on ...
 
Prevalence of Armigeres obturbans in the rural areas around Rajkot city, Guja...
Prevalence of Armigeres obturbans in the rural areas around Rajkot city, Guja...Prevalence of Armigeres obturbans in the rural areas around Rajkot city, Guja...
Prevalence of Armigeres obturbans in the rural areas around Rajkot city, Guja...
 
Two new species of Myxobolus (Myxozoa: Myxosporea) parasites of Barbus callip...
Two new species of Myxobolus (Myxozoa: Myxosporea) parasites of Barbus callip...Two new species of Myxobolus (Myxozoa: Myxosporea) parasites of Barbus callip...
Two new species of Myxobolus (Myxozoa: Myxosporea) parasites of Barbus callip...
 
Comparative evaluation of hyaluronic acid production by Streptococcus thermop...
Comparative evaluation of hyaluronic acid production by Streptococcus thermop...Comparative evaluation of hyaluronic acid production by Streptococcus thermop...
Comparative evaluation of hyaluronic acid production by Streptococcus thermop...
 
Community structure of planktonic copepods in Hendijan harbor (NW Persian Gulf)
Community structure of planktonic copepods in Hendijan harbor (NW Persian Gulf)Community structure of planktonic copepods in Hendijan harbor (NW Persian Gulf)
Community structure of planktonic copepods in Hendijan harbor (NW Persian Gulf)
 
Investigation of the women pregnancy healthy status and behaviors in Eastern-...
Investigation of the women pregnancy healthy status and behaviors in Eastern-...Investigation of the women pregnancy healthy status and behaviors in Eastern-...
Investigation of the women pregnancy healthy status and behaviors in Eastern-...
 
Evaluating the effect of humic acid on the yield of three varieties of potato...
Evaluating the effect of humic acid on the yield of three varieties of potato...Evaluating the effect of humic acid on the yield of three varieties of potato...
Evaluating the effect of humic acid on the yield of three varieties of potato...
 
The investigation of the students' attitude and consciousness degree regardin...
The investigation of the students' attitude and consciousness degree regardin...The investigation of the students' attitude and consciousness degree regardin...
The investigation of the students' attitude and consciousness degree regardin...
 
The effect of regular home visits on the development indices of low birth wei...
The effect of regular home visits on the development indices of low birth wei...The effect of regular home visits on the development indices of low birth wei...
The effect of regular home visits on the development indices of low birth wei...
 
Evaluation of anti-bacterial potential of protein isolated from the muscle of...
Evaluation of anti-bacterial potential of protein isolated from the muscle of...Evaluation of anti-bacterial potential of protein isolated from the muscle of...
Evaluation of anti-bacterial potential of protein isolated from the muscle of...
 
Determination of heavy metal pollution in water, soil and plants of vegetable...
Determination of heavy metal pollution in water, soil and plants of vegetable...Determination of heavy metal pollution in water, soil and plants of vegetable...
Determination of heavy metal pollution in water, soil and plants of vegetable...
 
Clay mineralogy and sediment grain-size variations as climatic signals in sou...
Clay mineralogy and sediment grain-size variations as climatic signals in sou...Clay mineralogy and sediment grain-size variations as climatic signals in sou...
Clay mineralogy and sediment grain-size variations as climatic signals in sou...
 
Geopolitical and environmental study of artificial islands in the Persian Gul...
Geopolitical and environmental study of artificial islands in the Persian Gul...Geopolitical and environmental study of artificial islands in the Persian Gul...
Geopolitical and environmental study of artificial islands in the Persian Gul...
 
Biological activity of biobras and Pectimorf-6 in each of the phases of micro...
Biological activity of biobras and Pectimorf-6 in each of the phases of micro...Biological activity of biobras and Pectimorf-6 in each of the phases of micro...
Biological activity of biobras and Pectimorf-6 in each of the phases of micro...
 
Diversity and use pattern of ethno-medicinal plants of Kumaun Himalaya
Diversity and use pattern of ethno-medicinal plants of Kumaun HimalayaDiversity and use pattern of ethno-medicinal plants of Kumaun Himalaya
Diversity and use pattern of ethno-medicinal plants of Kumaun Himalaya
 
Foliar application of seaweed extracts as a means for enhancing the yield and...
Foliar application of seaweed extracts as a means for enhancing the yield and...Foliar application of seaweed extracts as a means for enhancing the yield and...
Foliar application of seaweed extracts as a means for enhancing the yield and...
 
Effect of eight-week aerobic exercises in 10 to 12 years old overweight girls
Effect of eight-week aerobic exercises in 10 to 12 years old overweight girlsEffect of eight-week aerobic exercises in 10 to 12 years old overweight girls
Effect of eight-week aerobic exercises in 10 to 12 years old overweight girls
 

Recently uploaded

The importance of continents, oceans and plate tectonics for the evolution of...
The importance of continents, oceans and plate tectonics for the evolution of...The importance of continents, oceans and plate tectonics for the evolution of...
The importance of continents, oceans and plate tectonics for the evolution of...
Sérgio Sacani
 
Mammalian Pineal Body Structure and Also Functions
Mammalian Pineal Body Structure and Also FunctionsMammalian Pineal Body Structure and Also Functions
Mammalian Pineal Body Structure and Also Functions
YOGESH DOGRA
 
extra-chromosomal-inheritance[1].pptx.pdfpdf
extra-chromosomal-inheritance[1].pptx.pdfpdfextra-chromosomal-inheritance[1].pptx.pdfpdf
extra-chromosomal-inheritance[1].pptx.pdfpdf
DiyaBiswas10
 
RNA INTERFERENCE: UNRAVELING GENETIC SILENCING
RNA INTERFERENCE: UNRAVELING GENETIC SILENCINGRNA INTERFERENCE: UNRAVELING GENETIC SILENCING
RNA INTERFERENCE: UNRAVELING GENETIC SILENCING
AADYARAJPANDEY1
 
Penicillin...........................pptx
Penicillin...........................pptxPenicillin...........................pptx
Penicillin...........................pptx
Cherry
 
THYROID-PARATHYROID medical surgical nursing
THYROID-PARATHYROID medical surgical nursingTHYROID-PARATHYROID medical surgical nursing
THYROID-PARATHYROID medical surgical nursing
Jocelyn Atis
 
Cancer cell metabolism: special Reference to Lactate Pathway
Cancer cell metabolism: special Reference to Lactate PathwayCancer cell metabolism: special Reference to Lactate Pathway
Cancer cell metabolism: special Reference to Lactate Pathway
AADYARAJPANDEY1
 
Anemia_ different types_causes_ conditions
Anemia_ different types_causes_ conditionsAnemia_ different types_causes_ conditions
Anemia_ different types_causes_ conditions
muralinath2
 

Recently uploaded (20)

PRESENTATION ABOUT PRINCIPLE OF COSMATIC EVALUATION
PRESENTATION ABOUT PRINCIPLE OF COSMATIC EVALUATIONPRESENTATION ABOUT PRINCIPLE OF COSMATIC EVALUATION
PRESENTATION ABOUT PRINCIPLE OF COSMATIC EVALUATION
 
insect taxonomy importance systematics and classification
insect taxonomy importance systematics and classificationinsect taxonomy importance systematics and classification
insect taxonomy importance systematics and classification
 
The importance of continents, oceans and plate tectonics for the evolution of...
The importance of continents, oceans and plate tectonics for the evolution of...The importance of continents, oceans and plate tectonics for the evolution of...
The importance of continents, oceans and plate tectonics for the evolution of...
 
Mammalian Pineal Body Structure and Also Functions
Mammalian Pineal Body Structure and Also FunctionsMammalian Pineal Body Structure and Also Functions
Mammalian Pineal Body Structure and Also Functions
 
extra-chromosomal-inheritance[1].pptx.pdfpdf
extra-chromosomal-inheritance[1].pptx.pdfpdfextra-chromosomal-inheritance[1].pptx.pdfpdf
extra-chromosomal-inheritance[1].pptx.pdfpdf
 
RNA INTERFERENCE: UNRAVELING GENETIC SILENCING
RNA INTERFERENCE: UNRAVELING GENETIC SILENCINGRNA INTERFERENCE: UNRAVELING GENETIC SILENCING
RNA INTERFERENCE: UNRAVELING GENETIC SILENCING
 
Lab report on liquid viscosity of glycerin
Lab report on liquid viscosity of glycerinLab report on liquid viscosity of glycerin
Lab report on liquid viscosity of glycerin
 
Penicillin...........................pptx
Penicillin...........................pptxPenicillin...........................pptx
Penicillin...........................pptx
 
GBSN - Biochemistry (Unit 5) Chemistry of Lipids
GBSN - Biochemistry (Unit 5) Chemistry of LipidsGBSN - Biochemistry (Unit 5) Chemistry of Lipids
GBSN - Biochemistry (Unit 5) Chemistry of Lipids
 
THYROID-PARATHYROID medical surgical nursing
THYROID-PARATHYROID medical surgical nursingTHYROID-PARATHYROID medical surgical nursing
THYROID-PARATHYROID medical surgical nursing
 
GLOBAL AND LOCAL SCENARIO OF FOOD AND NUTRITION.pptx
GLOBAL AND LOCAL SCENARIO OF FOOD AND NUTRITION.pptxGLOBAL AND LOCAL SCENARIO OF FOOD AND NUTRITION.pptx
GLOBAL AND LOCAL SCENARIO OF FOOD AND NUTRITION.pptx
 
Comparative structure of adrenal gland in vertebrates
Comparative structure of adrenal gland in vertebratesComparative structure of adrenal gland in vertebrates
Comparative structure of adrenal gland in vertebrates
 
A Giant Impact Origin for the First Subduction on Earth
A Giant Impact Origin for the First Subduction on EarthA Giant Impact Origin for the First Subduction on Earth
A Giant Impact Origin for the First Subduction on Earth
 
Richard's entangled aventures in wonderland
Richard's entangled aventures in wonderlandRichard's entangled aventures in wonderland
Richard's entangled aventures in wonderland
 
Topography and sediments of the floor of the Bay of Bengal
Topography and sediments of the floor of the Bay of BengalTopography and sediments of the floor of the Bay of Bengal
Topography and sediments of the floor of the Bay of Bengal
 
THE IMPORTANCE OF MARTIAN ATMOSPHERE SAMPLE RETURN.
THE IMPORTANCE OF MARTIAN ATMOSPHERE SAMPLE RETURN.THE IMPORTANCE OF MARTIAN ATMOSPHERE SAMPLE RETURN.
THE IMPORTANCE OF MARTIAN ATMOSPHERE SAMPLE RETURN.
 
Hemoglobin metabolism_pathophysiology.pptx
Hemoglobin metabolism_pathophysiology.pptxHemoglobin metabolism_pathophysiology.pptx
Hemoglobin metabolism_pathophysiology.pptx
 
Cancer cell metabolism: special Reference to Lactate Pathway
Cancer cell metabolism: special Reference to Lactate PathwayCancer cell metabolism: special Reference to Lactate Pathway
Cancer cell metabolism: special Reference to Lactate Pathway
 
Anemia_ different types_causes_ conditions
Anemia_ different types_causes_ conditionsAnemia_ different types_causes_ conditions
Anemia_ different types_causes_ conditions
 
NuGOweek 2024 Ghent - programme - final version
NuGOweek 2024 Ghent - programme - final versionNuGOweek 2024 Ghent - programme - final version
NuGOweek 2024 Ghent - programme - final version
 

Influence of alcohol on the vigilance levels for a driving test

  • 1. Article Citation: Etobo Innocent AHOUNOU, Koffi Mathias YAO, Kobenan Fiéni Jean-Baptiste ADOU, Némé Antoine TAKO and Bialli SERI. Influence of alcohol on vigilance levels for a driving test. Journal of Research in Biology (2015) 5(7): 1874-1884 JournalofResearchinBiology Influence of alcohol on the vigilance levels for a driving test Keywords: Alertness, alcohol, acute consumption, errors. ABSTRACT: In order to determine the maximum alcohol to remain sufficiently vigilant during a driving, sixty (60) male volunteers divided into two groups of thirty, including a control group and an experimental group previously submitted to acute consumption of alcohol, were chosen and participated in a driving test. Each subject shall drive a vehicle on a straight track for 500 meters with a circular terminal after 80 meters, enabling him to return to the starting point. The speed was imposed by an instructor and obstacles (balls) may be set to arise on the way. Ten centimeters were added on the side edges of the vehicle to plot the width of the road ahead. Thus, any excess of the lateral edges is a lateral error and any ball reached, arising in front of the driver, is a frontal error. The test is performed each hour for five consecutive hours. The results indicated that the number of errors increases with speed, the side that errors outnumber frontal errors and the acceptable blood alcohol for driving test would be 0.3 g of alcohol per liter of blood. Thus, the state should reduce the permitted blood alcohol, currently at 0.8 g / l, at a rate less than or equal to 0.3 g / l. The state must also equip the police forces of devices adapted to make systematic control. 1874-1884 | JRB | 2015 | Vol 5 | No 7 This article is governed by the Creative Commons Attribution License (http://creativecommons.org/ licenses/by/4.0), which gives permission for unrestricted use, non-commercial, distribution and reproduction in all medium, provided the original work is properly cited. www.jresearchbiology.com Journal of Research in Biology An International Scientific Research Journal Authors: Etobo Innocent AHOUNOU, Koffi Mathias YAO, Kobenan Fiéni Jean-Baptiste ADOU, Némé Antoine TAKO and Bialli SERI Institution: Laboratoire de Neurosciences, UFR Biosciences, Université Félix Houphouët-Boigny, 22 BP 582 Abidjan 22, République de Côte d’Ivoire. Corresponding author: Koffi Mathias YAO Email Id: Web Address: http://jresearchbiology.com/ documents/RA0571.pdf Dates: Received: 01 November 2015 Accepted: 09 November 2015 Published: 15 December 2015 Journal of Research in Biology An International Scientific Research Journal Original Research ISSN No: Print: 2231 –6280; Online: 2231- 6299
  • 2. INTRODUCTION Alcoholism is one of the major health risks in the world (Yao et al., 2012). According to the 2006 report by the World Health Organization (WHO), the harmful use of alcohol was responsible for 4% of the disease burden and 3.2% of premature deaths worldwide. These statistics also contain traffic accidents, which are resulted from the combination of multiple factors including health status, values, attitudes and behavior of drivers; all that constitutes the human factor are known to be involved in the conduct. Toxicological data indicate that about 25% of drivers involved in road accidents are under the influence of drugs and in general, a high rate of alcohol was detected (Brady and Li, 2013). Variations in individual tolerance (Alvarez and Del Rio, 2003) depending on the regularity of consumption do not allow alcohol to indicate a stable, maximum for which there could be no observable effect on an individual (Dupont et al., 2012). So, if we agree to accept that the substance is dangerous for the driver when it reduces its capacity to lead by decreasing motor skills, reaction time and changing the perception (Kelly, et al 2004), the safety threshold in consumption remains variable from one State to another. Indeed, some studies showed that acute alcohol is attained only from a BAC of 0.8 g / liter of blood (INSERM, 2001). However, for some authors, a BAC of 0.5 gram per liter of blood led to observable effects on human behavior (Oscar-Berman and Marinkovic, 2007). Thus, according to studies, the minimum acceptable alcohol is still debated. Therefore the BAC limits vary from 0 to 0.8 g per liter of blood based on the considerations of each state. For these reasons, the objective of this study is to estimate the maximum alcohol to which one might be able to drive a vehicle with less risk, to contribute to the prevention of accidents related to the consumption of alcoholic beverages MATERIALS AND METHODS Threads These 60 subjects having 30 control subjects and 30 male test subjects aged 26 to 37 years with a mean of 34.3 years investigated for the study. Each subject has a valid driving license with at least three years of regular driving without accident and a vehicle at his disposal at the time of the experiment. 30 other participants in the experiments were selected to help to achieve the tasks. These two driving instructors and 28 others have to pass on the obstacles on the path while they were driving. They are all male, aged 25-54 years, with an average of 32.7 years. Insurance coverage has been contracted for all participants in these experiments. Following the recommendations of Helsinki (2000), these works were carried out with the authorization of the Ethics Committee of the training and research unit of the University bioscience, Felix Houphouet-Boigny, Abidjan, Cote d'Ivoire (Coast) Materials A vehicle brand Toyota Corolla VE 4.80 m long, 1.695 m wide and 1,385 m high, with a 1095 kg unladen mass, manual transmission and front-wheel drive, equipped with dual controls ( pedals) for driving school; electronic breathalyzer SERES kind E 679; of scales; alcohol at 96 degree; a hydrometer type centesimal Gay Lussac, a graduated cylinder of 1,000 milliliters (ml); a paint bucket of 20 kg; and a tape measure. Alcoholic solutions Having assessed the degree (concentration) of alcohol using the centesimal GAY LUSSAC hydrometer which indicated 96°, preparing alcoholic solutions was through dilutions to obtain concentrations sought. These dilutions are operated in accordance with the formula Civi = CfVf where, Ci is the initial concentration; Cf is the final concentration; Vi is the initial volume; and Vf indicates the final volume. AHOUNOU et al., 2015 1875 Journal of Research in Biology (2015) 5(7):1874-1884
  • 3. Journal of Research in Biology (2015) 5(7):1874-1884 1876 AHOUNOU et al., 2015 Thus, from 91 ml of a stock solution of 96 ° alcohol, contained in a graduated cylinder, obtaining a diluted solution at 39° was done by adding 224 ml of distilled water. Similarly, an alcohol solution at 0.5° was prepared to serve as a placebo control subject. Methodology The mass of the subject is taken at the laboratory. It is used for the experiments the weight is in the range of [65-70] kg. This restriction makes it possible to have approximately the same amount of alcohol after the consumption of the same amount of alcohol, as the alcohol also depends on the mass of the subject. Furthermore, the chosen interval [65-70] kg allows to be certain that all subjects who consumed 125 ml of alcohol at 39° alcohol are acute. This assurance is given by the calculation of the alcohol in the words of Widmark (1932), which is as follows: T = (Volume percentage of alcohol * * 0.8) / (K * mass of the individual) where as T is the value of the alcohol; The volume corresponds to the volume of alcohol consumed by the individual in ml; The mass of the individual in kg and K is the diffusion coefficient (K = 0.7 for human and K = 0.6 for women). Thus, for a quantity of 125 ml of alcohol at 39°, a man of 65 kg gets a BAC of T = 0.86 grams per liter of blood for a man of 70 kg, the alcohol is T = 0 80 grams per liter of blood. Similarly, for a quantity of 125 ml at 0.5°, a man with a mass of 65 to 70 kg gets a BAC of about 0.01 grams per liter of blood. After raising the mass, each subject must drive the vehicle on a straight track of 500 meters with a circular terminal after 80 meters (Figure 1), enabling him to return to the starting point. The vehicle is parked at the starting point by an instructor leaving 10 cm margin on the left and 10 cm to the right of the vehicle. The limit is marked by a white band made of paint. The driver was instructed not to overflow the white side bands and watch out for obstacles that will come during the journey. The instructor goes up with the driver, gives him the speed to reach: it is on average 40 kilometers per hour (km / h) in the first round 60 km / h in the second round and 80 km / h in the third round. Any infringement of the white band is considered an error (lateral error). In addition, 28 people are arranged along the path (stakes) at a rate of one in every 20 meters, each with a balloon (obstacle) in hand. The second instructor gives instructions to the stakes for the release of obstacles on the road. Each time, when a person released 10 obstacles in the path unpredictable for the driver, at a distance of at least 20 meters from the vehicle it is noted, After the first three rounds, each about five minutes to consume either 125 ml of alcohol at 39 degrees for testing subjects or 125 ml of alcohol to 0.5 degrees for controls. A breathalyzer is used to check the dose of alcohol at each levels (before eating and before each new round of Conduct). After drinking alcohol, new driving sessions are held every five hour (1 hour, 2:00, 3:00, 4:00 and 5:00). Error Handling The lateral errors The total distance traveled by each turn is about D = 1.080 meters (m). The Mean number of errors is a function of the vehicle length. Thus, the maximum number of errors is Em = D / L (L being the length of the vehicle: 4.80 m). [Thus, the percentage of lateral mean errors E L is E L = E m E * 100 L = number of errors, 100 / E L = E m is the number of errors * 100 / (1080/4.80) that is to say, E L = number of errors * 100/225.] Front Errors The total number of barriers released at each passage is 10, the maximum number of errors is also 10. Thus, the percentage of frontal errors is: E f = number of errors * 100/10. Statistical analysis Before drinking alcohol and every hour after ingestion, the control group is compared to the test
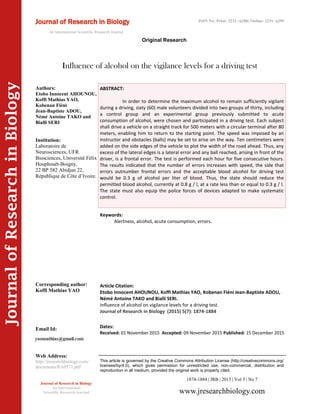
  • 4. AHOUNOU et al., 2015 1877 Journal of Research in Biology (2015) 5(7):1874-1884 A B C Figure 2. Percentage of lateral errors and expired alcohol content prior to the alcohol (T0), and every hour for 5 hours. At ‘A’ the speed is 40 km / h; At ‘B’, the speed is 60 km / h; And at ‘C’, at a speed is 80 km / h. Errors of control subjects Blood Alchol Level Blood Alchol Level Errors of text subjects Alchollevel(mg/ld’airexpiringlevel PercentageoferrorsPercentageoferrorsPercentageoferrors Alchollevel(mg/ld’airexpiringlevelAlchollevel(mg/ld’airexpiringlevel Figure 1. Schematic representation of driving terrain. The vehicle having 1.695 m in width, a space of 10 centimeters is granted each lateral side (for a total of 20 cm) to chart the way to use. Arrival Departure Round Point Width of A = Width of B = 1.895 Time (hours) Time (hours) Time (hours)
  • 5. AHOUNOU et al., 2015 Journal of Research in Biology (2015) 5(7):1874-1884 1878 Figure 3. Percentage of frontal errors and expired alcohol content prior to the alcohol (T0), and every hour for 5 hours. At ‘A’ the speed is 40 km / h; At ‘B’, the speed is 60 km / h; And at ‘C’, the speed is 80 km / h. A B C Errors of control subjects Blood Alchol Level Blood Alchol Level Errors of text subjects Alchollevel(mg/ld’airexpiringlevel Alchollevel(mg/ld’airexpiringlevel Alchollevel(mg/ld’airexpiringlevel Percentageoferrors PercentageoferrorsPercentageoferrors Time (hours) Time (hours) Time (hours)
  • 6. group. The character is considered the number of errors whose details were exposed above. This is to analyze the behavior of each group together through their performances and to compare them. One should check the significance of any differences between the errors obtained in each group, that is to say whether in each event the performance difference between the two groups given is significant or not. To do this, an analysis of variance (ANOVA) (univariate), using the software Statistica 10.0, to make comparisons, every hour. Probability (p) of 0.05 was considered as the significance limit. Thus, if "p" is less than or equal to 0.05, then the difference between the compared variables is significant. By cons, if "p" is greater than 0.05, then the difference between the two compared variables is not significant. RESULTS Errors side Before alcohol consumption and every hour after alcohol, the group of test subjects were compared to the group of control subjects. Also, they have all been assessed taking into account the speed limits imposed by the instructor. These are of 40 km / h, 60 km / h and 80 km / h. To recall, the number of errors committed by the subject is the determining factor in this assessment. Thus, it appears from these investigations, the following results: A 40 km/h speed in structed, before consumption of alcohol (T0) showed identical performence in, the control group and those for the consumption of alcohol, (Figure 2A). In this respect, the comparison between the witnesses and the subjects to consume alcohol gives F (1.58) = 0.52 and p = 0.47. This difference is not significant. An hour after the consumption of alcohol, the comparison between the groups of subjects gives F (1.58) = 2649.6 and p <0.0001. The difference is very significant. Two hours after the consumption of alcohol, the comparison between the control group and the test group shows difference in the range of F (1.58) = 2524 p <0.0001. The difference is very significant. In the third hour to the fifth hour, no difference between the two groups is significant. The results are as follows for three hours: F (1.58) = 2.46 and p = 0.12; for four hours: F (1.58) = 1.04 and p = 0.31 and for five hours: 1.04 and p = 0.31 and for five hours: F (1, 58) = 0.82 and p = 0.37. In a test of 60 km / h, before consumption of alcohol the control group (T0) and those for the consumption of alcohol, have nearly identical performance (Figure 2B). Thus, the comparison between the witnesses and the subjects to consume alcohol gives F (1.58) = 0.89 at p = 0.35. This difference is not significant. An hour after the consumption of alcohol, the comparison between the groups of subjects are significant and gives F (1.58) = 5069 at p <0.0001. Two hours after the consumption of alcohol, the comparison between the control group and the test group gives F (1.58) = 848.39 and p<0.0001. The difference is very significant. From the third hour to the fifth hour, no difference between the two groups are significant. Found to be the data obtained for three hours were as follows: F (1.58) = 2.13 at p = 0.15; for four hours: F (1.58) = 1.20 at p = 0.28 for five hours: F (1.58) = 1.25 at p = 0.27. A 80 km / h. Before the consumption of alcohol (T0), the control group and those for the consumption of alcohol, have nearly identical performance (Figure 2C). Also, the comparison between the witnesses and the subjects to consume alcohol is as follows F (1.58) = 1.80 and p = 0.18. This difference is not significant. An hour after the consumption of alcohol, the comparison between the groups of subjects shows F (1.58) = 1995.7 at p <0.0001. This difference is very significant. Two hours after the consumption of alcohol, the comparison between the control group and the test group showed F (1.58) = 2946.7 and p <0.0001. This difference is also very significant. Similarly, three hours after alcohol intake, the performance difference between the two groups gives F (1.58) = 15.52 at p = 0.0002. This 1879 Journal of Research in Biology (2015) 5(7):1874-1884 AHOUNOU et al., 2015
  • 7. difference is also significant. Four hours after the consumption of alcohol, the comparison between the control group and the test group showed F (1.58) = 9.92 at p = 0.0026. This difference is also found to be significant. At the fifth time, the two groups did not showed any significant difference. Indeed obtained: F (1.58) = 1.58 at p = 0.21. as a measure of this difference. Front errors At 40 km / h, before consumption of alcohol (T0), the control group and those for the consumption of alcohol, have almost similar performance (Figure 3A). In this respect, the comparison between the witnesses and the subjects to consume alcohol gives F (1.58) = 1.91 and p = 0.17. This difference is not significant. An hour after the consumption of alcohol, the comparison between the group of subjects gives F (1.58) = 170.29 at p <0.0001. The difference is very significant. In the second hour to the fifth hour, no difference between the two groups is significant. For two hours: F (1.58) = 1.22 at p = 0.27 for three hours: F (1.58) = 0.02 at p = 0.88; for four hours: F (1.58) = 0.24 at p = 0.62 and for five hours: F (1.58) = 2.50 at p = 0.12 Obtained successively. At 60 km / h, before consumption of alcohol (T0), the control group and those for the consumption of alcohol, have nearly identical performance (Figure 3B). In this respect, the comparison between the witnesses and the subjects to consume alcohol gives F (1.58) = 1.05 at p = 0.31. This difference is not significant. An hour after the consumption of alcohol, the comparison between the group of subjects give F (1.58) = 137.21 at p <0.0001. in the difference is very significant. The second hour to the fifth hour, no difference between the two groups as significant. For two hours: F (1.58) = 0.79 at p = 0.39; for three hours: F (1.58) = 2.97 at p = 0.09; for four hours: F (1.58) = 0.06 at p = 0.80 for five hours: F (1.58) = 2.04 at p = 0.16 were obtained respectively. At 80 km / h before the consumption of alcohol (T0), the control group and those for the consumption of alcohol, have almost similar performance (Figure 3C). In this respect, the comparison between the witnesses and the subjects to consume alcohol gives F (1.58) = 0.94 at p = 0.33. This difference is not significant. An hour after the consumption of alcohol, the comparison between the groups of subjects gives F (1.58) = 492.95 at p <0.0001. The difference is very significant. Two hours after the consumption of alcohol, the comparison between the control group and the test group gives F (1.58) = 9.35 at p = 0.003. The difference is significant. Similarly, three hours after alcohol intake, the performance difference between the two group gives F (1.58) = 9.04 at p = 0.004. This difference is also significant. Four hours after the consumption of alcohol, the comparison between the control group and the test group gives F (1.58) = 17.13 at p = 0.0001. This difference is also significant. At the fifth time, both the two groups did not showed any significant difference. Indeed obtained: F (1.58) = 0.54 at p = 0.46. DISCUSSION This study involved male subjects of weight between 65 and 70 kg. The need to use a mass range is because body size is involved in the distribution of alcohol in the body. According to some studies, the amount of fat influences the metabolism of the alcohol (Jones et al., 1997). Thus, if one relies on the dose to give the quantities in function inrespective of the mass of the individual, it will appear in misinterpretations between the high mass of people and other lighter persons. Moreover, the choice of male is recommended (Ettorre, 2004) because of the fragility of women to alcohol. Indeed, the hormonal changes caused by the menstrual cycle, does not allow to draw effective conclusions in case of group comparisons (Perry, 2004). Also, a placebo was used by need for all investigations in the same psychological experience conditions. Indeed, there also exists an effect of alcohol consumption Expectation (O'Boyle et al., 1994). In other words, the behavior of a person is changed differently depending on Journal of Research in Biology (2015) 5(7):1874-1884 1880 AHOUNOU et al., 2015
  • 8. whether it knows whether or not it absorbs alcohol. This study compared the performance of control subjects who are the placebo to the test subjects consuming alcohol. If it is accepted that the minimum dose of alcohol for an observable effect on human behavior could be below 0.5 g / l of blood (Oscar- Berman and Marinkovic, 2007). No significant in the difference performance before consumption by the test subjects showed that with a dose of about 0.01 g / l of blood for control subjects, alcohol does not significantly influences behavior tested. For cons, the 125 ml of 39° alcohol consumed by the test subjects alter their blood alcohol within a range of [0.80 to 0.86] g / l of blood. This proves that the alcohol test subjects have showed an acute dose of alcohol since the alcohol levels to achieve an acute consumption is 0.8 g / l of blood (INSERM, 2001). Furthermore, depending on the speed (40 km / h or 60 km / h or 80 km / h) required by the instructor, the errors of all subjects were evaluated. The results obtained before alcohol consumption by the test subjects (T0), the errors of these latter pass from 8% to 10% then 19% respectively for the 40 km / h, 60 km / h and 80 km / h. Likewise the errors of the control subjects increased from 6% to 12% then 22% respectively for the 40 km / h, 60 km / h and 80 km / h. These results clearly showed that the number of errors augment with speed. Thus, this observation is in agreement with the data collected by other authors (Finch et al., 1994). In fact, these authors have demonstrated that the probability of an accident is proportional to the square of the speed. In addition they point out that for every increase of 1 km / h, the incidence of accidents increased by 3%. In the same way, some authors conclude that whenever average speed gets decreased (1.6 km / h), the number of accident decreases accidents decreases by at least 6% on urban roads with heavy traffic (Taylor et al., 2002). In addition, in a meta-analysis of 36 studies on speed limit changes revealed that above 50 km / h, accidents were decreased by 2% when the average speed is reduced by 1 km / h ( Elvik et al., 1997). Also, other authors showed that in rural areas where the speed limit is 60 km / h, the relative risk of accident is at least twice at each speed increase of 5 km / h above 60 km / h (McLean and Kloeden, 2002). So when alertness levels are not altered, it is known that a high-speed, only complicates the many motor coordination need to involve or to avoid danger when it appears more or less suddenly. At 40 km / h and 60 km / h the difference in performance between the two groups (control and test) is significant at one hour and two hours after drinking, regarding the lateral errors while it is significant only at one hour after alcohol consumption for the front errors. Therefore, it is certain that there are more errors than lateral end errors. Thus, after an alcohol, if the elongation of reaction time (West et al., 1993), could explain the end errors, the narrowing of the visual field (Mura, 1999) would cause side errors. However, the risks of the alcohol-related accidents are mainly due to its disinhibiting effect which results in the behavior change and risk taking (Deery and Love, 1996). Indeed, as revealed by the National Institute (in France) of Health and Medical Research (INSERM, 2001), when volunteers perform a cognitive task with a BAC of about 0.50 g / l, they proceed more quickly than fasting but with a significant increase in the number of errors; these results oppose alcohol with benzodiazepines recent slowing the contrary and the execution of the task, but without increasing the number of errors (Girre et al., 1991). It has been shown that errors in were similar and repetitive errors to those who observed from the front with (Lyvers and Maltzman 1991). The hypothesis of a specific effect of alcohol on the frontal functions is also suggested by a number of clinical data (Peterson et al., 1990) and brain imaging (Sano et al. 1993). An hour after the consumption of two groups of subjects, the test subjects make many more errors than controls inrespective of the speed. This observation AHOUNOU et al., 2015 1881 Journal of Research in Biology (2015) 5(7):1874-1884
  • 9. demonstrates a transient disorder of vigilance levels, an hour after drinking. The existence of the effects of alcohol one hour after consumption is explained by the work of some authors (Ben Amar, 2007; A pfelbaum et al., 2009). In fact, these authors show that the alcohol reaches its maximum diffusion between thirty minutes and one hour. This rapid spread mainly concerns the most irrigated areas like the brain which is the seat of the attention (Ruitenberg et al, 2005). Two hours after alcohol consumption, the performance difference between the two groups was significant for lateral errors, while for the front errors the difference is significant only at 80 km / h. This result showed a continuing effect of alcohol on vigilance in the second hour after alcohol. Indeed, having peaked in the first hour, the metabolism of alcohol gradually reduces its effect during the next hour. Since the work of Widmark (1932), an estimated value of the degradation of ethanol at a rate of 0.15 g / l / hr. Thus, from the second hour, the blood alcohol test subjects ranging from [0.65 to 0.71] g / l, it is possible to say that the blood alcohol limit of 0.8 g official / l blood is a problem for safety in driving. From the third to the fourth hour after alcohol consumption, the difference is significant for the lateral and front mistakes to 80 km / h. In this time interval the BAC is between [0.35 to 0.56] g / l. Also, at the fifth hour, the performance difference is not significant regardless of the speed and the type of error considered. With an estimated blood alcohol concentration to 0.30 g / l of blood, this result indicates a return to a normal level of vigilance hours after alcohol consumption. Indeed, a statistical study indicates that accidents become numerous from 0.4 g / l of blood alchol itself (Campton et al., 2002). Furthermore, the results of analyzes of studies concluded that there is no lower threshold below which the impairment does not exist for alcohol" (Moskowitz and Fiorentino 2000). Indeed, some authors were able to identify cognitive changes for lower blood alcohol concentrations of 0.50 g / l, including a drop in maintaining vigilance when it is measured from space stimuli (Koelega 1995). These results raise the question of acceptable blood alcohol limit when performing cognitive tasks such as driving vehicles (INSERM, 2001). CONCLUSION This work was initiated to assist in determining the minimum alcohol to which we might be able to drive a vehicle without a major risk of causing accident. For a driving test, the results of this studyed allowed to remember that the number of errors increases with speed. Furthermore, due to the decline in vigilance by the effects of alcohol, leading to a narrowing of the visual field, the side errors are more frequent than frontal errors. The metabolism of alcohol allows a return to a normal alcohol function of time. Also, this study shows that a lower blood alcohol or equal to 0.3 g / l of blood would be more appropriate to reduce accidents related to alcohol consumption. Thus, the legal limit of 0.8 g / l of blood should be reviewed. REFERENCES Alvarez FJ, Del Rio MC. (2003). Response to Ramaekers: pitfalls in estimating drug related crash risk. Trends in Pharmacological Sciences, 24(3):115, . Pfelbaum AM, Romon M, Dubus M. (2009). Diététique et Nutrition, 7th ed. Elsevier Masson, Paris. Ben-Amar M. (2007). Les psychotropes criminogènes. Presses Univ. Montréal, 40(1):11-30. Brady JE, Li G (2013). Prevalence of alcohol and other drugs in fatally injured drivers. Addiction, 108(1):104– 114, . Campton RP, Blomberg RD, Moscowitz H, Burns M, Peek RC, Fiorentino D. (2002). Crash risk of alcohol impaired driving. In: Mayhew DR, Dussault C, eds. AHOUNOU et al., 2015 Journal of Research in Biology (2015) 5(7):1874-1884 1882
  • 10. Proceedings of the 16th International Conference on Alcohol, Drugs and Traffic Safety, Montreal, 4–9 August 2002. Montreal, Société de l’assurance automobile du Québec, 39–44. Deery HA, Love AW. (1996). The effect of a moderate dose of alcohol on the traffic hazard perception profile of young drink-drivers. Addiction, 91(6):815-827. Dupont RL, Voas RB, Walsh JM, Shea C, Talpins SK, Neil MM. (2012). The need for drugged driving per se laws: a commentary. Traffic Injury Prevention, 13 (1):31–42. Elvik R, Mysen AB, Vaa T. (1997). Trafi kksikkerhetshåndbok, tredje utgave [Handbook of traffi c safety, 3e edition, Oslo (Norvège), Institute of Transport Economics. Ettorre E. (2004). Revisioning women and drug use: gender sensitivity, embodiment and reducing harm. International Journal of Drug Policy, 15(5-6):327-335. Finch DJ, Kompfner P, Lockwood CR, Maycock G. (1994). Speed, speed limits and accidents. Crowthorne (Royaume-Uni), Transport Research Laboratory, Project Report 58. Girre C, Hirschhorn M, Bertaux L, Palombo S, Fournier PE. (1991). Comparison of performance of healthy volunteers given prazepam alone or combined with ethanol relation to drug plasma concentrations. International Clinical Psychopharmacology, 6(4):227- 238. [INSERM] Institut National de la Santé et de la Recherche Médicale. (2001). Alcool : effets sur la santé. Expertise collective ; France, Septembre, 119-129 ; 267- 273. Jones AW, Jönsson KA, Kechagias S. (1997). Effect of high-fat, high-protein, and highcarbohydrate meals on the pharmacokinetics of a small dose of alcohol. British Journal of Clinical Pharmacology, 44(6):521-526. Kelly E, Darke S, Ross J. (2004). A review of drug use and driving: epidemiology, impairment, risk factors and risk perceptions. Drug and Alcohol Review, 23(3):319– 344. Koelega HS. (1995). Alcohol and vigilance performance: a review. Psychopharmacology, 118 (3):233-249. Lyvers MF, Maltzman I. (1991). Selective effects of alcohol on Wisconsin card sorting test performance. British Journal of Addiction, 86(4):399-407. McLean J, Kloeden C. (2002). Alcohol, travelling speed and the risk of crash involvement. In: Mayhew DR, Dussault C, eds. Actes de la 16e Conférence internationale sur l’alcool, les drogues et la sécurité routière, Montréal, 4–9 août 2002. Montréal (Canada), Société de l’assurance automobile du Québec, 73–79. Moskowitz HA, Fiorentino D. (2000). A review of the literature on the effects of low doses of alcohol on driving-related skills. Washington, DC: US National Highway Traffic Safety Administration, Report n°. DOT HS 809 028, April Mura P. (1999). Alcool, médicaments, stupéfiants et conduite automobile. ed. Elsevier Paris. O’Boyle DJ, Binns AS, Sumner JJ. (1994). On the efficacy of alcohol placebos in inducing feelings of intoxication. Psychopharmacology, 115(1-2):229-236. [OMS] Organisation Mondiale de la Santé. (2006). Problèmes de santé publique imputables à l'abus d'alcool. Cinquante-septième session du bureau régional du pacifique occidental ; point 12; 18 au 22 septembre. Oscar-Berman M, Marinkovic K. (2007). Alcohol: Effects on neurobehavioral functions and the brain. AHOUNOU et al., 2015 1883 Journal of Research in Biology (2015) 5(7):1874
  • 11. Neuropsychol Review, 17(3):239-257. Perry BL. (2004). Premenstrual symptomatology and alcohol consumption. Journal of Studies on Alcohol and Drugs, 65(4):464-468. Peterson JB, Rothfleisch J, Zelazo PD, Pihl RO. (1990). Acute alcohol intoxication and cognitive functioning. Journal of Studies on Alcohol and Drugs, 51 (2):114-122. Ruitenberg A, Den Heijer T, Bakker SL, Van Swieten JC, Koudstaal PJ, Hofman A, Breteler MM. (2005). Cerebral hypoperfusion and clinical onset of dementia: the Rotterdam Study. Annals of Neurology, 57(6):789- 794. Sano M, Wendt PE, Wirsen A, Stenberg G, Risberg J, Ingvar DH. (1993). Acute effects of alcohol on regional cerebral blood flow in man. Journal of Studies on Alcohol and Drug, 54(3):369-376. Taylor MC, Baruya A, Kennedy JV. (2002). The relationship between speed and accidents on rural single -carriageway roads. Crowthorne (Royaume-Uni), Transport Research Laboratory, Rapport 511 du TR. West R, Wilding J, French D, Kemp R, Irving A. (1993). Effect of low and moderate doses of alcohol on driving hazard perception latency and driving speed. Addiction, 88(4):527-532. Widmark EMP. (1932). Die theorischen Grundladen und die praktische Verwendarbeit der gerichtlichmedizinischen Alkohol Bestimmung. Fortsch Naturw Forshung, 11:140. Yao KM, Camara PA, Adou KFJB. (2012). Types de boissons alcooliques consommées en Côte d’Ivoire. Préférence et consommation effective. Alcoologie et Addictologie, 34(3):185-193. AHOUNOU et al., 2015 Journal of Research in Biology (2015) 5(7):1874-1884 1884 Submit your articles online at www.jresearchbiology.com Advantages Easy online submission Complete Peer review Affordable Charges Quick processing Extensive indexing You retain your copyright submit@jresearchbiology.com www.jresearchbiology.com/Submit.php