![Definition of the Subject and Its Importance
Importance of Rapid Diagnosis of Infectious Diseases
Infectious diseases are a major burden on human health with the World Health
Organization (WHO) reporting that infectious diseases are responsible for one in
ten deaths in the world’s richest nations. The impact of infectious diseases is even
greater in poorer regions of the world where six of every ten deaths are caused by
a spectrum of infectious diseases that include bacteria, viruses, parasites and fungi.
These infectious agents can further be described as classical pathogens, e.g.,
tuberculosis and malaria, seasonal epidemics, e.g., influenza and rhinoviruses,
emerging infectious disease, e.g., highly pathogenic avian influenza and
hemorrhagic fevers, or global pandemics such as the most recent outbreak of
novel H1N1 influenza virus. Central to the management of each of these diseases
are diagnostics. Early and rapid detection of an infectious agent is not only
imperative to prevent the spread of disease, but it is also an essential first step to
identify appropriate therapeutics that target the disease, as well as to overcome
inappropriate administration of ineffective drugs that may drastically lead to drug-
resistant pathogens such as methicillin-resistant Staphylococcus aureus (MRSA).
This is just a succinct example which highlights the importance of diagnostic
testing; however, the sections that follow discuss the current status of diagnostics
and introduce an emerging approach to diagnostics based on vibrational spectros-
copy which has tremendous potential to significantly advance the field.
Introduction
Classical Culture-Based Diagnostics
Despite the importance of diagnostic tests for infectious diseases, relatively few
technological advances have supplanted classical microbiological approaches, e.g.,
in vitro culture, as a diagnostic standard. Clinical laboratories routinely rely on
selective and chromogenic growth media to identify bacterial agents. For example,
an abÀchromogenic medium, which includes two substrates, has been developed to
selectively isolate Salmonella spp. with 100% sensitivity and 90.5% specificity [1].
More recently chromogenic media have been developed to identify Staphylococcus
aureus and distinguish methicillin-resistant strains (MRSA) [2, 3]. Culture-based
diagnostics provide a method for definitive identification of many bacteria, and the
tests are relatively inexpensive; however, the identification process has generally
low throughput and substantial time is required for diagnostics. Typically, culture
requires 24–72 h to allow the bacteria to grow while slow-growing organisms such
as mycobacteria require substantially longer (6–12 week) incubation times.
148 J.D. Driskell and R.A. Tripp](https://image.slidesharecdn.com/infectiousdiseases-130528055611-phpapp02/85/Infectious-diseases-2-320.jpg)
![Obviously, this is not ideal as the time frame can delay patient treatment. It should
also be noted that not all pathogens can be cultured in a laboratory environment,
thus the technique cannot be universally applied. There are several additional
drawbacks of culture-based diagnostic methods including the requirement for
species specific reagents, appropriate culture and storage environments, and labor
intensive procedures.
Antibody-Based Diagnostics
Antigen detection and serology are common approaches used in clinical
laboratories as alternative or complementary tools to culture-based detection.
Common to both of these methods is the use of antibodies either to directly label
and detect the antigen or to capture the host response, e.g., antibody responses to
infection. Typically, an enzyme-linked immunosorbent assay (ELISA) is employed
for antigen detection in diagnostic laboratories. As a first step, ELISA requires an
unknown amount of antigen in a sample to be specifically, via a capture antibody in
a sandwich assay format, or nonspecifically, via adsorption, immobilized to a solid
phase such as a microtiter plate. After removing excess antigen, a known amount of
detection antibody specific to the pathogen is then introduced to bind any
immobilized antigen. The detection antibody is either directly labeled with an
enzyme, or in an additional step, detected with an enzyme-labeled secondary
antibody. After removal of excess reagent, a substrate is introduced to react with
the enzyme producing a quantifiable color change. A slight modification of this
approach replaces the enzyme with a fluorophor for fluorescence-based readout,
eliminating the final substrate incubation step. A similar approach is taken for
ELISA-based serological assays in which a known amount of purified antigen is
immobilized onto the solid phase and incubated with serum to detect the presence of
antibodies. While the procedure requires multitudinous steps, reagents, and substan-
tial labor, ELISA is considered rapid relative to culture-based diagnostics as in many
cases the assay can be completed within several hours. ELISA-based assays continue
to be an integral part of laboratory diagnostics, but in their original form they are
limited to the laboratory.
Lateral flow immunoassays, also called dipstick assays, immunochroma-
tography, sol particle immunoassays, or rapid diagnostic tests, have been developed
to overcome many limitations of ELISAs by eliminating the complex multi-step
procedure, reducing labor, and allowing field or point-of-care testing. Lateral flow
assays, like ELISAs, utilize pathogen-specific antibodies for the direct detection of
antigen or detection of antibody response. However, for the case of lateral-flow
assays the labeled detection antibody, capture antibody, and control reagents are
dried on a prefabricated carrier strip. By design, these assays overcome diffusion-
limited kinetics to exploit the rapid kinetics of antibody-antigen recognition [4, 5] to
yield results in 10–20 min. Thus, because of the “reagentless” nature and rapid
results, these assays are well suited for field use and resource-poor regions where
7 Infectious Diseases, Vibrational Spectroscopic Approaches to Rapid Diagnostics 149](https://image.slidesharecdn.com/infectiousdiseases-130528055611-phpapp02/85/Infectious-diseases-3-320.jpg)
![reagent storage and test sites are severely limited. It should be noted, however, that
these benefits are at the loss of quantitative information and often a lower threshold of
detection.
Numerous lateral flow immunoassays have been developed commercially for
clinical diagnostics. Several competing manufacturers offer rapid diagnostic tests
for influenza virus in which a conserved antigen is detected in a lateral flow assay
format. Some detect influenza A and influenza B without distinction of the
subtypes, e.g., QuickVue Influenza Test (Quidel), others detect and differentiate
A and B strains, e.g., QuickVue Influenza A + B Test (Quidel) and 3 M™ Rapid
Detection Flu A + B Test, and some only identify A or B strains, e.g., SAS Influenza
A Test, (SA Scientific). Similarly, commercial rapid diagnostic tests are available
for detection of a conserved protein for rotavirus A, e.g., IVD Rotavirus A Testing
Kit. Not all lateral flow assays are designed for antigen detection; a rapid diagnostic
test developed for leptospirosis diagnosis target anti-Leptospira IgM antibodies [6].
Despite continued advancements in antibody-based diagnostics these platforms
will always be limited by the need for species-specific reagents, i.e., antibodies
where the assays can only perform with the sensitivity and specificity inherent to
the antibody. For example, commercial lateral flow assays for influenza only
provide 50–70% sensitivity and 90–95% specificity with respect to culture-based
diagnosis [7]. While the lateral flow assays may be performed rapidly, their low
sensitivity may preclude early diagnosis due to low levels or unsustained levels of
antigen through disease available for detection. Moreover, serological-based assays
developed to detect agent-specific antibodies require that the infection elicit
a detectable sustained immune response before the assay can be performed,
a feature which substantially delays diagnosis.
Molecular Diagnostics
Nucleic acid and sequence-based methods for diagnostics offer significant
advantages over conventional culture- and antibody-based diagnostics with regard
to sensitivity, specificity, speed, cost, and portability. Central to molecular
diagnostics is the use of a complementary nucleic acid probe that hybridizes to
a unique species-specific region of the infectious agents RNA or DNA. While
several molecular platforms have been developed for infectious diseases
diagnostics, e.g., fluorescence in situ hybridization (FISH), polymerase chain
reaction (PCR) is the most commonly employed molecular method for diagnostics.
PCR is a method of amplifying targeted segments of nucleic acid by several orders
of magnitude to facilitate detection. In principal, complementary primer sequences
are used to hybridize to a target nucleic acid sequence. A thermostable DNA
polymerase, e.g., Taq polymerase, is then employed to extend the primer sequence.
Thermal control facilitates extension, melting, and annealing, and via temperature-
controlled cycling, the number of target sequences increases exponentially with
each cycle. Amplification of the target sequence can be read out in an ethidium
150 J.D. Driskell and R.A. Tripp](https://image.slidesharecdn.com/infectiousdiseases-130528055611-phpapp02/85/Infectious-diseases-4-320.jpg)
![bromide-stained agarose gel or in real-time via cleavage of a fluorescent tag from
the primer during the extension step. Appropriate selection of the primers provides
extremely specific detection, while the amplification of the target nucleic acid
provides excellent sensitivity.
PCR has been demonstrated to be sensitive to single-copy numbers of DNA/RNA
targets. In these most sensitive PCR assays, primers are chosen to fully complement
a region of the target sequence. Perfect complement probes are also ideal for
maximizing the assay specificity to a particular infectious agent. However, in
practice, genetic mutations, particularly prevalent in RNA viruses such as influenza,
can render a primer/probe set ineffective for diagnosis. Thus, degenerate probes are
sometimes chosen to encompass some genetic diversity at the expense of sensitivity.
Multiplexed PCR utilizes multiple primer/probe sets that target different
pathogens. Multiplexed assays are implemented when the sample size is limited,
preventing multiple individual singleplex PCR analyses, and the clinician is unable
to determine the most likely causative agent based on early clinical presentation.
Multiplexed PCR assays are not quantitative due to target competition for reagents,
are typically less sensitive than singleplex assays, and because of increased
reagents, are more expensive to perform than singleplex assays. Moreover, multiple
PCR products cannot be simultaneously read out by fluorescence, thus microarray
analysis or electrophoresis to identify PCR products of different lengths is required
to detect multiple PCR products. However, breakthroughs in multiplexed detection
and quantitation are forthcoming [8–10].
Thus, for detection and diagnosis of many diseases such as viruses, PCR offers
many advantages over classical methods of diagnostics, and its role will continue to
expand in clinical diagnostic laboratories. However, there are challenges associated
with PCR. For pathogens in which culture and microscopy can be used, molecular
diagnostics are not the most cost effective. For example, the cost of a commercial
PCR assay for tuberculosis ranges from $40 to $80, whereas microscopy and
culture can be implemented for $1 and $5, respectively. Another consideration is
how to interpret PCR results. Due to the sensitivity afforded by PCR, extremely low
levels of infectious agent can be detected which may be below clinically relevant
thresholds for disease presentation. Thus, quantitative PCR rather than qualitative
PCR is typically more informative when correlating to clinical diagnosis. PCR
assays developed in the laboratory are not always translational to analysis of
clinical samples. In general, PCR cannot be performed directly on biological fluids
such as blood because compounds such as hemoglobin, lactoferrin, heme, and IgG
inhibit amplification [11–13]. Therefore, DNA and RNA are extracted as a first
step, prior to PCR, but inefficiency of extraction kits often lead to a decrease in
analytical performance compared to laboratory cultures [14, 15]. Moreover, isola-
tion of nucleic acids is time consuming and technically challenging unless
automated, which requires expensive equipment and reagents. A final consideration
is the need for temperature-sensitive reagents, thermocyclers, skilled workers, and
a clean laboratory environment to prevent contamination leading to false-negative
results. While tremendous efforts are focused on PCR automation, incorporation of
microfluidics [16, 17], and isothermal amplification [18–21], e.g., loop-mediated
7 Infectious Diseases, Vibrational Spectroscopic Approaches to Rapid Diagnostics 151](https://image.slidesharecdn.com/infectiousdiseases-130528055611-phpapp02/85/Infectious-diseases-5-320.jpg)
![2.5–50 mm. Photons of appropriate energy to bring about a transition from one
vibrational state to an excited vibrational state are absorbed by the analyte. Selec-
tion rules govern which vibrations are allowed to absorb IR photons, providing
chemical and structural information. These rules require a net change in the dipole
moment of the molecule as a result of the vibration. Thus, IR absorption spectra are
dominated by asymmetrical vibrations. With consideration to these selection rules,
proteins and nucleic acids (building blocks of bacteria, viruses, etc.) are excellent
absorbers of IR radiation making IR spectroscopy an ideal tool for characterization
of infectious agents.
The chemical complexity and sheer size of bacteria and viruses tend to produce
complex spectra with broad and overlapping bands. Yet subtle changes in band
shape, slight shifts in band peak positions, and variation in relative band intensities
provide significant insight into chemical structure. Thus, careful evaluation of the
full spectral fingerprint of whole-organisms, rather than analysis of single peaks
common to small molecule studies, can lead to identification and classification of
microorganisms.
IR spectroscopy as a technique for whole-organism fingerprinting dates back to
1952 [22]. In this early study, Stevenson and Boulduan showed that the IR spectra
for Escherichia coli, Pseudomonas aeruginosa, Bacillus subtilis, and six other
species of cultured bacteria are unique to each species. In addition to species
identification, six strains of Bacterium tularense were spectroscopically
differentiated. This initial work did not immediately translate to the diagnostic
applications of IR spectroscopy. Two major breakthroughs that did not occur for
several decades after the original findings were essential to further increase the
utility of IR for whole-organism fingerprinting. First, prior to the 1980s when
Fourier transform infrared spectroscopy (FTIR) was introduced, dispersive
instruments were typically used. Dispersive instruments do not provide the speed
or analytical performance required for IR-based diagnostics. FTIR instruments
provide much better signal-to-noise spectra with improved spectral resolution,
and are acquired in less time. These advantages provided by FTIR were essential
to accurately analyze these complex biological spectra by distinguishing subtle
changes in spectral band shape and to rapidly collect data. Additional developments
in the methods of data analysis were also essential to move IR whole-organism
fingerprinting forward. The large number of variables, i.e., wavelengths, each
containing relevant information, inherent to IR spectra and rather subtle changes
in intensity prevented traditional single-peak analysis for bacterial identification.
Moreover, visual inspection of the spectra by the analyst is too labor intensive,
prone to operator error, and unrealistic for large numbers of spectra and/or
organisms from which to identify. The introduction of chemometrics,
i.e., multivariate statistics applied to spectroscopy, led to the continued interest
and advancement of IR-based diagnostics. These methods, including principal
component analysis [23, 24], discriminant analysis, multiple regression analysis
[25], and artificial neural networks [26, 27], function to simplify the high
dimensional dataset by identifying the most significant variables with the ultimate
goal of sample identification or quantification.
7 Infectious Diseases, Vibrational Spectroscopic Approaches to Rapid Diagnostics 153](https://image.slidesharecdn.com/infectiousdiseases-130528055611-phpapp02/85/Infectious-diseases-7-320.jpg)
![FTIR has received the greatest attention with respect to vibrational spectroscopic
techniques over the last 2 decades and has been developed to the point that it can be
considered an established method for the identification of both bacterial species and
strains [28–33]. Researchers continue to investigate laboratory cultures of bacteria
in an effort to standardize sampling protocols so that spectral databases can be
shared among laboratories and to standardize the methods of analysis including
spectral preprocessing, feature selection, and classification algorithms. As the
method has matured, and while it continues to be tweaked and standardized,
FTIR is now being applied to the analysis of clinical specimens. For example,
FTIR has been successfully used to analyze clinical sputum samples collected from
cystic fibrosis patients [26]. This FTIR capability is important as historically, lung
infection caused by Pseudomonas aeruginosa, Staphylococcus aureus, and
Haemophilus influenzae were the major causes of morbidity and mortality in cystic
fibrosis patients; however, the number of emerging nonfermenting species is on the
rise [34], and many of these species are closely related and not appropriately
identified using typical clinical diagnostics and microbiological approaches [35].
Using a FTIR spectral library and an artificial neural network built for pathogen
identification, the results from the FTIR method were compared to conventional
microbiology detection methods. A two-tiered ANN classification scheme was built
in which the top-level network identified P. aeruginosa, S. maltophilia,
Achromobacter xylosoxidans, Acinetobacter spp., R. pickettii, and Burkholderia
cepacia complex (BCC) bacteria. The second-level network differentiated among
four species of BCC, B. cepacia, B. multivorans, B. cenocepacia, and B. stabilis.
Ultimately, this method resulted in identification success rates of 98.1% and 93.8%
for the two ANN levels, respectively. However, before this optimized method was
established, the research highlighted three important considerations. First, not all
bacterial isolates produce poly-b-hydroxybutyric acid (PHB) which contributes to
the IR spectra and confounds classification. To overcome this, each isolate was
cultured on TSA medium and harvested after 5 h of growth, prior to the expression
of PHB. This step enriches the bacteria for analysis and eliminates interference
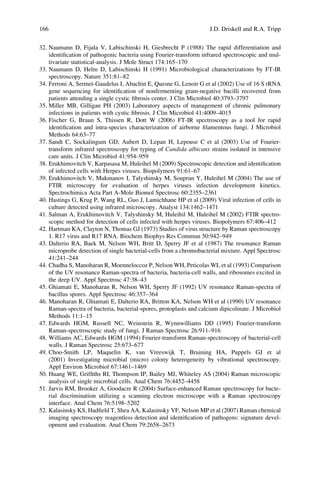
from PHB. Second, flagella or pilus fibers were determined to contribute to spectral
heterogeneity. Vigorous vortexing and subsequent centrifugation removes the
fibers to significantly improve spectral reproducibility and classification results
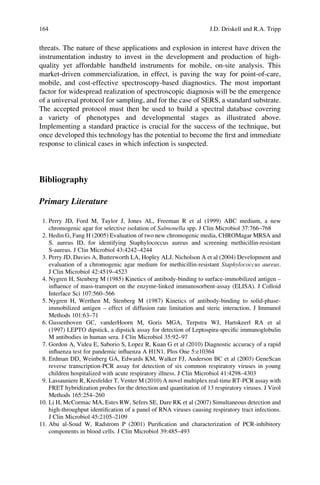
(Fig. 7.1). Third, the classification algorithm significantly affects the classification
results. The authors show that hierarchical clustering algorithms (HCA) discrimi-
nate between reference and clinical strains rather than based on bacterial identity.
Advanced methods, such as ANN, that determine spectral variables that vary only
as a result of the bacteria was necessary to correctly classify according to strain.
This example work demonstrates the power of IR-based diagnostics, but suggests
that these methods may require problem-specific standardization of experimental
protocols and data analysis.
These groundbreaking efforts to develop IR for bacterial analysis have led to the
realization that spectroscopic methods have advantages for exploring detection of
other pathogens. For example, FTIR has been employed for the distinction of yeast
and fungi with success [36, 37]. More recently IR has been investigated as a method
154 J.D. Driskell and R.A. Tripp](https://image.slidesharecdn.com/infectiousdiseases-130528055611-phpapp02/85/Infectious-diseases-8-320.jpg)
![ArbitraryunitsArbitraryunitsArbitraryunitsArbitraryunits
a
b
0.040
0.020
0.000
−0.020
−0.040
0.040
0.020
0.000
−0.020
0.040
0.020
0.000
−0.020
−0.040
0.040
0.060
0.020
0.000
−0.020
−0.040
B. cenocepacia isolate 69
B. cenocepacia isolate 57
B. cenocepacia isolate 69
1500 1400 1300 1100 1000 900 8001200
1500 1450 1400 13001350 11001150 10001050 900950 85012001250
1500 1450 1400 13001350 11001150 10001050 900950 85012001250
Wavenumber (cm−1
)
Wavenumber (cm−1
)
Wavenumber (cm−1
)
1500 1450 1400 13001350 11001150 10001050 900950 80085012001250
Wavenumber (cm−1
)
B. cenocepacia isolate 57
Fig. 7.1 Vector-normalized first-derivative spectra of two B. cenocepacia clinical isolates (isolates
57 and 69) in the 1,500–800 cm–1
range. (a) The heterogeneity of 15 replicate measurements for each
strain in the spectral ranges of 1,200–900 cmÀ1
and 1,500–1,300 cmÀ1
and the corresponding
micrographs obtained by TEM are shown. (b) Vector-normalized first-derivative spectra measured
after vortexing of similar cells at the maximum intensity for 15 min and subsequent centrifugation at
8,000 Â g for 5 min to separate the cells from free pilus appendages in the supernatants. Micrographs
of the cells obtained by TEM after they were vortexed without centrifugation show the small
fragments of pili or fibers suspended in the supernatants (From [26])](https://image.slidesharecdn.com/infectiousdiseases-130528055611-phpapp02/85/Infectious-diseases-9-320.jpg)
![to detect viral infections, although current experiments are limited to viral infection
of cells in culture [38–41]. While mock-infected and herpes simplex virus type
1-infected Vero cells are readily distinguished via IR, infection-induced spectral
changes are inconsistent [39, 40]. Thus, substantially more research effort is
necessary to standardize protocols and correlate the spectral response to the bio-
chemical response upon infection.
Reports continue to support the utility of FTIR-based diagnostics in the clinical
laboratory, but there are certain limitations to consider. First, water is a particularly
strong absorber of IR light. Thus, care must be taken to completely dehydrate the
sample prior to data acquisition. This obviously does not prevent IR-based
diagnostics, it is merely an inconvenience. Second, IR absorption spectroscopy is
not an inherently sensitive method and trace levels of a pathogen are not readily
apparent. Hence, clinical samples will likely require a culture step to generate
sufficient biomass for IR analysis. As noted above, this sample enrichment can be
as short as 5 h, and with IR data acquisition on the order of minutes, the total
analysis time is still more rapid, less labor intensive, and more informative in many
cases than conventional diagnostic methods and does not require species-specific
reagents.
Raman Spectroscopy
Raman spectroscopy is a scattering technique, in which the sample is irradiated
with a monochromatic light source, almost always a laser. The majority of the
scattered photons are elastically scattered and maintain the same frequency as the
excitation source; however, a small fraction of the photons are shifted in frequency
relative to the excitation source. The difference in the energy between the excitation
and inelastically, i.e., Raman, scattered photons correspond to the energy necessary
to bring about a transition from one vibrational state to an excited vibrational state.
Thus, much like IR spectroscopy, Raman spectra provide insight into the chemical
structure, local environment, geometry, and conformation of the sample and can
serve as a whole-organism fingerprinting method. Selection rules also govern which
vibrations are Raman active. These rules require a change in the polarizability
during the vibration to be Raman active. Thus, Raman spectra are dominated by
symmetrical vibrations and the technique is often seen as a complementary rather
than competing technique with IR spectroscopy. However, for application to the
analysis of biological materials and whole-organism fingerprinting methods,
Raman offers many inherent advantages over IR spectroscopy.
Because of the selection rules, the main chain and aromatic side chains of
peptides rather than aliphatic side chains are probed via Raman scattering in
contrast to IR. Raman bands of nucleic acids are limited to heterocyclic bases or
phosphodiester groups making up the backbone. Raman bands are narrower and
less likely to overlap, thus the spectra are much less complicated compared to IR
spectra because of the many more nonsymmetric vibrations that are possible.
156 J.D. Driskell and R.A. Tripp](https://image.slidesharecdn.com/infectiousdiseases-130528055611-phpapp02/85/Infectious-diseases-10-320.jpg)
![Another major advantage of Raman is that water does not interfere since its
vibrations do not fit the selection rules criteria. This is an extremely important
consideration when analyzing biological samples which are endemic to aqueous
environments. Other advantages of Raman include the flexibility to analyze
samples in any state, e.g., gas, liquid, or solid, and the ability to analyze small
sample volumes and masses because of the tight focus of incident laser light (square
microns) compared to the incident IR beams (square centimeters).
Viruses were the first infectious agent analyzed by Raman spectroscopy,
although not in a diagnostic capacity [42]. In this first work, Raman spectroscopy
was used to probe the RNA and protein structure upon viral packaging. In the
1970s, Raman spectroscopy suffered from poor sensitivity due to instrument
limitations. The first evaluation of Raman spectroscopy for pathogen detection
was not until 1987 when spectra were collected for five species of bacteria includ-
ing E. coli, P. fluorescens, S. epidermidis, B. subtilis, and E. cloacae [43]. To
overcome the limited sensitivity of the instruments at the time, an ultraviolet laser
was used for excitation to enhance spectral features of RNA, DNA, tyrosine, and
tryptophan via resonance Raman. Unique spectra were observed for each bacte-
rium, although analysis relied on visual interpretation since chemometrics had not
been implemented for spectral analysis yet. UV Raman instruments, while produc-
ing the requisite sensitivity for pathogen analysis, is quite expensive and non-
resonant vibrations are not observed which results in a significant loss in informa-
tion that is valuable for differentiation.
Despite the recognized benefits of Raman-based diagnostics, particularly when
compared to conventional and IR-based diagnostics, instrumentation has limited
the maturation of Raman-based diagnostics. After development of UV Raman for
pathogen detection [43–46], Fourier transform Raman (FT-Raman) instruments
were introduced for microbiological studies which increased instrument sensitivity
[47, 48]. Raman instruments have now evolved to include NIR lasers to reduce
fluorescence from biological and NIR-sensitive CCD detectors. These modern
instruments have only been developed in this decade to fully explore the potential
of Raman as a diagnostic technique [49–55]. Thus Raman-based whole-organism
fingerprinting is less developed than IR-based methods and examples are generally
limited to the analysis of laboratory cultures.
In an early study, Maquelin et al. [54] utilized Raman spectroscopy to directly
analyze five bacterial strains, including three strains of Staphylococcus spp., E. coli,
and E. faecium, on solid culture medium. The flexibility in sample type afforded by
Raman spectroscopy allowed direct measurement on the culture plate that would
not be possible using IR spectroscopy. The background Raman spectrum resulting
from the culture medium was subtracted from those spectra collected from the
bacterial microcolonies. Hierarchical cluster analysis yielded two major groupings,
one consisting of the three Staphylococcus strains and one consisting of the E. coli
and E. faecium. The E. coli and E. faecium spectra clearly grouped according to
species within the latter subcluster while spectra in the Staphylococcus subcluster
grouped according to strain. While chemometric analysis of these spectra collected
from same-day cultures yielded a successful classification rate of 100% for external
7 Infectious Diseases, Vibrational Spectroscopic Approaches to Rapid Diagnostics 157](https://image.slidesharecdn.com/infectiousdiseases-130528055611-phpapp02/85/Infectious-diseases-11-320.jpg)
![validation samples, combined data collected from 3 days dropped the accuracy to 83%
for classification of two S. aureus strains (ATCC 29213 and UHR 28624). However,
these two strains are extremely similar and in general the results demonstrate the utility
of Raman-based diagnostics.
The most rigorous evaluation of Raman spectroscopy for reagentless detection
and identification of pathogens was performed in collaboration with a US govern-
ment laboratory. In this work, a comprehensive library of Raman spectra has been
established for over 1,000 species, including 281 CDC category A and B biothreats,
146 chemical threats, 310 environmental interferents, and numerous others [52].
Spectral signatures were collected using Raman chemical imaging spectroscopy
(RCIS) [56]. RCIS technology combines digital imaging and Raman spectroscopy.
Digital imaging automatically discriminates against background particulates and
identifies regions of interest on a sample platform that are then targeted for Raman
analysis. Sample analysis is faster and completely automated using this approach.
Two commercially available instruments were tested, one in the laboratory
(ChemImage Corp., Falcon) and the other in the field (ChemImage Corp., Eagle).
To test the robustness of the Raman spectral library and classification scheme,
blinded samples containing one of four Bacillus strains were analyzed and
identified. The predictive performance ranged from 89.4% to 93.1% for these
closely related bacteria. It was concluded that key to the success of this diagnostic
approach is the extensiveness of the spectral library. There are many more bacterial
phenotypes than genotypes, and it has been found that Raman fingerprints correlate
with cell phenotype, thus an all-inclusive library must contain spectra for each
bacterial strain grown under different conditions and at different stages of develop-
ment. In a subsequent study untrained personnel at the Armed Forces Institute of
Pathology evaluated 14 bacteria to generate a spectral library and sent 20 blinded
samples to ChemImage for external validation in which all 20 samples were
correctly identified. This comprehensive study is the first to establish the true utility
of automated Raman-based diagnostics carried out off-site by untrained personnel.
However, these samples were prepared in water, cell culture media, or spiked nasal
swabs, none of which are truly clinical samples.
An early study to evaluate clinical samples for Acinetobacter by Raman
spectroscopy and compare the results with an established diagnostic method
were among the first showing the power and speed of Raman-based detection
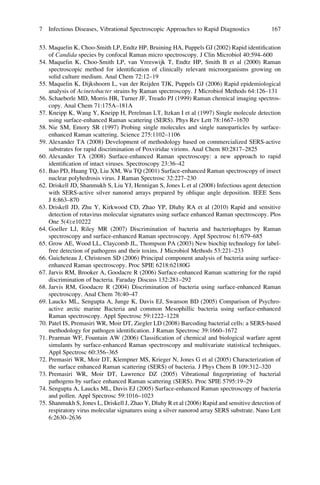
[55]. In this study, 25 Acinetobacter isolates from five hospitals in three countries
were analyzed using selective amplification of restriction fragments (AFLP), an
established molecular technique for typing bacteria strains. Dendograms
resulting from the hierarchical cluster analysis of Raman and AFLP fingerprints
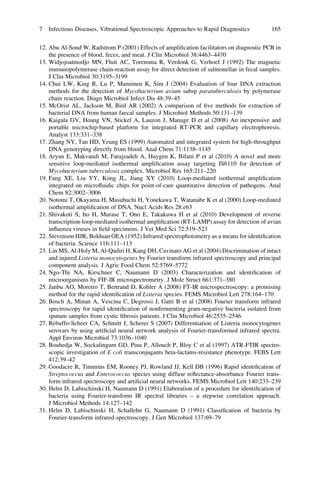
for the isolates were generated and compared (Fig. 7.2). Both dendograms
resulted in five clusters that separate the strains according to the five outbreaks,
with the exception of one Basildon isolate RUH 3242 which clustered with
isolates from Venlo in the Raman-based dendogram. Overall results from
Raman fingerprinting of these clinical isolates were very similar to those
obtained for established methods, but with the advantage of faster analysis and
less complicated procedures.
158 J.D. Driskell and R.A. Tripp](https://image.slidesharecdn.com/infectiousdiseases-130528055611-phpapp02/85/Infectious-diseases-12-320.jpg)
![40506070
Similarity(a.u.)
8090100
RUH1947
RUH1945
RUH1942
RUH1944
RUH1946
RUH3417
RUH3418
RUH3420
RUH3421
RUH3419
RUH3374
RUH3370
RUH3371
RUH3372
RUH3373
RUH3349
RUH3348
RUH3344
RUH3242
RUH3347
RUH2032
RUH2034
RUH2033
RUH2036
RUH2037
RUH1947
RUH1945
RUH1942
RUH1946
RUH1944
RUH3417
RUH3419
RUH3418
RUH3420
RUH3421
RUH3370
RUH3373
RUH3371
RUH3372
RUH3374
RUH3349
RUH3347
RUH3348
RUH3244
RUH3342
RUH2033
RUH2032
RUH2036
RUH2037
RUH2034
DNAgroup3
(DenHaag)
DNAgroup13
(Odense)
A.baumannii
(Newcastle)
A.baumannii
(Basildon)
A.baumannii
(Venlo)
Dissimilarity(a.u.)
024681012141618
Fig.7.2Dendrogramsresultingfromthehierarchicalclusteranalysisof(left)AFLPanalysisand(right)Ramananalysisoftheisolates.Theasteriskmarks
thestrainRUH3242misclassifiedviaRamanfingerprinting(From[55])
7 Infectious Diseases, Vibrational Spectroscopic Approaches to Rapid Diagnostics 159](https://image.slidesharecdn.com/infectiousdiseases-130528055611-phpapp02/85/Infectious-diseases-13-320.jpg)
![Despite the advancement of Raman spectroscopy instrumentation and methods
for pathogen fingerprinting, Raman is still often limited by poor sensitivity. Only
$1 in 106
–108
photons are inelastically scattered as the vast majority are elastically
scattered. This means that high quality spectra with the requisite signal-to-noise can
take minutes to acquire. While this may not be a limitation in laboratory
experiments, or developmental stages in research, it prohibits its usefulness in
clinical diagnostic laboratories which analyze hundreds to thousands of samples
per day. Thus, there is great interest in enhancing the Raman signal. One such
method is to excite the sample with a frequency that resonates with an electronic
transition, so called resonance Raman spectroscopy. For biological samples, this
requires UV lasers for excitation, and as noted above, is cost prohibitive to
widespread adoption of this method. Moreover, chemical information is lost
when performing resonance Raman which would likely reduce classification accu-
racy of closely related pathogens. An alternative method to amplify Raman scatter-
ing is surface-enhanced Raman spectroscopy (SERS). SERS has received a great
deal of attention, particularly with respect to whole-organism fingerprinting and is
the subject of the next section.
SERS
Surface-enhanced Raman spectroscopy is a technique in which the Raman signal of
a sample is significantly amplified via adsorption onto a metallic nanostructured
surface. A laser excitation frequency is selected such that it is in resonance with the
collective oscillation of the conduction electrons in the nanostructures, i.e., surface
plasmon resonance. When resonance conditions are met, the local electromagnetic
field experienced by molecules in close proximity to the surface is significantly
increased to yield rather large enhancements in the Raman scattering. While the
signal enhancement is substrate and sample dependent, typical enhancements are
on the order of 104
–1014
with respect to normal Raman intensities, with several
studies reporting the detection of single molecules using this technique [57, 58].
SERS offers the benefits of normal Raman compared to IR spectroscopy while
providing a markedly improved sensitivity. Recent advances in nanofabrication
methods and SERS theory has led to significant improvements in SERS substrates
in the last several years and has driven increased efforts to develop SERS for whole-
organism fingerprinting [59–78].
The major focus of whole-organism fingerprinting via SERS has been on
bacteria identification [51, 64–74, 77, 78]. Most of these studies report differentia-
tion among bacteria species, with many demonstrating discrimination of different
strains of the same species. However, there are several inconsistencies that have
been noted by researchers, particularly in the earlier studies. For example, Grow
et al. found SERS spectra for strains that belong to the same species were some-
times less similar than spectra collected from different species [65], and Jarvis and
Goodacre observed similar spectra for the same bacteria using different
160 J.D. Driskell and R.A. Tripp](https://image.slidesharecdn.com/infectiousdiseases-130528055611-phpapp02/85/Infectious-diseases-14-320.jpg)
![preparations of silver nanoparticles, but noted subtle changes in signal intensities
among nanoparticle batches [68]. These discrepancies evident in these early studies
highlight the primary challenge of SERS-based diagnostics, i.e., the enhancing
substrate. The SERS signal is highly dependent on the enhancing substrate, thus
a reliable means of fabricating nanostructured materials is vital to the success of
SERS-based diagnostics.
Several research laboratories have analyzed and published SERS spectra for
both Bacillus subtilis and E. coli; however, each reported incongruent spectral
fingerprints [67, 68, 71, 72]. The experimental protocols, however, varied among
each study. For example, in two different reports Jarvis et al. used two different
chemical synthesis preparations to generate colloidal silver, citrate reduction [67]
and borohydride reduction [51], to serve as the SERS substrate. The SERS spectra
were drastically different in each study. It is well known that spectra are dependent
on the enhancing nanostructure, e.g., material, size, shape, interparticle spacing,
etc., but given the same final nanostructure similar spectra were expected. The
authors attributed the differences to the effect of diverse chemistries used to prepare
each silver colloid [79]. However, it should be noted that different excitation
sources, 7 nm and 785 nm, were employed in the two studies. For normal Raman,
the Raman shifts should be independent of the excitation source, thus spectral
fingerprinting should not be affected by the choice of the laser. SERS spectra,
however, can be influenced by the excitation source because of the requisite pairing
of the excitation frequency and plasmon resonance of the substrate. Therefore, it is
perhaps more probable that spectral differences observed by Jarvis et al. are due to
greater signal enhancement for the 7 nm excitation source rather than due to
differences in chemical preparation of the colloidal silver. This interpretation is
supported by a study in which a third variation in experimental parameters was
implemented utilizing citrate-reduced silver colloid but acquired spectra with
a 647 nm laser [71]. Results from this study closely resembled the results for B.
subtilis obtained by Jarvis et al. employing borohydride reduced silver
nanoparticles and 7 nm excitation. Collectively, these studies also demonstrate
the need for procedural consistency.
In a pivotal study, scientists at a US Army research laboratory evaluated the
SERS signatures for many bacteria using a standardized sampling protocol and
instrumentation. To date, three SERS substrates were directly compared using the
standardized protocol: silver nanoparticles, silver film over nanospheres (FONS),
and commercially available Klarite. Interaction between substrate and bacteria vary
significantly as visualized with electron microscopy which likely results in different
spectral fingerprints. Moreover the signal intensities varied significantly among the
substrates reflecting differences in enhancing quality. Details of these experiments
are approved for public release as a technical report (ARL-TR-4957).
In another key study, SERS and Raman fingerprints were directly compared to
assess the advantages of SERS analysis [72]. Raman and SERS spectra were
collected for several bacteria, including four strains of Bacillus, S. typhimurium,
and E. coli. As noted above, the substrate is a critical factor in SERS analysis, and in
this study aggregated gold nanoparticle films were grown in-house and established
7 Infectious Diseases, Vibrational Spectroscopic Approaches to Rapid Diagnostics 161](https://image.slidesharecdn.com/infectiousdiseases-130528055611-phpapp02/85/Infectious-diseases-15-320.jpg)
![as a reliable means of substrate preparation for acquisition of repeatable spectra. As
anticipated, SERS yielded much greater signal-to-noise spectra compared to normal
Raman. The study also identified two unexpected benefits of SERS. Normal Raman
signal for Bacillus species was overwhelmed by native fluorescence of the sample;
however, in the SERS analysis, the metal substrate functioned to quench the
fluorescence component in addition to enhancing the Raman signal. It was also
observed that normal Raman spectra are more complex than SERS spectra. This is
explained by the fact that bulk Raman interrogates all components throughout the
entire bacterium equally, while the distance-dependence of SERS enhancement
preferentially probes the region of the bacterium closest to the metal substrate and
bands for the internal components are not detected. Fortunately, most chemical
variation among bacterial strains and species are expressed on the cell surface, thus
greater spectral differences are observed among SERS spectra of different samples
than compared to bulk Raman spectra. This added advantage is exemplified by
greater discrimination of bacteria when utilizing SERS spectra as compared to
Raman spectra [72].
A number of novel nanofabrication methods have recently emerged for produc-
ing SERS substrates with the potential for addressing the issues noted above due to
substrate heterogeneity. These include electron beam lithography [80, 81],
nanosphere lithography [82–84], a template method [85–88], oblique angle vapor
deposition (OAD) [89–91], and a proprietary wet-etching technology used to
produce commercially available Klarite (D3 technologies). It should be noted,
however, that with the exception of OAD and Klarite, these fabrication methods
are not adaptable to large-scale production due to the complexity of the fabrication
procedure. Not only is it likely that these substrates will lead to significant advances
in SERS-diagnostics of bacteria, the use of OAD and Klarite substrates has already
lead to successful application to virus identification [59, 60, 62, 63, 75, 76].
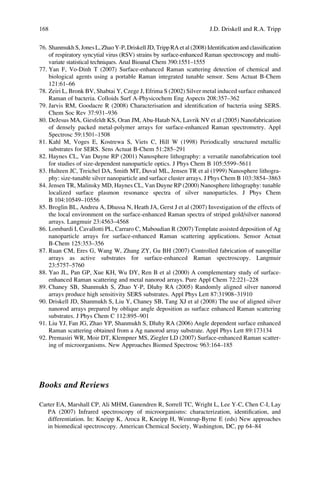
In the most recent investigation of SERS-based viral fingerprinting, eight strains
of rotavirus were analyzed [63]. These isolates were recovered from clinical fecal
samples and propagated in MA104 cells and represent the 5 G and 3 P genotypes
responsible for the most severe infections. Unique SERS fingerprints were acquired
for each strain when adsorbed onto OAD-fabricated silver nanorods. Representative
spectra for each strain and negative control, as well as the difference spectra which
subtract out the background cell lysate signal are displayed in Fig. 7.3. Classifica-
tion algorithms based on partial least squares discriminant analysis were
constructed to identify the samples according to (1) rotavirus positive or negative,
(2) P4, P6, or P8 genotype, (3) G1, G2, G3, G4, or G9 genotype, or (4) strain.
Respectively, these four classification models resulted in 100%, 98–100%,
96–100%, and 100% sensitivity and 100%, 100%, 99–100%, and 99–100%
specificity.
Compilation and critical analysis of reports to date demonstrate the potential of
Raman-based diagnostics and its advantages over IR, normal Raman spectroscopy,
and convention diagnostic methods, but also highlight the need for standardization.
The challenge in the future is standardization of substrates and sampling protocols
since background can “quench” signal from the analyte. For example, blood
162 J.D. Driskell and R.A. Tripp](https://image.slidesharecdn.com/infectiousdiseases-130528055611-phpapp02/85/Infectious-diseases-16-320.jpg)
![analysis requires sample processing to remove some competing elements [92], yet
SERS spectra highly dependent on the sample pretreatment procedure as remaining
chemical species will also contribute signal and degrade the performance of
matching in spectral library databases. The outlook of SERS is not a question of
spectral quality and reproducibility in a controlled environment, the question is how
to control the environment across laboratories.
Future Directions
The future of spectroscopic-based diagnostics is bright as demonstrated by the
many studies cited and discussed above. In addition to the success found in these
studies, areas of improvement have also been identified. An important area of
potential development is the methods used for statistical analysis. Well-established
algorithms such as PCA, HCA, and discriminant analysis continue to provide high
predictive accuracy, but recent examples have shown that more creative and novel
approaches such as artificial neural networks, “bar-coding” [70], or innovative uses
of PLS [59] can further improve the predictive value. A revolution in instrumenta-
tion is also occurring. Vibrational spectroscopy has recently filled niches in quality
control of pharmaceuticals and raw materials as well as identification of chemical
YO
a b
Wa
ST-3
S2
RV5
RV4
RV3
F45
MA104
YO
Wa
ST-3
S2
RV5
RV4
RV3
F45
400 600 800 1000 1200 1400 1600 1800
Raman Shift (cm−1)
400 600 800 1000 1200 1400 1600 1800
Raman Shift (cm−1)
Fig. 7.3 (a) Average SERS spectra for eight strains of rotavirus and the negative control (MA104
cell lysate). Spectra were baseline corrected, normalized to the band at 633 cmÀ1
, and offset for
visualization. (b) Difference SERS spectra for eight strains after subtraction of MA104 spectrum
(From [63])
7 Infectious Diseases, Vibrational Spectroscopic Approaches to Rapid Diagnostics 163](https://image.slidesharecdn.com/infectiousdiseases-130528055611-phpapp02/85/Infectious-diseases-17-320.jpg)


This document discusses the importance of rapid diagnosis of infectious diseases and summarizes current diagnostic methods and their limitations. Classical culture-based diagnostics are time-consuming and cannot identify all pathogens. Antibody-based diagnostics like ELISA and lateral flow tests are faster but have limitations in sensitivity and specificity due to their reliance on pathogen-specific reagents. Molecular diagnostics like PCR are highly sensitive and specific but require specialized equipment and skilled technicians, limiting their use outside centralized laboratories. Vibrational spectroscopic approaches that generate biochemical fingerprints of whole pathogens offer a promising alternative as they can provide rapid, reagent-free identification of infectious agents.