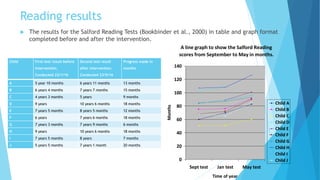
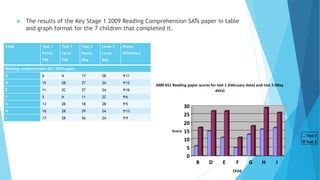
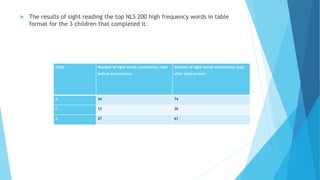
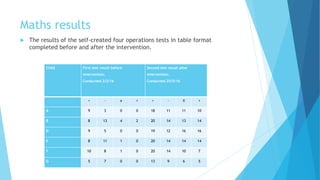
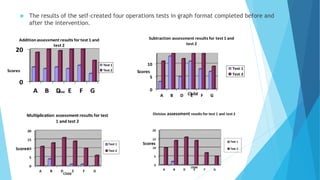
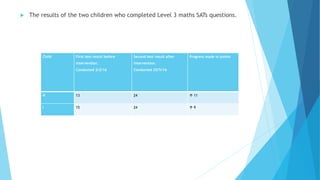
What impact do
individualized teaching
sessions have on
learners with special
needs?
By Jo Whiting
Context
 This study took place in a primary school in East
Northamptonshire, specifically for children with special
educational needs.
 The school caters for children who have a range of
disabilities, from those with profound and multiple needs
to those with moderate learning difficulties.
 The class in which the study was based consisted of 10 key
Stage 2 pupils, all of whom have moderate learning
difficulties including children with Autistic Spectrum
Disorder, Attention Deficit Hyperactivity Disorder, Global
Learning Delay and general learning difficulties.
Aims of the study
 When the children within my class were not making
sufficient progress due to their poor retention skills, a
new programme of study was developed and utilised each
morning to rehearse and consolidate on reading and maths
skills.
 The aim of this study was to determine effects of an
intervention which would not only enhance the children’s
maths and reading abilities, but also positively impact on
the children’s views of self-efficacy.
Research Design
 Each programme of study consisted of two reading
exercises and a maths task completed independently and
set according to the level of the child.
 The children completed their work for approximately 50
minutes for four mornings a week.
 Reading and maths tests were issued before and after the
intervention to assess the impact the intervention had.
 The children were interviewed using a semi-structured
format before and after the intervention to establish their
self-efficacy views.
Reading results
 The results for the Salford Reading Tests (Bookbinder et al., 2000) in table and graph format
completed before and after the intervention.
Child First test result before
intervention.
Conducted 22/1/16
Second test result
after intervention.
Conducted 23/5/16
Progress made in
months
A 5 year 10 months 6 years 11 months 13 months
B 6 years 4 months 7 years 7 months 15 months
C 4 years 3 months 5 years 9 months
D 9 years 10 years 6 months 18 months
E 7 years 5 months 8 years 5 months 12 months
F 6 years 7 years 6 months 18 months
G 7 years 3 months 7 years 9 months 6 months
H 9 years 10 years 6 months 18 months
I 7 years 5 months 8 years 7 months
J 5 years 5 months 7 years 1 month 20 months
A line graph to show the Salford Reading
scores from September to May in months.
0
20
40
60
80
100
120
140
Sept test Jan test May test
Time of year
Months
Child A
Child B
Child C
Child D
Child E
Child F
Child G
Child H
Child I
Child J
 The results of the Key Stage 1 2009 Reading Comprehension SATs paper in table
and graph format for the 7 children that completed it.
Child Test 1
Points
Feb
Test 1
Level
Feb
Test 2
Points
May
Level 2
Level
May
Points
Difference
Reading comprehension KS1 2009 paper.
B 6 N 17 2B 11
D 15 2B 27 2A 12
E 11 2C 27 2A 16
F 5 N 11 2C 6
G 13 2B 18 2B 5
H 16 2B 29 2A 13
I 17 2B 26 2A 9
0
5
10
15
20
25
30
Score
B D E F G H I
Child
2009 KS1 Reading paper scores for test 1 (February data) and test 2 (May
data)
Test 1
Test 2
 The results of sight reading the top NLS 200 high frequency words in table
format for the 3 children that completed it.
Child Number of sight words consistently read
before intervention
Number of sight words consistently read
after intervention
A 34 74
C 12 26
J 27 61
Maths results
 The results of the self-created four operations tests in table format
completed before and after the intervention.
Child First test result before
intervention.
Conducted 2/2/16
Second test result after
intervention.
Conducted 25/5/16
+ - x ÷ + - X ÷
A 9 3 0 0 18 11 11 10
B 8 13 4 2 20 14 13 14
D 9 5 0 0 19 12 16 16
E 8 11 1 0 20 14 14 14
F 10 8 1 0 20 14 10 7
G 5 7 0 0 13 9 6 5
 The results of the self-created four operations tests in graph format completed before and
after the intervention.
0
20
A B D E F G
Scores
Child
Addition assessment results for test 1 and
test 2
Test 1
Test 2
0
5
10
A B D E F G
Scores
Child
Subtraction assessment results for test 1 and
test 2
Test 1
Test 2
 The results of the two children who completed Level 3 maths SATs questions.
Child First test result before
intervention.
Conducted 2/2/16
Second test result after
intervention.
Conducted 25/5/16
Progress made in points
H 13 24  11
I 15 24  9
Self-efficacy interview results
 Nine out of ten children felt they had improved in reading over
the year and one child was unsure.
 When children were asked why they thought that had
improved, four sub-themes surfaced: practicing, reading (3
children), the individual programmes of study, (2 children),
moving up to the next level on their individual reading book, (3
children), and unsure why, including the child who was unsure if
they had improved or not (2 children).
 All of the children in maths felt that they had improved or ‘got
better’ over the course of the year. Interestingly, half of the
children attributed this to the individual programmes of study.
Conclusions (1 of 2)
 The results suggest that the individual programme of
studies had a positive impact on the reading, maths and
self-efficacy views of the children within the study.
 When conducting research in any naturalistic
environment, it is a challenge to isolate variable and
therefore establishing their impacts is not clear (Kamil et
al., 2011), although the data produced in this study are
more ecologically sound than those produced in laboratory
settings.
 In this study, the impact the intervention had on the
children’s reading progress was more apparent as all of
the reading took place was during the times of the
intervention and rarely during other lessons.
Conclusions (2 of 2)
 Similarly, the maths tests conducted also revealed that
the children made good progress when comparing the
initial tests completed before and after the intervention.
 However, trying to establish impact is significantly more
challenging when analysing the test scores as the maths
lessons that were taught throughout the year involved
many aspects of number and therefore the intervention
alone is unlikely to be solely responsible for the
improvement that children made.
 Although the individual programmes of study cannot be
solely attributed to the children’s progress as a result of
the naturalistic environment the study took place in, it is
likely to have contributed to the progress the children
made and their improved self-perception.
References
 Banks, M. (2007). Using visual data in qualitative research. Los Angeles: SAGE.
 Bookbinder, G. E., Vincent, D., & Crumpler, M. (2000). SSRT: Salford sentence reading test (revised).
London: Hodder & Stoughton.
 Cohen, L., Manion, L., & Morrison, K. (2011). Research methods in education. London: Routledge.
 Department for Education (2013) The National Curriculum in England: Key Stages 1 and 2
framework document. Available at: https://www.gov.uk/government/publications/national-
curriculum-in-england-primary-curriculum (Accessed: 12th December 2016).
 Hattie, J. (2009). Visible learning: A synthesis of over 800 meta-analyses relating to achievement.
London and New York: Routledge.
 McLaughlin, J. A. (2004). Research and evaluation methods in special education. Thousand Oaks,
Calif: Corwin Press.
 Mitchell, D. R. (2008). What really works in special and inclusive education: using evidence-based
teaching strategies. London: Routledge.
 Siegel, B. (2003). Helping children with autism learn: Treatment approaches for parents and
professionals. Oxford: Oxford University Press.
 Silverman, D. (2011). Interpreting qualitative data: A guide to the principles of qualitative
research. London: SAGE Publications.
 Tilstone, C., & Layton, L. (2004). Child development and teaching pupils with special educational
needs. London: Routledge Falmer.
 Wood, P., & Smith, J. (2016). Educational Research: Taking the Plunge. Carmarthen: Independent
Thinking Press Limited.

Individualized teaching session on learners with special needs joanne whiting

  • 1.
    What impact do individualizedteaching sessions have on learners with special needs? By Jo Whiting
  • 2.
    Context  This studytook place in a primary school in East Northamptonshire, specifically for children with special educational needs.  The school caters for children who have a range of disabilities, from those with profound and multiple needs to those with moderate learning difficulties.  The class in which the study was based consisted of 10 key Stage 2 pupils, all of whom have moderate learning difficulties including children with Autistic Spectrum Disorder, Attention Deficit Hyperactivity Disorder, Global Learning Delay and general learning difficulties.
  • 3.
    Aims of thestudy  When the children within my class were not making sufficient progress due to their poor retention skills, a new programme of study was developed and utilised each morning to rehearse and consolidate on reading and maths skills.  The aim of this study was to determine effects of an intervention which would not only enhance the children’s maths and reading abilities, but also positively impact on the children’s views of self-efficacy.
  • 4.
    Research Design  Eachprogramme of study consisted of two reading exercises and a maths task completed independently and set according to the level of the child.  The children completed their work for approximately 50 minutes for four mornings a week.  Reading and maths tests were issued before and after the intervention to assess the impact the intervention had.  The children were interviewed using a semi-structured format before and after the intervention to establish their self-efficacy views.
  • 5.
    Reading results  Theresults for the Salford Reading Tests (Bookbinder et al., 2000) in table and graph format completed before and after the intervention. Child First test result before intervention. Conducted 22/1/16 Second test result after intervention. Conducted 23/5/16 Progress made in months A 5 year 10 months 6 years 11 months 13 months B 6 years 4 months 7 years 7 months 15 months C 4 years 3 months 5 years 9 months D 9 years 10 years 6 months 18 months E 7 years 5 months 8 years 5 months 12 months F 6 years 7 years 6 months 18 months G 7 years 3 months 7 years 9 months 6 months H 9 years 10 years 6 months 18 months I 7 years 5 months 8 years 7 months J 5 years 5 months 7 years 1 month 20 months A line graph to show the Salford Reading scores from September to May in months. 0 20 40 60 80 100 120 140 Sept test Jan test May test Time of year Months Child A Child B Child C Child D Child E Child F Child G Child H Child I Child J
  • 6.
     The resultsof the Key Stage 1 2009 Reading Comprehension SATs paper in table and graph format for the 7 children that completed it. Child Test 1 Points Feb Test 1 Level Feb Test 2 Points May Level 2 Level May Points Difference Reading comprehension KS1 2009 paper. B 6 N 17 2B 11 D 15 2B 27 2A 12 E 11 2C 27 2A 16 F 5 N 11 2C 6 G 13 2B 18 2B 5 H 16 2B 29 2A 13 I 17 2B 26 2A 9 0 5 10 15 20 25 30 Score B D E F G H I Child 2009 KS1 Reading paper scores for test 1 (February data) and test 2 (May data) Test 1 Test 2
  • 7.
     The resultsof sight reading the top NLS 200 high frequency words in table format for the 3 children that completed it. Child Number of sight words consistently read before intervention Number of sight words consistently read after intervention A 34 74 C 12 26 J 27 61
  • 8.
    Maths results  Theresults of the self-created four operations tests in table format completed before and after the intervention. Child First test result before intervention. Conducted 2/2/16 Second test result after intervention. Conducted 25/5/16 + - x ÷ + - X ÷ A 9 3 0 0 18 11 11 10 B 8 13 4 2 20 14 13 14 D 9 5 0 0 19 12 16 16 E 8 11 1 0 20 14 14 14 F 10 8 1 0 20 14 10 7 G 5 7 0 0 13 9 6 5
  • 9.
     The resultsof the self-created four operations tests in graph format completed before and after the intervention. 0 20 A B D E F G Scores Child Addition assessment results for test 1 and test 2 Test 1 Test 2 0 5 10 A B D E F G Scores Child Subtraction assessment results for test 1 and test 2 Test 1 Test 2
  • 10.
     The resultsof the two children who completed Level 3 maths SATs questions. Child First test result before intervention. Conducted 2/2/16 Second test result after intervention. Conducted 25/5/16 Progress made in points H 13 24  11 I 15 24  9
  • 11.
    Self-efficacy interview results Nine out of ten children felt they had improved in reading over the year and one child was unsure.  When children were asked why they thought that had improved, four sub-themes surfaced: practicing, reading (3 children), the individual programmes of study, (2 children), moving up to the next level on their individual reading book, (3 children), and unsure why, including the child who was unsure if they had improved or not (2 children).  All of the children in maths felt that they had improved or ‘got better’ over the course of the year. Interestingly, half of the children attributed this to the individual programmes of study.
  • 12.
    Conclusions (1 of2)  The results suggest that the individual programme of studies had a positive impact on the reading, maths and self-efficacy views of the children within the study.  When conducting research in any naturalistic environment, it is a challenge to isolate variable and therefore establishing their impacts is not clear (Kamil et al., 2011), although the data produced in this study are more ecologically sound than those produced in laboratory settings.  In this study, the impact the intervention had on the children’s reading progress was more apparent as all of the reading took place was during the times of the intervention and rarely during other lessons.
  • 13.
    Conclusions (2 of2)  Similarly, the maths tests conducted also revealed that the children made good progress when comparing the initial tests completed before and after the intervention.  However, trying to establish impact is significantly more challenging when analysing the test scores as the maths lessons that were taught throughout the year involved many aspects of number and therefore the intervention alone is unlikely to be solely responsible for the improvement that children made.  Although the individual programmes of study cannot be solely attributed to the children’s progress as a result of the naturalistic environment the study took place in, it is likely to have contributed to the progress the children made and their improved self-perception.
  • 14.
    References  Banks, M.(2007). Using visual data in qualitative research. Los Angeles: SAGE.  Bookbinder, G. E., Vincent, D., & Crumpler, M. (2000). SSRT: Salford sentence reading test (revised). London: Hodder & Stoughton.  Cohen, L., Manion, L., & Morrison, K. (2011). Research methods in education. London: Routledge.  Department for Education (2013) The National Curriculum in England: Key Stages 1 and 2 framework document. Available at: https://www.gov.uk/government/publications/national- curriculum-in-england-primary-curriculum (Accessed: 12th December 2016).  Hattie, J. (2009). Visible learning: A synthesis of over 800 meta-analyses relating to achievement. London and New York: Routledge.  McLaughlin, J. A. (2004). Research and evaluation methods in special education. Thousand Oaks, Calif: Corwin Press.  Mitchell, D. R. (2008). What really works in special and inclusive education: using evidence-based teaching strategies. London: Routledge.  Siegel, B. (2003). Helping children with autism learn: Treatment approaches for parents and professionals. Oxford: Oxford University Press.  Silverman, D. (2011). Interpreting qualitative data: A guide to the principles of qualitative research. London: SAGE Publications.  Tilstone, C., & Layton, L. (2004). Child development and teaching pupils with special educational needs. London: Routledge Falmer.  Wood, P., & Smith, J. (2016). Educational Research: Taking the Plunge. Carmarthen: Independent Thinking Press Limited.