Downloaded 416 times


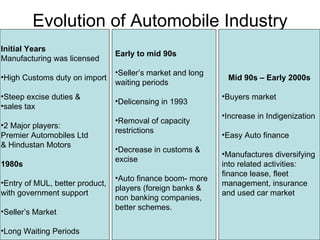
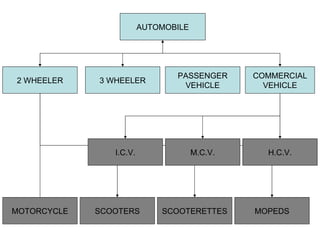
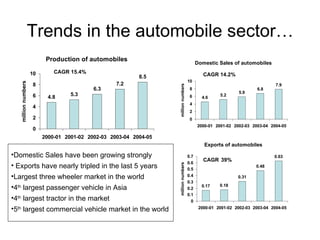
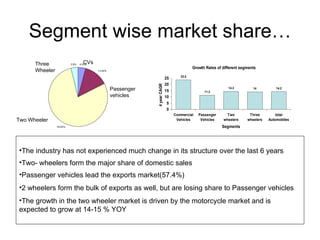
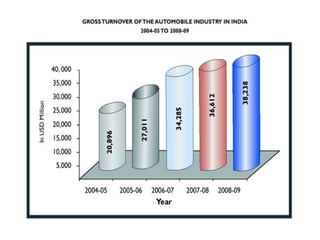
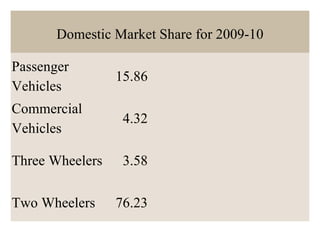
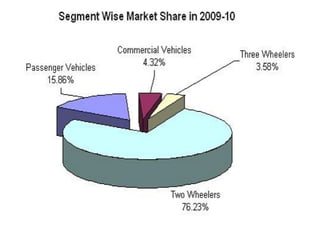
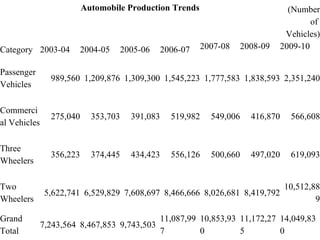
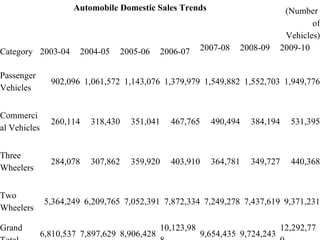
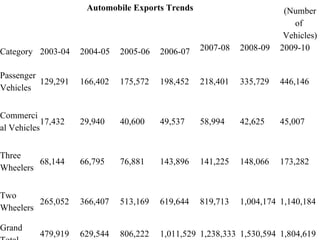


The automobile industry in India has grown significantly over the past few decades. It started with only two major players and was highly regulated, with import restrictions and high duties. Liberalization in the 1990s led to more players entering the market, both domestic and foreign, and greater competition. Key segments now include two-wheelers, passenger vehicles, commercial vehicles, and three-wheelers. The industry is largely domestically focused but exports have also increased substantially in recent years, with passenger vehicles becoming a leading export category. Overall production and sales have grown at a compound annual rate of over 15% with two-wheelers maintaining the largest market share.


![Automobile industry presentation [autosaved]](https://cdn.slidesharecdn.com/ss_thumbnails/automobileindustrypresentationautosaved-120202020248-phpapp02-thumbnail.jpg?width=640&height=640&fit=bounds)


