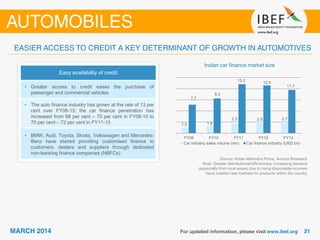
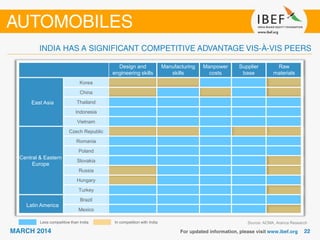
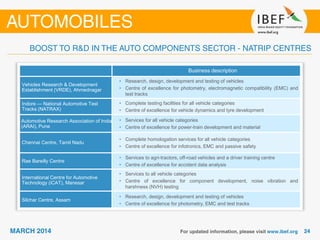
Download as PDF, PPTX
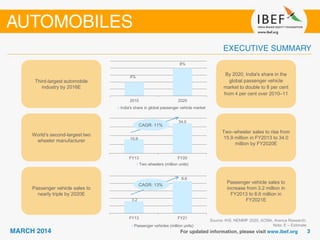
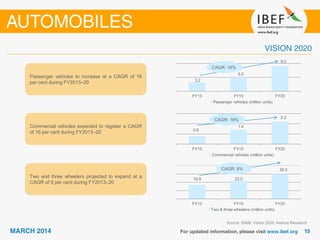
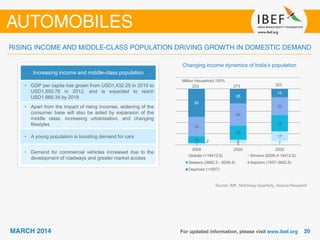

India's automobile industry is projected to experience significant growth, with two-wheeler sales anticipated to increase from 15.9 million in FY2013 to 34 million by FY2020, and passenger vehicle sales rising from 3.2 million to 8.6 million in the same period. The sector is expected to double India's share in the global passenger vehicle market by 2020, driven by rising incomes, a growing middle class, and government support for manufacturing and R&D. The auto finance market has also expanded, contributing to increased accessibility for consumers.


