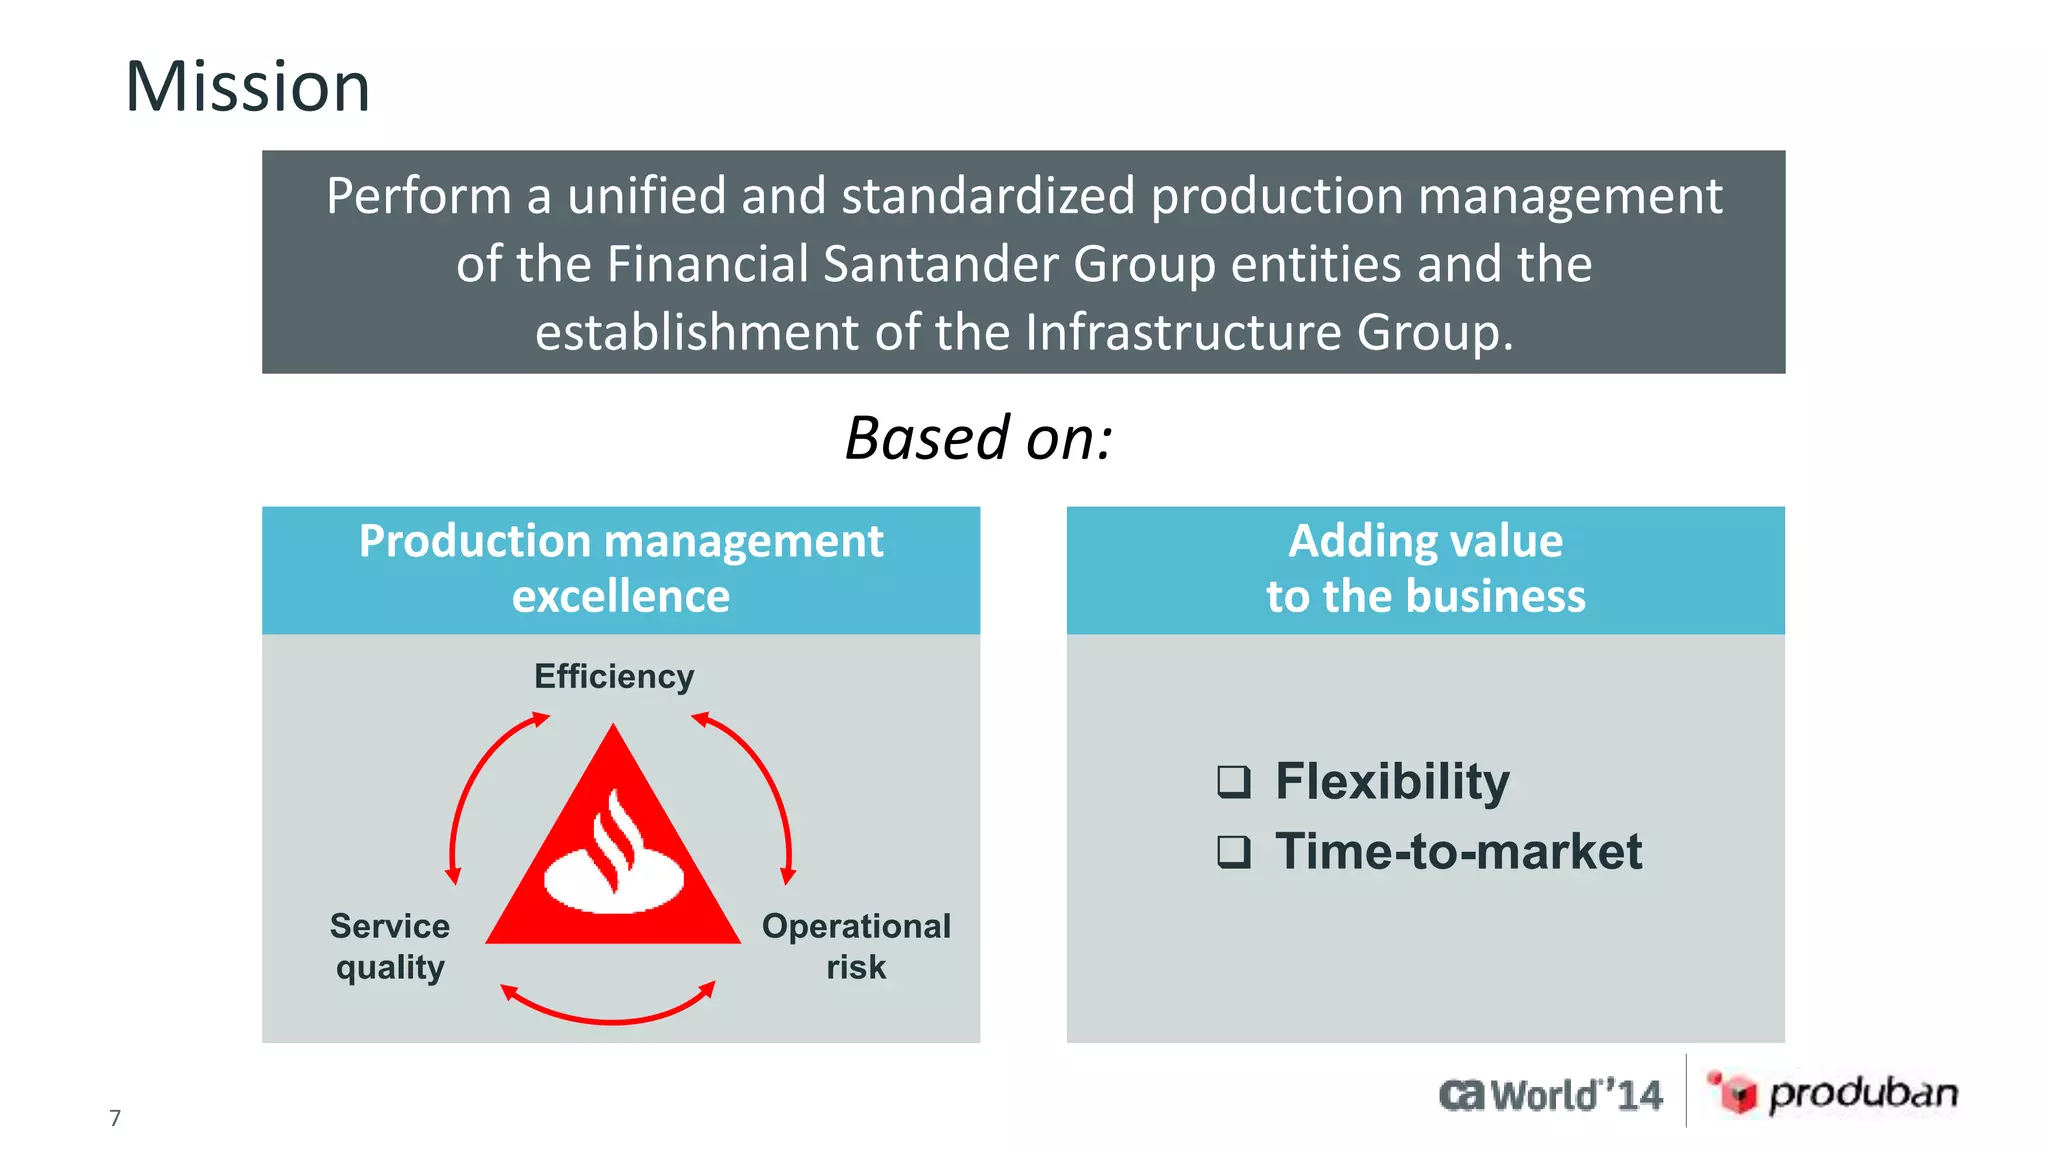
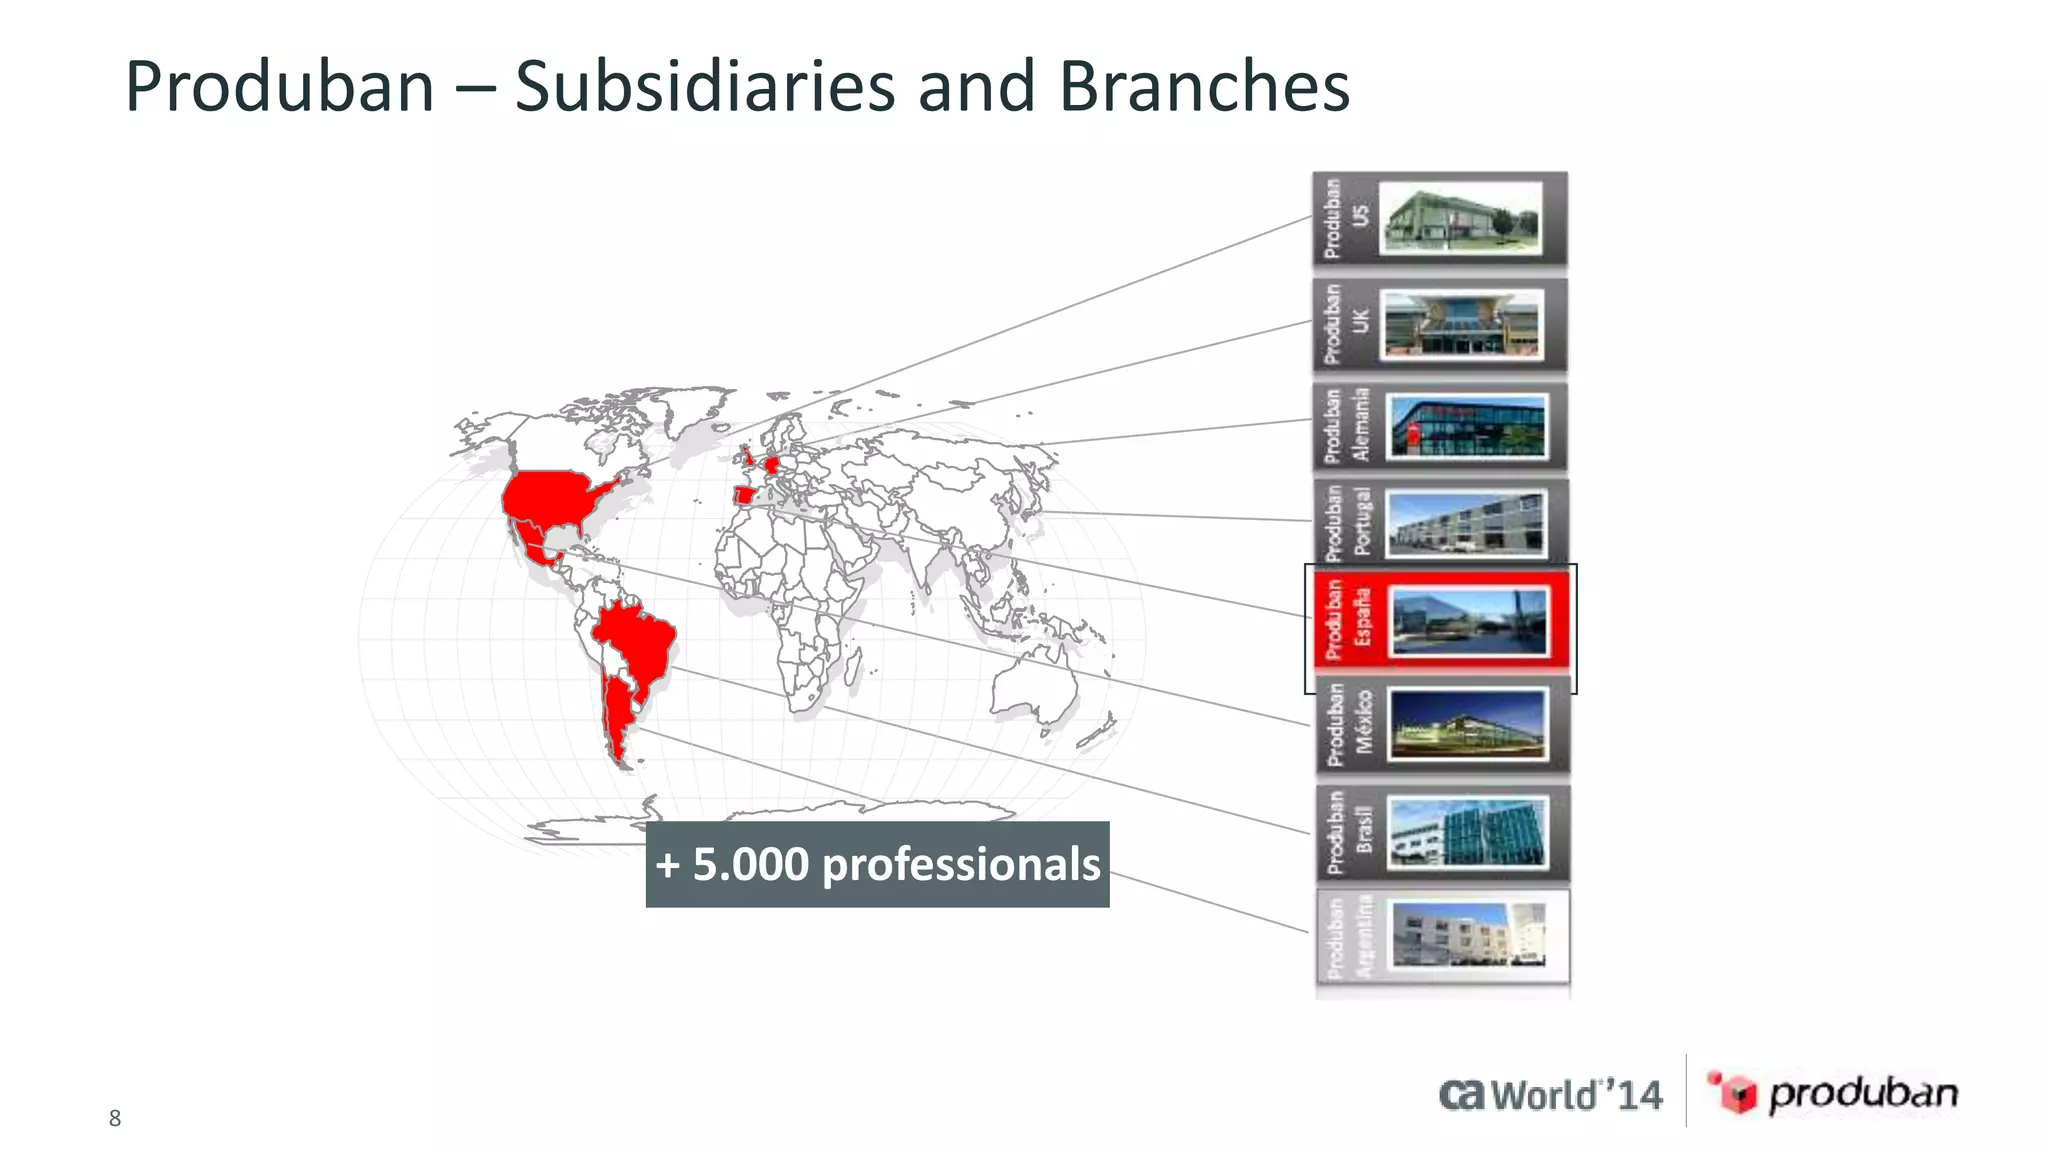
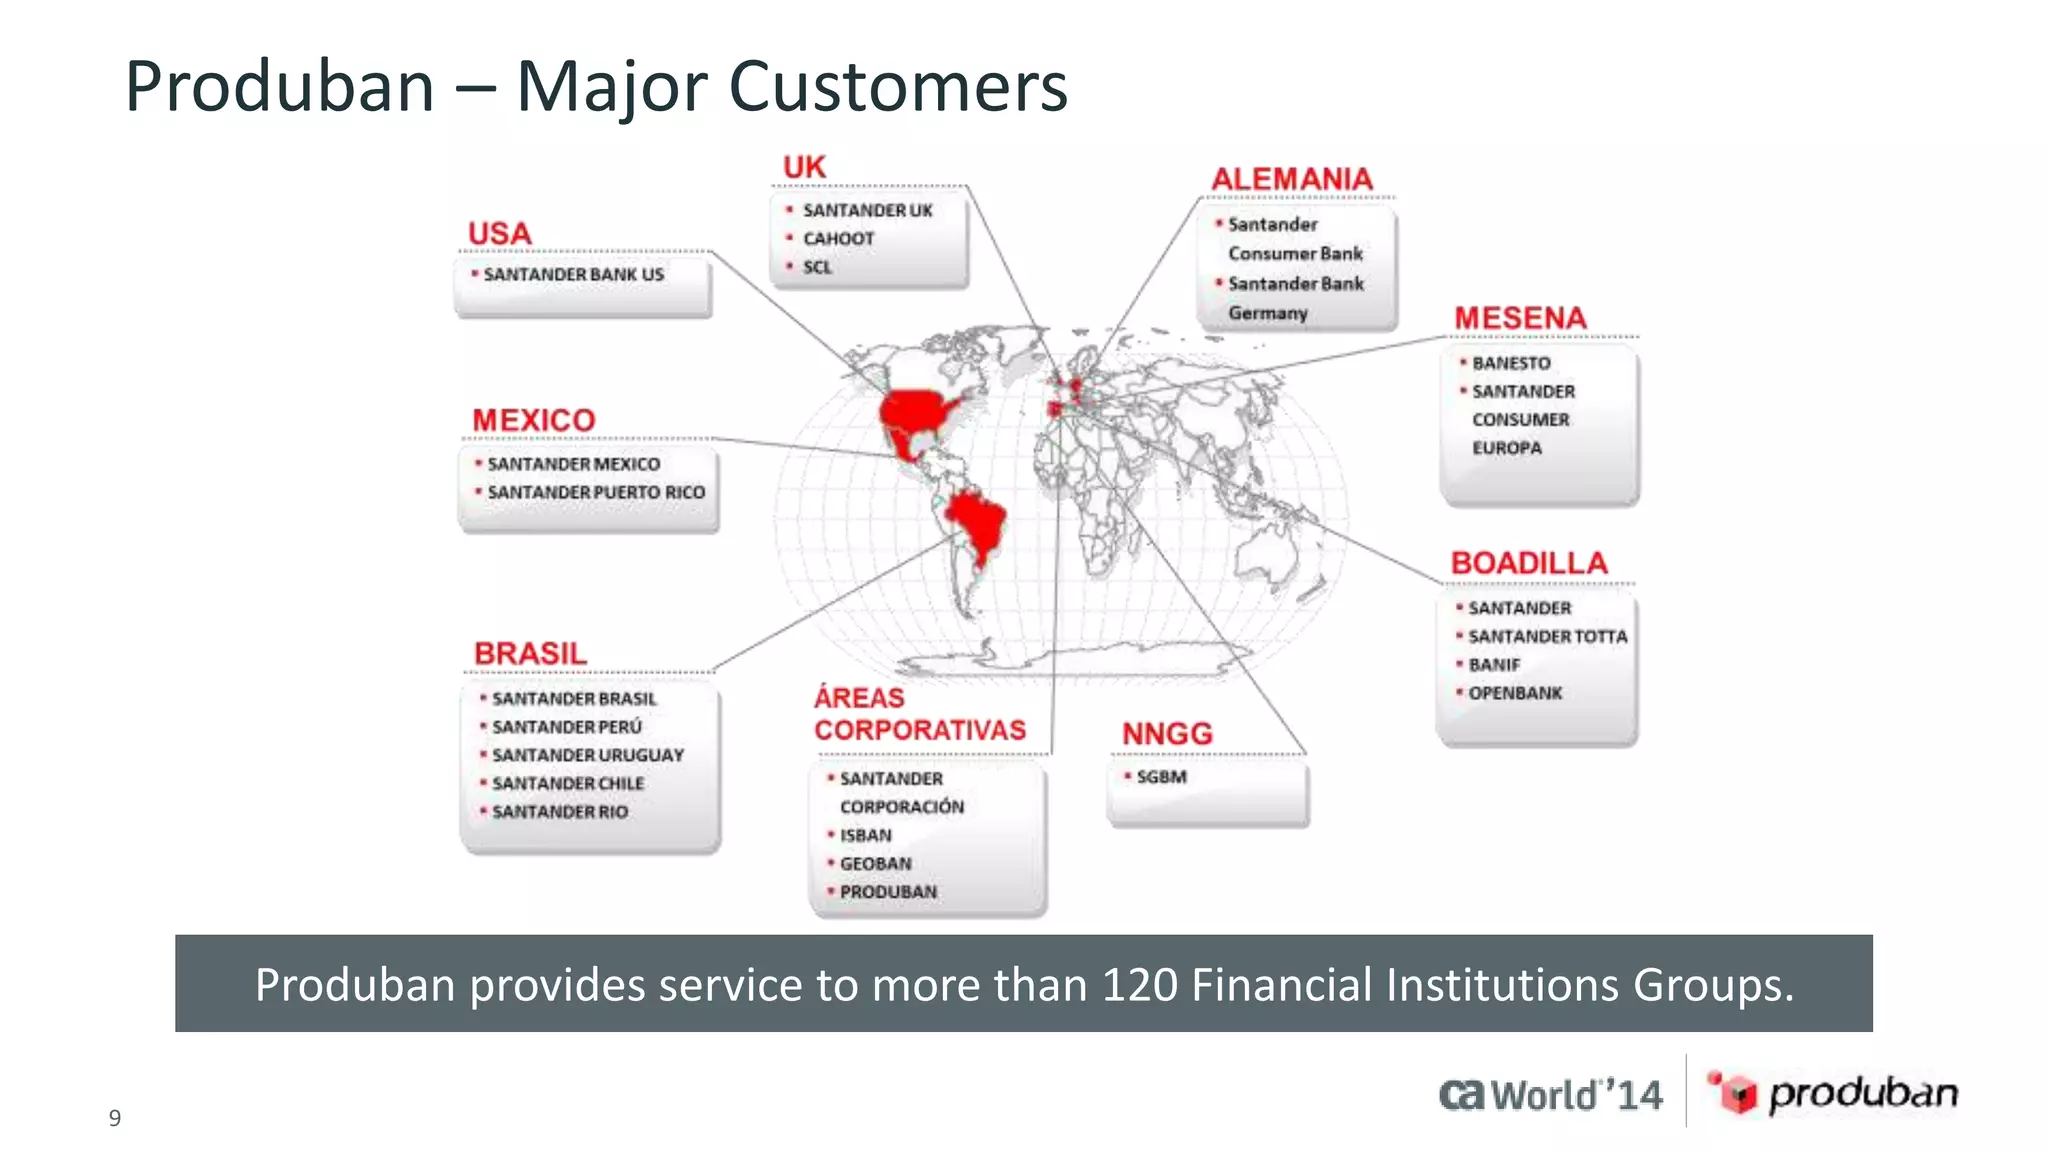
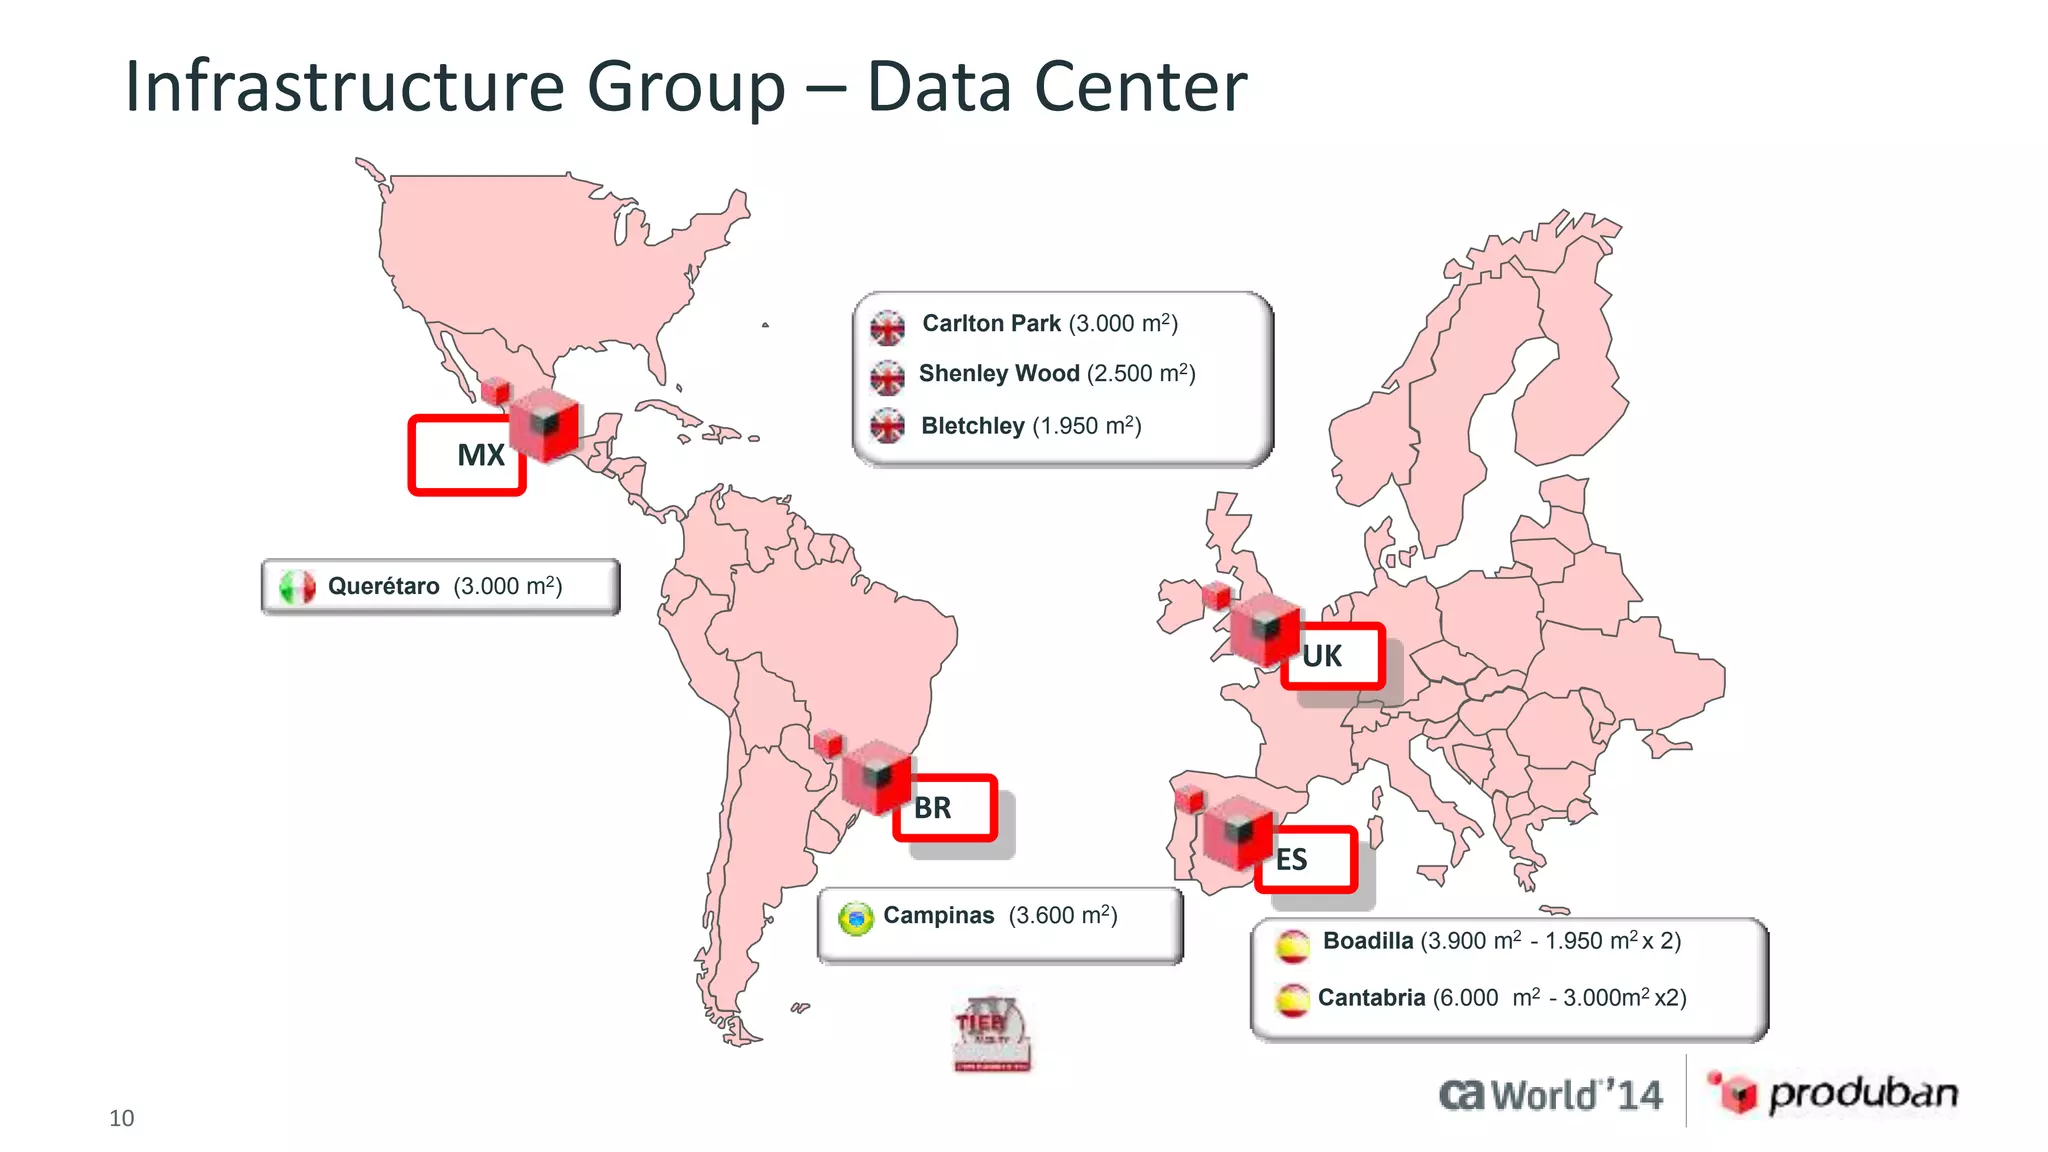
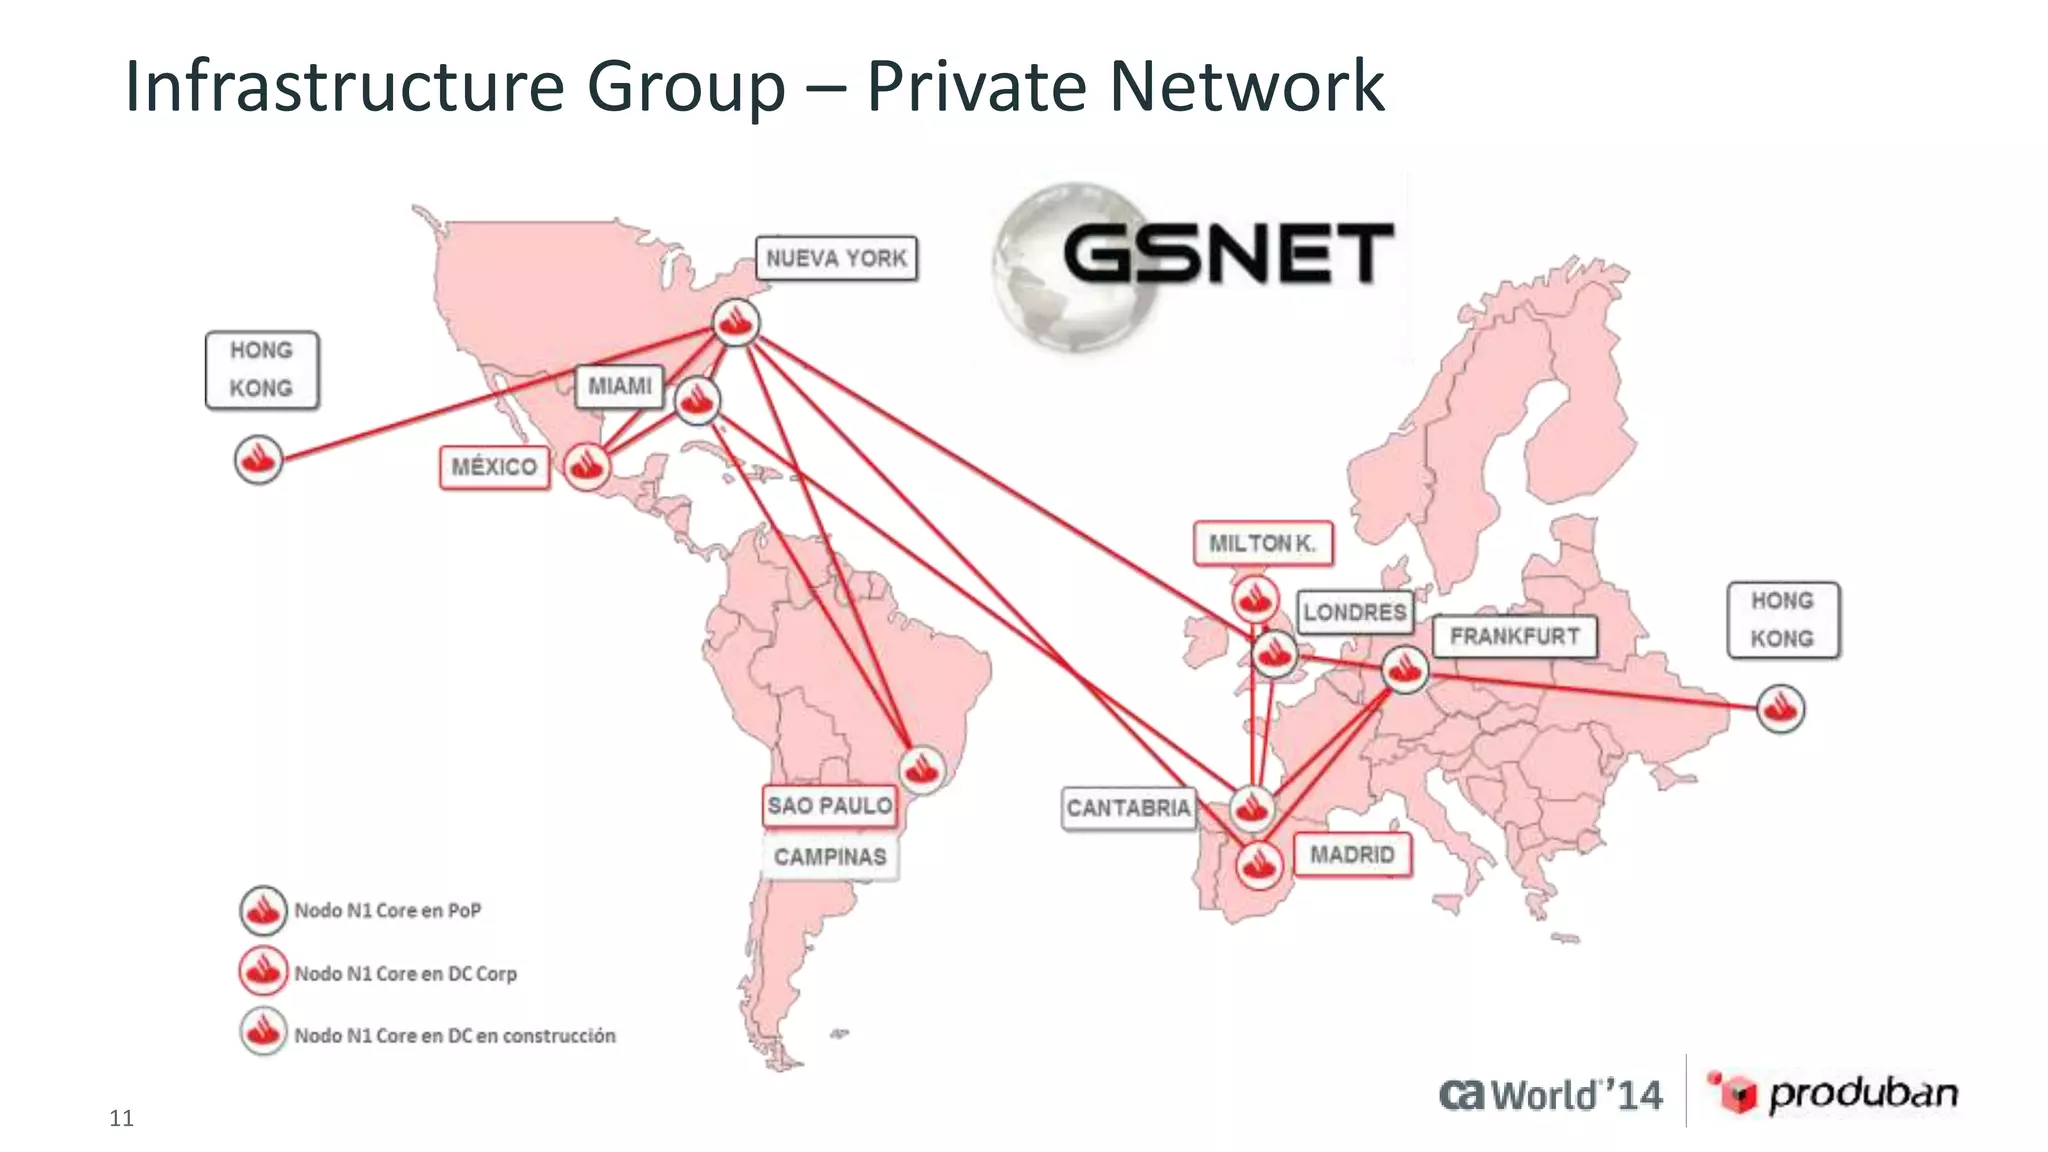
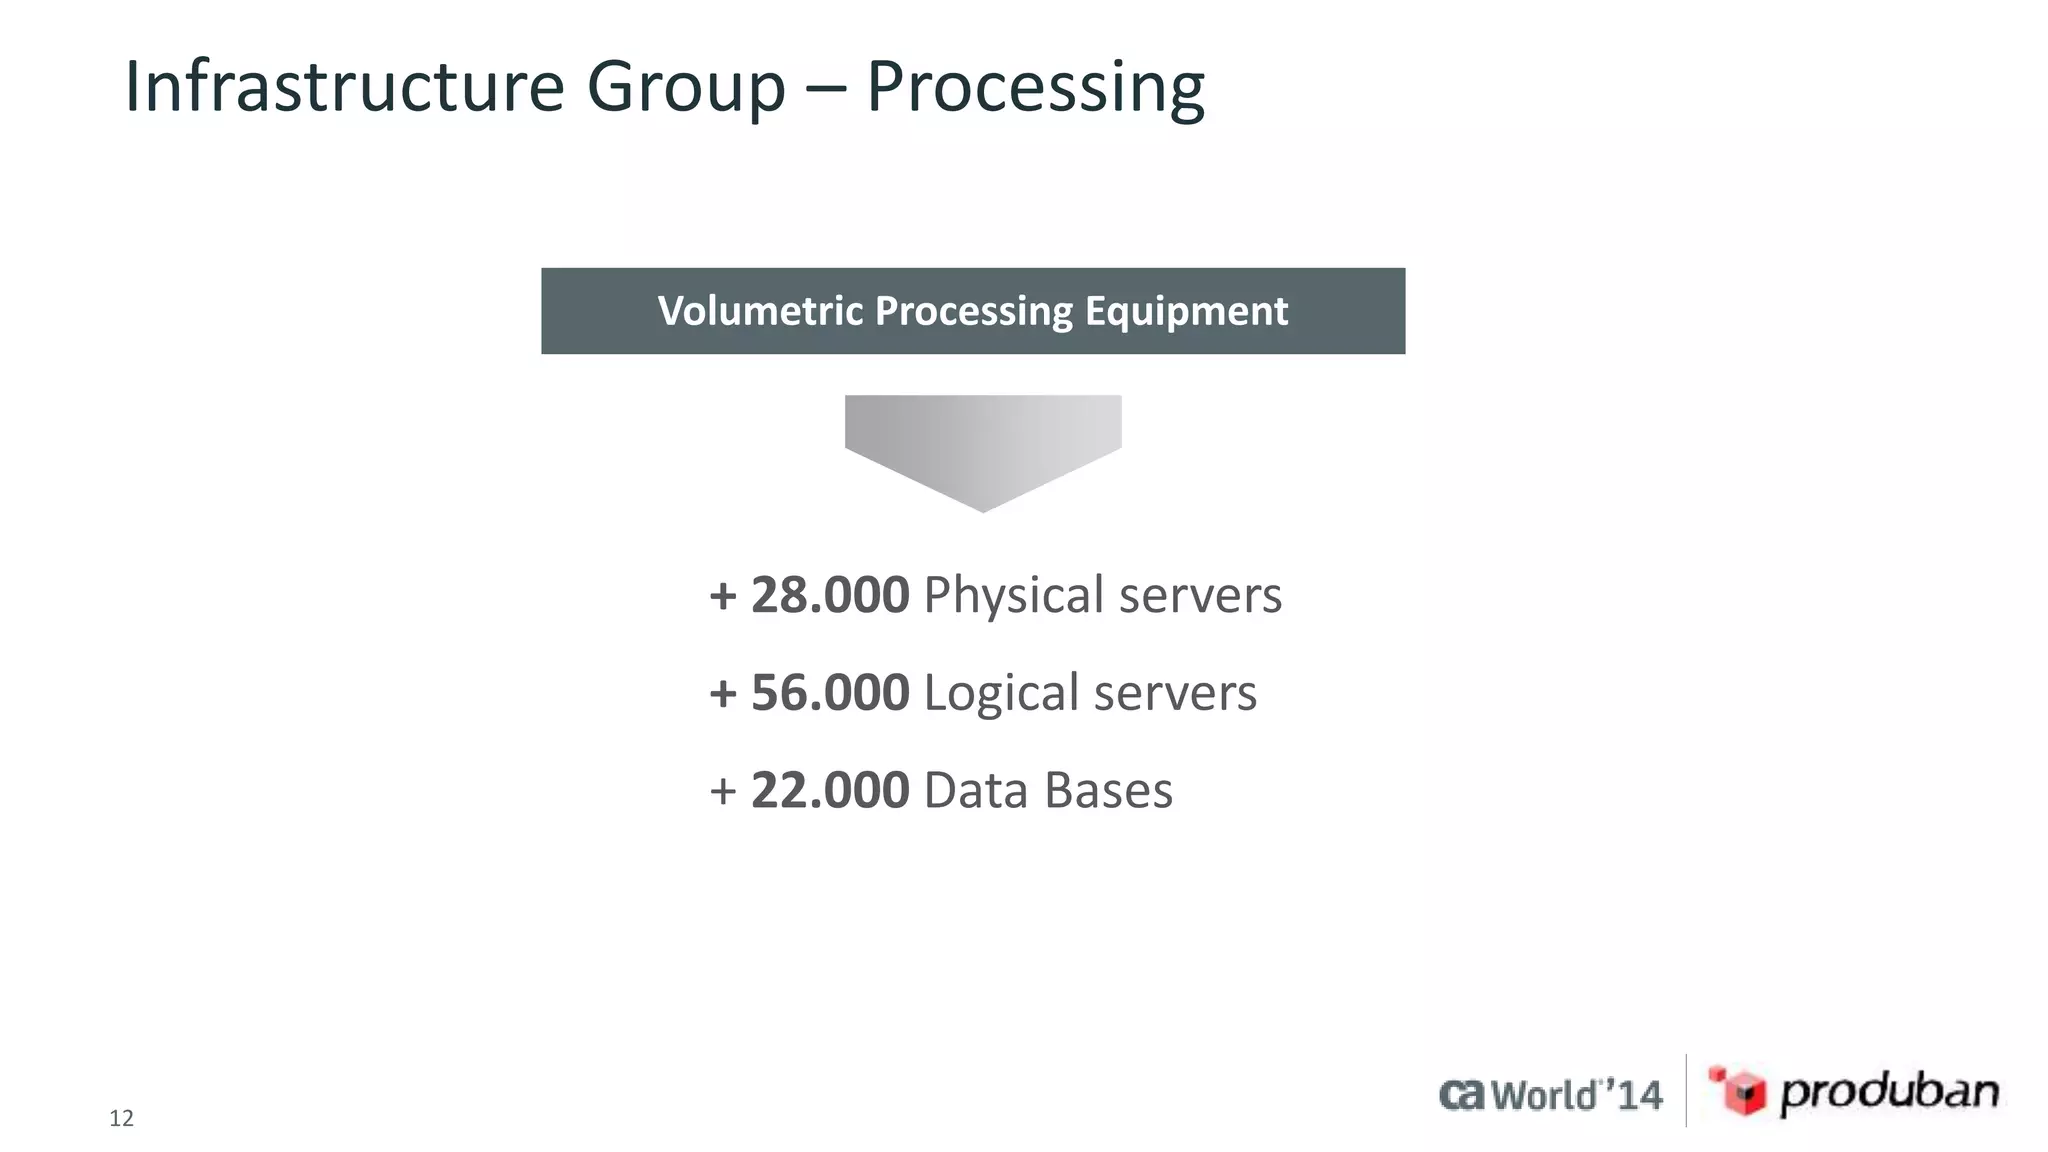
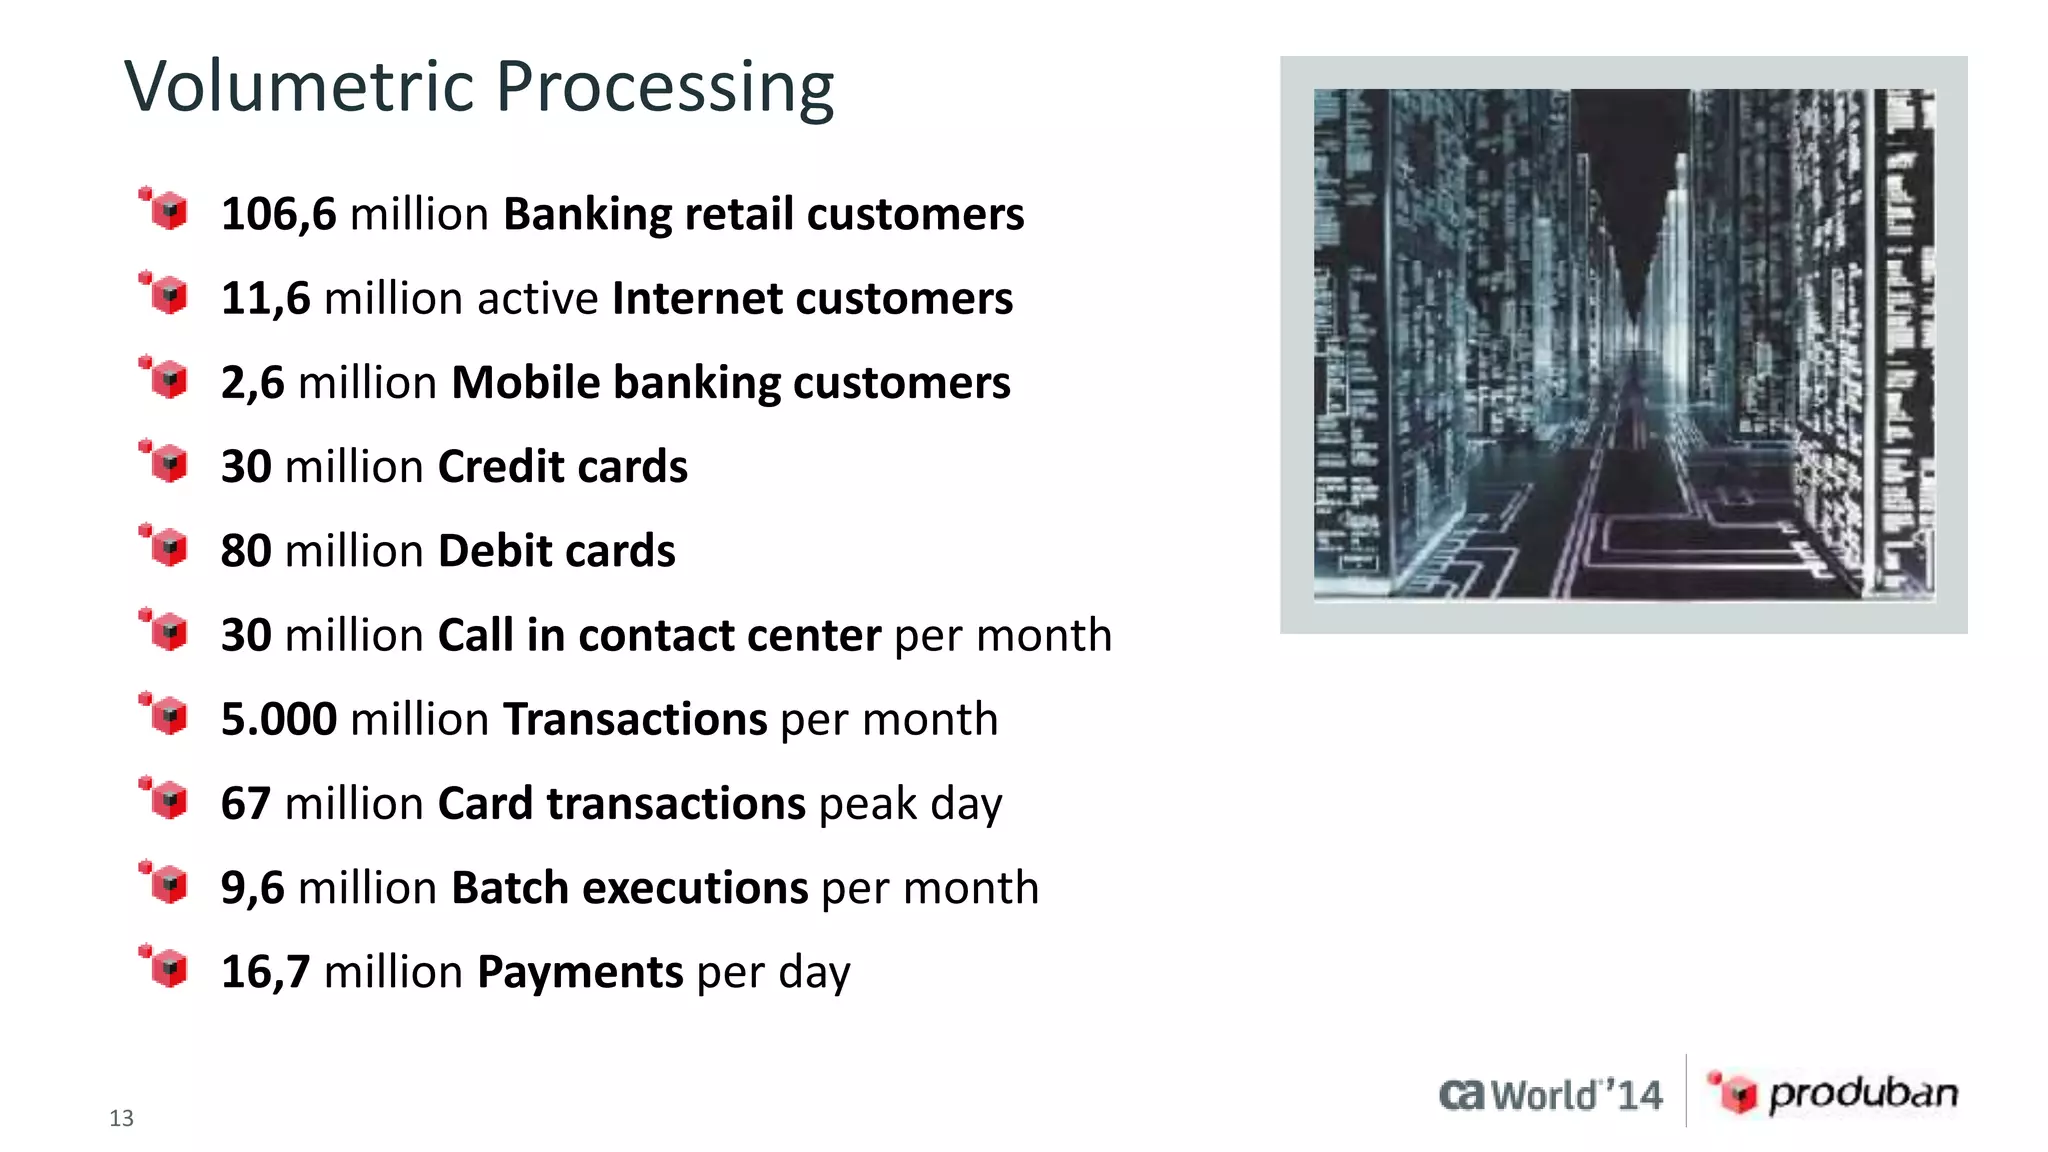
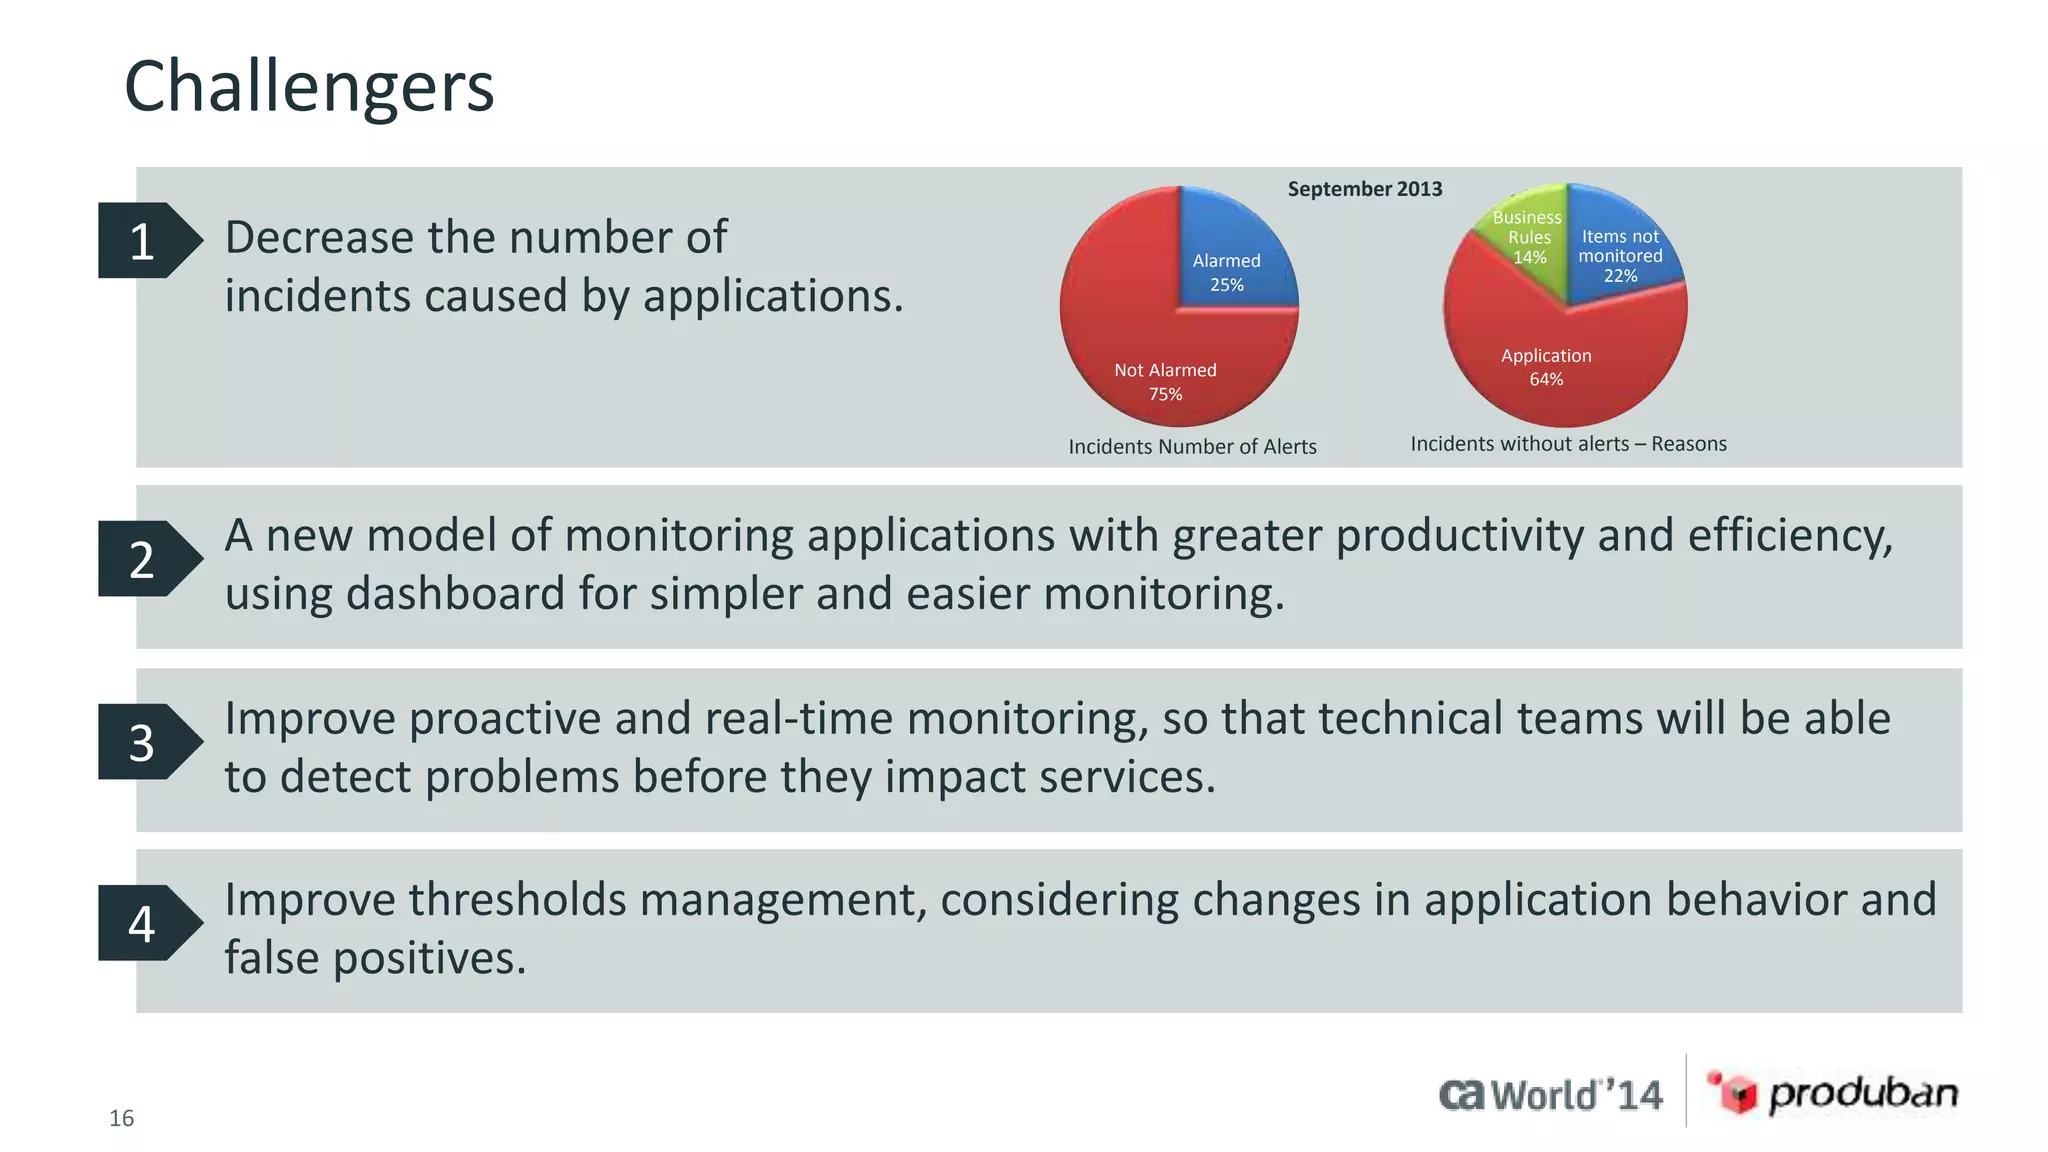
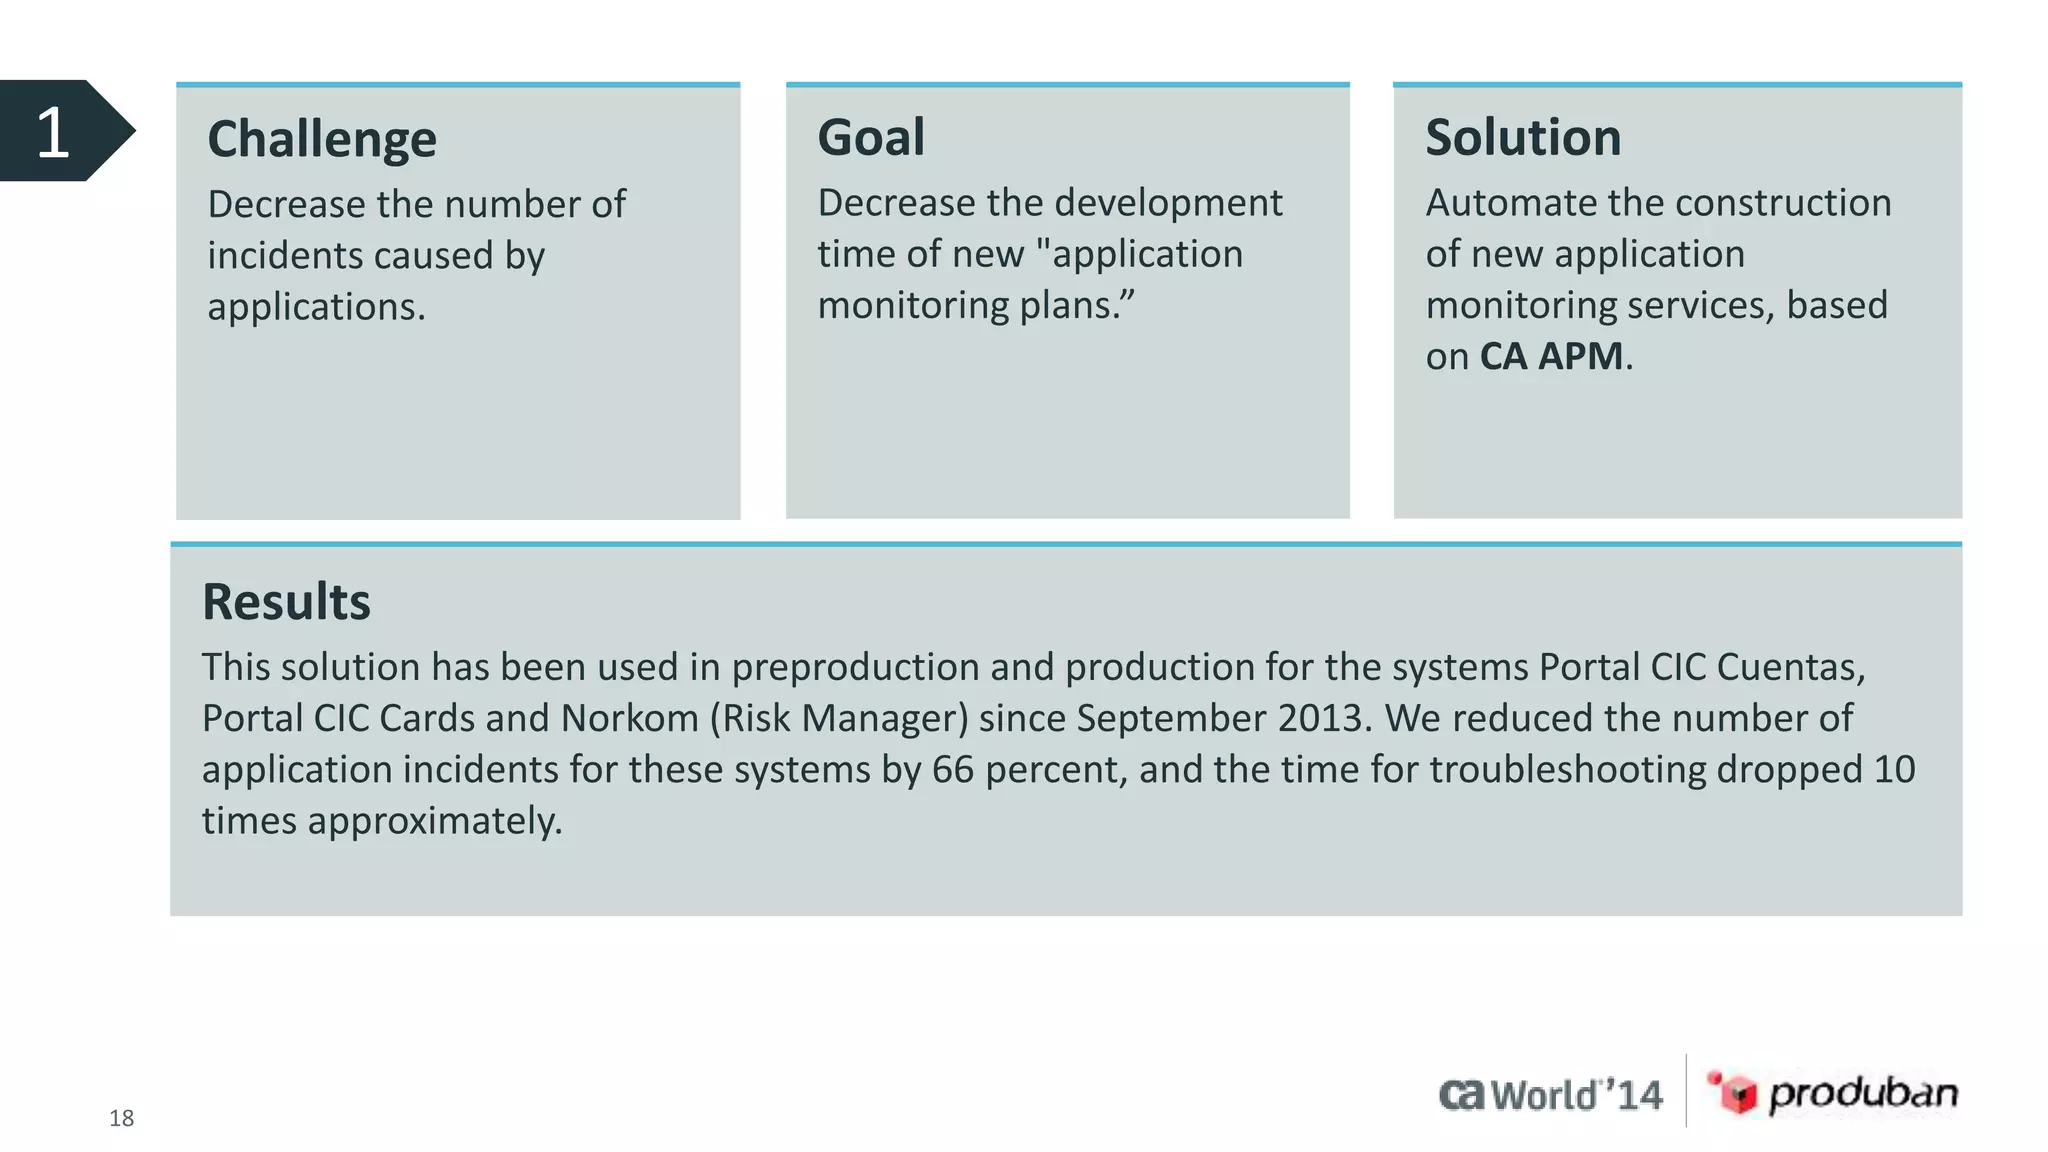
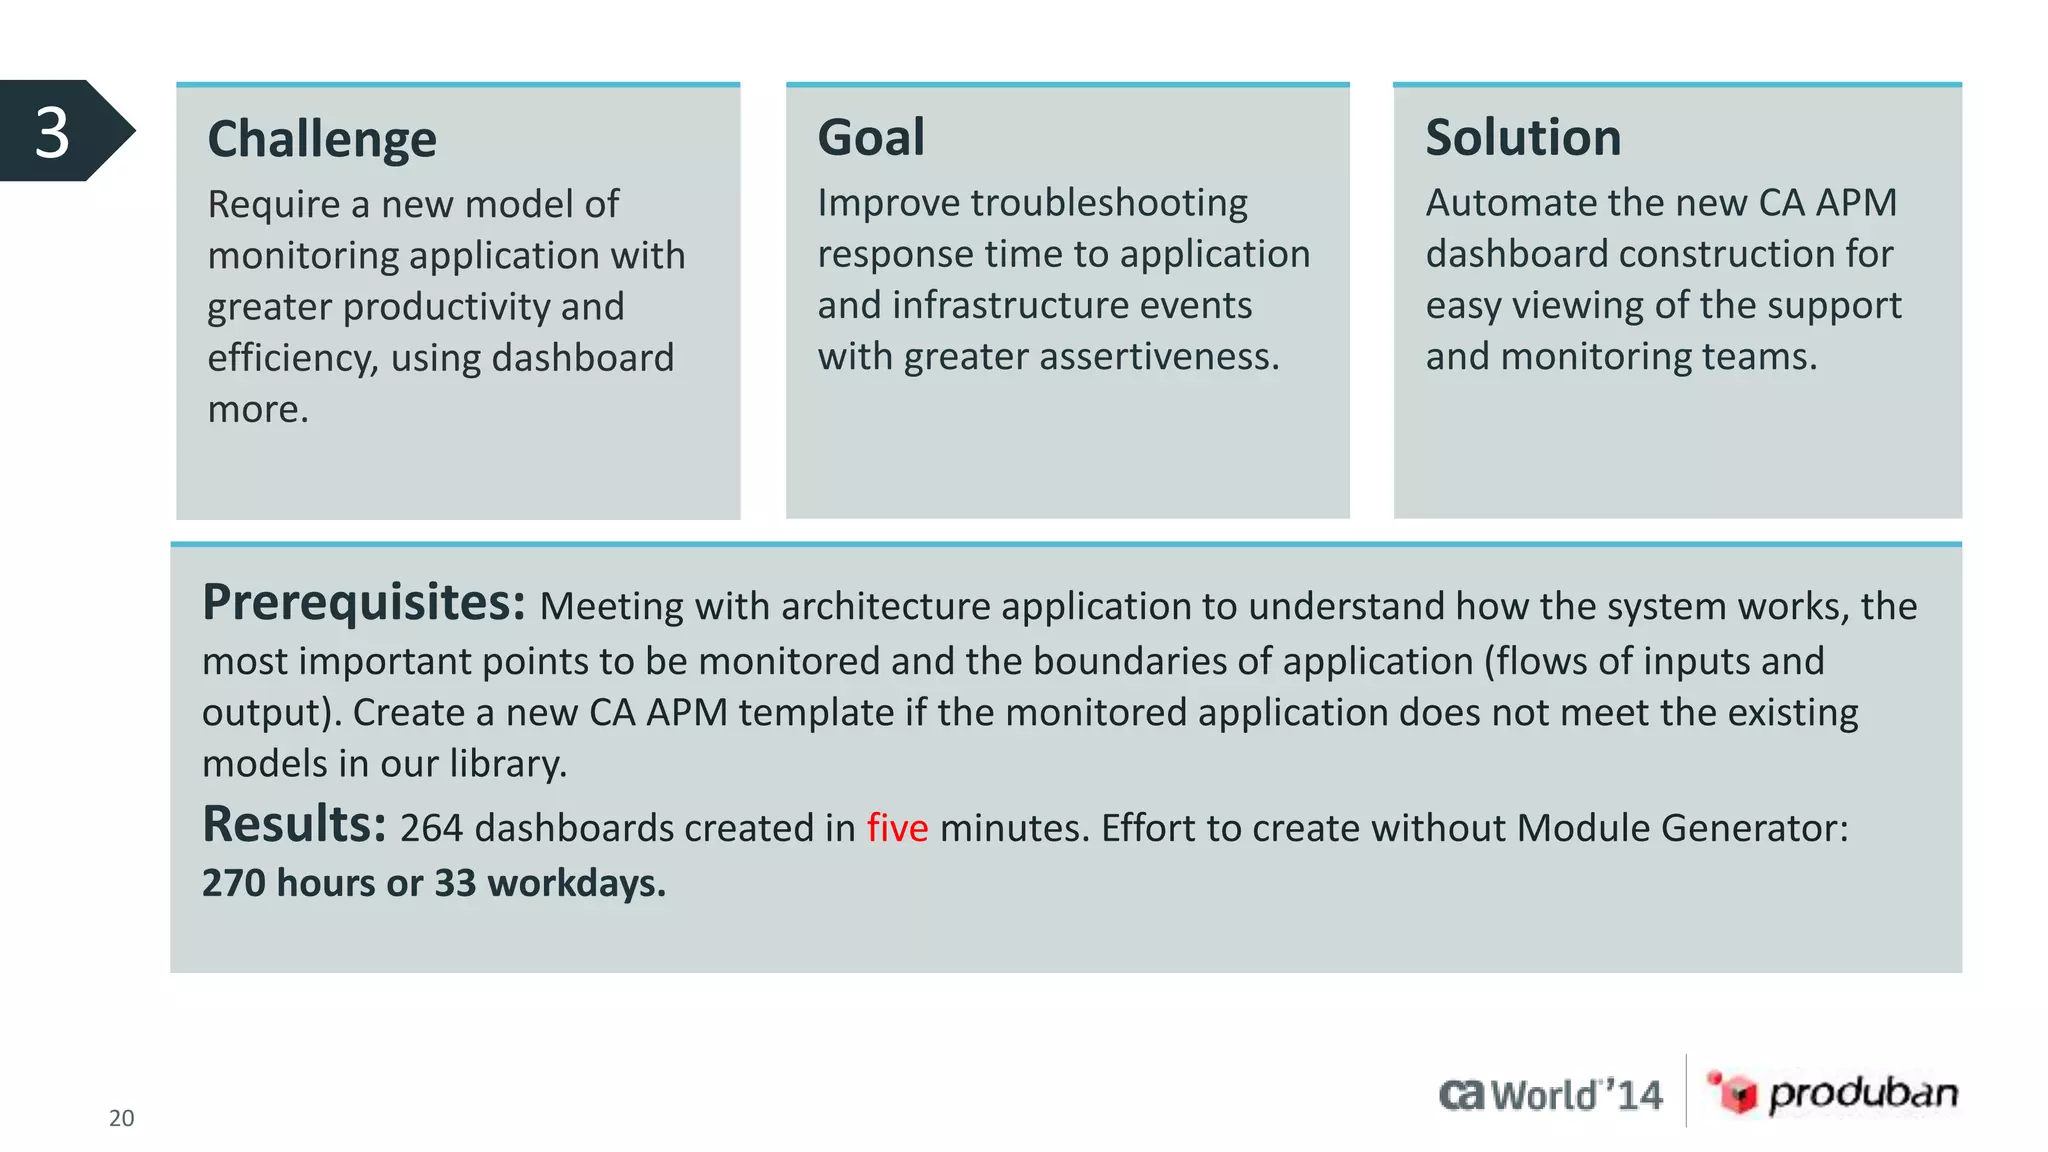
ca Opscenter 
Case Study: Increasing Produban's 
Critical Systems Availability and 
Performance 
Vitor Sousa 
Director, Monitoring Tools and Processes 
Produban 
OCX15S #CAWorld
Abstract 
The Santander Group is a Spanish banking group and the largest bank in the 
Eurozone by market value. It is also one of the largest banks in the world in 
terms of market capitalization. Produban is Santander’s group company 
responsible for Santander's entire IT infrastructure. Produban challenge was 
to monitor proactively and in real time, all transaction running in some 
critical system and being able to take actions before major problems happen. 
Considering this scenario, Produban adopted CA Core APM (Introscope) in 
order to count with alerts that permit to the technical team to detect 
problems before they impact business. Also Produban uses APM Core to 
create dashboards to make easier to identify when thresholds are reached 
and help operations team to take actions to normalize the situation. With 
this measures Produban reduced their MTTR from days to hours at the same 
time they heavily increase their visibility of critical IT services. 
Vitor Sousa 
Produban 
The Santander Group 
2 © 2014 CA. ALL RIGHTS RESERVED.
Agenda 
ABOUT THE SPEAKER 
COMPANY OVERVIEW 
CHALLENGES FROM A NEW WAY OF THINKING ABOUT APPLICATION MONITORING 
THE PROJECT 
THE SOLUTION AND RESULTS WITH CA APM 
1 
2 
3 
4 
5 
3 © 2014 CA. ALL RIGHTS RESERVED.
Produban 
Vitor Sousa 
Director 
Monitoring Tools 
and Processes 
Produban Brazil – 
Santander Group 
vmsousa@produban.com.br 
+5511 96192-5194 
Background 
BS in Economy, post-graduate in Systems 
Administration and MBA in Finance; almost 20 
years in IT market; experienced in several IT areas: 
 IT Solutions and Sales 
 IT Processes 
 Infrastructure Management 
 Software Development (focused on Infrastructure 
Monitoring) 
4 © 2014 CA. ALL RIGHTS RESERVED.
Santander Group 
 Founded in 1857, Santander, Spain 
 Strong presence in 10 major countries 
in Europe and the Americas, with 
businesses in over 40 countries 
 The largest bank in the Eurozone and 
one of the largest in the world 
 Commercial bank 
5 © 2014 CA. ALL RIGHTS RESERVED.
Produban Company 
 Produban manages and controls the 
entire IT infrastructure of the 
Santander Group: 
– Retail Banking 
– Global units 
– Corporate Units 
 Established in the May 1, 2005 
 100 percent owned by the Group 
6 © 2014 CA. ALL RIGHTS RESERVED.
Mission 
Perform a unified and standardized production management 
of the Financial Santander Group entities and the 
establishment of the Infrastructure Group. 
Based on: 
Production management 
excellence 
Efficiency 
Service 
quality 
Operational 
risk 
7 © 2014 CA. ALL RIGHTS RESERVED. 
Adding value 
to the business 
 Flexibility 
 Time-to-market
Produban – Subsidiaries and Branches 
+ 5.000 professionals 
8 © 2014 CA. ALL RIGHTS RESERVED.
Produban – Major Customers 
Produban provides service to more than 120 Financial Institutions Groups. 
9 © 2014 CA. ALL RIGHTS RESERVED.
Infrastructure Group – Data Center 
 Carlton Park (3.000 m2) 
 Shenley Wood (2.500 m2) 
 Bletchley (1.950 m2) 
10 © 2014 CA. ALL RIGHTS RESERVED. 
UK 
ES 
BR 
MX 
 Querétaro (3.000 m2) 
 Campinas (3.600 m2) 
 Boadilla (3.900 m2 - 1.950 m2 x 2) 
Cantabria (6.000 m2 - 3.000m2 x2)
Infrastructure Group – Private Network 
11 © 2014 CA. ALL RIGHTS RESERVED.
Infrastructure Group – Processing 
Volumetric Processing Equipment 
+ 28.000 Physical servers 
+ 56.000 Logical servers 
+ 22.000 Data Bases 
12 © 2014 CA. ALL RIGHTS RESERVED.
Volumetric Processing 
106,6 million Banking retail customers 
11,6 million active Internet customers 
2,6 million Mobile banking customers 
30 million Credit cards 
80 million Debit cards 
30 million Call in contact center per month 
5.000 million Transactions per month 
67 million Card transactions peak day 
9,6 million Batch executions per month 
16,7 million Payments per day 
13 © 2014 CA. ALL RIGHTS RESERVED.
14 © 2014 CA. ALL RIGHTS RESERVED.
The arrival of a new Executive 
Officer (Enrique Sanchez) with 
new ideas, encouraging the team 
to a different way of thinking 
He brought us back the power 
to seek new solutions, most 
appropriate to the needs of 
modern IT. 
A mindset change in the way of monitoring: 
 Monitoring much more focused on automation and proactivity 
 Develop visions related to "health service“ 
 Focus on improve team productivity and assertiveness 
15 © 2014 CA. ALL RIGHTS RESERVED.
Challengers 
Decrease the number of 
incidents caused by applications. 
Not Alarmed 
75% 
16 © 2014 CA. ALL RIGHTS RESERVED. 
Alarmed 
25% 
Business 
Rules 
14% 
Items not 
monitored 
Application 
64% 
22% 
September 2013 
Incidents Number of Alerts Incidents without alerts – Reasons 
1 
A new model of monitoring applications with greater productivity and efficiency, 
using dashboard for simpler and easier monitoring. 
2 
Improve proactive and real-time monitoring, so that technical teams will be able 
to detect problems before they impact services. 
3 
Improve thresholds management, considering changes in application behavior and 
false positives. 
4
The Project Milestones and Time 
Environment 
stabilization 
Improved 
performance 
Project kick-off 
Change Scope – focusing 
module generator 
automation 
Script creation to 
optimization 
performance 
Requisites and 
process definition 
17 © 2014 CA. ALL RIGHTS RESERVED. 
Developing module 
generator 
Dynamic threshold 
definitions 
Go to 
production 
12/12 1/13 2/13 3/13 4/13 5/13 6/13 7/13 8/13 
Gabriel Mochnacs Arruda 
Responsible for monitoring team 
Produban Brasil 
Plinio Augusto Moreira 
CA Technical
Challenge 
Decrease the number of 
incidents caused by 
applications. 
Goal 
Decrease the development 
time of new "application 
monitoring plans.” 
18 © 2014 CA. ALL RIGHTS RESERVED. 
Solution 
Automate the construction 
of new application 
monitoring services, based 
on CA APM. 
Results 
This solution has been used in preproduction and production for the systems Portal CIC Cuentas, 
Portal CIC Cards and Norkom (Risk Manager) since September 2013. We reduced the number of 
application incidents for these systems by 66 percent, and the time for troubleshooting dropped 10 
times approximately. 
1
2 Challenge 
Create an automated 
process to identify new 
services and new application 
into existing services. 
Goal 
Keep the environment 
always updated with new 
servers and applications 
based on automatic tools. 
19 © 2014 CA. ALL RIGHTS RESERVED. 
Solution 
Connect with WebSphere® 
Deploy Manager to known 
new functions or new 
application servers in the 
environment. 
Results 
After implementing this connection with DMGR, we reduced to zero the number of new 
applications or servers deployed without being monitored – for the systems Portal CIC Cuentas, 
Cartões and Norkom.
3 Challenge 
Require a new model of 
monitoring application with 
greater productivity and 
efficiency, using dashboard 
more. 
Goal 
Improve troubleshooting 
response time to application 
and infrastructure events 
with greater assertiveness. 
20 © 2014 CA. ALL RIGHTS RESERVED. 
Solution 
Automate the new CA APM 
dashboard construction for 
easy viewing of the support 
and monitoring teams. 
Prerequisites: Meeting with architecture application to understand how the system works, the 
most important points to be monitored and the boundaries of application (flows of inputs and 
output). Create a new CA APM template if the monitored application does not meet the existing 
models in our library. 
Results: 264 dashboards created in five minutes. Effort to create without Module Generator: 
270 hours or 33 workdays.
Technical Details 
Modulo generator 
 Creates automated dashboards 
 Shows the applications path through an application server 
 Presents the health of Java components, front-ends, back-ends 
and JVM resources 
Developed flow Dashboard 
DMGR 
App 
Server 
APM 
Process 
Dash 
Template 
Thresholds 
Create 
systematic 
connection. 
Create 
an engine. 
Template 
with 
information. 
Create 
standard 
templates 
images. 
Return data 
processed 
to the APM. 
21 © 2014 CA. ALL RIGHTS RESERVED.
Modules Generator – Diagram 
XML 
DMGR 
Template 
Modules Generator 
Java Application 
Web 
service 
22 © 2014 CA. ALL RIGHTS RESERVED. 
HSQL 
APM server 
HSQL 
database 
Dashboard 
created 
Daily routine for 
storing thresholds 
Direct connection between the application and 
the DMGR for reading XML
Modules Generator – Components 
XML DMGR: Communication between the Modules Generator and Deploy Manager 
WebSphere. Modules Generator reads the serverindex.xml file, which contains the application 
distribution between AppServers. It is the input to generate the first module and is necessary 
to ensure that the generator modules can communicate with the DMGR to consume XML. 
Template: Pre-configured APM module with list of Metric Groups, Alerts and Dashboards to be 
created. All items in this module have variables that will be used by the Modules Generator. 
HyperSQL Database: Database embedded in the application. No installation is necessary. 
It is used to store the thresholds and provide analysis of these and update these values in the 
APM module. 
XML Verification Routine: Monitoring of serverindex.xml. Whenever a new module changes 
must be generated to update information in the Dashboard. 
Thresholds Recording Routine: Daily execution routine for recording data calculated in 
Generator modules in the database. The routine will write the data from the previous day. 
XML 
DMGR 
Template 
HSQL 
ZABBIX 
23 © 2014 CA. ALL RIGHTS RESERVED.
Main Flow Routine 
Install APM agent in 
the application that will 
be monitored. 
Communication with DMGR 
WebSphere – Collect information 
from applications and App Servers 
that are running through the XML 
Server Index. 
Run Generator Modules – 
Phase 1 Creating Metric 
Groups and Alerts. 
Run the generator modules with 
the application´s thresholds. 
Create .jar file to deploy in APM. 
Daily routine data collection – 
Necessary to achieve the 
thresholds, identify the 
application operating time and 
possible deviations 
.jar Deploy – (.jar created by 
Generator Modules APM) 
24 © 2014 CA. ALL RIGHTS RESERVED. 
Dashboards 
are created. 
Mandatory parameters 
 Hostname and APM 
Communication Port 
 User with access to the tool. 
 Deploy Manager address. 
 ServerIndex.xml path in server; 
 Ensure the communication between 
the Modules Generator and DMGR. 
 Include the execution routine for .jar 
into the server. Process that to record 
historical data in HSQL database.
What is monitored? 
 CPU 
 Garbage collector 
(Java memory 
manager) 
JVM 
 Servlets (XML/HTML 
translator) 
 JSP (Java Server page) 
 EJB (Motor Java) 
 JMS (Msgs Java processor) 
Java 
 Thread pool 
 Connection pools 
AppServer 
25 © 2014 CA. ALL RIGHTS RESERVED. 
 Queries 
 Connection count 
 MQ 
 Web services 
Backends 
 URLs 
 Application 
Frontends 
 Time the transaction 
 Response time, freezing, number of calls and errors are monitored 
 Information from PMI and JMX 
 Metric groups 
Application
Setting Alerts – Metrics Groups 
 Grouped metrics that allow information- gathering in one or more applications, 
or one or more Java component 
 Metric groups are used to define the alerts, and to follow the health of the 
application or component that is grouped 
 Defined by regular expressions that will “match" the information displayed 
Metrics Groups Example 
26 © 2014 CA. ALL RIGHTS RESERVED.
Setting Alerts – Metrics Signature 
 Metric signature is a combination of several Metric Groups types that indicates 
the application most common problems 
 Integration with others monitoring systems like Alert Modeling 
Example – Application Bottleneck 
Increase in 
concurrent 
invocation 
Increase in 
stall count 
Application 01 in AppServer_ServerName presenting bottleneck symptoms. 
Click the link http://XPTO.com.br to view the corresponding Dashboard. 
Increase 
in average 
response 
time 
27 © 2014 CA. ALL RIGHTS RESERVED. 
Less 
threads 
available 
Possible 
bottleneck 
in 
application 
With the above condition being 
true, an alert will be sent to front-end 
with the following message:
Dashboard 
28 © 2014 CA. ALL RIGHTS RESERVED.
4 Challenge 
Improve thresholds 
management, considering 
changes in application 
behavior and false positives. 
Goal 
Decrease or eliminate “false 
positives” in monitoring 
events, caused by thresholds 
deviations. 
29 © 2014 CA. ALL RIGHTS RESERVED. 
Solution 
Creating the concept of 
dynamic thresholds based on 
historical occurrences and 
automatically configure. 
Results 
Decrease in false positive application alerts by 77 percent. 
Proactive monitoring: Thresholds adjusted to alarm before it becomes an incident; trend analysis 
and deviation in the application behavior; alerts accuracy and automated thresholds updating; 
thresholds validation mechanism based on application history; input information for application 
capacity process; thresholds calculated for all active Metric Groups in CA APM’s Module Manager.
Technical Details – Dynamic Thresholds 
Create a new database to store indicators historical data. 
 Create an automatic extraction of observations to feed the database items occurrences. 
 Develop a logic to identify the thresholds "optimal point." 
 Implement a new loading process in CA APM when it identifies the need for a new threshold. 
 Create a new flow of threshold validation and the level of "false positives" rates. 
APM 
metrics 
Threshold 
calculations 
Data 
stored 
Upgraded 
module 
application 
generator 
modules 
Threshold-checking 
Java 
30 © 2014 CA. ALL RIGHTS RESERVED.
Database Thresholds Example 
System 
name 
Metric 
group 
Daily 
values 
 Requires monthly validation process to determine if the registered thresholds 
remain appropriate, or if an update is needed 
 Data for analysis will always be from the last two months. 
 Generator Modules will bring statistics data to help the analysis. 
 Possibility to export data to a .csv file 
31 © 2014 CA. ALL RIGHTS RESERVED. 
Statistical data Current 
thresholds 
Updated 
thresholds
For More Information 
Insert appropriate screenshot and text overlay 
from following “More Info Graphics” slide here; 
DevOps 
ensure it links to correct page 
To learn more about DevOps, please visit: 
http://bit.ly/1wbjjqX 
32 © 2014 CA. ALL RIGHTS RESERVED.
For Informational Purposes Only 
Terms of this Presentation 
This presentation provided at CA World 2014 is intended for information purposes only and does not form any type of warranty. 
Content provided in this presentation has not been reviewed for accuracy and is based on information provided by CA Partners 
and Customers. 
33 © 2014 CA. ALL RIGHTS RESERVED.

Case Study: Increasing Produban's Critical Systems Availability and Performance

  • 1.
    ca Opscenter CaseStudy: Increasing Produban's Critical Systems Availability and Performance Vitor Sousa Director, Monitoring Tools and Processes Produban OCX15S #CAWorld
  • 2.
    Abstract The SantanderGroup is a Spanish banking group and the largest bank in the Eurozone by market value. It is also one of the largest banks in the world in terms of market capitalization. Produban is Santander’s group company responsible for Santander's entire IT infrastructure. Produban challenge was to monitor proactively and in real time, all transaction running in some critical system and being able to take actions before major problems happen. Considering this scenario, Produban adopted CA Core APM (Introscope) in order to count with alerts that permit to the technical team to detect problems before they impact business. Also Produban uses APM Core to create dashboards to make easier to identify when thresholds are reached and help operations team to take actions to normalize the situation. With this measures Produban reduced their MTTR from days to hours at the same time they heavily increase their visibility of critical IT services. Vitor Sousa Produban The Santander Group 2 © 2014 CA. ALL RIGHTS RESERVED.
  • 3.
    Agenda ABOUT THESPEAKER COMPANY OVERVIEW CHALLENGES FROM A NEW WAY OF THINKING ABOUT APPLICATION MONITORING THE PROJECT THE SOLUTION AND RESULTS WITH CA APM 1 2 3 4 5 3 © 2014 CA. ALL RIGHTS RESERVED.
  • 4.
    Produban Vitor Sousa Director Monitoring Tools and Processes Produban Brazil – Santander Group vmsousa@produban.com.br +5511 96192-5194 Background BS in Economy, post-graduate in Systems Administration and MBA in Finance; almost 20 years in IT market; experienced in several IT areas:  IT Solutions and Sales  IT Processes  Infrastructure Management  Software Development (focused on Infrastructure Monitoring) 4 © 2014 CA. ALL RIGHTS RESERVED.
  • 5.
    Santander Group Founded in 1857, Santander, Spain  Strong presence in 10 major countries in Europe and the Americas, with businesses in over 40 countries  The largest bank in the Eurozone and one of the largest in the world  Commercial bank 5 © 2014 CA. ALL RIGHTS RESERVED.
  • 6.
    Produban Company Produban manages and controls the entire IT infrastructure of the Santander Group: – Retail Banking – Global units – Corporate Units  Established in the May 1, 2005  100 percent owned by the Group 6 © 2014 CA. ALL RIGHTS RESERVED.
  • 7.
    Mission Perform aunified and standardized production management of the Financial Santander Group entities and the establishment of the Infrastructure Group. Based on: Production management excellence Efficiency Service quality Operational risk 7 © 2014 CA. ALL RIGHTS RESERVED. Adding value to the business  Flexibility  Time-to-market
  • 8.
    Produban – Subsidiariesand Branches + 5.000 professionals 8 © 2014 CA. ALL RIGHTS RESERVED.
  • 9.
    Produban – MajorCustomers Produban provides service to more than 120 Financial Institutions Groups. 9 © 2014 CA. ALL RIGHTS RESERVED.
  • 10.
    Infrastructure Group –Data Center  Carlton Park (3.000 m2)  Shenley Wood (2.500 m2)  Bletchley (1.950 m2) 10 © 2014 CA. ALL RIGHTS RESERVED. UK ES BR MX  Querétaro (3.000 m2)  Campinas (3.600 m2)  Boadilla (3.900 m2 - 1.950 m2 x 2) Cantabria (6.000 m2 - 3.000m2 x2)
  • 11.
    Infrastructure Group –Private Network 11 © 2014 CA. ALL RIGHTS RESERVED.
  • 12.
    Infrastructure Group –Processing Volumetric Processing Equipment + 28.000 Physical servers + 56.000 Logical servers + 22.000 Data Bases 12 © 2014 CA. ALL RIGHTS RESERVED.
  • 13.
    Volumetric Processing 106,6million Banking retail customers 11,6 million active Internet customers 2,6 million Mobile banking customers 30 million Credit cards 80 million Debit cards 30 million Call in contact center per month 5.000 million Transactions per month 67 million Card transactions peak day 9,6 million Batch executions per month 16,7 million Payments per day 13 © 2014 CA. ALL RIGHTS RESERVED.
  • 14.
    14 © 2014CA. ALL RIGHTS RESERVED.
  • 15.
    The arrival ofa new Executive Officer (Enrique Sanchez) with new ideas, encouraging the team to a different way of thinking He brought us back the power to seek new solutions, most appropriate to the needs of modern IT. A mindset change in the way of monitoring:  Monitoring much more focused on automation and proactivity  Develop visions related to "health service“  Focus on improve team productivity and assertiveness 15 © 2014 CA. ALL RIGHTS RESERVED.
  • 16.
    Challengers Decrease thenumber of incidents caused by applications. Not Alarmed 75% 16 © 2014 CA. ALL RIGHTS RESERVED. Alarmed 25% Business Rules 14% Items not monitored Application 64% 22% September 2013 Incidents Number of Alerts Incidents without alerts – Reasons 1 A new model of monitoring applications with greater productivity and efficiency, using dashboard for simpler and easier monitoring. 2 Improve proactive and real-time monitoring, so that technical teams will be able to detect problems before they impact services. 3 Improve thresholds management, considering changes in application behavior and false positives. 4
  • 17.
    The Project Milestonesand Time Environment stabilization Improved performance Project kick-off Change Scope – focusing module generator automation Script creation to optimization performance Requisites and process definition 17 © 2014 CA. ALL RIGHTS RESERVED. Developing module generator Dynamic threshold definitions Go to production 12/12 1/13 2/13 3/13 4/13 5/13 6/13 7/13 8/13 Gabriel Mochnacs Arruda Responsible for monitoring team Produban Brasil Plinio Augusto Moreira CA Technical
  • 18.
    Challenge Decrease thenumber of incidents caused by applications. Goal Decrease the development time of new "application monitoring plans.” 18 © 2014 CA. ALL RIGHTS RESERVED. Solution Automate the construction of new application monitoring services, based on CA APM. Results This solution has been used in preproduction and production for the systems Portal CIC Cuentas, Portal CIC Cards and Norkom (Risk Manager) since September 2013. We reduced the number of application incidents for these systems by 66 percent, and the time for troubleshooting dropped 10 times approximately. 1
  • 19.
    2 Challenge Createan automated process to identify new services and new application into existing services. Goal Keep the environment always updated with new servers and applications based on automatic tools. 19 © 2014 CA. ALL RIGHTS RESERVED. Solution Connect with WebSphere® Deploy Manager to known new functions or new application servers in the environment. Results After implementing this connection with DMGR, we reduced to zero the number of new applications or servers deployed without being monitored – for the systems Portal CIC Cuentas, Cartões and Norkom.
  • 20.
    3 Challenge Requirea new model of monitoring application with greater productivity and efficiency, using dashboard more. Goal Improve troubleshooting response time to application and infrastructure events with greater assertiveness. 20 © 2014 CA. ALL RIGHTS RESERVED. Solution Automate the new CA APM dashboard construction for easy viewing of the support and monitoring teams. Prerequisites: Meeting with architecture application to understand how the system works, the most important points to be monitored and the boundaries of application (flows of inputs and output). Create a new CA APM template if the monitored application does not meet the existing models in our library. Results: 264 dashboards created in five minutes. Effort to create without Module Generator: 270 hours or 33 workdays.
  • 21.
    Technical Details Modulogenerator  Creates automated dashboards  Shows the applications path through an application server  Presents the health of Java components, front-ends, back-ends and JVM resources Developed flow Dashboard DMGR App Server APM Process Dash Template Thresholds Create systematic connection. Create an engine. Template with information. Create standard templates images. Return data processed to the APM. 21 © 2014 CA. ALL RIGHTS RESERVED.
  • 22.
    Modules Generator –Diagram XML DMGR Template Modules Generator Java Application Web service 22 © 2014 CA. ALL RIGHTS RESERVED. HSQL APM server HSQL database Dashboard created Daily routine for storing thresholds Direct connection between the application and the DMGR for reading XML
  • 23.
    Modules Generator –Components XML DMGR: Communication between the Modules Generator and Deploy Manager WebSphere. Modules Generator reads the serverindex.xml file, which contains the application distribution between AppServers. It is the input to generate the first module and is necessary to ensure that the generator modules can communicate with the DMGR to consume XML. Template: Pre-configured APM module with list of Metric Groups, Alerts and Dashboards to be created. All items in this module have variables that will be used by the Modules Generator. HyperSQL Database: Database embedded in the application. No installation is necessary. It is used to store the thresholds and provide analysis of these and update these values in the APM module. XML Verification Routine: Monitoring of serverindex.xml. Whenever a new module changes must be generated to update information in the Dashboard. Thresholds Recording Routine: Daily execution routine for recording data calculated in Generator modules in the database. The routine will write the data from the previous day. XML DMGR Template HSQL ZABBIX 23 © 2014 CA. ALL RIGHTS RESERVED.
  • 24.
    Main Flow Routine Install APM agent in the application that will be monitored. Communication with DMGR WebSphere – Collect information from applications and App Servers that are running through the XML Server Index. Run Generator Modules – Phase 1 Creating Metric Groups and Alerts. Run the generator modules with the application´s thresholds. Create .jar file to deploy in APM. Daily routine data collection – Necessary to achieve the thresholds, identify the application operating time and possible deviations .jar Deploy – (.jar created by Generator Modules APM) 24 © 2014 CA. ALL RIGHTS RESERVED. Dashboards are created. Mandatory parameters  Hostname and APM Communication Port  User with access to the tool.  Deploy Manager address.  ServerIndex.xml path in server;  Ensure the communication between the Modules Generator and DMGR.  Include the execution routine for .jar into the server. Process that to record historical data in HSQL database.
  • 25.
    What is monitored?  CPU  Garbage collector (Java memory manager) JVM  Servlets (XML/HTML translator)  JSP (Java Server page)  EJB (Motor Java)  JMS (Msgs Java processor) Java  Thread pool  Connection pools AppServer 25 © 2014 CA. ALL RIGHTS RESERVED.  Queries  Connection count  MQ  Web services Backends  URLs  Application Frontends  Time the transaction  Response time, freezing, number of calls and errors are monitored  Information from PMI and JMX  Metric groups Application
  • 26.
    Setting Alerts –Metrics Groups  Grouped metrics that allow information- gathering in one or more applications, or one or more Java component  Metric groups are used to define the alerts, and to follow the health of the application or component that is grouped  Defined by regular expressions that will “match" the information displayed Metrics Groups Example 26 © 2014 CA. ALL RIGHTS RESERVED.
  • 27.
    Setting Alerts –Metrics Signature  Metric signature is a combination of several Metric Groups types that indicates the application most common problems  Integration with others monitoring systems like Alert Modeling Example – Application Bottleneck Increase in concurrent invocation Increase in stall count Application 01 in AppServer_ServerName presenting bottleneck symptoms. Click the link http://XPTO.com.br to view the corresponding Dashboard. Increase in average response time 27 © 2014 CA. ALL RIGHTS RESERVED. Less threads available Possible bottleneck in application With the above condition being true, an alert will be sent to front-end with the following message:
  • 28.
    Dashboard 28 ©2014 CA. ALL RIGHTS RESERVED.
  • 29.
    4 Challenge Improvethresholds management, considering changes in application behavior and false positives. Goal Decrease or eliminate “false positives” in monitoring events, caused by thresholds deviations. 29 © 2014 CA. ALL RIGHTS RESERVED. Solution Creating the concept of dynamic thresholds based on historical occurrences and automatically configure. Results Decrease in false positive application alerts by 77 percent. Proactive monitoring: Thresholds adjusted to alarm before it becomes an incident; trend analysis and deviation in the application behavior; alerts accuracy and automated thresholds updating; thresholds validation mechanism based on application history; input information for application capacity process; thresholds calculated for all active Metric Groups in CA APM’s Module Manager.
  • 30.
    Technical Details –Dynamic Thresholds Create a new database to store indicators historical data.  Create an automatic extraction of observations to feed the database items occurrences.  Develop a logic to identify the thresholds "optimal point."  Implement a new loading process in CA APM when it identifies the need for a new threshold.  Create a new flow of threshold validation and the level of "false positives" rates. APM metrics Threshold calculations Data stored Upgraded module application generator modules Threshold-checking Java 30 © 2014 CA. ALL RIGHTS RESERVED.
  • 31.
    Database Thresholds Example System name Metric group Daily values  Requires monthly validation process to determine if the registered thresholds remain appropriate, or if an update is needed  Data for analysis will always be from the last two months.  Generator Modules will bring statistics data to help the analysis.  Possibility to export data to a .csv file 31 © 2014 CA. ALL RIGHTS RESERVED. Statistical data Current thresholds Updated thresholds
  • 32.
    For More Information Insert appropriate screenshot and text overlay from following “More Info Graphics” slide here; DevOps ensure it links to correct page To learn more about DevOps, please visit: http://bit.ly/1wbjjqX 32 © 2014 CA. ALL RIGHTS RESERVED.
  • 33.
    For Informational PurposesOnly Terms of this Presentation This presentation provided at CA World 2014 is intended for information purposes only and does not form any type of warranty. Content provided in this presentation has not been reviewed for accuracy and is based on information provided by CA Partners and Customers. 33 © 2014 CA. ALL RIGHTS RESERVED.