SlideShare a Scribd company logo
Driving School
Incorporating Learning Strategies in Training of Deep Neural
Networks for Autonomous Driving
Independent Work Report
Artur Filipowicz
arturf@princeton.edu
ORFE Class of 2017
Advisor Professor Alain L. Kornhauser
January 4, 2016
Abstract
Majority of machine learning models are trained by presentation of examples in random order.
Recently, new research emerged which suggests that better performance can be obtained from
neural networks if examples are presented in an order of increasing difficulty. In this report, I
review example presentation, or learning schemes, which following this paradigm; curriculum
learning, self-paced learning, and self-paced curriculum learning, and I attempt to apply self-
paced learning to improve the performance of a car driving neural network.
In the process, I explore several error measures to determine example difficulty and observe
differences in their performance, demonstrating in the process the difficulty of using curriculum
learning for this particular application. I develop an error measure, risk residual, which consid-
ers collision risk when determining the error a neural network makes in predicting affordance
indicators of a driving scene. I show that this measure is more holistic than a square error. I
also propose a probability based measure for example difficulty and explore the computational
difficulty of using such a measure.
Lastly, I develop an algorithm for self-paced learning and use it to train a convolutional neural
network for DeepDriving. While the performance of the network degrades compared to normal
training, I observe that over-fitting may be the reason for the results. I propose two research
paths to resolve the problem.
1
Acknowledgments
I would like to thank Professor Alain L. Kornhauser for his
mentorship during this project and Chenyi Chen for helping
me understand the DeepDriving model.
I would also like to thank the Nvidia Corporation for a GPU
donation which made this project possible.
This paper represents my own work in accordance with University
regulations.
Artur Filipowicz
2
Contents
1 Introduction 8
2 Concepts, Definitions and Notation 9
2.1 DeepDriving . . . . . . . . . . . . . . . . . . . . . . . . . . . . . . . . . . 9
2.1.1 Direct Perception and Affordance Indicators . . . . . . . . . . . . 9
2.1.2 TorcsNet . . . . . . . . . . . . . . . . . . . . . . . . . . . . . . . . 11
2.2 Symbols . . . . . . . . . . . . . . . . . . . . . . . . . . . . . . . . . . . . 11
2.3 Learning Schemes . . . . . . . . . . . . . . . . . . . . . . . . . . . . . . . 12
2.3.1 Curriculum Learning . . . . . . . . . . . . . . . . . . . . . . . . . 12
2.3.2 Self-Paced Learning . . . . . . . . . . . . . . . . . . . . . . . . . . 12
2.3.3 Self-Paced Curriculum Learning . . . . . . . . . . . . . . . . . . . 13
3 Grading 14
3.1 Sum of Square Errors of Unnormalized Output . . . . . . . . . . . . . . . 14
3.1.1 Total Square Error Distribution . . . . . . . . . . . . . . . . . . . 15
3.1.2 Indicators with Greatest Square Error Contribution . . . . . . . . 18
3.1.3 Square Error Accountability . . . . . . . . . . . . . . . . . . . . . 18
3.1.4 Conclusions on Sum of Square Errors of Unnormalized Output . . 20
3.2 Close Frame Analysis . . . . . . . . . . . . . . . . . . . . . . . . . . . . . 23
3.3 Sum of Square Errors of Normalized (Raw) Output . . . . . . . . . . . . 40
3.3.1 Total Square Error Distribution . . . . . . . . . . . . . . . . . . . 40
3.3.2 Indicators with Greatest Square Error Contribution . . . . . . . . 43
3.3.3 Square Error Accountability . . . . . . . . . . . . . . . . . . . . . 45
3.3.4 Conclusions on Sum of Square Errors of Raw Output . . . . . . . 45
3.4 Risk Residuals . . . . . . . . . . . . . . . . . . . . . . . . . . . . . . . . . 46
3.4.1 Distance to car in front (dist MM, dist L, dist R) . . . . . . . . . 46
3.4.2 Distance to cars in left and right lanes (dist LL, dist RR) . . . . . 46
3.4.3 Distance to markings of current lane (toMarking ML, toMarking MR,
toMarking M) . . . . . . . . . . . . . . . . . . . . . . . . . . . . . 46
3.4.4 Distance to markings of other lanes (toMarking LL, toMarking RR,
toMarking L, toMarking R) . . . . . . . . . . . . . . . . . . . . . 46
3.4.5 Angle between car and road headings (angle) . . . . . . . . . . . . 47
3
3.5 Sum of Risk Residuals of Raw Output . . . . . . . . . . . . . . . . . . . 47
3.5.1 Total Risk Residual Distribution . . . . . . . . . . . . . . . . . . 47
3.5.2 Indicators with Greatest Risk Residual Contribution . . . . . . . 50
3.5.3 Risk Residual Accountability . . . . . . . . . . . . . . . . . . . . 52
3.5.4 Conclusions on Sum of Risk Residual of Raw Output . . . . . . . 52
3.6 Total Error Measures . . . . . . . . . . . . . . . . . . . . . . . . . . . . . 53
3.6.1 Linear Combination Measure . . . . . . . . . . . . . . . . . . . . 53
3.6.2 Probabilistic Measure . . . . . . . . . . . . . . . . . . . . . . . . . 54
3.7 Computing the Probabilistic Measure . . . . . . . . . . . . . . . . . . . . 56
3.7.1 Simple Approach . . . . . . . . . . . . . . . . . . . . . . . . . . . 56
3.7.2 Independence Approach . . . . . . . . . . . . . . . . . . . . . . . 57
3.7.3 Differences Between Results . . . . . . . . . . . . . . . . . . . . . 57
3.7.4 Residual Structures . . . . . . . . . . . . . . . . . . . . . . . . . . 61
3.7.5 Poset Approach . . . . . . . . . . . . . . . . . . . . . . . . . . . . 67
4 Learning 69
4.1 Generic Self-Paced Curriculum Learning Algorithm . . . . . . . . . . . . 69
4.2 Grading Algorithm . . . . . . . . . . . . . . . . . . . . . . . . . . . . . . 70
4.3 Normal Learning . . . . . . . . . . . . . . . . . . . . . . . . . . . . . . . 71
4.4 Self-Paced Learning . . . . . . . . . . . . . . . . . . . . . . . . . . . . . . 73
4.4.1 Implementation . . . . . . . . . . . . . . . . . . . . . . . . . . . . 73
4.4.2 Results . . . . . . . . . . . . . . . . . . . . . . . . . . . . . . . . . 74
5 Discussion 81
5.1 Grading . . . . . . . . . . . . . . . . . . . . . . . . . . . . . . . . . . . . 81
5.2 Learning . . . . . . . . . . . . . . . . . . . . . . . . . . . . . . . . . . . . 82
Appendix A GTA V 83
A.1 Overview . . . . . . . . . . . . . . . . . . . . . . . . . . . . . . . . . . . . 83
A.2 The System . . . . . . . . . . . . . . . . . . . . . . . . . . . . . . . . . . 83
A.3 Initial Observations . . . . . . . . . . . . . . . . . . . . . . . . . . . . . . 84
A.4 Camera Models . . . . . . . . . . . . . . . . . . . . . . . . . . . . . . . . 85
A.5 Future Research Goals . . . . . . . . . . . . . . . . . . . . . . . . . . . . 86
4
List of Figures
2.1 Visual representation of the indicators. Reproduced from [3] . . . . . . . 9
3.1 Total square error distribution. . . . . . . . . . . . . . . . . . . . . . . . 16
3.2 Total square error distribution of 96962 of the hardest examples. . . . . . 16
3.3 Total square error distribution of 48481 of the hardest examples . . . . . 17
3.4 Total square error distribution of 4848 of the hardest examples . . . . . . 17
3.5 Example count by indicator with greatest error contribution. Indicators
are in the same order as listed below. . . . . . . . . . . . . . . . . . . . . 18
3.6 Average percent of total error explained as number of top error contribut-
ing indicators. Indicators are in the same order as listed below. . . . . . . 19
3.7 Total square error of normalized (raw) output distribution. . . . . . . . . 41
3.8 Total square error of normalized (raw) output distribution of 96962 of the
hardest examples . . . . . . . . . . . . . . . . . . . . . . . . . . . . . . . 41
3.9 Total square error of normalized (raw) output distribution of 48481 of the
hardest examples . . . . . . . . . . . . . . . . . . . . . . . . . . . . . . . 42
3.10 Total square error of normalized (raw) output distribution of 4848 of the
hardest examples . . . . . . . . . . . . . . . . . . . . . . . . . . . . . . . 42
3.11 Example count by indicator with greatest error contribution. Indicators
are in the same order as listed below. . . . . . . . . . . . . . . . . . . . . 43
3.12 Average percent of total error explained as number of top error contribut-
ing indicators. Indicators are in the same order as listed below. . . . . . . 45
3.13 Total risk residual distribution . . . . . . . . . . . . . . . . . . . . . . . . 48
3.14 Total risk residual distribution of 96962 of the hardest examples . . . . . 48
3.15 Total risk residual distribution of 48481 of the hardest examples . . . . . 49
3.16 Total risk residual distribution of 4848 of the hardest examples . . . . . . 49
3.17 Example count by indicator with greatest error contribution. Indicators
are in the same order as listed below. . . . . . . . . . . . . . . . . . . . . 50
3.18 Average percent of total error explained as number of top error contribut-
ing indicators. Indicators are in the same order as listed below. . . . . . . 52
3.19 Error distributions for probabilistic difficulty example. . . . . . . . . . . 55
3.20 Joint distribution probabilities distribution. . . . . . . . . . . . . . . . . 58
3.21 Independent probabilities distribution. . . . . . . . . . . . . . . . . . . . 58
5
3.22 Distribution of the difference between independent and joint distribution
probabilities. . . . . . . . . . . . . . . . . . . . . . . . . . . . . . . . . . 59
3.23 Distribution of the percent difference between independent and joint dis-
tribution probabilities. . . . . . . . . . . . . . . . . . . . . . . . . . . . . 60
3.24 Distribution of the difference in sort position between examples sorted by
independent and joint distribution probabilities. . . . . . . . . . . . . . . 61
3.25 Risk Residuals by 1st and 2nd PCA components . . . . . . . . . . . . . . 62
3.26 Risk Residuals by 1st and 2nd PCA components (zoom 1) . . . . . . . . 62
3.27 Risk Residuals by 1st and 2nd PCA components (zoom 2) . . . . . . . . 63
3.28 dist RR and dist LL residuals . . . . . . . . . . . . . . . . . . . . . . . . 63
3.29 dist RR and dist LL residuals (zoom) . . . . . . . . . . . . . . . . . . . . 64
3.30 dist R and dist L residuals . . . . . . . . . . . . . . . . . . . . . . . . . . 64
3.31 dist R and dist L residuals (zoom) . . . . . . . . . . . . . . . . . . . . . 65
3.32 toMarking L and toMarking R residuals . . . . . . . . . . . . . . . . . . 65
3.33 toMarking LL and toMarking RR residuals . . . . . . . . . . . . . . . . . 66
3.34 toMarking ML and toMarking MR residuals . . . . . . . . . . . . . . . . 66
3.35 toMarking L and angle residuals . . . . . . . . . . . . . . . . . . . . . . . 67
4.1 Overview of the grading algorithm. . . . . . . . . . . . . . . . . . . . . . 70
4.2 Mean Absolute Error during Normal Training . . . . . . . . . . . . . . . 72
4.3 Self-paced learning schedule. . . . . . . . . . . . . . . . . . . . . . . . . . 73
4.4 Overview of self-paced learning. . . . . . . . . . . . . . . . . . . . . . . . 74
4.5 Mean Absolute Error for the whole training set, dashes lines represent
self-paced learning . . . . . . . . . . . . . . . . . . . . . . . . . . . . . . 75
4.6 Mean Absolute Error for first training set, dashes lines represent self-paced
learning . . . . . . . . . . . . . . . . . . . . . . . . . . . . . . . . . . . . 76
4.7 Mean Absolute Error for selected indicators, dashes lines represent self-
paced learning . . . . . . . . . . . . . . . . . . . . . . . . . . . . . . . . . 77
4.8 Mean Absolute Error on whole training set during self-paced curriculum
training . . . . . . . . . . . . . . . . . . . . . . . . . . . . . . . . . . . . 78
4.9 Mean Absolute Error during self-paced curriculum training on 1 st training
set . . . . . . . . . . . . . . . . . . . . . . . . . . . . . . . . . . . . . . . 79
4.10 Mean Absolute Error during normal training on 1 st training set . . . . . 80
A.1 GTA V Experimental Setup . . . . . . . . . . . . . . . . . . . . . . . . . 84
A.2 Camera model and parameters in TORCS . . . . . . . . . . . . . . . . . 85
A.3 Camera model and parameters in GTA 5 . . . . . . . . . . . . . . . . . . 86
6
List of Tables
2.1 Affordance Indicators. Distances are in meters, and angles are in radians. 10
3.1 Example count by indicator with greatest contribution. . . . . . . . . . . 19
3.2 Hardest Examples by Total Square Error of Unnormalized Output . . . . 21
3.3 Easiest Examples by Total Square Error of Unnormalized Output . . . . 22
3.4 Example count by indicator with greatest contribution to sum of squared
errors of normalized outputs. . . . . . . . . . . . . . . . . . . . . . . . . . 44
3.5 Example count by indicator with greatest contribution. . . . . . . . . . . 51
7
Chapter 1
Introduction
Until recently, the general method for training deep architectures involved presentation
of training examples in random order. In 2009, Bengio et al. proposed curriculum
learning [2] a method for ordering and presenting a training set to a model based on
increasing entropy; starting with simple examples and gradually adding more difficulty
examples during training. Application of curriculum learning not only increased speed of
convergence but also improved the generalization of the trained model [2]. A drawback
of the method was the need for a human to develop a heuristic for creating a curriculum.
Subsequently, self-paced learning was developed [10] and improved [7] which allowed the
model to select the order of training examples. In 2015, the two ideas were unified in
self-paced curriculum learning [8] which orders examples based on human and model
perception of difficulty.
Ideas in [2], [10], [7], [8] and similar approaches in [1] and [12] have been applied to
object tracking in video [14], teaching robots motor skills [9], matrix factorization [15],
handwriting recognition [11], and multi-task learning [13]; surpassing state-of-the-art
benchmarks.
The following report summarizes progress in using the above learning strategies to
improve DeepDriving [3]. The original approach used randomly selected mini-batches
with no pre-training. Based on results in [8] and [6] curriculum learning improves gen-
eralization and thus may improve the driving performance of the DeepDriving model.
Additionally, [14] shows that these strategies can be applied to video and therefore would
fit with the planned incorporation of temporal information.
8
Chapter 2
Concepts, Definitions and Notation
2.1 DeepDriving
2.1.1 Direct Perception and Affordance Indicators
Chenyi et al. introduced a direct perception model for autonomous driving. [3] In
contrast to mediated perception and behavior reflex models, the direct perception model
uses a function to map images to a few significant values called affordance indicators.
These indicators represent the critical information needed to drive a vehicle. There are 13
affordance indicators used to describe the situation of interest, driving down a multi-lane
road. Table 2.1 describes the individual indicators and figure 2.1 shows their location on
the road.
Figure 2.1: Visual representation of the indicators. Reproduced from [3]
9
Affordance Indicators
Indicator Description Min Value Max Value
angle
angle between the cars heading and
the tangent of the road
-0.5 0.5
dist L
distance to the preceding car in the
left lane
0 75
dist R
distance to the preceding car in the
right lane
0 75
toMarking L distance to the left lane marking -7 -2.5
toMarking M distance to the central lane marking -2 3.5
toMarking R distance to the right lane marking 2.5 7
dist LL
dist LL: distance to the preceding car
in the left lane
0 75
dist MM
dist MM: distance to the preceding
car in the current lane
0 75
dist RR
dist RR: distance to the preceding car
in the right lane
0 75
toMarking LL
distance to the left lane marking of
the left lane
-9.5 -4
toMarking ML
distance to the left lane marking of
the current lane
-5.5 -0.5
toMarking MR
distance to the right lane marking of
the current lane
0.5 5.5
toMarking RR
distance to the right lane marking of
the right lane
4 9.5
Table 2.1: Affordance Indicators. Distances are in meters, and angles are in radians.
10
2.1.2 TorcsNet
Chenyi et al. constructed a mapping between images and affordance indicators using
a convolutional neural network, from here on referred to as TorcsNet. The TorcsNet
architecture is based on AlexNet with 5 convolution layers and 4 fully connected layers.
The input layer takes a 280 by 210 pixel image and the output represents the 13 affordance
indicators normalized to the range of [0.1, 0.9]. [3]
The data used for training was collected by Chenyi et al. from an open source racing
game called TORCS. The dataset contains of 484,815 images from a front facing camera,
representing around 12 hours of human driving. Training occurred in batched of 64
randomly selected images and lasted for 140,000 iterations. Euclidean loss is used was
the loss function. [3]
2.2 Symbols
The following are symbols employed throughout this paper.
n = 484815 images
h = 210 height of image in pixels
w = 280 width of image in pixels
Training examples:
X = xi ∈ Rh ∗ w
n
i
(2.1)
Training labels:
Y = yi ∈ Rh ∗ w
n
i
(2.2)
Training dataset:
D = (xi, yi)
n
i
(2.3)
f learning model
w weights of the learning model
v vector of indicators of which examples are used in training
L total error / difficulty function
Ri risk residual for the i indicator
y
(j)
i jth indicator of the ith example
K, µ variables used to select examples for training
11
2.3 Learning Schemes
Learning schemes are ways of presenting training examples to a learning algorithm.
The dominant method is random draw. It is used in most machine learning situations
including [3]. Rather recently, alternative methods have been proposed. These include
curriculum learning [2], self-paced learning [10] and self-paced curriculum learning [8].
The idea behind this methods is to present ”easier” examples first. As noted in [2], doing
so may increase speed of convergence and generalization of the trained model. Below are
the mathematical definitions of the three learning schemes for reference and comparison
to the application described later.
2.3.1 Curriculum Learning
let x ∈ X be an example
let P(x) be target training distribution
let 0 ≤ Wλ(x) ≤ 1 be a weight applied to example x at step λ
0 ≤ λ ≤ 1 and W1(x) = 1
The training distribution at step λ is:
Qλ(x) ∝ Wλ(x)P(x)∀x such that Qλ(x)dx = 1. Q1(x) = P(x)
A curriculum is sequence of distributions Qλ(x) generated by a monotonically in-
creasing sequence of λ 0 → 1 whose entropy increases H(Qλ(x)) < H(Qλ+ (x)) ∀ > 0
and Wλ(x) is monotonically increasing in λ. [2]
2.3.2 Self-Paced Learning
min
w,v∈{0,1}n
E(w, v, K) =
n
i=1
viL(yi, f(xi, w)) −
1
K
n
i=1
vi + r(w)
where r(·) is a regularization term and L(·) is the loss between predicted and groundtruth
values.
w and v are updated iteratively.
For fixed w optimal v* is
v∗
i =
1, L(yi, f(xi, w) < 1
K
0, otherwise
12
When updating w the model trains on a fixed subset of examples [10] [8]
2.3.3 Self-Paced Curriculum Learning
min
w,v∈{0,1}n
E(w, v, K) =
n
i=1
viL(yi, f(xi, w)) + g(v, K) + r(w) s.t.v ∈ Ψ
f(·) controls the learning scheme and Ψ encodes the predetermined learning curricu-
lum [8]
Total order curriculum [8]: for training set X a total order curriculum can be
expressed as a ranking function
γ : X{1, 2, ..., n}
where γ(xi) < γ(xj) implies xi should be learned earlier than xj.
Curriculum region [8]: Given a curriculum γ(·) on X and weights v, Ψ is a cur-
riculum region of γ if
1 Ψ is a nonempty convex set.
2 for any pair of samples xi, xj if γ(xi) < γ(xj) then Ψ
vidv > Ψ
vjdv. ( Ψ
vjdv cal-
culates the expectation of xj within Ψ.)
Self-paced function [8]: g(v, K) determines the leaning scheme and is a self-paced
function if
1 g(v, K) is convex with respect to v ∈ {0, 1}n
2 when all variables are fixed except for vi, li, and v∗
i , g(v, K) deceases with li where li
is the loss of the ith example, and it holds that limli→0 v∗
i = 1, limli→∞ v∗
i = 0.
3 v = n
i=1 vi increases with respect to K and it holds that ∀i ∈ [1, n] limli→0 v∗
i =
1, limli→∞ v∗
i = 0.
13
Chapter 3
Grading
The learning schemes above have two components learning and grading. Learning
updates w and improves the performance of the model, while grading determines which
examples are ”easy” and updates v. I will first examine grading examples and in the
next chapter demonstrate how grading fits into a larger leaning scheme.
A natural definition for difficult is the inverse of error. Meaning, low error indicates
an easy example. This particular definition does ignore inter-example difficulties. In
the case where examples are of different classes, looking at the error of each example
individually may form a bias toward a particular class. Remedies for this are discussed
in [7]. In this application there are no explicit classes of examples.
The problem of grading is reduced to measuring and ranking error, also known as
residual or loss, the neural network makes on examples. The challenge in this particu-
lar application is that the output has 13 dimensions with different units and scales (see
table 2.1). This makes comparison of error between examples and between affordance in-
dicators difficult. It is important to highlight the three different parts of measuring error.
First, there is the output of the network f(xi, w); which may or may not be normalized.
Second, there is a measure of how much that output differs from the groundtruth y on
an indicator by indicator basis. This could be the square of the difference. Third, there
is a formula which combines the individual errors into total error for the example, L. To
begin, we will use a simple sum of square errors of unnormalized output.
3.1 Sum of Square Errors of Unnormalized Output
This measure takes the raw groundtruth values and the final output of the network
and computes the sum of the square of the differences.
14
L(yi, f(xi, w)) =
13
i=1
(yi − f(xi, w))2
(3.1)
3.1.1 Total Square Error Distribution
The above function was applied across the entire training set using the output of a
per-trained network which comes with the DeepDriving training set and source code.
The following is the distribution of the resulting errors.
Characteristics of the set of total square errors for all examples:
The mean is 146.85
The median is 21.53
The std is 481.74
The min is 0.18
The max is 11976.1
The 10th percentile is 6.19
The 20th percentile is 8.87
The 30th percentile is 11.98
The 40th percentile is 15.90
The 50th percentile is 21.53
The 60th percentile is 30.79
The 70th percentile is 49.96
The 80th percentile is 101.61
The 90th percentile is 281.85
The 95th percentile is 602.65
The 98th percentile is 1720.65
The 99th percentile is 2970.85
The 99.9th percentile is 5470.74
The 99.99th percentile is 7705.16
15
Figure 3.1: Total square error distribution.
Figure 3.2: Total square error distribution of 96962 of the hardest examples.
16
Figure 3.3: Total square error distribution of 48481 of the hardest examples
Figure 3.4: Total square error distribution of 4848 of the hardest examples
17
3.1.2 Indicators with Greatest Square Error Contribution
To see which indicators contribute the most error, I counted the number of examples
where the ith indicator contributed the most to the total error.
rank(i) =
N
j
13
i
1{x
(i)
j = xj ∞}
(3.2)
Figure 3.5: Example count by indicator with greatest error contribution. Indicators are
in the same order as listed below.
3.1.3 Square Error Accountability
I also looked at the average percent of total error explained by the top n error con-
tributing indicators for each example.
18
Indicator
Number of examples where indicator contributes the most to
total error
angle 0
dist L 48007
dist R 60697
toMarking L 0
toMarking M 9
toMarking R 0
dist LL 114196
dist MM 99823
dist RR 134321
toMarking LL 7690
toMarking ML 0
toMarking MR 0
toMarking RR 20071
Table 3.1: Example count by indicator with greatest contribution.
19
Figure 3.6: Average percent of total error explained as number of top error contributing
indicators. Indicators are in the same order as listed below.
Average percent of error explained by top 1 indicator: 61.8
Average percent of error explained by top 2 indicators: 82.7
Average percent of error explained by top 3 indicators: 92.2
Average percent of error explained by top 4 indicators: 97.0
Average percent of error explained by top 5 indicators: 98.9
Average percent of error explained by top 6 indicators: 99.5
Average percent of error explained by top 7 indicators: 99.8
Average percent of error explained by top 8 indicators: 99.9
Average percent of error explained by top 9 indicators: 99.9
Average percent of error explained by top 10 indicators: 100
Average percent of error explained by top 11 indicators: 100
Average percent of error explained by top 12 indicators: 100
Average percent of error explained by top 13 indicators: 100
3.1.4 Conclusions on Sum of Square Errors of Unnormalized
Output
The distribution of errors is skewed to the left a lot. While the maximum error is
11976.1, the median is only 21.5. The percentiles increase quite slowly at first. 90%
of the errors are less than 281.9, which is still very far from the maximum error.The
errors themselves are mostly due to indicators which estimate distances to cars (dist L,
dist R, dist LL, dist MM, dist RR). Furthermore, those indicators are responsible for
the majority of the error. On average, the top error contributing indicators accounts for
61.8% of the error. Top 2 account for 82% and top 3 account for 92.2%.
For visual inspection, provided are 16 of the hardest and easiest examples in tables 3.2
and 3.3. It is clear from these examples that no single feature determines if an image
is hard. It seems that in sharp turns are harder as many of the hard examples have
turns. The number of cars, a seemingly reasonable choice for determining difficulty of
an example, has no impact across the two sets. This highlights the problem of a human
making a curriculum for a machine learner.
20
(a) 1 Frame 159854 (b) 2 Frame 346810 (c) 3 Frame 204260 (d) 4 Frame 204262
(e) 5 Frame 45638 (f) 6 Frame 340638 (g) 7 Frame 346935 (h) 8 Frame 376917
(i) 9 Frame 109392 (j) 10 Frame 361338 (k) 11 Frame 346936 (l) 12 Frame 361337
(m) 13 Frame 214317 (n) 14 Frame 64476 (o) 15 Frame 23630 (p) 16 Frame 295623
Table 3.2: Hardest Examples by Total Square Error of Unnormalized Output
21
(a) 1 Frame 400150 (b) 2 Frame 422178 (c) 3 Frame 297604 (d) 4 Frame 311451
(e) 5 Frame 406873 (f) 6 Frame 207285 (g) 7 Frame 298363 (h) 8 Frame 208583
(i) 9 Frame 298257 (j) 10 Frame 131025 (k) 11 Frame 333428 (l) 12 Frame 406308
(m) 13 Frame 313197 (n) 14 Frame 165701 (o) 15 Frame 156946 (p) 16 Frame 430927
Table 3.3: Easiest Examples by Total Square Error of Unnormalized Output
22
3.2 Close Frame Analysis
The following are detailed groundtruths, network outputs, and percent of total square
error for the 16 hardest examples. The actual image and road visualization are also
included. Solid rectangles indicate the actual location of the vehicles and the clear
rectangles indicate predicted locations. Note that quite often most of the error is due to
the network not seeing a car which is in the groundtruth.
23
FRAME: 159854
Indicator
Ground
Truth
CNN
Output
% Error
angle -0.79 -0.26 0.00
dist L 5.47 54.73 0.20
dist R 60.00 41.40 0.03
toMarking L -3.39 -4.15 0.00
toMarking M 0.61 -0.10 0.00
toMarking R 4.61 3.91 0.00
dist LL 7.36 73.58 0.37
dist MM 5.47 73.40 0.39
dist RR 60.00 72.51 0.01
toMarking LL -7.39 -8.86 0.00
toMarking ML -3.39 -5.11 0.00
toMarking MR 0.61 5.22 0.00
toMarking RR 4.61 9.22 0.00
Total Sqaured
Error: 11978.30
24
FRAME: 346810
Indicator
Ground
Truth
CNN
Output
% Error
angle -0.01 -0.13 0.00
dist L 1.04 51.43 0.22
dist R 20.93 56.58 0.11
toMarking L -4.65 -4.43 0.00
toMarking M -0.65 -0.18 0.00
toMarking R 3.35 3.84 0.00
dist LL 1.04 72.40 0.44
dist MM 20.93 73.22 0.23
dist RR 75.00 74.34 0.00
toMarking LL -4.65 -8.87 0.00
toMarking ML -0.65 -4.76 0.00
toMarking MR 3.35 5.22 0.00
toMarking RR 9.50 9.45 0.00
Total Sqaured
Error: 11676.28
25
FRAME: 204260
Indicator
Ground
Truth
CNN
Output
% Error
angle -0.08 0.00 0.00
dist L 10.38 10.18 0.00
dist R 7.01 5.47 0.00
toMarking L -3.49 -3.79 0.00
toMarking M 0.51 0.12 0.00
toMarking R 4.51 4.13 0.00
dist LL 12.41 70.57 0.31
dist MM 10.38 68.99 0.31
dist RR 7.01 71.07 0.37
toMarking LL -7.49 -9.60 0.00
toMarking ML -3.49 -5.71 0.00
toMarking MR 0.51 5.50 0.00
toMarking RR 4.51 9.50 0.00
Total Sqaured
Error: 10983.03
26
FRAME: 204262
Indicator
Ground
Truth
CNN
Output
% Error
angle 0.04 -0.04 0.00
dist L 9.72 13.04 0.00
dist R 6.80 8.36 0.00
toMarking L -3.56 -3.49 0.00
toMarking M 0.44 0.67 0.00
toMarking R 4.44 4.64 0.00
dist LL 75.00 21.59 0.28
dist MM 75.00 15.03 0.35
dist RR 75.00 14.43 0.36
toMarking LL -9.50 -7.09 0.00
toMarking ML -5.50 -2.84 0.00
toMarking MR 5.50 1.18 0.00
toMarking RR 9.50 5.19 0.00
Total Sqaured
Error: 10181.94
27
FRAME: 45638
Indicator
Ground
Truth
CNN
Output
% Error
angle -0.05 0.03 0.00
dist L 25.83 53.26 0.07
dist R 21.11 24.69 0.00
toMarking L -3.46 -3.81 0.00
toMarking M 0.54 0.41 0.00
toMarking R 4.54 4.43 0.00
dist LL 6.81 70.77 0.41
dist MM 25.83 75.79 0.25
dist RR 21.11 72.81 0.27
toMarking LL -7.46 -7.50 0.00
toMarking ML -3.46 -5.64 0.00
toMarking MR 0.54 5.35 0.00
toMarking RR 4.54 9.29 0.00
Total Sqaured
Error: 10076.44
28
FRAME: 340638
Indicator
Ground
Truth
CNN
Output
% Error
angle -0.01 0.06 0.00
dist L 60.00 55.70 0.00
dist R 0.16 56.39 0.34
toMarking L -3.42 -3.70 0.00
toMarking M 0.58 0.36 0.00
toMarking R 4.58 4.33 0.00
dist LL 75.00 77.34 0.00
dist MM 60.00 76.16 0.03
dist RR 0.16 76.20 0.62
toMarking LL -9.50 -7.50 0.00
toMarking ML -3.42 -5.63 0.00
toMarking MR 0.58 5.31 0.00
toMarking RR 4.58 9.30 0.00
Total Sqaured
Error:
9282.86
29
FRAME: 346935
Indicator
Ground
Truth
CNN
Output
% Error
angle 0.14 0.24 0.00
dist L 60.00 53.67 0.00
dist R 0.63 59.47 0.37
toMarking L -3.45 -3.81 0.00
toMarking M 0.55 0.41 0.00
toMarking R 4.55 5.63 0.00
dist LL 75.00 74.74 0.00
dist MM 60.00 73.34 0.02
dist RR 0.63 75.07 0.60
toMarking LL -9.50 -7.50 0.00
toMarking ML -3.45 -5.24 0.00
toMarking MR 0.55 4.80 0.00
toMarking RR 4.55 9.54 0.00
Total Sqaured
Error:
9274.81
30
FRAME: 376917
Indicator
Ground
Truth
CNN
Output
% Error
angle -0.05 -0.01 0.00
dist L 0.73 74.96 0.60
dist R 60.00 76.29 0.03
toMarking L -5.19 -7.00 0.00
toMarking M -1.19 3.30 0.00
toMarking R 2.81 6.87 0.00
dist LL 0.73 58.84 0.37
dist MM 60.00 58.60 0.00
dist RR 75.00 75.97 0.00
toMarking LL -5.19 -5.32 0.00
toMarking ML -1.19 -1.25 0.00
toMarking MR 2.81 2.64 0.00
toMarking RR 9.50 9.69 0.00
Total Sqaured
Error:
9194.73
31
FRAME: 109392
Indicator
Ground
Truth
CNN
Output
% Error
angle 0.00 -0.02 0.00
dist L 44.35 70.14 0.07
dist R 0.61 69.80 0.53
toMarking L -2.80 -5.60 0.00
toMarking M 1.20 2.83 0.00
toMarking R 5.20 6.44 0.00
dist LL 60.00 56.15 0.00
dist MM 44.35 58.30 0.02
dist RR 0.61 58.85 0.37
toMarking LL -6.80 -6.76 0.00
toMarking ML -2.80 -2.74 0.00
toMarking MR 1.20 1.20 0.00
toMarking RR 5.20 5.28 0.00
Total Sqaured
Error:
9064.89
32
FRAME: 361338
Indicator
Ground
Truth
CNN
Output
% Error
angle 0.95 0.11 0.00
dist L 6.68 44.85 0.16
dist R 14.83 34.80 0.04
toMarking L -4.86 -4.16 0.00
toMarking M -0.86 0.45 0.00
toMarking R 3.14 4.38 0.00
dist LL 6.68 67.04 0.40
dist MM 14.83 51.72 0.15
dist RR 75.00 28.91 0.24
toMarking LL -4.86 -7.50 0.00
toMarking ML -0.86 -3.30 0.00
toMarking MR 3.14 2.78 0.00
toMarking RR 9.50 6.98 0.00
Total Sqaured
Error:
9009.06
33
FRAME: 346936
Indicator
Ground
Truth
CNN
Output
% Error
angle 0.16 0.24 0.00
dist L 60.00 53.27 0.01
dist R 0.67 63.14 0.43
toMarking L -3.29 -3.46 0.00
toMarking M 0.71 0.65 0.00
toMarking R 4.71 5.69 0.00
dist LL 75.00 74.85 0.00
dist MM 60.00 65.70 0.00
dist RR 0.67 71.19 0.55
toMarking LL -9.50 -7.50 0.00
toMarking ML -3.29 -4.31 0.00
toMarking MR 0.71 2.73 0.00
toMarking RR 4.71 8.60 0.00
Total Sqaured
Error:
8979.38
34
FRAME: 361337
Indicator
Ground
Truth
CNN
Output
% Error
angle 0.83 0.16 0.00
dist L 75.00 56.23 0.04
dist R 75.00 39.79 0.14
toMarking L -7.00 -5.05 0.00
toMarking M 3.50 2.01 0.00
toMarking R 7.00 5.71 0.00
dist LL 6.41 64.89 0.38
dist MM 14.57 32.08 0.03
dist RR 75.00 15.06 0.40
toMarking LL -5.37 -7.50 0.00
toMarking ML -1.37 -2.63 0.00
toMarking MR 2.63 1.45 0.00
toMarking RR 9.50 5.48 0.00
Total Sqaured
Error:
8943.74
35
FRAME: 214317
Indicator
Ground
Truth
CNN
Output
% Error
angle -0.20 -0.17 0.00
dist L 12.58 13.70 0.00
dist R 60.00 56.06 0.00
toMarking L -3.48 -3.70 0.00
toMarking M 0.52 0.23 0.00
toMarking R 4.52 4.28 0.00
dist LL 3.89 73.70 0.55
dist MM 12.58 73.02 0.41
dist RR 60.00 76.65 0.03
toMarking LL -7.48 -7.50 0.00
toMarking ML -3.48 -5.71 0.00
toMarking MR 0.52 5.49 0.00
toMarking RR 4.52 9.39 0.00
Total Sqaured
Error:
8872.02
36
FRAME: 64476
Indicator
Ground
Truth
CNN
Output
% Error
angle 0.03 0.18 0.00
dist L 8.83 9.44 0.00
dist R 9.68 10.66 0.00
toMarking L -3.44 -3.76 0.00
toMarking M 0.56 0.08 0.00
toMarking R 4.56 4.11 0.00
dist LL 60.00 76.52 0.03
dist MM 8.83 73.54 0.47
dist RR 9.68 75.23 0.49
toMarking LL -7.44 -7.50 0.00
toMarking ML -3.44 -5.87 0.00
toMarking MR 0.56 5.75 0.00
toMarking RR 4.56 9.71 0.00
Total Sqaured
Error:
8818.00
37
FRAME: 23630
Indicator
Ground
Truth
CNN
Output
% Error
angle 0.16 0.10 0.00
dist L 13.55 50.19 0.15
dist R 10.42 51.81 0.20
toMarking L -3.77 -5.31 0.00
toMarking M 0.23 1.85 0.00
toMarking R 4.23 5.62 0.00
dist LL 75.00 39.27 0.15
dist MM 75.00 23.93 0.30
dist RR 75.00 33.15 0.20
toMarking LL -9.50 -6.10 0.00
toMarking ML -5.50 -2.05 0.00
toMarking MR 5.50 2.19 0.00
toMarking RR 9.50 6.37 0.00
Total Sqaured
Error:
8742.63
38
FRAME: 295623
Indicator
Ground
Truth
CNN
Output
% Error
angle -0.22 -0.17 0.00
dist L 7.53 72.88 0.49
dist R 6.75 72.93 0.50
toMarking L -2.80 -7.04 0.00
toMarking M 1.20 3.65 0.00
toMarking R 5.20 7.11 0.00
dist LL 75.00 75.86 0.00
dist MM 7.53 6.43 0.00
dist RR 6.75 5.80 0.00
toMarking LL -9.50 -9.72 0.00
toMarking ML -2.80 -2.49 0.00
toMarking MR 1.20 1.44 0.00
toMarking RR 5.20 5.47 0.00
Total Sqaured
Error:
8681.42
39
3.3 Sum of Square Errors of Normalized (Raw) Out-
put
This section contains the same analysis as above for raw (normalized) output of the
network. The groundtruth values have also been scaled to the range [0.1, 0.9]. [3]
3.3.1 Total Square Error Distribution
Characteristics of the set of total square errors for all examples:
The mean is 0.035
The median is 0.006
The std is 0.12
The min is 0.0001
The max is 5.90
The 10th percentile is 0.002
The 20th percentile is 0.002
The 30th percentile is 0.003
The 40th percentile is 0.004
The 50th percentile is 0.006
The 60th percentile is 0.008
The 70th percentile is 0.012
The 80th percentile is 0.022
The 90th percentile is 0.055
The 95th percentile is 0.153
The 98th percentile is 0.367
The 99th percentile is 0.618
The 99.9th percentile is 1.483
The 99.99th percentile is 2.684
40
Figure 3.7: Total square error of normalized (raw) output distribution.
Figure 3.8: Total square error of normalized (raw) output distribution of 96962 of the
hardest examples
41
Figure 3.9: Total square error of normalized (raw) output distribution of 48481 of the
hardest examples
Figure 3.10: Total square error of normalized (raw) output distribution of 4848 of the
hardest examples
42
3.3.2 Indicators with Greatest Square Error Contribution
Figure 3.11: Example count by indicator with greatest error contribution. Indicators are
in the same order as listed below.
43
Indicator
Number of examples where indicator contributes the most to
total error
angle 46566
dist L 20335
dist R 23548
toMarking L 30290
toMarking M 10666
toMarking R 30997
dist LL 74767
dist MM 56107
dist RR 85868
toMarking LL 35306
toMarking ML 17493
toMarking MR 16504
toMarking RR 36368
Table 3.4: Example count by indicator with greatest contribution to sum of squared
errors of normalized outputs.
44
3.3.3 Square Error Accountability
Figure 3.12: Average percent of total error explained as number of top error contributing
indicators. Indicators are in the same order as listed below.
3.3.4 Conclusions on Sum of Square Errors of Raw Output
The error distribution on the raw output is similar to the unnormalized one. The largest
error is about 60,000 times larger than the smallest error. Since these are outputs of a
trained network, such difference is evidence of learning. What is much more important
is that for every indicator there is an example where that indicator contributes the most
to the total error, as seen in 3.11. Also, more indicators are needed to explain the error.
The first indicator only explains 40% as oppose to 60%. Figure 3.12 has a much smoother
increase than figure 3.6. This indicates that now the affordance indicators are treated
more equally in the error measure. This means that there is a smaller or no bias toward
any particular indicator and the errors are more comparable.
45
3.4 Risk Residuals
Thus far, the difficulty is measured as a sum of squared differences. This measure
treats all errors equally. However, in this particular application having the angle off by
few degrees or an error in distance to a car 70 m away of 1 m is not a significant error.
This is at least true from the point of view of avoiding a collision. Having an error of 1
m on a vehicle 5 m away is a very risky mistake. Following this idea, I developed risk
residuals. These are affordance indicator specific error measures.
3.4.1 Distance to car in front (dist MM, dist L, dist R)
R(yi, f(xi, w)) =
|y
(j)
i − f(xi, w)(j)
|
|y
(j)
i | +
(3.3)
For small y
(j)
i the residual will be large for a large error. When a vehicle is close, the
residual penalizes any large deviation.
3.4.2 Distance to cars in left and right lanes (dist LL, dist RR)
R(yi, f(xi, w)) =
|y
(j)
i − f(xi, w)(j)
|
C(|y
(j)
i |)d +
(3.4)
This residual functions with the same logic as above. Constants C and d can be used
to reduce the importance of the error made on distance to cars in the side lines as those
are not as likely to cause a collision.
3.4.3 Distance to markings of current lane (toMarking ML,
toMarking MR, toMarking M)
R(yi, f(xi, w)) =
|y
(j)
i − f(xi, w)(j)
|
|y
(j)
i | +
(3.5)
For small y
(j)
i the residual will be large for a large error. The residual penalizes any
large errors when the vehicle is close to a lane marking.
3.4.4 Distance to markings of other lanes (toMarking LL, toMark-
ing RR, toMarking L, toMarking R)
R(yi, f(xi, w)) =
|y
(j)
i − f(xi, w)(j)
|
C(|y
(j)
i |)d +
(3.6)
This residual functions with the same logic as above. Constants C and d can be used
to reduce the importance of the error made on distance to markings in the side lanes as
those are not as important.
46
3.4.5 Angle between car and road headings (angle)
R(yi, f(xi, w)) =
0 yi ≤ t & f(xi, w) ≤ t
|y
(j)
i | ∗ |y
(j)
i − f(xi, w)(j)
| else
(3.7)
Large angles indicate sharp turns. Therefore, the residual should be large. The
residual is 0 for small angles since you don’t have to go perfectly straight on the road.
3.5 Sum of Risk Residuals of Raw Output
For the analysis in this section raw output of the network is used. C = 1.2 and d = 1.
L(yi, f(xi, w)) =
13
i=1
Ri
(yi, f(xi, w)) (3.8)
Where Ri is the residual function for the i affordance indicator.
3.5.1 Total Risk Residual Distribution
Characteristics of the set of total risk residuals for all examples:
The mean is 0.835
The median is 0.542
The std is 1.0931
The min is 0.056
The max is 21.881
The 10th percentile is 0.248
The 20th percentile is 0.327
The 30th percentile is 0.398
The 40th percentile is 0.466
The 50th percentile is 0.542
The 60th percentile is 0.636
The 70th percentile is 0.775
The 80th percentile is 1.006
The 90th percentile is 1.443
The 95th percentile is 2.402
The 98th percentile is 4.216
The 99th percentile is 5.785
The 99.9th percentile is 12.248
The 99.99th percentile is 16.060
47
Figure 3.13: Total risk residual distribution
Figure 3.14: Total risk residual distribution of 96962 of the hardest examples
48
Figure 3.15: Total risk residual distribution of 48481 of the hardest examples
Figure 3.16: Total risk residual distribution of 4848 of the hardest examples
49
3.5.2 Indicators with Greatest Risk Residual Contribution
Figure 3.17: Example count by indicator with greatest error contribution. Indicators are
in the same order as listed below.
50
Indicator
Number of examples where indicator contributes the most to
total error
angle 546
dist L 13983
dist R 9761
toMarking L 127265
toMarking M 7164
toMarking R 19401
dist LL 42411
dist MM 36607
dist RR 26199
toMarking LL 117153
toMarking ML 46256
toMarking MR 33287
toMarking RR 4782
Table 3.5: Example count by indicator with greatest contribution.
51
3.5.3 Risk Residual Accountability
Figure 3.18: Average percent of total error explained as number of top error contributing
indicators. Indicators are in the same order as listed below.
3.5.4 Conclusions on Sum of Risk Residual of Raw Output
There are two interesting differences between risk residuals and raw and unnormalized
output. First, in figure 3.17, the indicators of distances to cars are no longer the main risk
contributors in many examples as seen in 3.11. Instead toMarking L and toMarking LL
are dominate in this respect. This is probably the result of diminishing the value of
errors at large distances. As stated in [3], the network is noisy in it’s distance predictions
when a car is far away. This may be relatively large but not very important, and figure
3.17 shows that the risk residuals ignore that noise. The emergence of toMarking L and
toMarking LL is revealing important difficulty the network is having.
The second difference can be see in figure 3.18. This graph increases even more gradu-
ally than graphs in figures 3.12 and 3.6. The first indicator only explains 36% as oppose
to 40% and 60%. This suggest that the residuals are treated equally; all of the error in
52
an example does not originate with a single or a pair of residuals. This indicates a more
holistic measure of difficulty.
3.6 Total Error Measures
3.6.1 Linear Combination Measure
The three total error measures explored thus far are linear combinations of errors or
residuals of affordance indicators. There are several versions of such functions. These
versions are listed below as a demonstration of the number of possible ways to measure
total error. Of course, weights could also be assigned to each term in the sum leading to
even more functions.
Total Risk Residual
L(yi, f(xi, w)) =
13
i=1
Ri
(yi, f(xi, w)) (3.9)
Where Ri is the residual function for the i affordance indicator.
Total Square Error Function
L(yi, f(xi, w)) =
13
j=1
(y
(j)
i − f(xi, w)(j)
)2
(3.10)
Normalized Total Square Error Function
L(yi, f(xi, w)) =
13
j=1
|
y
(j)
i − f(xi, w)(j)
y
(j)
i
| (3.11)
Problem arises when y
(j)
i = 0
Normalized Total Absolute Error Function
L(yi, f(xi, w)) =
13
j=1
(
y
(j)
i − f(xi, w)(j)
y
(j)
i
)2
(3.12)
Problem arises when y
(j)
i = 0
53
Range Normalized Total Square Error
L(yi, f(xi, w)) =
13
j=1
(
y
(j)
i − f(xi, w)(j)
ymax
j − ymin
j
)2
(3.13)
Where ymax
j and ymin
j are the minimum and maximum values of the jth indicator.
Range Normalized Total Absolute Error
L(yi, f(xi, w)) =
13
j=1
|
y
(j)
i − f(xi, w)(j)
ymax
j − ymin
j
| (3.14)
Where ymax
j and ymin
j are the minimum and maximum values of the jth indicator.
3.6.2 Probabilistic Measure
An alternative to summing the residuals for comparison is to compute probabilities.
Let ri be a vector of residuals (errors) for example i, r ∈ R13
. For the following analysis,
I will use square error for residual. Let L(xi) be the difficulty of example i.
L(xi) = P{ −|ri| ≤ |R| ≤ |ri| }
= P{ −|r1
i | ≤ |R1
| ≤ |r1
i |, ... , −|r13
i | ≤ |R13
| ≤ |r13
i | }
= P{ find example with samller errors }
= P{ less error prone example }
(3.15)
L(xi) is large ⇒ xi is a hard example since probability of finding an easier example is
high.
L(xi) is small ⇒ xi is an easy example.
The intuition for the measure is as follows. Let’s say that there are only two indicators:
angle and distance. Figure 3.19 shows two different error distributions for the angle and
distance indicators. The vertical lines indicate the positive and negative value of the
error of the indicator for our example. In Case 1 and 2, the error on the angle is the
same as is the error distribution. The error on the distance is the same in both cases, but
the distribution for case two is shifted. The shift suggests that the distance indicator is
more error prone in the second example. L will be larger for Case 1 than Case 2. While
the network made the same error in both cases, in Case 1, the error on the distance is
54
(a) Case 1 Angle Distribution (b) Case 1 Distance Distribution
(c) Case 2 Angle Distribution (d) Case 2 Distance Distribution
Figure 3.19: Error distributions for probabilistic difficulty example.
55
more significant because in general the error in the distance are close to zero. Thus, our
error is more significant, being made on an ”easy” indicator. In Case 2, the error in the
distance is less significant, because the distance indicator is error prone to begin with
and we have done better than most of those errors. Therefore, the example in Case 1 is
harder than in Case 2.
Additionally, this measure can be applied to individual indicators. The amount of
error caused by indicator j in example i is L(xi, j) = P{−|rj
i | ≤ |Rj
| ≤ |rj
i |} We can
compare errors across indicators in a single example by looking at how likely it is to make
a smaller error. Severe errors will have L close to 1.
3.7 Computing the Probabilistic Measure
3.7.1 Simple Approach
The following python code computes L for example i by counting the number of ex-
amples with smaller residuals.
H = np.zeros(shape=(numOfExamples))
for i in range(0, numOfExamples):
example = dist[:,i]
print i
for j in range(0, i) + range(i+1, numOfExamples):
e = 0
for r in range(0,13):
if (-abs(example[r]) <= dist[r][j] and dist[r][j] <= abs(example[r])):
e = e + 1
if(e == 13):
H[i] = H[i] + 1
The complexity of this code is O(n2
) in the number of examples. The run time for
each example is about 14 seconds.
14 s/example ∗ 484815 examples = 6, 787, 410 s = 1, 885.39 h = 78.558 days
56
This is too long to be practical, especially considering that grading must be done
several times during training.
3.7.2 Independence Approach
We could assume that Ri
∀ i are independent. Then we can rewrite H as follows:
H(xi) = P{ |R| ≤ |ri| }
= P{ |R1
| ≤ |r1
i |, ... , |R13
| ≤ |r13
i | }
=
13
j=1
P{ |Rj
| ≤ |rj
i |}
(3.16)
We can use this formulation to speed up computation. We presort the individual residual
distributions and use binary search to find out how many residuals are smaller than the
residual of the current example. The time complexity is 13 ∗ n log n for sorting and
n ∗ log n for binary searches. Therefore, the time complexity is O(n log n) in the number
of examples. The code below computes the log probabilities and computes L. The run
time of this code for all examples is around 57 seconds, or 0.0001 seconds per example.
sort = np.zeros(shape=(13, numOfExamples))
for i in range(0,13):
sort[i,:] = np.sort(np.abs(dist[i,:]))
H = np.zeros(shape=(numOfExamples))
for i in range(0, numOfExamples):
example = dist[:,i]
for r in range(0,13):
H[i] = H[i] + np.log(np.searchsorted(sort[r,:], np.abs(example[r]),
side=’right’)/(1.0*numOfExamples))
3.7.3 Differences Between Results
Probabilities computed using the simple approach are not the same as the probabilities
computed under the independence assumption. Let I be the set of probabilities calcu-
lated under the assumption that residuals of different indicators are independent. Let J
be the set of probabilities calculated from the joint distribution. I calculated the joint
and independent probabilities for 500 random examples. Below are the distributions,
which are different.
57
Figure 3.20: Joint distribution probabilities distribution.
Figure 3.21: Independent probabilities distribution.
To see how close the independent probabilities are to the joint distribution probabili-
ties, below is the distribution of I − J.
Independent - Joint Probabilities Distribution Characteristics
The mean is -0.00039
The median is -0.00014
The std is 0.00048
The min is -0.00135
The max is -0.00000
The 10th percentile is -0.00114
The 20th percentile is -0.00073
58
The 30th percentile is -0.00051
The 40th percentile is -0.00035
The 50th percentile is -0.00014
The 60th percentile is -0.00000
The 70th percentile is -0.00000
The 80th percentile is -0.00000
The 90th percentile is -0.00000
The 95th percentile is -0.00000
The 98th percentile is -0.00000
The 99th percentile is -0.00000
Figure 3.22: Distribution of the difference between independent and joint distribution
probabilities.
The distribution of percent error I−J
J
is detailed below. In many cases the percent
difference reveals that the independent probabilities are much smaller than the joint dis-
tribution probabilities.
Percent Error Distribution Characteristics
The mean is -0.76884
The median is -0.93859
The std is 0.43896
The min is -1.00000
The max is 3.16912
The 10th percentile is -0.998
The 20th percentile is -0.991
The 30th percentile is -0.978
The 40th percentile is -0.962
59
The 50th percentile is -0.938
The 60th percentile is -0.886
The 70th percentile is -0.792
The 80th percentile is -0.613
The 90th percentile is -0.419
The 95th percentile is -0.169
The 98th percentile is 0.542
The 99th percentile is 0.816
Figure 3.23: Distribution of the percent difference between independent and joint distri-
bution probabilities.
Since we mostly care about the relative magnitude of the probabilities, I sorted them
and took the differences between the position of the probabilities of one example in their
respective sorted orders. It is interesting to note that the distribution of this difference
appears to be normal. The problem is that this also implies that the ordering of the two
probabilities is very different and that difference is random.
Sort Order Position Distribution Characteristics
The mean is 0.00000
The median is -1.50000
The std is 200.68963
The min is -444.00000
The max is 471.00000
The 10th percentile is -273.6
The 20th percentile is -167.0
The 30th percentile is -114.6
The 40th percentile is -60.0
60
The 50th percentile is -1.5
The 60th percentile is 38.4
The 70th percentile is 104.6
The 80th percentile is 184.6
The 90th percentile is 269.4
The 95th percentile is 347.3
The 98th percentile is 400.0
The 99th percentile is 415.0
Figure 3.24: Distribution of the difference in sort position between examples sorted by
independent and joint distribution probabilities.
3.7.4 Residual Structures
It is clear that the risk residuals are not independent. To explore the structure of
the residual vectors I ran PCA on all of the examples. For 2 components the explained
variance is 0.869 and 0.123.
61
Figure 3.25: Risk Residuals by 1st and 2nd PCA components
Figure 3.26: Risk Residuals by 1st and 2nd PCA components (zoom 1)
62
Figure 3.27: Risk Residuals by 1st and 2nd PCA components (zoom 2)
The principal component is made up of mostly the 9th and 3rd indicators, dist RR and
dist R. The second component is made up of mostly the 7th and 2nd indicators, dist LL
and dist L. A third component would only explain 0.005 of the variance and is mostly
made up of the 7th and 2nd indicators.
Graphs of the residual pairs show how much variance there is between the residuals,
explaining why they dominate the PCA. It is also clear that they are not independent.
Figure 3.28: dist RR and dist LL residuals
63
Figure 3.29: dist RR and dist LL residuals (zoom)
Figure 3.30: dist R and dist L residuals
64
Figure 3.31: dist R and dist L residuals (zoom)
Along the same lines of analysis, I plotted several other residuals. From these graphs
we can see that not only are the residuals not independent, they have linear forms of
dependency.
Figure 3.32: toMarking L and toMarking R residuals
65
Figure 3.33: toMarking LL and toMarking RR residuals
Figure 3.34: toMarking ML and toMarking MR residuals
66
Figure 3.35: toMarking L and angle residuals
3.7.5 Poset Approach
It is possible to speed up the computation of the probabilities form the full joint
distribution by using algorithms for posets. Vector of residuals r forms a partially ordered
set, poset
P = (P, ) (3.17)
where P is a set of r vectors. Let’s define a relation on P
⊂ PxP (3.18)
let a, b ∈ P, if (a, b) ∈ then a b and ai
≥ bi
∀ i (3.19)
Properties of :
reflexive
x x → x = x since |xi| ≥ |xi| ∀ i (3.20)
antisymmetric
x y & y x → x = y (3.21)
|xi| ≥ |yi| ∀ i & |yi| ≥ |xi| ∀ i → |yi| = |xi| (3.22)
transitive
y x & z y → z x (3.23)
y x → |yi| ≥ |xi| ∀ i (3.24)
z y → |zi| ≥ |yi| ∀ i (3.25)
→ |zi| ≥ |xi| ∀ i (3.26)
→ z x (3.27)
67
With the above definitions and properties, [4] and [5] provide some interesting algo-
rithms and data structures for counting posets.
68
Chapter 4
Learning
Measuring the difficulty of examples is only half of the problem. The other half, which
is arguably more important, is training and improving the performance of the network. To
perform an initial exploration, I designed an algorithm for self-paced curriculum learning
and used the sum of squared errors of unnormalized outputs for difficulty measure. Self-
paced learning avoids the complexities of adding a human imposed curriculum which for
the problem at hand is not easy to define.
4.1 Generic Self-Paced Curriculum Learning Algo-
rithm
The algorithm selects every more difficult examples as K approaches 0.
Algorithm 1 Algorithm for self-paced learning in DeepDriving
Input: D, w0, K0
Output: w
1: K ← K0
2: w ← w0
3: set vi = 1 if L(yi, f(xi, w)) < 1
K
∀i
4: Select initial easy examples A = {xi : xi ∈ D, vi = 1}
5: repeat
6: Update w by training
7: K ← K/µ
8: Update vi = 1 if L(yi, f(xi, w)) < 1
K
∀i
9: Update easy examples A = {xi : xi ∈ D, vi = 1}
10: until vi = 1 ∀i and Caffe training ended
69
4.2 Grading Algorithm
For this, as for any measure, a simple grading algorithm is used to compute the er-
ror across the entire training set. The algorithm runs as follows. Each example in the
database is read in and passed to the convolutional neural network, CNN. The output
of the CNN is used to compute the error for individual indicators and the errors along
with groundtruths are stored in an assessment file.
Figure 4.1: Overview of the grading algorithm.
Every 1000 images take about 30 seconds to grade. This means the whole dataset can
be processed in 3 to 4 hours. Majority of that time is spent on running the CNN and is
therefore unavoidable. The following two tables detail timings of different parts of the
algorithm. The hardware used was Intel I7 CPU 860 2.86 Hz x8, 16 Gb of RAM and
Tesla K40 GPU
Code Timings for torcs db grade.cpp using GPU (per 1000 images)
Action Time (s)
ReadWrite from LevelDB 2.7
Run CNN on example 22
Calculate error 0.002
Visualize results 0.801
Out of curiosity I ran the algorithm without a GPU and recorded the timings as well.
70
Code Timings for torcs db grade.cpp using CPU (per 1000 images)
Action Time (s)
Read/Write from LevelDB 3.2
Run CNN on example 270.65
Calculate error 0.002
Visualize results 0.756
4.3 Normal Learning
For comparison, I first ran normal training for 140,000 iterations. To see progress of
the training, I computed the mean absolute error across the entire training set at specific
iterations. The TORCS Net, a pertained network which comes with the Deep Driving
source code, and the final network in the normal training have almost the same error.
The difference are on the order of hundredths to thousandths. This translates to the
errors from the two networks differing on average across half of a million examples by
millimeters to few centimeters. Roughly, the training arrive at the same result.
71
Mean Absolute Error during Normal Training
Iteration angle dist L dist R toMarking L toMarking M toMarking R dist LL dist MM dist RR toMarking LL toMarking ML toMarking MR toMarking RR
1 0.077 32.014 29.940 1.862 2.077 1.788 29.340 23.409 29.929 1.804 1.199 1.114 1.748
20,000 0.032 2.948 3.247 0.209 0.265 0.235 3.794 4.107 4.040 0.200 0.179 0.170 0.200
35,000 0.031 2.516 2.637 0.178 0.216 0.195 3.410 3.804 3.607 0.204 0.188 0.183 0.189
55,000 0.027 2.602 2.568 0.174 0.204 0.181 3.316 3.337 3.271 0.177 0.165 0.153 0.171
70,000 0.026 2.234 2.272 0.149 0.177 0.161 3.324 3.218 3.102 0.178 0.161 0.145 0.154
90,000 0.024 2.164 2.265 0.152 0.185 0.168 3.014 3.162 2.988 0.189 0.159 0.151 0.170
105,000 0.024 2.266 2.297 0.153 0.192 0.170 2.873 2.864 2.930 0.160 0.136 0.131 0.151
125,000 0.023 2.034 2.117 0.143 0.164 0.151 2.851 2.911 2.879 0.156 0.135 0.131 0.158
140,000 0.023 2.047 2.113 0.145 0.174 0.152 2.829 2.758 2.959 0.158 0.126 0.130 0.157
TORCS
Net
0.023 1.983 2.142 0.140 0.160 0.144 2.774 2.704 2.881 0.152 0.127 0.127 0.156
Figure 4.2: Mean Absolute Error during Normal Training
4.4 Self-Paced Learning
4.4.1 Implementation
TROCS Net and my normal training network were trained for 140,000 iterations. For
the initial test of self-paced learning, I decided to divide the 140,000 iterations into 4
sections, called courses, of 35,000 iterations. The first course involves training on the
whole dataset to produce the initial w0. The schedule is illustrated in figure 4.3.
Figure 4.3: Self-paced learning schedule.
At the end of each course, the weights of the network are used by the grader to compute
the error on each of the examples in the database. The grader sorts the errors using a
priority queue and selects the ones with the smallest error to construct a training set
for the next course. In this implementation the new training set represents v from the
algorithm. K and µ are embedded into the rules that for the second course 1/3 of the
whole set is selected and for the third course 2/3 of the whole set are selected. Figure
4.4 illustrates the components of self-paced learning implementation.
73
Figure 4.4: Overview of self-paced learning.
4.4.2 Results
As seen in figure 4.8, the mean absolute error is significantly worse than that of TORCS
net and the normal training network for all indicators. Since both of these networks had
more time to look at the whole dataset, I looked at the mean absolute error across just
the examples contained in the 1st training set, the set formed after Course I. TORCS
net and the normal training network both have a similar error as seen in figure 4.10.
However, the self-paced curriculum learning network still does significantly worse, see
figure 4.9.
Additionally, each time the training set is expanded, the error increases across all of
the indicators. This is seen for the whole dataset, figure 4.5, and the 1st training set,
figure 4.6. In both figures each line represents the error for one indicator. Dashes lines
represent self-paced learning. In figure 4.6 an additional point was added at iteration
105,000 to highlight the increase in error. The vertical dashed lines indicate iterations
where the training set was expended.
74
Figure 4.5: Mean Absolute Error for the whole training set, dashes lines represent self-
paced learning
75
Figure 4.6: Mean Absolute Error for first training set, dashes lines represent self-paced
learning
76
Figure 4.7: Mean Absolute Error for selected indicators, dashes lines represent self-paced
learning
77
Mean Absolute Error during self-paced curriculum training
Iteration angle dist L dist R toMarking L toMarking M toMarking R dist LL dist MM dist RR toMarking LL toMarking ML toMarking MR toMarking RR
1 0.077 32.014 29.940 1.862 2.077 1.788 29.340 23.409 29.929 1.804 1.199 1.114 1.748
20,000 0.031 2.938 2.987 0.197 0.227 0.208 3.872 4.019 3.961 0.210 0.176 0.167 0.195
35,000 0.030 2.864 3.116 0.212 0.262 0.233 3.545 3.452 3.535 0.226 0.191 0.170 0.177
55,000 0.041 3.691 4.073 0.242 0.275 0.242 4.223 4.660 4.914 0.250 0.236 0.235 0.247
70,000 0.036 3.386 3.786 0.215 0.252 0.220 4.036 4.382 4.669 0.223 0.216 0.204 0.196
90,000 0.036 3.683 3.895 0.210 0.269 0.234 3.943 4.514 4.603 0.239 0.216 0.200 0.210
105,000 0.034 3.637 3.847 0.226 0.262 0.226 3.663 4.272 3.902 0.200 0.197 0.195 0.202
125,000 0.037 3.215 3.259 0.209 0.247 0.220 3.945 4.303 4.034 0.223 0.225 0.221 0.220
140,000 0.031 2.778 2.721 0.187 0.220 0.198 3.517 3.559 3.473 0.203 0.202 0.181 0.204
Normal 0.023 2.047 2.113 0.145 0.174 0.152 2.829 2.758 2.959 0.158 0.126 0.130 0.157
TORCS
Net
0.023 1.983 2.142 0.140 0.160 0.144 2.774 2.704 2.881 0.152 0.127 0.127 0.156
Figure 4.8: Mean Absolute Error on whole training set during self-paced curriculum training
Mean Absolute Error during self-paced curriculum training on 1 st training set
Iteration angle dist L dist R toMarking L toMarking M toMarking R dist LL dist MM dist RR toMarking LL toMarking ML toMarking MR toMarking RR
1 0.065 33.525 31.305 1.984 2.253 1.886 30.040 24.231 32.088 1.786 1.113 1.037 1.935
20,000 0.027 1.558 1.662 0.148 0.166 0.166 2.173 2.305 2.069 0.168 0.131 0.134 0.171
35,000 0.025 1.544 1.679 0.163 0.198 0.188 1.882 1.749 1.513 0.193 0.156 0.142 0.148
55,000 0.031 1.270 1.473 0.153 0.170 0.154 1.681 1.826 1.810 0.183 0.169 0.177 0.179
70,000 0.027 1.197 1.304 0.141 0.161 0.145 1.555 1.662 1.580 0.164 0.148 0.140 0.139
90,000 0.028 1.404 1.401 0.139 0.167 0.155 1.669 1.982 1.821 0.184 0.149 0.140 0.155
105,000 0.026 1.243 1.287 0.147 0.162 0.149 1.383 1.823 1.500 0.148 0.135 0.141 0.157
125,000 0.032 1.833 1.817 0.163 0.192 0.173 2.226 2.479 2.097 0.182 0.176 0.186 0.187
140,000 0.026 1.485 1.540 0.148 0.167 0.162 1.815 1.848 1.819 0.171 0.164 0.152 0.187
TORCS
Net
0.019 1.048 1.259 0.113 0.123 0.122 1.527 1.455 1.466 0.129 0.099 0.104 0.144
Figure 4.9: Mean Absolute Error during self-paced curriculum training on 1 st training set
Mean Absolute Error during normal training on 1 st training set
Iteration angle dist L dist R toMarking L toMarking M toMarking R dist LL dist MM dist RR toMarking LL toMarking ML toMarking MR toMarking RR
1 0.065 33.525 31.305 1.984 2.253 1.886 30.040 24.231 32.088 1.786 1.113 1.037 1.935
20,000 0.027 1.505 1.707 0.165 0.203 0.178 2.051 2.163 2.091 0.167 0.137 0.137 0.179
35,000 0.027 1.304 1.385 0.135 0.161 0.158 1.789 2.267 1.807 0.169 0.145 0.153 0.163
55,000 0.023 1.487 1.455 0.142 0.154 0.145 1.911 1.789 1.631 0.147 0.129 0.124 0.149
70,000 0.022 1.160 1.122 0.114 0.133 0.123 2.016 1.758 1.481 0.149 0.126 0.117 0.131
90,000 0.021 1.171 1.289 0.124 0.144 0.142 1.688 1.846 1.457 0.165 0.126 0.124 0.157
105,000 0.021 1.221 1.319 0.123 0.146 0.139 1.613 1.580 1.455 0.135 0.106 0.107 0.136
125,000 0.020 1.095 1.181 0.116 0.124 0.125 1.620 1.699 1.397 0.131 0.105 0.106 0.144
140,000 0.020 1.088 1.144 0.120 0.136 0.124 1.588 1.502 1.475 0.136 0.097 0.107 0.145
TORCS
Net
0.019 1.048 1.259 0.113 0.123 0.122 1.527 1.455 1.466 0.129 0.099 0.104 0.144
Figure 4.10: Mean Absolute Error during normal training on 1 st training set
Chapter 5
Discussion
A lot of work remains to be done. While the initial application of these learning
strategies appears to be a failure, there remain many possibilities to improve this result.
This research will serve as a guide for future exploration and the following discussion will
highlight some of the questions yet to be answered.
5.1 Grading
In grading examples, we see that use of risk residuals creates a more robust and holistic
difficulty measure. Comparing figure 3.17 to figure 3.11, distances to cars are no longer
the main risk contributors. This means that risk residuals have reduced the effect of noise
in those indicators, as noted in [3]. The amount of error accounted for by top indicators,
increases much more gradually, compare figure 3.18 to figures 3.12 and 3.6. These results
indicate that this may be a good measure of difficulty. It remains to be seen how this
measure impacts training. It would also be interesting to determine a logical procedure
for computing C and d for risk residuals.
The probabilistic measure, 3.15, would be interesting to experiment with as its defini-
tion is very intuitive. A faster means of computing the probability must be found first.
In future research, algorithms from [4] and [5] should be implemented or a Monte Carlo
method employed to speed up computation.
In figures 3.35, 3.32, 3.33 and 3.34, residuals have linear dependencies. It is unclear
what causes these. My hypothesis is that since these are distances to lane marking
indicators corresponding to opposite lanes, the linear dependency in residuals is due
to the fact that the network learned the relationship between the two distances. The
network learned that the distances sum to a constant, the closer the car is to the left line
the further it is from the right line. If this is the case, the network making an error in one
indicator would induce an error in another indicator. Of course, this does not explain
81
the slope of these dependencies. A careful study should be made to fully explain these
structures, possibly linking specific examples to each part of the structure.
5.2 Learning
As seen in figure 4.8, the mean absolute error is significantly worse than that of TORCS
net and the normal training network for all indicators. The error is worse even for the
first training set (figure 4.9). The 97% of the examples in that set where present for the
entire 140,000 iterations of training. Yet, in figure 4.6 we see the error for these examples
increase at iteration 105,000 after more examples are introduced to the training set.
These increases in error are a sign, I think, of overfitting. From a random start, most
of the error decreases within the first 20,000 iterations. Majority of the learning happens
this quickly, even when all 484,815 are considered. With 64 examples per batch, at 20,000
iterations the network has been exposed to 1,280,000 examples. The network has seen
each of the 484,815 examples 2 to 3 times. If we restrict the training set to 161,605
examples, the network will see each example about 8 times in that 20,000 iterations. The
weights are adjusted to specifically fit these examples. The error does not increase for
most indicators on the first training set when the number of examples is first restricted,
thus not every change of the training set increases the error.
At 70,000 iterations another 161,605 examples are introduced. These examples already
had a larger error than the examples in the first training set, by design. It is very likely
that now they will have a larger error than the examples in the first set, since the network
has only been minimizing the error for the first set of examples. The probability of
randomly selecting one of these new examples is about 1/2. Back propagation algorithm
adjusts the weights proportionally to the error. Therefore, the network is adjusted to
accommodate the new examples, even at the expense of the old examples. This tug-
of-war may be responsible for the increase in the error. There are two ideas to try in
order to solve this problem. The first is to use a different error measure which ensures
that the initial set is not biased toward particular indicators. Reducing the error on
this set generalizes to the next training set. The second idea is to reduce the number of
iterations between grading. This would be similar to the method of early stopping. It
might prevent overfitting and the conflict between training sets.
Besides applying those ideas to resolving the problem, there are also questions of best
and optimal grading frequencies and error measures. There are still many stones left
unturned.
82
Appendix A
GTA V
A.1 Overview
In [3], Chen et al. used a racing simulator called Torcs to generate a dataset of driving
scenes which they then used to train a neural network. One limitation of Torcs is a lack
of realism. The graphics are plain and the only roadways are racetracks, which means
there are no intersections, pedestrian crossings, etc.
At the beginning of the summer, I discovered an alternative which promises to generate
life-like driving scenes. This alternative is a game call Grand Theft Auto 5 (GTA 5). This
game features realistic graphics and a complex transportation system of roads, highways,
ramps, intersections, traffic, pedestrians, railroad crossings, and tunnels. Unlike Torcs,
GTA 5 has more car models, urban, suburban, and rural environments, and control over
weather and time. With the control of time and weather, GTA 5 has an edge over datasets
collected from the real world, such as KITTI, as real world data cannot be collected in
all conditions possible in GTA.
Continuing this line of research, Bill Zhang, Daniel Stanley, and I created a system
which uses a convolutional neural network from [3] to drive a car in GTA 5 autonomously
based solely on a real time stream of game screenshots. The system setup and initial
observations are presented.
A.2 The System
Testing TorcsNet [3] in GTA 5 presents 2 major difficulties. First, both the game
and the neural network are GPU intensive processes. Running both on a single machine
would require a lot of computational power. Second, GTA 5 will only work on Windows
PCs, while TorcsNet is Linux based. Porting either application is close to infeasible. Our
solution is to run the processes on separate machines and have them communicate via a
83
shared folder on a local network. Since the amount of data transfered is small, a text file
of 13 floats and a 280 by 210 png image, this setup should be fast enough to allow for
near real time performance. After dealing with registry settings on the Windows PC, we
were able to get the system running at around 10 Hz.
Figure A.1: GTA V Experimental Setup
Experimental Setup Video: https://www.youtube.com/watch?v=8N-oQuP5GJg&feature=youtu.be
A.3 Initial Observations
We were able to drive a vehicle in GTA 5 using the output of the network. For the
initial experiment, we just used the angle between the heading of the car and the heading
of the road. The blue ball indicates where the car is planning on going. As seen in the
video, the program is capable of rather complex lane keeping.
Performance Video: https://www.youtube.com/watch?v=d-T8gV5mprY
We did notice that there are challenges that GTA’s environment presents. The network
has trouble detecting lane marking on roads where the contrast between the lane and
the road is small. This is a problem on concrete roads. The network also struggles with
roads where cracks obscure parts of the lane marking. These are fundamental problems
which may require retraining.
84
A.4 Camera Models
Since the CNN from [3] may be sensitive to the camera model (field of view, depth,
etc), I explored the code of both games and discovered the parameters of the camera used
in Torcs as well as the model of the camera used in GTA V. Figure A.2 and figure A.3
detail the findings.
Figure A.2: Camera model and parameters in TORCS
85
Figure A.3: Camera model and parameters in GTA 5
A.5 Future Research Goals
Moving forward, I would like to make GTA V a research tool by building a library of
functions for manipulating driving scenes. The following goals are toward that end.
Build a function for getting lane marking positions from GTA V
Implement a system for collecting and sending groundtruths along with each
screenshot
Build a database of GTA V road signs
Build a database of GTA V pedestrians and cars
Create an editor for driving scenes in GTA 5
Create a project website and documentation
Match the parameters of the camera models in GTA V and Torcs to see if
performance improves
Check how well the TORCS network can identify cars in GTA V
Build a robust controller in GTA V which uses all 13 indicators
86
Expend the system to identify pedestrians and traffic signs
Explore the effects of curriculum learning on driving performance
Test trained models in a real vehicle (PAVE)
The ultimate goal is to build an artificial intelligence system which can safely traverse
any road in GTA, and then test that system in a real vehicle.
87
Bibliography
[1] B. P. Battula and R. S. Prasad. A novel framework using similar to different learn-
ing strategy. International Journal of Computer Science and Information Security,
11(6):55, 2013.
[2] Y. Bengio, J. Louradour, R. Collobert, and J. Weston. Curriculum learning. In
Proceedings of the 26th annual international conference on machine learning, pages
41–48. ACM, 2009.
[3] C. Chen, A. Seff, A. Kornhauser, and J. Xiao. Deepdriving: Learning affordance for
direct perception in autonomous driving. arXiv preprint arXiv:1505.00256, 2015.
[4] C. Daskalakis, R. M. Karp, E. Mossel, S. J. Riesenfeld, and E. Verbin. Sorting and
selection in posets. SIAM Journal on Computing, 40(3):597–622, 2011.
[5] D. P. Dubhashi, K. Mehlhorn, D. Ranjan, and C. Thiel. Searching, sorting and
randomised algorithms for central elements and ideal counting in posets. In Foun-
dations of Software Technology and Theoretical Computer Science, pages 436–443.
Springer, 1993.
[6] D. Erhan, Y. Bengio, A. Courville, P.-A. Manzagol, P. Vincent, and S. Bengio.
Why does unsupervised pre-training help deep learning? The Journal of Machine
Learning Research, 11:625–660, 2010.
[7] L. Jiang, D. Meng, S.-I. Yu, Z. Lan, S. Shan, and A. Hauptmann. Self-paced learning
with diversity. In Advances in Neural Information Processing Systems, pages 2078–
2086, 2014.
[8] L. Jiang, D. Meng, Q. Zhao, S. Shan, and A. G. Hauptmann. Self-paced curriculum
learning. In Twenty-Ninth AAAI Conference on Artificial Intelligence, 2015.
[9] A. Karpathy and M. Van De Panne. Curriculum learning for motor skills. In
Advances in Artificial Intelligence, pages 325–330. Springer, 2012.
[10] M. P. Kumar, B. Packer, and D. Koller. Self-paced learning for latent variable
models. In J. Lafferty, C. Williams, J. Shawe-Taylor, R. Zemel, and A. Culotta,
editors, Advances in Neural Information Processing Systems 23, pages 1189–1197.
Curran Associates, Inc., 2010.
88
[11] J. Louradour and C. Kermorvant. Curriculum learning for handwritten text line
recognition. In Document Analysis Systems (DAS), 2014 11th IAPR International
Workshop on, pages 56–60. IEEE, 2014.
[12] E. A. Ni and C. X. Ling. Supervised learning with minimal effort. In Advances in
Knowledge Discovery and Data Mining, pages 476–487. Springer, 2010.
[13] A. Pentina, V. Sharmanska, and C. H. Lampert. Curriculum learning of multiple
tasks. arXiv preprint arXiv:1412.1353, 2014.
[14] J. S. Supancic and D. Ramanan. Self-paced learning for long-term tracking. In Com-
puter Vision and Pattern Recognition (CVPR), 2013 IEEE Conference on, pages
2379–2386. IEEE, 2013.
[15] Q. Zhao, D. Meng, L. Jiang, Q. Xie, Z. Xu, and A. G. Hauptmann. Self-paced
learning for matrix factorization. In Twenty-Ninth AAAI Conference on Artificial
Intelligence, 2015.
89

More Related Content

What's hot

Machine learning-cheat-sheet
Machine learning-cheat-sheetMachine learning-cheat-sheet
Machine learning-cheat-sheet
Willy Marroquin (WillyDevNET)
 
Machine learning solutions for transportation networks
Machine learning solutions for transportation networksMachine learning solutions for transportation networks
Machine learning solutions for transportation networksbutest
 
3016 all-2007-dist
3016 all-2007-dist3016 all-2007-dist
3016 all-2007-distNYversity
 
Measuring Aspect-Oriented Software In Practice
Measuring Aspect-Oriented Software In PracticeMeasuring Aspect-Oriented Software In Practice
Measuring Aspect-Oriented Software In Practice
Hakan Özler
 
Principles of Linear Motion of Objects - Physics - Explained by Arun Umrao
Principles of Linear Motion of Objects - Physics - Explained by Arun UmraoPrinciples of Linear Motion of Objects - Physics - Explained by Arun Umrao
Principles of Linear Motion of Objects - Physics - Explained by Arun Umrao
ssuserd6b1fd
 
Fundamentals of computational_fluid_dynamics_-_h._lomax__t._pulliam__d._zingg
Fundamentals of computational_fluid_dynamics_-_h._lomax__t._pulliam__d._zinggFundamentals of computational_fluid_dynamics_-_h._lomax__t._pulliam__d._zingg
Fundamentals of computational_fluid_dynamics_-_h._lomax__t._pulliam__d._zinggRohit Bapat
 
David_Mateos_Núñez_thesis_distributed_algorithms_convex_optimization
David_Mateos_Núñez_thesis_distributed_algorithms_convex_optimizationDavid_Mateos_Núñez_thesis_distributed_algorithms_convex_optimization
David_Mateos_Núñez_thesis_distributed_algorithms_convex_optimizationDavid Mateos
 
Location In Wsn
Location In WsnLocation In Wsn
Location In Wsnnetfet
 
Notes for GNU Octave - Numerical Programming - for Students 01 of 02 by Arun ...
Notes for GNU Octave - Numerical Programming - for Students 01 of 02 by Arun ...Notes for GNU Octave - Numerical Programming - for Students 01 of 02 by Arun ...
Notes for GNU Octave - Numerical Programming - for Students 01 of 02 by Arun ...
ssuserd6b1fd
 
A buffer overflow study attacks and defenses (2002)
A buffer overflow study   attacks and defenses (2002)A buffer overflow study   attacks and defenses (2002)
A buffer overflow study attacks and defenses (2002)Aiim Charinthip
 
Fabric Defect Detaction in Frequency Domain Using Fourier Analysis
Fabric Defect Detaction in Frequency Domain Using Fourier AnalysisFabric Defect Detaction in Frequency Domain Using Fourier Analysis
Fabric Defect Detaction in Frequency Domain Using Fourier AnalysisGokay Titrek
 
Final Report - Major Project - MAP
Final Report - Major Project - MAPFinal Report - Major Project - MAP
Final Report - Major Project - MAPArjun Aravind
 

What's hot (18)

Machine learning-cheat-sheet
Machine learning-cheat-sheetMachine learning-cheat-sheet
Machine learning-cheat-sheet
 
phd_unimi_R08725
phd_unimi_R08725phd_unimi_R08725
phd_unimi_R08725
 
thesis
thesisthesis
thesis
 
Machine learning solutions for transportation networks
Machine learning solutions for transportation networksMachine learning solutions for transportation networks
Machine learning solutions for transportation networks
 
3016 all-2007-dist
3016 all-2007-dist3016 all-2007-dist
3016 all-2007-dist
 
Measuring Aspect-Oriented Software In Practice
Measuring Aspect-Oriented Software In PracticeMeasuring Aspect-Oriented Software In Practice
Measuring Aspect-Oriented Software In Practice
 
thesis_Eryk_Kulikowski
thesis_Eryk_Kulikowskithesis_Eryk_Kulikowski
thesis_Eryk_Kulikowski
 
Principles of Linear Motion of Objects - Physics - Explained by Arun Umrao
Principles of Linear Motion of Objects - Physics - Explained by Arun UmraoPrinciples of Linear Motion of Objects - Physics - Explained by Arun Umrao
Principles of Linear Motion of Objects - Physics - Explained by Arun Umrao
 
Fundamentals of computational_fluid_dynamics_-_h._lomax__t._pulliam__d._zingg
Fundamentals of computational_fluid_dynamics_-_h._lomax__t._pulliam__d._zinggFundamentals of computational_fluid_dynamics_-_h._lomax__t._pulliam__d._zingg
Fundamentals of computational_fluid_dynamics_-_h._lomax__t._pulliam__d._zingg
 
David_Mateos_Núñez_thesis_distributed_algorithms_convex_optimization
David_Mateos_Núñez_thesis_distributed_algorithms_convex_optimizationDavid_Mateos_Núñez_thesis_distributed_algorithms_convex_optimization
David_Mateos_Núñez_thesis_distributed_algorithms_convex_optimization
 
Location In Wsn
Location In WsnLocation In Wsn
Location In Wsn
 
PhDThesis
PhDThesisPhDThesis
PhDThesis
 
Notes for GNU Octave - Numerical Programming - for Students 01 of 02 by Arun ...
Notes for GNU Octave - Numerical Programming - for Students 01 of 02 by Arun ...Notes for GNU Octave - Numerical Programming - for Students 01 of 02 by Arun ...
Notes for GNU Octave - Numerical Programming - for Students 01 of 02 by Arun ...
 
lapointe_thesis
lapointe_thesislapointe_thesis
lapointe_thesis
 
A buffer overflow study attacks and defenses (2002)
A buffer overflow study   attacks and defenses (2002)A buffer overflow study   attacks and defenses (2002)
A buffer overflow study attacks and defenses (2002)
 
dcorreiaPhD
dcorreiaPhDdcorreiaPhD
dcorreiaPhD
 
Fabric Defect Detaction in Frequency Domain Using Fourier Analysis
Fabric Defect Detaction in Frequency Domain Using Fourier AnalysisFabric Defect Detaction in Frequency Domain Using Fourier Analysis
Fabric Defect Detaction in Frequency Domain Using Fourier Analysis
 
Final Report - Major Project - MAP
Final Report - Major Project - MAPFinal Report - Major Project - MAP
Final Report - Major Project - MAP
 

Similar to Incorporating Learning Strategies in Training of Deep Neural Networks for Autonomous Driving

Masters Thesis - Ankit_Kukreja
Masters Thesis - Ankit_KukrejaMasters Thesis - Ankit_Kukreja
Masters Thesis - Ankit_KukrejaANKIT KUKREJA
 
Pratical mpi programming
Pratical mpi programmingPratical mpi programming
Pratical mpi programmingunifesptk
 
Big data-and-the-web
Big data-and-the-webBig data-and-the-web
Big data-and-the-web
Aravindharamanan S
 
High Performance Traffic Sign Detection
High Performance Traffic Sign DetectionHigh Performance Traffic Sign Detection
High Performance Traffic Sign DetectionCraig Ferguson
 
Stochastic Processes and Simulations – A Machine Learning Perspective
Stochastic Processes and Simulations – A Machine Learning PerspectiveStochastic Processes and Simulations – A Machine Learning Perspective
Stochastic Processes and Simulations – A Machine Learning Perspective
e2wi67sy4816pahn
 
Applying Machine Learning Techniques to Revenue Management
Applying Machine Learning Techniques to Revenue ManagementApplying Machine Learning Techniques to Revenue Management
Applying Machine Learning Techniques to Revenue Management
Ahmed BEN JEMIA
 
Maxime Javaux - Automated spike analysis
Maxime Javaux - Automated spike analysisMaxime Javaux - Automated spike analysis
Maxime Javaux - Automated spike analysisMaxime Javaux
 
2012-02-17_Vojtech-Seman_Rigorous_Thesis
2012-02-17_Vojtech-Seman_Rigorous_Thesis2012-02-17_Vojtech-Seman_Rigorous_Thesis
2012-02-17_Vojtech-Seman_Rigorous_ThesisVojtech Seman
 
Milan_thesis.pdf
Milan_thesis.pdfMilan_thesis.pdf
Milan_thesis.pdf
kanaka vardhini
 
Thats How We C
Thats How We CThats How We C
Thats How We C
Vineeth Kartha
 
Virtual Environments as Driving Schools for Deep Learning Vision-Based Sensor...
Virtual Environments as Driving Schools for Deep Learning Vision-Based Sensor...Virtual Environments as Driving Schools for Deep Learning Vision-Based Sensor...
Virtual Environments as Driving Schools for Deep Learning Vision-Based Sensor...
Artur Filipowicz
 
Efficient algorithms for sorting and synchronization
Efficient algorithms for sorting and synchronizationEfficient algorithms for sorting and synchronization
Efficient algorithms for sorting and synchronizationrmvvr143
 
Efficient algorithms for sorting and synchronization
Efficient algorithms for sorting and synchronizationEfficient algorithms for sorting and synchronization
Efficient algorithms for sorting and synchronization
rmvvr143
 
A Comparative Study Of Generalized Arc-Consistency Algorithms
A Comparative Study Of Generalized Arc-Consistency AlgorithmsA Comparative Study Of Generalized Arc-Consistency Algorithms
A Comparative Study Of Generalized Arc-Consistency Algorithms
Sandra Long
 
Master Thesis - A Distributed Algorithm for Stateless Load Balancing
Master Thesis - A Distributed Algorithm for Stateless Load BalancingMaster Thesis - A Distributed Algorithm for Stateless Load Balancing
Master Thesis - A Distributed Algorithm for Stateless Load Balancing
Andrea Tino
 
Manual
ManualManual

Similar to Incorporating Learning Strategies in Training of Deep Neural Networks for Autonomous Driving (20)

Masters Thesis - Ankit_Kukreja
Masters Thesis - Ankit_KukrejaMasters Thesis - Ankit_Kukreja
Masters Thesis - Ankit_Kukreja
 
Pratical mpi programming
Pratical mpi programmingPratical mpi programming
Pratical mpi programming
 
Big data-and-the-web
Big data-and-the-webBig data-and-the-web
Big data-and-the-web
 
High Performance Traffic Sign Detection
High Performance Traffic Sign DetectionHigh Performance Traffic Sign Detection
High Performance Traffic Sign Detection
 
thesis
thesisthesis
thesis
 
Stochastic Processes and Simulations – A Machine Learning Perspective
Stochastic Processes and Simulations – A Machine Learning PerspectiveStochastic Processes and Simulations – A Machine Learning Perspective
Stochastic Processes and Simulations – A Machine Learning Perspective
 
Applying Machine Learning Techniques to Revenue Management
Applying Machine Learning Techniques to Revenue ManagementApplying Machine Learning Techniques to Revenue Management
Applying Machine Learning Techniques to Revenue Management
 
Maxime Javaux - Automated spike analysis
Maxime Javaux - Automated spike analysisMaxime Javaux - Automated spike analysis
Maxime Javaux - Automated spike analysis
 
2012-02-17_Vojtech-Seman_Rigorous_Thesis
2012-02-17_Vojtech-Seman_Rigorous_Thesis2012-02-17_Vojtech-Seman_Rigorous_Thesis
2012-02-17_Vojtech-Seman_Rigorous_Thesis
 
Milan_thesis.pdf
Milan_thesis.pdfMilan_thesis.pdf
Milan_thesis.pdf
 
Thats How We C
Thats How We CThats How We C
Thats How We C
 
Mak ms
Mak msMak ms
Mak ms
 
Master_Thesis
Master_ThesisMaster_Thesis
Master_Thesis
 
Thesis
ThesisThesis
Thesis
 
Virtual Environments as Driving Schools for Deep Learning Vision-Based Sensor...
Virtual Environments as Driving Schools for Deep Learning Vision-Based Sensor...Virtual Environments as Driving Schools for Deep Learning Vision-Based Sensor...
Virtual Environments as Driving Schools for Deep Learning Vision-Based Sensor...
 
Efficient algorithms for sorting and synchronization
Efficient algorithms for sorting and synchronizationEfficient algorithms for sorting and synchronization
Efficient algorithms for sorting and synchronization
 
Efficient algorithms for sorting and synchronization
Efficient algorithms for sorting and synchronizationEfficient algorithms for sorting and synchronization
Efficient algorithms for sorting and synchronization
 
A Comparative Study Of Generalized Arc-Consistency Algorithms
A Comparative Study Of Generalized Arc-Consistency AlgorithmsA Comparative Study Of Generalized Arc-Consistency Algorithms
A Comparative Study Of Generalized Arc-Consistency Algorithms
 
Master Thesis - A Distributed Algorithm for Stateless Load Balancing
Master Thesis - A Distributed Algorithm for Stateless Load BalancingMaster Thesis - A Distributed Algorithm for Stateless Load Balancing
Master Thesis - A Distributed Algorithm for Stateless Load Balancing
 
Manual
ManualManual
Manual
 

More from Artur Filipowicz

Smart Safety for Commercial Vehicles (ENG)
Smart Safety for Commercial Vehicles (ENG)Smart Safety for Commercial Vehicles (ENG)
Smart Safety for Commercial Vehicles (ENG)
Artur Filipowicz
 
Smart Safety for Commercial Vehicles (中文)
Smart Safety for Commercial Vehicles (中文)Smart Safety for Commercial Vehicles (中文)
Smart Safety for Commercial Vehicles (中文)
Artur Filipowicz
 
Learning to Recognize Distance to Stop Signs Using the Virtual World of Grand...
Learning to Recognize Distance to Stop Signs Using the Virtual World of Grand...Learning to Recognize Distance to Stop Signs Using the Virtual World of Grand...
Learning to Recognize Distance to Stop Signs Using the Virtual World of Grand...
Artur Filipowicz
 
Virtual Environments as Driving Schools for Deep Learning Vision-Based Sensor...
Virtual Environments as Driving Schools for Deep Learning Vision-Based Sensor...Virtual Environments as Driving Schools for Deep Learning Vision-Based Sensor...
Virtual Environments as Driving Schools for Deep Learning Vision-Based Sensor...
Artur Filipowicz
 
Direct Perception for Congestion Scene Detection Using TensorFlow
Direct Perception for Congestion Scene Detection Using TensorFlowDirect Perception for Congestion Scene Detection Using TensorFlow
Direct Perception for Congestion Scene Detection Using TensorFlow
Artur Filipowicz
 
Learning to Recognize Distance to Stop Signs Using the Virtual World of Grand...
Learning to Recognize Distance to Stop Signs Using the Virtual World of Grand...Learning to Recognize Distance to Stop Signs Using the Virtual World of Grand...
Learning to Recognize Distance to Stop Signs Using the Virtual World of Grand...
Artur Filipowicz
 
Filtering of Frequency Components for Privacy Preserving Facial Recognition
Filtering of Frequency Components for Privacy Preserving Facial RecognitionFiltering of Frequency Components for Privacy Preserving Facial Recognition
Filtering of Frequency Components for Privacy Preserving Facial Recognition
Artur Filipowicz
 
Desensitized RDCA Subspaces for Compressive Privacy in Machine Learning
Desensitized RDCA Subspaces for Compressive Privacy in Machine LearningDesensitized RDCA Subspaces for Compressive Privacy in Machine Learning
Desensitized RDCA Subspaces for Compressive Privacy in Machine Learning
Artur Filipowicz
 
Video Games for Autonomous Driving
Video Games for Autonomous DrivingVideo Games for Autonomous Driving
Video Games for Autonomous DrivingArtur Filipowicz
 

More from Artur Filipowicz (9)

Smart Safety for Commercial Vehicles (ENG)
Smart Safety for Commercial Vehicles (ENG)Smart Safety for Commercial Vehicles (ENG)
Smart Safety for Commercial Vehicles (ENG)
 
Smart Safety for Commercial Vehicles (中文)
Smart Safety for Commercial Vehicles (中文)Smart Safety for Commercial Vehicles (中文)
Smart Safety for Commercial Vehicles (中文)
 
Learning to Recognize Distance to Stop Signs Using the Virtual World of Grand...
Learning to Recognize Distance to Stop Signs Using the Virtual World of Grand...Learning to Recognize Distance to Stop Signs Using the Virtual World of Grand...
Learning to Recognize Distance to Stop Signs Using the Virtual World of Grand...
 
Virtual Environments as Driving Schools for Deep Learning Vision-Based Sensor...
Virtual Environments as Driving Schools for Deep Learning Vision-Based Sensor...Virtual Environments as Driving Schools for Deep Learning Vision-Based Sensor...
Virtual Environments as Driving Schools for Deep Learning Vision-Based Sensor...
 
Direct Perception for Congestion Scene Detection Using TensorFlow
Direct Perception for Congestion Scene Detection Using TensorFlowDirect Perception for Congestion Scene Detection Using TensorFlow
Direct Perception for Congestion Scene Detection Using TensorFlow
 
Learning to Recognize Distance to Stop Signs Using the Virtual World of Grand...
Learning to Recognize Distance to Stop Signs Using the Virtual World of Grand...Learning to Recognize Distance to Stop Signs Using the Virtual World of Grand...
Learning to Recognize Distance to Stop Signs Using the Virtual World of Grand...
 
Filtering of Frequency Components for Privacy Preserving Facial Recognition
Filtering of Frequency Components for Privacy Preserving Facial RecognitionFiltering of Frequency Components for Privacy Preserving Facial Recognition
Filtering of Frequency Components for Privacy Preserving Facial Recognition
 
Desensitized RDCA Subspaces for Compressive Privacy in Machine Learning
Desensitized RDCA Subspaces for Compressive Privacy in Machine LearningDesensitized RDCA Subspaces for Compressive Privacy in Machine Learning
Desensitized RDCA Subspaces for Compressive Privacy in Machine Learning
 
Video Games for Autonomous Driving
Video Games for Autonomous DrivingVideo Games for Autonomous Driving
Video Games for Autonomous Driving
 

Recently uploaded

FIDO Alliance Osaka Seminar: Passkeys and the Road Ahead.pdf
FIDO Alliance Osaka Seminar: Passkeys and the Road Ahead.pdfFIDO Alliance Osaka Seminar: Passkeys and the Road Ahead.pdf
FIDO Alliance Osaka Seminar: Passkeys and the Road Ahead.pdf
FIDO Alliance
 
GenAISummit 2024 May 28 Sri Ambati Keynote: AGI Belongs to The Community in O...
GenAISummit 2024 May 28 Sri Ambati Keynote: AGI Belongs to The Community in O...GenAISummit 2024 May 28 Sri Ambati Keynote: AGI Belongs to The Community in O...
GenAISummit 2024 May 28 Sri Ambati Keynote: AGI Belongs to The Community in O...
Sri Ambati
 
Builder.ai Founder Sachin Dev Duggal's Strategic Approach to Create an Innova...
Builder.ai Founder Sachin Dev Duggal's Strategic Approach to Create an Innova...Builder.ai Founder Sachin Dev Duggal's Strategic Approach to Create an Innova...
Builder.ai Founder Sachin Dev Duggal's Strategic Approach to Create an Innova...
Ramesh Iyer
 
Neuro-symbolic is not enough, we need neuro-*semantic*
Neuro-symbolic is not enough, we need neuro-*semantic*Neuro-symbolic is not enough, we need neuro-*semantic*
Neuro-symbolic is not enough, we need neuro-*semantic*
Frank van Harmelen
 
Generating a custom Ruby SDK for your web service or Rails API using Smithy
Generating a custom Ruby SDK for your web service or Rails API using SmithyGenerating a custom Ruby SDK for your web service or Rails API using Smithy
Generating a custom Ruby SDK for your web service or Rails API using Smithy
g2nightmarescribd
 
LF Energy Webinar: Electrical Grid Modelling and Simulation Through PowSyBl -...
LF Energy Webinar: Electrical Grid Modelling and Simulation Through PowSyBl -...LF Energy Webinar: Electrical Grid Modelling and Simulation Through PowSyBl -...
LF Energy Webinar: Electrical Grid Modelling and Simulation Through PowSyBl -...
DanBrown980551
 
Monitoring Java Application Security with JDK Tools and JFR Events
Monitoring Java Application Security with JDK Tools and JFR EventsMonitoring Java Application Security with JDK Tools and JFR Events
Monitoring Java Application Security with JDK Tools and JFR Events
Ana-Maria Mihalceanu
 
State of ICS and IoT Cyber Threat Landscape Report 2024 preview
State of ICS and IoT Cyber Threat Landscape Report 2024 previewState of ICS and IoT Cyber Threat Landscape Report 2024 preview
State of ICS and IoT Cyber Threat Landscape Report 2024 preview
Prayukth K V
 
Transcript: Selling digital books in 2024: Insights from industry leaders - T...
Transcript: Selling digital books in 2024: Insights from industry leaders - T...Transcript: Selling digital books in 2024: Insights from industry leaders - T...
Transcript: Selling digital books in 2024: Insights from industry leaders - T...
BookNet Canada
 
AI for Every Business: Unlocking Your Product's Universal Potential by VP of ...
AI for Every Business: Unlocking Your Product's Universal Potential by VP of ...AI for Every Business: Unlocking Your Product's Universal Potential by VP of ...
AI for Every Business: Unlocking Your Product's Universal Potential by VP of ...
Product School
 
The Future of Platform Engineering
The Future of Platform EngineeringThe Future of Platform Engineering
The Future of Platform Engineering
Jemma Hussein Allen
 
Knowledge engineering: from people to machines and back
Knowledge engineering: from people to machines and backKnowledge engineering: from people to machines and back
Knowledge engineering: from people to machines and back
Elena Simperl
 
From Siloed Products to Connected Ecosystem: Building a Sustainable and Scala...
From Siloed Products to Connected Ecosystem: Building a Sustainable and Scala...From Siloed Products to Connected Ecosystem: Building a Sustainable and Scala...
From Siloed Products to Connected Ecosystem: Building a Sustainable and Scala...
Product School
 
Smart TV Buyer Insights Survey 2024 by 91mobiles.pdf
Smart TV Buyer Insights Survey 2024 by 91mobiles.pdfSmart TV Buyer Insights Survey 2024 by 91mobiles.pdf
Smart TV Buyer Insights Survey 2024 by 91mobiles.pdf
91mobiles
 
FIDO Alliance Osaka Seminar: Passkeys at Amazon.pdf
FIDO Alliance Osaka Seminar: Passkeys at Amazon.pdfFIDO Alliance Osaka Seminar: Passkeys at Amazon.pdf
FIDO Alliance Osaka Seminar: Passkeys at Amazon.pdf
FIDO Alliance
 
GraphRAG is All You need? LLM & Knowledge Graph
GraphRAG is All You need? LLM & Knowledge GraphGraphRAG is All You need? LLM & Knowledge Graph
GraphRAG is All You need? LLM & Knowledge Graph
Guy Korland
 
Dev Dives: Train smarter, not harder – active learning and UiPath LLMs for do...
Dev Dives: Train smarter, not harder – active learning and UiPath LLMs for do...Dev Dives: Train smarter, not harder – active learning and UiPath LLMs for do...
Dev Dives: Train smarter, not harder – active learning and UiPath LLMs for do...
UiPathCommunity
 
De-mystifying Zero to One: Design Informed Techniques for Greenfield Innovati...
De-mystifying Zero to One: Design Informed Techniques for Greenfield Innovati...De-mystifying Zero to One: Design Informed Techniques for Greenfield Innovati...
De-mystifying Zero to One: Design Informed Techniques for Greenfield Innovati...
Product School
 
Mission to Decommission: Importance of Decommissioning Products to Increase E...
Mission to Decommission: Importance of Decommissioning Products to Increase E...Mission to Decommission: Importance of Decommissioning Products to Increase E...
Mission to Decommission: Importance of Decommissioning Products to Increase E...
Product School
 
How world-class product teams are winning in the AI era by CEO and Founder, P...
How world-class product teams are winning in the AI era by CEO and Founder, P...How world-class product teams are winning in the AI era by CEO and Founder, P...
How world-class product teams are winning in the AI era by CEO and Founder, P...
Product School
 

Recently uploaded (20)

FIDO Alliance Osaka Seminar: Passkeys and the Road Ahead.pdf
FIDO Alliance Osaka Seminar: Passkeys and the Road Ahead.pdfFIDO Alliance Osaka Seminar: Passkeys and the Road Ahead.pdf
FIDO Alliance Osaka Seminar: Passkeys and the Road Ahead.pdf
 
GenAISummit 2024 May 28 Sri Ambati Keynote: AGI Belongs to The Community in O...
GenAISummit 2024 May 28 Sri Ambati Keynote: AGI Belongs to The Community in O...GenAISummit 2024 May 28 Sri Ambati Keynote: AGI Belongs to The Community in O...
GenAISummit 2024 May 28 Sri Ambati Keynote: AGI Belongs to The Community in O...
 
Builder.ai Founder Sachin Dev Duggal's Strategic Approach to Create an Innova...
Builder.ai Founder Sachin Dev Duggal's Strategic Approach to Create an Innova...Builder.ai Founder Sachin Dev Duggal's Strategic Approach to Create an Innova...
Builder.ai Founder Sachin Dev Duggal's Strategic Approach to Create an Innova...
 
Neuro-symbolic is not enough, we need neuro-*semantic*
Neuro-symbolic is not enough, we need neuro-*semantic*Neuro-symbolic is not enough, we need neuro-*semantic*
Neuro-symbolic is not enough, we need neuro-*semantic*
 
Generating a custom Ruby SDK for your web service or Rails API using Smithy
Generating a custom Ruby SDK for your web service or Rails API using SmithyGenerating a custom Ruby SDK for your web service or Rails API using Smithy
Generating a custom Ruby SDK for your web service or Rails API using Smithy
 
LF Energy Webinar: Electrical Grid Modelling and Simulation Through PowSyBl -...
LF Energy Webinar: Electrical Grid Modelling and Simulation Through PowSyBl -...LF Energy Webinar: Electrical Grid Modelling and Simulation Through PowSyBl -...
LF Energy Webinar: Electrical Grid Modelling and Simulation Through PowSyBl -...
 
Monitoring Java Application Security with JDK Tools and JFR Events
Monitoring Java Application Security with JDK Tools and JFR EventsMonitoring Java Application Security with JDK Tools and JFR Events
Monitoring Java Application Security with JDK Tools and JFR Events
 
State of ICS and IoT Cyber Threat Landscape Report 2024 preview
State of ICS and IoT Cyber Threat Landscape Report 2024 previewState of ICS and IoT Cyber Threat Landscape Report 2024 preview
State of ICS and IoT Cyber Threat Landscape Report 2024 preview
 
Transcript: Selling digital books in 2024: Insights from industry leaders - T...
Transcript: Selling digital books in 2024: Insights from industry leaders - T...Transcript: Selling digital books in 2024: Insights from industry leaders - T...
Transcript: Selling digital books in 2024: Insights from industry leaders - T...
 
AI for Every Business: Unlocking Your Product's Universal Potential by VP of ...
AI for Every Business: Unlocking Your Product's Universal Potential by VP of ...AI for Every Business: Unlocking Your Product's Universal Potential by VP of ...
AI for Every Business: Unlocking Your Product's Universal Potential by VP of ...
 
The Future of Platform Engineering
The Future of Platform EngineeringThe Future of Platform Engineering
The Future of Platform Engineering
 
Knowledge engineering: from people to machines and back
Knowledge engineering: from people to machines and backKnowledge engineering: from people to machines and back
Knowledge engineering: from people to machines and back
 
From Siloed Products to Connected Ecosystem: Building a Sustainable and Scala...
From Siloed Products to Connected Ecosystem: Building a Sustainable and Scala...From Siloed Products to Connected Ecosystem: Building a Sustainable and Scala...
From Siloed Products to Connected Ecosystem: Building a Sustainable and Scala...
 
Smart TV Buyer Insights Survey 2024 by 91mobiles.pdf
Smart TV Buyer Insights Survey 2024 by 91mobiles.pdfSmart TV Buyer Insights Survey 2024 by 91mobiles.pdf
Smart TV Buyer Insights Survey 2024 by 91mobiles.pdf
 
FIDO Alliance Osaka Seminar: Passkeys at Amazon.pdf
FIDO Alliance Osaka Seminar: Passkeys at Amazon.pdfFIDO Alliance Osaka Seminar: Passkeys at Amazon.pdf
FIDO Alliance Osaka Seminar: Passkeys at Amazon.pdf
 
GraphRAG is All You need? LLM & Knowledge Graph
GraphRAG is All You need? LLM & Knowledge GraphGraphRAG is All You need? LLM & Knowledge Graph
GraphRAG is All You need? LLM & Knowledge Graph
 
Dev Dives: Train smarter, not harder – active learning and UiPath LLMs for do...
Dev Dives: Train smarter, not harder – active learning and UiPath LLMs for do...Dev Dives: Train smarter, not harder – active learning and UiPath LLMs for do...
Dev Dives: Train smarter, not harder – active learning and UiPath LLMs for do...
 
De-mystifying Zero to One: Design Informed Techniques for Greenfield Innovati...
De-mystifying Zero to One: Design Informed Techniques for Greenfield Innovati...De-mystifying Zero to One: Design Informed Techniques for Greenfield Innovati...
De-mystifying Zero to One: Design Informed Techniques for Greenfield Innovati...
 
Mission to Decommission: Importance of Decommissioning Products to Increase E...
Mission to Decommission: Importance of Decommissioning Products to Increase E...Mission to Decommission: Importance of Decommissioning Products to Increase E...
Mission to Decommission: Importance of Decommissioning Products to Increase E...
 
How world-class product teams are winning in the AI era by CEO and Founder, P...
How world-class product teams are winning in the AI era by CEO and Founder, P...How world-class product teams are winning in the AI era by CEO and Founder, P...
How world-class product teams are winning in the AI era by CEO and Founder, P...
 

Incorporating Learning Strategies in Training of Deep Neural Networks for Autonomous Driving

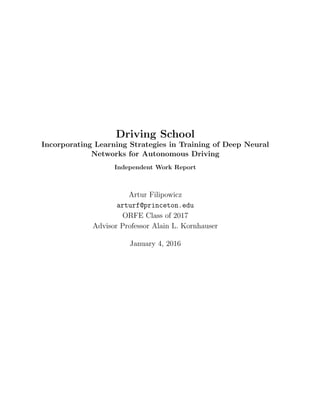
  • 1. Driving School Incorporating Learning Strategies in Training of Deep Neural Networks for Autonomous Driving Independent Work Report Artur Filipowicz arturf@princeton.edu ORFE Class of 2017 Advisor Professor Alain L. Kornhauser January 4, 2016
  • 2. Abstract Majority of machine learning models are trained by presentation of examples in random order. Recently, new research emerged which suggests that better performance can be obtained from neural networks if examples are presented in an order of increasing difficulty. In this report, I review example presentation, or learning schemes, which following this paradigm; curriculum learning, self-paced learning, and self-paced curriculum learning, and I attempt to apply self- paced learning to improve the performance of a car driving neural network. In the process, I explore several error measures to determine example difficulty and observe differences in their performance, demonstrating in the process the difficulty of using curriculum learning for this particular application. I develop an error measure, risk residual, which consid- ers collision risk when determining the error a neural network makes in predicting affordance indicators of a driving scene. I show that this measure is more holistic than a square error. I also propose a probability based measure for example difficulty and explore the computational difficulty of using such a measure. Lastly, I develop an algorithm for self-paced learning and use it to train a convolutional neural network for DeepDriving. While the performance of the network degrades compared to normal training, I observe that over-fitting may be the reason for the results. I propose two research paths to resolve the problem. 1
  • 3. Acknowledgments I would like to thank Professor Alain L. Kornhauser for his mentorship during this project and Chenyi Chen for helping me understand the DeepDriving model. I would also like to thank the Nvidia Corporation for a GPU donation which made this project possible. This paper represents my own work in accordance with University regulations. Artur Filipowicz 2
  • 4. Contents 1 Introduction 8 2 Concepts, Definitions and Notation 9 2.1 DeepDriving . . . . . . . . . . . . . . . . . . . . . . . . . . . . . . . . . . 9 2.1.1 Direct Perception and Affordance Indicators . . . . . . . . . . . . 9 2.1.2 TorcsNet . . . . . . . . . . . . . . . . . . . . . . . . . . . . . . . . 11 2.2 Symbols . . . . . . . . . . . . . . . . . . . . . . . . . . . . . . . . . . . . 11 2.3 Learning Schemes . . . . . . . . . . . . . . . . . . . . . . . . . . . . . . . 12 2.3.1 Curriculum Learning . . . . . . . . . . . . . . . . . . . . . . . . . 12 2.3.2 Self-Paced Learning . . . . . . . . . . . . . . . . . . . . . . . . . . 12 2.3.3 Self-Paced Curriculum Learning . . . . . . . . . . . . . . . . . . . 13 3 Grading 14 3.1 Sum of Square Errors of Unnormalized Output . . . . . . . . . . . . . . . 14 3.1.1 Total Square Error Distribution . . . . . . . . . . . . . . . . . . . 15 3.1.2 Indicators with Greatest Square Error Contribution . . . . . . . . 18 3.1.3 Square Error Accountability . . . . . . . . . . . . . . . . . . . . . 18 3.1.4 Conclusions on Sum of Square Errors of Unnormalized Output . . 20 3.2 Close Frame Analysis . . . . . . . . . . . . . . . . . . . . . . . . . . . . . 23 3.3 Sum of Square Errors of Normalized (Raw) Output . . . . . . . . . . . . 40 3.3.1 Total Square Error Distribution . . . . . . . . . . . . . . . . . . . 40 3.3.2 Indicators with Greatest Square Error Contribution . . . . . . . . 43 3.3.3 Square Error Accountability . . . . . . . . . . . . . . . . . . . . . 45 3.3.4 Conclusions on Sum of Square Errors of Raw Output . . . . . . . 45 3.4 Risk Residuals . . . . . . . . . . . . . . . . . . . . . . . . . . . . . . . . . 46 3.4.1 Distance to car in front (dist MM, dist L, dist R) . . . . . . . . . 46 3.4.2 Distance to cars in left and right lanes (dist LL, dist RR) . . . . . 46 3.4.3 Distance to markings of current lane (toMarking ML, toMarking MR, toMarking M) . . . . . . . . . . . . . . . . . . . . . . . . . . . . . 46 3.4.4 Distance to markings of other lanes (toMarking LL, toMarking RR, toMarking L, toMarking R) . . . . . . . . . . . . . . . . . . . . . 46 3.4.5 Angle between car and road headings (angle) . . . . . . . . . . . . 47 3
  • 5. 3.5 Sum of Risk Residuals of Raw Output . . . . . . . . . . . . . . . . . . . 47 3.5.1 Total Risk Residual Distribution . . . . . . . . . . . . . . . . . . 47 3.5.2 Indicators with Greatest Risk Residual Contribution . . . . . . . 50 3.5.3 Risk Residual Accountability . . . . . . . . . . . . . . . . . . . . 52 3.5.4 Conclusions on Sum of Risk Residual of Raw Output . . . . . . . 52 3.6 Total Error Measures . . . . . . . . . . . . . . . . . . . . . . . . . . . . . 53 3.6.1 Linear Combination Measure . . . . . . . . . . . . . . . . . . . . 53 3.6.2 Probabilistic Measure . . . . . . . . . . . . . . . . . . . . . . . . . 54 3.7 Computing the Probabilistic Measure . . . . . . . . . . . . . . . . . . . . 56 3.7.1 Simple Approach . . . . . . . . . . . . . . . . . . . . . . . . . . . 56 3.7.2 Independence Approach . . . . . . . . . . . . . . . . . . . . . . . 57 3.7.3 Differences Between Results . . . . . . . . . . . . . . . . . . . . . 57 3.7.4 Residual Structures . . . . . . . . . . . . . . . . . . . . . . . . . . 61 3.7.5 Poset Approach . . . . . . . . . . . . . . . . . . . . . . . . . . . . 67 4 Learning 69 4.1 Generic Self-Paced Curriculum Learning Algorithm . . . . . . . . . . . . 69 4.2 Grading Algorithm . . . . . . . . . . . . . . . . . . . . . . . . . . . . . . 70 4.3 Normal Learning . . . . . . . . . . . . . . . . . . . . . . . . . . . . . . . 71 4.4 Self-Paced Learning . . . . . . . . . . . . . . . . . . . . . . . . . . . . . . 73 4.4.1 Implementation . . . . . . . . . . . . . . . . . . . . . . . . . . . . 73 4.4.2 Results . . . . . . . . . . . . . . . . . . . . . . . . . . . . . . . . . 74 5 Discussion 81 5.1 Grading . . . . . . . . . . . . . . . . . . . . . . . . . . . . . . . . . . . . 81 5.2 Learning . . . . . . . . . . . . . . . . . . . . . . . . . . . . . . . . . . . . 82 Appendix A GTA V 83 A.1 Overview . . . . . . . . . . . . . . . . . . . . . . . . . . . . . . . . . . . . 83 A.2 The System . . . . . . . . . . . . . . . . . . . . . . . . . . . . . . . . . . 83 A.3 Initial Observations . . . . . . . . . . . . . . . . . . . . . . . . . . . . . . 84 A.4 Camera Models . . . . . . . . . . . . . . . . . . . . . . . . . . . . . . . . 85 A.5 Future Research Goals . . . . . . . . . . . . . . . . . . . . . . . . . . . . 86 4
  • 6. List of Figures 2.1 Visual representation of the indicators. Reproduced from [3] . . . . . . . 9 3.1 Total square error distribution. . . . . . . . . . . . . . . . . . . . . . . . 16 3.2 Total square error distribution of 96962 of the hardest examples. . . . . . 16 3.3 Total square error distribution of 48481 of the hardest examples . . . . . 17 3.4 Total square error distribution of 4848 of the hardest examples . . . . . . 17 3.5 Example count by indicator with greatest error contribution. Indicators are in the same order as listed below. . . . . . . . . . . . . . . . . . . . . 18 3.6 Average percent of total error explained as number of top error contribut- ing indicators. Indicators are in the same order as listed below. . . . . . . 19 3.7 Total square error of normalized (raw) output distribution. . . . . . . . . 41 3.8 Total square error of normalized (raw) output distribution of 96962 of the hardest examples . . . . . . . . . . . . . . . . . . . . . . . . . . . . . . . 41 3.9 Total square error of normalized (raw) output distribution of 48481 of the hardest examples . . . . . . . . . . . . . . . . . . . . . . . . . . . . . . . 42 3.10 Total square error of normalized (raw) output distribution of 4848 of the hardest examples . . . . . . . . . . . . . . . . . . . . . . . . . . . . . . . 42 3.11 Example count by indicator with greatest error contribution. Indicators are in the same order as listed below. . . . . . . . . . . . . . . . . . . . . 43 3.12 Average percent of total error explained as number of top error contribut- ing indicators. Indicators are in the same order as listed below. . . . . . . 45 3.13 Total risk residual distribution . . . . . . . . . . . . . . . . . . . . . . . . 48 3.14 Total risk residual distribution of 96962 of the hardest examples . . . . . 48 3.15 Total risk residual distribution of 48481 of the hardest examples . . . . . 49 3.16 Total risk residual distribution of 4848 of the hardest examples . . . . . . 49 3.17 Example count by indicator with greatest error contribution. Indicators are in the same order as listed below. . . . . . . . . . . . . . . . . . . . . 50 3.18 Average percent of total error explained as number of top error contribut- ing indicators. Indicators are in the same order as listed below. . . . . . . 52 3.19 Error distributions for probabilistic difficulty example. . . . . . . . . . . 55 3.20 Joint distribution probabilities distribution. . . . . . . . . . . . . . . . . 58 3.21 Independent probabilities distribution. . . . . . . . . . . . . . . . . . . . 58 5
  • 7. 3.22 Distribution of the difference between independent and joint distribution probabilities. . . . . . . . . . . . . . . . . . . . . . . . . . . . . . . . . . 59 3.23 Distribution of the percent difference between independent and joint dis- tribution probabilities. . . . . . . . . . . . . . . . . . . . . . . . . . . . . 60 3.24 Distribution of the difference in sort position between examples sorted by independent and joint distribution probabilities. . . . . . . . . . . . . . . 61 3.25 Risk Residuals by 1st and 2nd PCA components . . . . . . . . . . . . . . 62 3.26 Risk Residuals by 1st and 2nd PCA components (zoom 1) . . . . . . . . 62 3.27 Risk Residuals by 1st and 2nd PCA components (zoom 2) . . . . . . . . 63 3.28 dist RR and dist LL residuals . . . . . . . . . . . . . . . . . . . . . . . . 63 3.29 dist RR and dist LL residuals (zoom) . . . . . . . . . . . . . . . . . . . . 64 3.30 dist R and dist L residuals . . . . . . . . . . . . . . . . . . . . . . . . . . 64 3.31 dist R and dist L residuals (zoom) . . . . . . . . . . . . . . . . . . . . . 65 3.32 toMarking L and toMarking R residuals . . . . . . . . . . . . . . . . . . 65 3.33 toMarking LL and toMarking RR residuals . . . . . . . . . . . . . . . . . 66 3.34 toMarking ML and toMarking MR residuals . . . . . . . . . . . . . . . . 66 3.35 toMarking L and angle residuals . . . . . . . . . . . . . . . . . . . . . . . 67 4.1 Overview of the grading algorithm. . . . . . . . . . . . . . . . . . . . . . 70 4.2 Mean Absolute Error during Normal Training . . . . . . . . . . . . . . . 72 4.3 Self-paced learning schedule. . . . . . . . . . . . . . . . . . . . . . . . . . 73 4.4 Overview of self-paced learning. . . . . . . . . . . . . . . . . . . . . . . . 74 4.5 Mean Absolute Error for the whole training set, dashes lines represent self-paced learning . . . . . . . . . . . . . . . . . . . . . . . . . . . . . . 75 4.6 Mean Absolute Error for first training set, dashes lines represent self-paced learning . . . . . . . . . . . . . . . . . . . . . . . . . . . . . . . . . . . . 76 4.7 Mean Absolute Error for selected indicators, dashes lines represent self- paced learning . . . . . . . . . . . . . . . . . . . . . . . . . . . . . . . . . 77 4.8 Mean Absolute Error on whole training set during self-paced curriculum training . . . . . . . . . . . . . . . . . . . . . . . . . . . . . . . . . . . . 78 4.9 Mean Absolute Error during self-paced curriculum training on 1 st training set . . . . . . . . . . . . . . . . . . . . . . . . . . . . . . . . . . . . . . . 79 4.10 Mean Absolute Error during normal training on 1 st training set . . . . . 80 A.1 GTA V Experimental Setup . . . . . . . . . . . . . . . . . . . . . . . . . 84 A.2 Camera model and parameters in TORCS . . . . . . . . . . . . . . . . . 85 A.3 Camera model and parameters in GTA 5 . . . . . . . . . . . . . . . . . . 86 6
  • 8. List of Tables 2.1 Affordance Indicators. Distances are in meters, and angles are in radians. 10 3.1 Example count by indicator with greatest contribution. . . . . . . . . . . 19 3.2 Hardest Examples by Total Square Error of Unnormalized Output . . . . 21 3.3 Easiest Examples by Total Square Error of Unnormalized Output . . . . 22 3.4 Example count by indicator with greatest contribution to sum of squared errors of normalized outputs. . . . . . . . . . . . . . . . . . . . . . . . . . 44 3.5 Example count by indicator with greatest contribution. . . . . . . . . . . 51 7
  • 9. Chapter 1 Introduction Until recently, the general method for training deep architectures involved presentation of training examples in random order. In 2009, Bengio et al. proposed curriculum learning [2] a method for ordering and presenting a training set to a model based on increasing entropy; starting with simple examples and gradually adding more difficulty examples during training. Application of curriculum learning not only increased speed of convergence but also improved the generalization of the trained model [2]. A drawback of the method was the need for a human to develop a heuristic for creating a curriculum. Subsequently, self-paced learning was developed [10] and improved [7] which allowed the model to select the order of training examples. In 2015, the two ideas were unified in self-paced curriculum learning [8] which orders examples based on human and model perception of difficulty. Ideas in [2], [10], [7], [8] and similar approaches in [1] and [12] have been applied to object tracking in video [14], teaching robots motor skills [9], matrix factorization [15], handwriting recognition [11], and multi-task learning [13]; surpassing state-of-the-art benchmarks. The following report summarizes progress in using the above learning strategies to improve DeepDriving [3]. The original approach used randomly selected mini-batches with no pre-training. Based on results in [8] and [6] curriculum learning improves gen- eralization and thus may improve the driving performance of the DeepDriving model. Additionally, [14] shows that these strategies can be applied to video and therefore would fit with the planned incorporation of temporal information. 8
  • 10. Chapter 2 Concepts, Definitions and Notation 2.1 DeepDriving 2.1.1 Direct Perception and Affordance Indicators Chenyi et al. introduced a direct perception model for autonomous driving. [3] In contrast to mediated perception and behavior reflex models, the direct perception model uses a function to map images to a few significant values called affordance indicators. These indicators represent the critical information needed to drive a vehicle. There are 13 affordance indicators used to describe the situation of interest, driving down a multi-lane road. Table 2.1 describes the individual indicators and figure 2.1 shows their location on the road. Figure 2.1: Visual representation of the indicators. Reproduced from [3] 9
  • 11. Affordance Indicators Indicator Description Min Value Max Value angle angle between the cars heading and the tangent of the road -0.5 0.5 dist L distance to the preceding car in the left lane 0 75 dist R distance to the preceding car in the right lane 0 75 toMarking L distance to the left lane marking -7 -2.5 toMarking M distance to the central lane marking -2 3.5 toMarking R distance to the right lane marking 2.5 7 dist LL dist LL: distance to the preceding car in the left lane 0 75 dist MM dist MM: distance to the preceding car in the current lane 0 75 dist RR dist RR: distance to the preceding car in the right lane 0 75 toMarking LL distance to the left lane marking of the left lane -9.5 -4 toMarking ML distance to the left lane marking of the current lane -5.5 -0.5 toMarking MR distance to the right lane marking of the current lane 0.5 5.5 toMarking RR distance to the right lane marking of the right lane 4 9.5 Table 2.1: Affordance Indicators. Distances are in meters, and angles are in radians. 10
  • 12. 2.1.2 TorcsNet Chenyi et al. constructed a mapping between images and affordance indicators using a convolutional neural network, from here on referred to as TorcsNet. The TorcsNet architecture is based on AlexNet with 5 convolution layers and 4 fully connected layers. The input layer takes a 280 by 210 pixel image and the output represents the 13 affordance indicators normalized to the range of [0.1, 0.9]. [3] The data used for training was collected by Chenyi et al. from an open source racing game called TORCS. The dataset contains of 484,815 images from a front facing camera, representing around 12 hours of human driving. Training occurred in batched of 64 randomly selected images and lasted for 140,000 iterations. Euclidean loss is used was the loss function. [3] 2.2 Symbols The following are symbols employed throughout this paper. n = 484815 images h = 210 height of image in pixels w = 280 width of image in pixels Training examples: X = xi ∈ Rh ∗ w n i (2.1) Training labels: Y = yi ∈ Rh ∗ w n i (2.2) Training dataset: D = (xi, yi) n i (2.3) f learning model w weights of the learning model v vector of indicators of which examples are used in training L total error / difficulty function Ri risk residual for the i indicator y (j) i jth indicator of the ith example K, µ variables used to select examples for training 11
  • 13. 2.3 Learning Schemes Learning schemes are ways of presenting training examples to a learning algorithm. The dominant method is random draw. It is used in most machine learning situations including [3]. Rather recently, alternative methods have been proposed. These include curriculum learning [2], self-paced learning [10] and self-paced curriculum learning [8]. The idea behind this methods is to present ”easier” examples first. As noted in [2], doing so may increase speed of convergence and generalization of the trained model. Below are the mathematical definitions of the three learning schemes for reference and comparison to the application described later. 2.3.1 Curriculum Learning let x ∈ X be an example let P(x) be target training distribution let 0 ≤ Wλ(x) ≤ 1 be a weight applied to example x at step λ 0 ≤ λ ≤ 1 and W1(x) = 1 The training distribution at step λ is: Qλ(x) ∝ Wλ(x)P(x)∀x such that Qλ(x)dx = 1. Q1(x) = P(x) A curriculum is sequence of distributions Qλ(x) generated by a monotonically in- creasing sequence of λ 0 → 1 whose entropy increases H(Qλ(x)) < H(Qλ+ (x)) ∀ > 0 and Wλ(x) is monotonically increasing in λ. [2] 2.3.2 Self-Paced Learning min w,v∈{0,1}n E(w, v, K) = n i=1 viL(yi, f(xi, w)) − 1 K n i=1 vi + r(w) where r(·) is a regularization term and L(·) is the loss between predicted and groundtruth values. w and v are updated iteratively. For fixed w optimal v* is v∗ i = 1, L(yi, f(xi, w) < 1 K 0, otherwise 12
  • 14. When updating w the model trains on a fixed subset of examples [10] [8] 2.3.3 Self-Paced Curriculum Learning min w,v∈{0,1}n E(w, v, K) = n i=1 viL(yi, f(xi, w)) + g(v, K) + r(w) s.t.v ∈ Ψ f(·) controls the learning scheme and Ψ encodes the predetermined learning curricu- lum [8] Total order curriculum [8]: for training set X a total order curriculum can be expressed as a ranking function γ : X{1, 2, ..., n} where γ(xi) < γ(xj) implies xi should be learned earlier than xj. Curriculum region [8]: Given a curriculum γ(·) on X and weights v, Ψ is a cur- riculum region of γ if 1 Ψ is a nonempty convex set. 2 for any pair of samples xi, xj if γ(xi) < γ(xj) then Ψ vidv > Ψ vjdv. ( Ψ vjdv cal- culates the expectation of xj within Ψ.) Self-paced function [8]: g(v, K) determines the leaning scheme and is a self-paced function if 1 g(v, K) is convex with respect to v ∈ {0, 1}n 2 when all variables are fixed except for vi, li, and v∗ i , g(v, K) deceases with li where li is the loss of the ith example, and it holds that limli→0 v∗ i = 1, limli→∞ v∗ i = 0. 3 v = n i=1 vi increases with respect to K and it holds that ∀i ∈ [1, n] limli→0 v∗ i = 1, limli→∞ v∗ i = 0. 13
  • 15. Chapter 3 Grading The learning schemes above have two components learning and grading. Learning updates w and improves the performance of the model, while grading determines which examples are ”easy” and updates v. I will first examine grading examples and in the next chapter demonstrate how grading fits into a larger leaning scheme. A natural definition for difficult is the inverse of error. Meaning, low error indicates an easy example. This particular definition does ignore inter-example difficulties. In the case where examples are of different classes, looking at the error of each example individually may form a bias toward a particular class. Remedies for this are discussed in [7]. In this application there are no explicit classes of examples. The problem of grading is reduced to measuring and ranking error, also known as residual or loss, the neural network makes on examples. The challenge in this particu- lar application is that the output has 13 dimensions with different units and scales (see table 2.1). This makes comparison of error between examples and between affordance in- dicators difficult. It is important to highlight the three different parts of measuring error. First, there is the output of the network f(xi, w); which may or may not be normalized. Second, there is a measure of how much that output differs from the groundtruth y on an indicator by indicator basis. This could be the square of the difference. Third, there is a formula which combines the individual errors into total error for the example, L. To begin, we will use a simple sum of square errors of unnormalized output. 3.1 Sum of Square Errors of Unnormalized Output This measure takes the raw groundtruth values and the final output of the network and computes the sum of the square of the differences. 14
  • 16. L(yi, f(xi, w)) = 13 i=1 (yi − f(xi, w))2 (3.1) 3.1.1 Total Square Error Distribution The above function was applied across the entire training set using the output of a per-trained network which comes with the DeepDriving training set and source code. The following is the distribution of the resulting errors. Characteristics of the set of total square errors for all examples: The mean is 146.85 The median is 21.53 The std is 481.74 The min is 0.18 The max is 11976.1 The 10th percentile is 6.19 The 20th percentile is 8.87 The 30th percentile is 11.98 The 40th percentile is 15.90 The 50th percentile is 21.53 The 60th percentile is 30.79 The 70th percentile is 49.96 The 80th percentile is 101.61 The 90th percentile is 281.85 The 95th percentile is 602.65 The 98th percentile is 1720.65 The 99th percentile is 2970.85 The 99.9th percentile is 5470.74 The 99.99th percentile is 7705.16 15
  • 17. Figure 3.1: Total square error distribution. Figure 3.2: Total square error distribution of 96962 of the hardest examples. 16
  • 18. Figure 3.3: Total square error distribution of 48481 of the hardest examples Figure 3.4: Total square error distribution of 4848 of the hardest examples 17
  • 19. 3.1.2 Indicators with Greatest Square Error Contribution To see which indicators contribute the most error, I counted the number of examples where the ith indicator contributed the most to the total error. rank(i) = N j 13 i 1{x (i) j = xj ∞} (3.2) Figure 3.5: Example count by indicator with greatest error contribution. Indicators are in the same order as listed below. 3.1.3 Square Error Accountability I also looked at the average percent of total error explained by the top n error con- tributing indicators for each example. 18
  • 20. Indicator Number of examples where indicator contributes the most to total error angle 0 dist L 48007 dist R 60697 toMarking L 0 toMarking M 9 toMarking R 0 dist LL 114196 dist MM 99823 dist RR 134321 toMarking LL 7690 toMarking ML 0 toMarking MR 0 toMarking RR 20071 Table 3.1: Example count by indicator with greatest contribution. 19
  • 21. Figure 3.6: Average percent of total error explained as number of top error contributing indicators. Indicators are in the same order as listed below. Average percent of error explained by top 1 indicator: 61.8 Average percent of error explained by top 2 indicators: 82.7 Average percent of error explained by top 3 indicators: 92.2 Average percent of error explained by top 4 indicators: 97.0 Average percent of error explained by top 5 indicators: 98.9 Average percent of error explained by top 6 indicators: 99.5 Average percent of error explained by top 7 indicators: 99.8 Average percent of error explained by top 8 indicators: 99.9 Average percent of error explained by top 9 indicators: 99.9 Average percent of error explained by top 10 indicators: 100 Average percent of error explained by top 11 indicators: 100 Average percent of error explained by top 12 indicators: 100 Average percent of error explained by top 13 indicators: 100 3.1.4 Conclusions on Sum of Square Errors of Unnormalized Output The distribution of errors is skewed to the left a lot. While the maximum error is 11976.1, the median is only 21.5. The percentiles increase quite slowly at first. 90% of the errors are less than 281.9, which is still very far from the maximum error.The errors themselves are mostly due to indicators which estimate distances to cars (dist L, dist R, dist LL, dist MM, dist RR). Furthermore, those indicators are responsible for the majority of the error. On average, the top error contributing indicators accounts for 61.8% of the error. Top 2 account for 82% and top 3 account for 92.2%. For visual inspection, provided are 16 of the hardest and easiest examples in tables 3.2 and 3.3. It is clear from these examples that no single feature determines if an image is hard. It seems that in sharp turns are harder as many of the hard examples have turns. The number of cars, a seemingly reasonable choice for determining difficulty of an example, has no impact across the two sets. This highlights the problem of a human making a curriculum for a machine learner. 20
  • 22. (a) 1 Frame 159854 (b) 2 Frame 346810 (c) 3 Frame 204260 (d) 4 Frame 204262 (e) 5 Frame 45638 (f) 6 Frame 340638 (g) 7 Frame 346935 (h) 8 Frame 376917 (i) 9 Frame 109392 (j) 10 Frame 361338 (k) 11 Frame 346936 (l) 12 Frame 361337 (m) 13 Frame 214317 (n) 14 Frame 64476 (o) 15 Frame 23630 (p) 16 Frame 295623 Table 3.2: Hardest Examples by Total Square Error of Unnormalized Output 21
  • 23. (a) 1 Frame 400150 (b) 2 Frame 422178 (c) 3 Frame 297604 (d) 4 Frame 311451 (e) 5 Frame 406873 (f) 6 Frame 207285 (g) 7 Frame 298363 (h) 8 Frame 208583 (i) 9 Frame 298257 (j) 10 Frame 131025 (k) 11 Frame 333428 (l) 12 Frame 406308 (m) 13 Frame 313197 (n) 14 Frame 165701 (o) 15 Frame 156946 (p) 16 Frame 430927 Table 3.3: Easiest Examples by Total Square Error of Unnormalized Output 22
  • 24. 3.2 Close Frame Analysis The following are detailed groundtruths, network outputs, and percent of total square error for the 16 hardest examples. The actual image and road visualization are also included. Solid rectangles indicate the actual location of the vehicles and the clear rectangles indicate predicted locations. Note that quite often most of the error is due to the network not seeing a car which is in the groundtruth. 23
  • 25. FRAME: 159854 Indicator Ground Truth CNN Output % Error angle -0.79 -0.26 0.00 dist L 5.47 54.73 0.20 dist R 60.00 41.40 0.03 toMarking L -3.39 -4.15 0.00 toMarking M 0.61 -0.10 0.00 toMarking R 4.61 3.91 0.00 dist LL 7.36 73.58 0.37 dist MM 5.47 73.40 0.39 dist RR 60.00 72.51 0.01 toMarking LL -7.39 -8.86 0.00 toMarking ML -3.39 -5.11 0.00 toMarking MR 0.61 5.22 0.00 toMarking RR 4.61 9.22 0.00 Total Sqaured Error: 11978.30 24
  • 26. FRAME: 346810 Indicator Ground Truth CNN Output % Error angle -0.01 -0.13 0.00 dist L 1.04 51.43 0.22 dist R 20.93 56.58 0.11 toMarking L -4.65 -4.43 0.00 toMarking M -0.65 -0.18 0.00 toMarking R 3.35 3.84 0.00 dist LL 1.04 72.40 0.44 dist MM 20.93 73.22 0.23 dist RR 75.00 74.34 0.00 toMarking LL -4.65 -8.87 0.00 toMarking ML -0.65 -4.76 0.00 toMarking MR 3.35 5.22 0.00 toMarking RR 9.50 9.45 0.00 Total Sqaured Error: 11676.28 25
  • 27. FRAME: 204260 Indicator Ground Truth CNN Output % Error angle -0.08 0.00 0.00 dist L 10.38 10.18 0.00 dist R 7.01 5.47 0.00 toMarking L -3.49 -3.79 0.00 toMarking M 0.51 0.12 0.00 toMarking R 4.51 4.13 0.00 dist LL 12.41 70.57 0.31 dist MM 10.38 68.99 0.31 dist RR 7.01 71.07 0.37 toMarking LL -7.49 -9.60 0.00 toMarking ML -3.49 -5.71 0.00 toMarking MR 0.51 5.50 0.00 toMarking RR 4.51 9.50 0.00 Total Sqaured Error: 10983.03 26
  • 28. FRAME: 204262 Indicator Ground Truth CNN Output % Error angle 0.04 -0.04 0.00 dist L 9.72 13.04 0.00 dist R 6.80 8.36 0.00 toMarking L -3.56 -3.49 0.00 toMarking M 0.44 0.67 0.00 toMarking R 4.44 4.64 0.00 dist LL 75.00 21.59 0.28 dist MM 75.00 15.03 0.35 dist RR 75.00 14.43 0.36 toMarking LL -9.50 -7.09 0.00 toMarking ML -5.50 -2.84 0.00 toMarking MR 5.50 1.18 0.00 toMarking RR 9.50 5.19 0.00 Total Sqaured Error: 10181.94 27
  • 29. FRAME: 45638 Indicator Ground Truth CNN Output % Error angle -0.05 0.03 0.00 dist L 25.83 53.26 0.07 dist R 21.11 24.69 0.00 toMarking L -3.46 -3.81 0.00 toMarking M 0.54 0.41 0.00 toMarking R 4.54 4.43 0.00 dist LL 6.81 70.77 0.41 dist MM 25.83 75.79 0.25 dist RR 21.11 72.81 0.27 toMarking LL -7.46 -7.50 0.00 toMarking ML -3.46 -5.64 0.00 toMarking MR 0.54 5.35 0.00 toMarking RR 4.54 9.29 0.00 Total Sqaured Error: 10076.44 28
  • 30. FRAME: 340638 Indicator Ground Truth CNN Output % Error angle -0.01 0.06 0.00 dist L 60.00 55.70 0.00 dist R 0.16 56.39 0.34 toMarking L -3.42 -3.70 0.00 toMarking M 0.58 0.36 0.00 toMarking R 4.58 4.33 0.00 dist LL 75.00 77.34 0.00 dist MM 60.00 76.16 0.03 dist RR 0.16 76.20 0.62 toMarking LL -9.50 -7.50 0.00 toMarking ML -3.42 -5.63 0.00 toMarking MR 0.58 5.31 0.00 toMarking RR 4.58 9.30 0.00 Total Sqaured Error: 9282.86 29
  • 31. FRAME: 346935 Indicator Ground Truth CNN Output % Error angle 0.14 0.24 0.00 dist L 60.00 53.67 0.00 dist R 0.63 59.47 0.37 toMarking L -3.45 -3.81 0.00 toMarking M 0.55 0.41 0.00 toMarking R 4.55 5.63 0.00 dist LL 75.00 74.74 0.00 dist MM 60.00 73.34 0.02 dist RR 0.63 75.07 0.60 toMarking LL -9.50 -7.50 0.00 toMarking ML -3.45 -5.24 0.00 toMarking MR 0.55 4.80 0.00 toMarking RR 4.55 9.54 0.00 Total Sqaured Error: 9274.81 30
  • 32. FRAME: 376917 Indicator Ground Truth CNN Output % Error angle -0.05 -0.01 0.00 dist L 0.73 74.96 0.60 dist R 60.00 76.29 0.03 toMarking L -5.19 -7.00 0.00 toMarking M -1.19 3.30 0.00 toMarking R 2.81 6.87 0.00 dist LL 0.73 58.84 0.37 dist MM 60.00 58.60 0.00 dist RR 75.00 75.97 0.00 toMarking LL -5.19 -5.32 0.00 toMarking ML -1.19 -1.25 0.00 toMarking MR 2.81 2.64 0.00 toMarking RR 9.50 9.69 0.00 Total Sqaured Error: 9194.73 31
  • 33. FRAME: 109392 Indicator Ground Truth CNN Output % Error angle 0.00 -0.02 0.00 dist L 44.35 70.14 0.07 dist R 0.61 69.80 0.53 toMarking L -2.80 -5.60 0.00 toMarking M 1.20 2.83 0.00 toMarking R 5.20 6.44 0.00 dist LL 60.00 56.15 0.00 dist MM 44.35 58.30 0.02 dist RR 0.61 58.85 0.37 toMarking LL -6.80 -6.76 0.00 toMarking ML -2.80 -2.74 0.00 toMarking MR 1.20 1.20 0.00 toMarking RR 5.20 5.28 0.00 Total Sqaured Error: 9064.89 32
  • 34. FRAME: 361338 Indicator Ground Truth CNN Output % Error angle 0.95 0.11 0.00 dist L 6.68 44.85 0.16 dist R 14.83 34.80 0.04 toMarking L -4.86 -4.16 0.00 toMarking M -0.86 0.45 0.00 toMarking R 3.14 4.38 0.00 dist LL 6.68 67.04 0.40 dist MM 14.83 51.72 0.15 dist RR 75.00 28.91 0.24 toMarking LL -4.86 -7.50 0.00 toMarking ML -0.86 -3.30 0.00 toMarking MR 3.14 2.78 0.00 toMarking RR 9.50 6.98 0.00 Total Sqaured Error: 9009.06 33
  • 35. FRAME: 346936 Indicator Ground Truth CNN Output % Error angle 0.16 0.24 0.00 dist L 60.00 53.27 0.01 dist R 0.67 63.14 0.43 toMarking L -3.29 -3.46 0.00 toMarking M 0.71 0.65 0.00 toMarking R 4.71 5.69 0.00 dist LL 75.00 74.85 0.00 dist MM 60.00 65.70 0.00 dist RR 0.67 71.19 0.55 toMarking LL -9.50 -7.50 0.00 toMarking ML -3.29 -4.31 0.00 toMarking MR 0.71 2.73 0.00 toMarking RR 4.71 8.60 0.00 Total Sqaured Error: 8979.38 34
  • 36. FRAME: 361337 Indicator Ground Truth CNN Output % Error angle 0.83 0.16 0.00 dist L 75.00 56.23 0.04 dist R 75.00 39.79 0.14 toMarking L -7.00 -5.05 0.00 toMarking M 3.50 2.01 0.00 toMarking R 7.00 5.71 0.00 dist LL 6.41 64.89 0.38 dist MM 14.57 32.08 0.03 dist RR 75.00 15.06 0.40 toMarking LL -5.37 -7.50 0.00 toMarking ML -1.37 -2.63 0.00 toMarking MR 2.63 1.45 0.00 toMarking RR 9.50 5.48 0.00 Total Sqaured Error: 8943.74 35
  • 37. FRAME: 214317 Indicator Ground Truth CNN Output % Error angle -0.20 -0.17 0.00 dist L 12.58 13.70 0.00 dist R 60.00 56.06 0.00 toMarking L -3.48 -3.70 0.00 toMarking M 0.52 0.23 0.00 toMarking R 4.52 4.28 0.00 dist LL 3.89 73.70 0.55 dist MM 12.58 73.02 0.41 dist RR 60.00 76.65 0.03 toMarking LL -7.48 -7.50 0.00 toMarking ML -3.48 -5.71 0.00 toMarking MR 0.52 5.49 0.00 toMarking RR 4.52 9.39 0.00 Total Sqaured Error: 8872.02 36
  • 38. FRAME: 64476 Indicator Ground Truth CNN Output % Error angle 0.03 0.18 0.00 dist L 8.83 9.44 0.00 dist R 9.68 10.66 0.00 toMarking L -3.44 -3.76 0.00 toMarking M 0.56 0.08 0.00 toMarking R 4.56 4.11 0.00 dist LL 60.00 76.52 0.03 dist MM 8.83 73.54 0.47 dist RR 9.68 75.23 0.49 toMarking LL -7.44 -7.50 0.00 toMarking ML -3.44 -5.87 0.00 toMarking MR 0.56 5.75 0.00 toMarking RR 4.56 9.71 0.00 Total Sqaured Error: 8818.00 37
  • 39. FRAME: 23630 Indicator Ground Truth CNN Output % Error angle 0.16 0.10 0.00 dist L 13.55 50.19 0.15 dist R 10.42 51.81 0.20 toMarking L -3.77 -5.31 0.00 toMarking M 0.23 1.85 0.00 toMarking R 4.23 5.62 0.00 dist LL 75.00 39.27 0.15 dist MM 75.00 23.93 0.30 dist RR 75.00 33.15 0.20 toMarking LL -9.50 -6.10 0.00 toMarking ML -5.50 -2.05 0.00 toMarking MR 5.50 2.19 0.00 toMarking RR 9.50 6.37 0.00 Total Sqaured Error: 8742.63 38
  • 40. FRAME: 295623 Indicator Ground Truth CNN Output % Error angle -0.22 -0.17 0.00 dist L 7.53 72.88 0.49 dist R 6.75 72.93 0.50 toMarking L -2.80 -7.04 0.00 toMarking M 1.20 3.65 0.00 toMarking R 5.20 7.11 0.00 dist LL 75.00 75.86 0.00 dist MM 7.53 6.43 0.00 dist RR 6.75 5.80 0.00 toMarking LL -9.50 -9.72 0.00 toMarking ML -2.80 -2.49 0.00 toMarking MR 1.20 1.44 0.00 toMarking RR 5.20 5.47 0.00 Total Sqaured Error: 8681.42 39
  • 41. 3.3 Sum of Square Errors of Normalized (Raw) Out- put This section contains the same analysis as above for raw (normalized) output of the network. The groundtruth values have also been scaled to the range [0.1, 0.9]. [3] 3.3.1 Total Square Error Distribution Characteristics of the set of total square errors for all examples: The mean is 0.035 The median is 0.006 The std is 0.12 The min is 0.0001 The max is 5.90 The 10th percentile is 0.002 The 20th percentile is 0.002 The 30th percentile is 0.003 The 40th percentile is 0.004 The 50th percentile is 0.006 The 60th percentile is 0.008 The 70th percentile is 0.012 The 80th percentile is 0.022 The 90th percentile is 0.055 The 95th percentile is 0.153 The 98th percentile is 0.367 The 99th percentile is 0.618 The 99.9th percentile is 1.483 The 99.99th percentile is 2.684 40
  • 42. Figure 3.7: Total square error of normalized (raw) output distribution. Figure 3.8: Total square error of normalized (raw) output distribution of 96962 of the hardest examples 41
  • 43. Figure 3.9: Total square error of normalized (raw) output distribution of 48481 of the hardest examples Figure 3.10: Total square error of normalized (raw) output distribution of 4848 of the hardest examples 42
  • 44. 3.3.2 Indicators with Greatest Square Error Contribution Figure 3.11: Example count by indicator with greatest error contribution. Indicators are in the same order as listed below. 43
  • 45. Indicator Number of examples where indicator contributes the most to total error angle 46566 dist L 20335 dist R 23548 toMarking L 30290 toMarking M 10666 toMarking R 30997 dist LL 74767 dist MM 56107 dist RR 85868 toMarking LL 35306 toMarking ML 17493 toMarking MR 16504 toMarking RR 36368 Table 3.4: Example count by indicator with greatest contribution to sum of squared errors of normalized outputs. 44
  • 46. 3.3.3 Square Error Accountability Figure 3.12: Average percent of total error explained as number of top error contributing indicators. Indicators are in the same order as listed below. 3.3.4 Conclusions on Sum of Square Errors of Raw Output The error distribution on the raw output is similar to the unnormalized one. The largest error is about 60,000 times larger than the smallest error. Since these are outputs of a trained network, such difference is evidence of learning. What is much more important is that for every indicator there is an example where that indicator contributes the most to the total error, as seen in 3.11. Also, more indicators are needed to explain the error. The first indicator only explains 40% as oppose to 60%. Figure 3.12 has a much smoother increase than figure 3.6. This indicates that now the affordance indicators are treated more equally in the error measure. This means that there is a smaller or no bias toward any particular indicator and the errors are more comparable. 45
  • 47. 3.4 Risk Residuals Thus far, the difficulty is measured as a sum of squared differences. This measure treats all errors equally. However, in this particular application having the angle off by few degrees or an error in distance to a car 70 m away of 1 m is not a significant error. This is at least true from the point of view of avoiding a collision. Having an error of 1 m on a vehicle 5 m away is a very risky mistake. Following this idea, I developed risk residuals. These are affordance indicator specific error measures. 3.4.1 Distance to car in front (dist MM, dist L, dist R) R(yi, f(xi, w)) = |y (j) i − f(xi, w)(j) | |y (j) i | + (3.3) For small y (j) i the residual will be large for a large error. When a vehicle is close, the residual penalizes any large deviation. 3.4.2 Distance to cars in left and right lanes (dist LL, dist RR) R(yi, f(xi, w)) = |y (j) i − f(xi, w)(j) | C(|y (j) i |)d + (3.4) This residual functions with the same logic as above. Constants C and d can be used to reduce the importance of the error made on distance to cars in the side lines as those are not as likely to cause a collision. 3.4.3 Distance to markings of current lane (toMarking ML, toMarking MR, toMarking M) R(yi, f(xi, w)) = |y (j) i − f(xi, w)(j) | |y (j) i | + (3.5) For small y (j) i the residual will be large for a large error. The residual penalizes any large errors when the vehicle is close to a lane marking. 3.4.4 Distance to markings of other lanes (toMarking LL, toMark- ing RR, toMarking L, toMarking R) R(yi, f(xi, w)) = |y (j) i − f(xi, w)(j) | C(|y (j) i |)d + (3.6) This residual functions with the same logic as above. Constants C and d can be used to reduce the importance of the error made on distance to markings in the side lanes as those are not as important. 46
  • 48. 3.4.5 Angle between car and road headings (angle) R(yi, f(xi, w)) = 0 yi ≤ t & f(xi, w) ≤ t |y (j) i | ∗ |y (j) i − f(xi, w)(j) | else (3.7) Large angles indicate sharp turns. Therefore, the residual should be large. The residual is 0 for small angles since you don’t have to go perfectly straight on the road. 3.5 Sum of Risk Residuals of Raw Output For the analysis in this section raw output of the network is used. C = 1.2 and d = 1. L(yi, f(xi, w)) = 13 i=1 Ri (yi, f(xi, w)) (3.8) Where Ri is the residual function for the i affordance indicator. 3.5.1 Total Risk Residual Distribution Characteristics of the set of total risk residuals for all examples: The mean is 0.835 The median is 0.542 The std is 1.0931 The min is 0.056 The max is 21.881 The 10th percentile is 0.248 The 20th percentile is 0.327 The 30th percentile is 0.398 The 40th percentile is 0.466 The 50th percentile is 0.542 The 60th percentile is 0.636 The 70th percentile is 0.775 The 80th percentile is 1.006 The 90th percentile is 1.443 The 95th percentile is 2.402 The 98th percentile is 4.216 The 99th percentile is 5.785 The 99.9th percentile is 12.248 The 99.99th percentile is 16.060 47
  • 49. Figure 3.13: Total risk residual distribution Figure 3.14: Total risk residual distribution of 96962 of the hardest examples 48
  • 50. Figure 3.15: Total risk residual distribution of 48481 of the hardest examples Figure 3.16: Total risk residual distribution of 4848 of the hardest examples 49
  • 51. 3.5.2 Indicators with Greatest Risk Residual Contribution Figure 3.17: Example count by indicator with greatest error contribution. Indicators are in the same order as listed below. 50
  • 52. Indicator Number of examples where indicator contributes the most to total error angle 546 dist L 13983 dist R 9761 toMarking L 127265 toMarking M 7164 toMarking R 19401 dist LL 42411 dist MM 36607 dist RR 26199 toMarking LL 117153 toMarking ML 46256 toMarking MR 33287 toMarking RR 4782 Table 3.5: Example count by indicator with greatest contribution. 51
  • 53. 3.5.3 Risk Residual Accountability Figure 3.18: Average percent of total error explained as number of top error contributing indicators. Indicators are in the same order as listed below. 3.5.4 Conclusions on Sum of Risk Residual of Raw Output There are two interesting differences between risk residuals and raw and unnormalized output. First, in figure 3.17, the indicators of distances to cars are no longer the main risk contributors in many examples as seen in 3.11. Instead toMarking L and toMarking LL are dominate in this respect. This is probably the result of diminishing the value of errors at large distances. As stated in [3], the network is noisy in it’s distance predictions when a car is far away. This may be relatively large but not very important, and figure 3.17 shows that the risk residuals ignore that noise. The emergence of toMarking L and toMarking LL is revealing important difficulty the network is having. The second difference can be see in figure 3.18. This graph increases even more gradu- ally than graphs in figures 3.12 and 3.6. The first indicator only explains 36% as oppose to 40% and 60%. This suggest that the residuals are treated equally; all of the error in 52
  • 54. an example does not originate with a single or a pair of residuals. This indicates a more holistic measure of difficulty. 3.6 Total Error Measures 3.6.1 Linear Combination Measure The three total error measures explored thus far are linear combinations of errors or residuals of affordance indicators. There are several versions of such functions. These versions are listed below as a demonstration of the number of possible ways to measure total error. Of course, weights could also be assigned to each term in the sum leading to even more functions. Total Risk Residual L(yi, f(xi, w)) = 13 i=1 Ri (yi, f(xi, w)) (3.9) Where Ri is the residual function for the i affordance indicator. Total Square Error Function L(yi, f(xi, w)) = 13 j=1 (y (j) i − f(xi, w)(j) )2 (3.10) Normalized Total Square Error Function L(yi, f(xi, w)) = 13 j=1 | y (j) i − f(xi, w)(j) y (j) i | (3.11) Problem arises when y (j) i = 0 Normalized Total Absolute Error Function L(yi, f(xi, w)) = 13 j=1 ( y (j) i − f(xi, w)(j) y (j) i )2 (3.12) Problem arises when y (j) i = 0 53
  • 55. Range Normalized Total Square Error L(yi, f(xi, w)) = 13 j=1 ( y (j) i − f(xi, w)(j) ymax j − ymin j )2 (3.13) Where ymax j and ymin j are the minimum and maximum values of the jth indicator. Range Normalized Total Absolute Error L(yi, f(xi, w)) = 13 j=1 | y (j) i − f(xi, w)(j) ymax j − ymin j | (3.14) Where ymax j and ymin j are the minimum and maximum values of the jth indicator. 3.6.2 Probabilistic Measure An alternative to summing the residuals for comparison is to compute probabilities. Let ri be a vector of residuals (errors) for example i, r ∈ R13 . For the following analysis, I will use square error for residual. Let L(xi) be the difficulty of example i. L(xi) = P{ −|ri| ≤ |R| ≤ |ri| } = P{ −|r1 i | ≤ |R1 | ≤ |r1 i |, ... , −|r13 i | ≤ |R13 | ≤ |r13 i | } = P{ find example with samller errors } = P{ less error prone example } (3.15) L(xi) is large ⇒ xi is a hard example since probability of finding an easier example is high. L(xi) is small ⇒ xi is an easy example. The intuition for the measure is as follows. Let’s say that there are only two indicators: angle and distance. Figure 3.19 shows two different error distributions for the angle and distance indicators. The vertical lines indicate the positive and negative value of the error of the indicator for our example. In Case 1 and 2, the error on the angle is the same as is the error distribution. The error on the distance is the same in both cases, but the distribution for case two is shifted. The shift suggests that the distance indicator is more error prone in the second example. L will be larger for Case 1 than Case 2. While the network made the same error in both cases, in Case 1, the error on the distance is 54
  • 56. (a) Case 1 Angle Distribution (b) Case 1 Distance Distribution (c) Case 2 Angle Distribution (d) Case 2 Distance Distribution Figure 3.19: Error distributions for probabilistic difficulty example. 55
  • 57. more significant because in general the error in the distance are close to zero. Thus, our error is more significant, being made on an ”easy” indicator. In Case 2, the error in the distance is less significant, because the distance indicator is error prone to begin with and we have done better than most of those errors. Therefore, the example in Case 1 is harder than in Case 2. Additionally, this measure can be applied to individual indicators. The amount of error caused by indicator j in example i is L(xi, j) = P{−|rj i | ≤ |Rj | ≤ |rj i |} We can compare errors across indicators in a single example by looking at how likely it is to make a smaller error. Severe errors will have L close to 1. 3.7 Computing the Probabilistic Measure 3.7.1 Simple Approach The following python code computes L for example i by counting the number of ex- amples with smaller residuals. H = np.zeros(shape=(numOfExamples)) for i in range(0, numOfExamples): example = dist[:,i] print i for j in range(0, i) + range(i+1, numOfExamples): e = 0 for r in range(0,13): if (-abs(example[r]) <= dist[r][j] and dist[r][j] <= abs(example[r])): e = e + 1 if(e == 13): H[i] = H[i] + 1 The complexity of this code is O(n2 ) in the number of examples. The run time for each example is about 14 seconds. 14 s/example ∗ 484815 examples = 6, 787, 410 s = 1, 885.39 h = 78.558 days 56
  • 58. This is too long to be practical, especially considering that grading must be done several times during training. 3.7.2 Independence Approach We could assume that Ri ∀ i are independent. Then we can rewrite H as follows: H(xi) = P{ |R| ≤ |ri| } = P{ |R1 | ≤ |r1 i |, ... , |R13 | ≤ |r13 i | } = 13 j=1 P{ |Rj | ≤ |rj i |} (3.16) We can use this formulation to speed up computation. We presort the individual residual distributions and use binary search to find out how many residuals are smaller than the residual of the current example. The time complexity is 13 ∗ n log n for sorting and n ∗ log n for binary searches. Therefore, the time complexity is O(n log n) in the number of examples. The code below computes the log probabilities and computes L. The run time of this code for all examples is around 57 seconds, or 0.0001 seconds per example. sort = np.zeros(shape=(13, numOfExamples)) for i in range(0,13): sort[i,:] = np.sort(np.abs(dist[i,:])) H = np.zeros(shape=(numOfExamples)) for i in range(0, numOfExamples): example = dist[:,i] for r in range(0,13): H[i] = H[i] + np.log(np.searchsorted(sort[r,:], np.abs(example[r]), side=’right’)/(1.0*numOfExamples)) 3.7.3 Differences Between Results Probabilities computed using the simple approach are not the same as the probabilities computed under the independence assumption. Let I be the set of probabilities calcu- lated under the assumption that residuals of different indicators are independent. Let J be the set of probabilities calculated from the joint distribution. I calculated the joint and independent probabilities for 500 random examples. Below are the distributions, which are different. 57
  • 59. Figure 3.20: Joint distribution probabilities distribution. Figure 3.21: Independent probabilities distribution. To see how close the independent probabilities are to the joint distribution probabili- ties, below is the distribution of I − J. Independent - Joint Probabilities Distribution Characteristics The mean is -0.00039 The median is -0.00014 The std is 0.00048 The min is -0.00135 The max is -0.00000 The 10th percentile is -0.00114 The 20th percentile is -0.00073 58
  • 60. The 30th percentile is -0.00051 The 40th percentile is -0.00035 The 50th percentile is -0.00014 The 60th percentile is -0.00000 The 70th percentile is -0.00000 The 80th percentile is -0.00000 The 90th percentile is -0.00000 The 95th percentile is -0.00000 The 98th percentile is -0.00000 The 99th percentile is -0.00000 Figure 3.22: Distribution of the difference between independent and joint distribution probabilities. The distribution of percent error I−J J is detailed below. In many cases the percent difference reveals that the independent probabilities are much smaller than the joint dis- tribution probabilities. Percent Error Distribution Characteristics The mean is -0.76884 The median is -0.93859 The std is 0.43896 The min is -1.00000 The max is 3.16912 The 10th percentile is -0.998 The 20th percentile is -0.991 The 30th percentile is -0.978 The 40th percentile is -0.962 59
  • 61. The 50th percentile is -0.938 The 60th percentile is -0.886 The 70th percentile is -0.792 The 80th percentile is -0.613 The 90th percentile is -0.419 The 95th percentile is -0.169 The 98th percentile is 0.542 The 99th percentile is 0.816 Figure 3.23: Distribution of the percent difference between independent and joint distri- bution probabilities. Since we mostly care about the relative magnitude of the probabilities, I sorted them and took the differences between the position of the probabilities of one example in their respective sorted orders. It is interesting to note that the distribution of this difference appears to be normal. The problem is that this also implies that the ordering of the two probabilities is very different and that difference is random. Sort Order Position Distribution Characteristics The mean is 0.00000 The median is -1.50000 The std is 200.68963 The min is -444.00000 The max is 471.00000 The 10th percentile is -273.6 The 20th percentile is -167.0 The 30th percentile is -114.6 The 40th percentile is -60.0 60
  • 62. The 50th percentile is -1.5 The 60th percentile is 38.4 The 70th percentile is 104.6 The 80th percentile is 184.6 The 90th percentile is 269.4 The 95th percentile is 347.3 The 98th percentile is 400.0 The 99th percentile is 415.0 Figure 3.24: Distribution of the difference in sort position between examples sorted by independent and joint distribution probabilities. 3.7.4 Residual Structures It is clear that the risk residuals are not independent. To explore the structure of the residual vectors I ran PCA on all of the examples. For 2 components the explained variance is 0.869 and 0.123. 61
  • 63. Figure 3.25: Risk Residuals by 1st and 2nd PCA components Figure 3.26: Risk Residuals by 1st and 2nd PCA components (zoom 1) 62
  • 64. Figure 3.27: Risk Residuals by 1st and 2nd PCA components (zoom 2) The principal component is made up of mostly the 9th and 3rd indicators, dist RR and dist R. The second component is made up of mostly the 7th and 2nd indicators, dist LL and dist L. A third component would only explain 0.005 of the variance and is mostly made up of the 7th and 2nd indicators. Graphs of the residual pairs show how much variance there is between the residuals, explaining why they dominate the PCA. It is also clear that they are not independent. Figure 3.28: dist RR and dist LL residuals 63
  • 65. Figure 3.29: dist RR and dist LL residuals (zoom) Figure 3.30: dist R and dist L residuals 64
  • 66. Figure 3.31: dist R and dist L residuals (zoom) Along the same lines of analysis, I plotted several other residuals. From these graphs we can see that not only are the residuals not independent, they have linear forms of dependency. Figure 3.32: toMarking L and toMarking R residuals 65
  • 67. Figure 3.33: toMarking LL and toMarking RR residuals Figure 3.34: toMarking ML and toMarking MR residuals 66
  • 68. Figure 3.35: toMarking L and angle residuals 3.7.5 Poset Approach It is possible to speed up the computation of the probabilities form the full joint distribution by using algorithms for posets. Vector of residuals r forms a partially ordered set, poset P = (P, ) (3.17) where P is a set of r vectors. Let’s define a relation on P ⊂ PxP (3.18) let a, b ∈ P, if (a, b) ∈ then a b and ai ≥ bi ∀ i (3.19) Properties of : reflexive x x → x = x since |xi| ≥ |xi| ∀ i (3.20) antisymmetric x y & y x → x = y (3.21) |xi| ≥ |yi| ∀ i & |yi| ≥ |xi| ∀ i → |yi| = |xi| (3.22) transitive y x & z y → z x (3.23) y x → |yi| ≥ |xi| ∀ i (3.24) z y → |zi| ≥ |yi| ∀ i (3.25) → |zi| ≥ |xi| ∀ i (3.26) → z x (3.27) 67
  • 69. With the above definitions and properties, [4] and [5] provide some interesting algo- rithms and data structures for counting posets. 68
  • 70. Chapter 4 Learning Measuring the difficulty of examples is only half of the problem. The other half, which is arguably more important, is training and improving the performance of the network. To perform an initial exploration, I designed an algorithm for self-paced curriculum learning and used the sum of squared errors of unnormalized outputs for difficulty measure. Self- paced learning avoids the complexities of adding a human imposed curriculum which for the problem at hand is not easy to define. 4.1 Generic Self-Paced Curriculum Learning Algo- rithm The algorithm selects every more difficult examples as K approaches 0. Algorithm 1 Algorithm for self-paced learning in DeepDriving Input: D, w0, K0 Output: w 1: K ← K0 2: w ← w0 3: set vi = 1 if L(yi, f(xi, w)) < 1 K ∀i 4: Select initial easy examples A = {xi : xi ∈ D, vi = 1} 5: repeat 6: Update w by training 7: K ← K/µ 8: Update vi = 1 if L(yi, f(xi, w)) < 1 K ∀i 9: Update easy examples A = {xi : xi ∈ D, vi = 1} 10: until vi = 1 ∀i and Caffe training ended 69
  • 71. 4.2 Grading Algorithm For this, as for any measure, a simple grading algorithm is used to compute the er- ror across the entire training set. The algorithm runs as follows. Each example in the database is read in and passed to the convolutional neural network, CNN. The output of the CNN is used to compute the error for individual indicators and the errors along with groundtruths are stored in an assessment file. Figure 4.1: Overview of the grading algorithm. Every 1000 images take about 30 seconds to grade. This means the whole dataset can be processed in 3 to 4 hours. Majority of that time is spent on running the CNN and is therefore unavoidable. The following two tables detail timings of different parts of the algorithm. The hardware used was Intel I7 CPU 860 2.86 Hz x8, 16 Gb of RAM and Tesla K40 GPU Code Timings for torcs db grade.cpp using GPU (per 1000 images) Action Time (s) ReadWrite from LevelDB 2.7 Run CNN on example 22 Calculate error 0.002 Visualize results 0.801 Out of curiosity I ran the algorithm without a GPU and recorded the timings as well. 70
  • 72. Code Timings for torcs db grade.cpp using CPU (per 1000 images) Action Time (s) Read/Write from LevelDB 3.2 Run CNN on example 270.65 Calculate error 0.002 Visualize results 0.756 4.3 Normal Learning For comparison, I first ran normal training for 140,000 iterations. To see progress of the training, I computed the mean absolute error across the entire training set at specific iterations. The TORCS Net, a pertained network which comes with the Deep Driving source code, and the final network in the normal training have almost the same error. The difference are on the order of hundredths to thousandths. This translates to the errors from the two networks differing on average across half of a million examples by millimeters to few centimeters. Roughly, the training arrive at the same result. 71
  • 73. Mean Absolute Error during Normal Training Iteration angle dist L dist R toMarking L toMarking M toMarking R dist LL dist MM dist RR toMarking LL toMarking ML toMarking MR toMarking RR 1 0.077 32.014 29.940 1.862 2.077 1.788 29.340 23.409 29.929 1.804 1.199 1.114 1.748 20,000 0.032 2.948 3.247 0.209 0.265 0.235 3.794 4.107 4.040 0.200 0.179 0.170 0.200 35,000 0.031 2.516 2.637 0.178 0.216 0.195 3.410 3.804 3.607 0.204 0.188 0.183 0.189 55,000 0.027 2.602 2.568 0.174 0.204 0.181 3.316 3.337 3.271 0.177 0.165 0.153 0.171 70,000 0.026 2.234 2.272 0.149 0.177 0.161 3.324 3.218 3.102 0.178 0.161 0.145 0.154 90,000 0.024 2.164 2.265 0.152 0.185 0.168 3.014 3.162 2.988 0.189 0.159 0.151 0.170 105,000 0.024 2.266 2.297 0.153 0.192 0.170 2.873 2.864 2.930 0.160 0.136 0.131 0.151 125,000 0.023 2.034 2.117 0.143 0.164 0.151 2.851 2.911 2.879 0.156 0.135 0.131 0.158 140,000 0.023 2.047 2.113 0.145 0.174 0.152 2.829 2.758 2.959 0.158 0.126 0.130 0.157 TORCS Net 0.023 1.983 2.142 0.140 0.160 0.144 2.774 2.704 2.881 0.152 0.127 0.127 0.156 Figure 4.2: Mean Absolute Error during Normal Training
  • 74. 4.4 Self-Paced Learning 4.4.1 Implementation TROCS Net and my normal training network were trained for 140,000 iterations. For the initial test of self-paced learning, I decided to divide the 140,000 iterations into 4 sections, called courses, of 35,000 iterations. The first course involves training on the whole dataset to produce the initial w0. The schedule is illustrated in figure 4.3. Figure 4.3: Self-paced learning schedule. At the end of each course, the weights of the network are used by the grader to compute the error on each of the examples in the database. The grader sorts the errors using a priority queue and selects the ones with the smallest error to construct a training set for the next course. In this implementation the new training set represents v from the algorithm. K and µ are embedded into the rules that for the second course 1/3 of the whole set is selected and for the third course 2/3 of the whole set are selected. Figure 4.4 illustrates the components of self-paced learning implementation. 73
  • 75. Figure 4.4: Overview of self-paced learning. 4.4.2 Results As seen in figure 4.8, the mean absolute error is significantly worse than that of TORCS net and the normal training network for all indicators. Since both of these networks had more time to look at the whole dataset, I looked at the mean absolute error across just the examples contained in the 1st training set, the set formed after Course I. TORCS net and the normal training network both have a similar error as seen in figure 4.10. However, the self-paced curriculum learning network still does significantly worse, see figure 4.9. Additionally, each time the training set is expanded, the error increases across all of the indicators. This is seen for the whole dataset, figure 4.5, and the 1st training set, figure 4.6. In both figures each line represents the error for one indicator. Dashes lines represent self-paced learning. In figure 4.6 an additional point was added at iteration 105,000 to highlight the increase in error. The vertical dashed lines indicate iterations where the training set was expended. 74
  • 76. Figure 4.5: Mean Absolute Error for the whole training set, dashes lines represent self- paced learning 75
  • 77. Figure 4.6: Mean Absolute Error for first training set, dashes lines represent self-paced learning 76
  • 78. Figure 4.7: Mean Absolute Error for selected indicators, dashes lines represent self-paced learning 77
  • 79. Mean Absolute Error during self-paced curriculum training Iteration angle dist L dist R toMarking L toMarking M toMarking R dist LL dist MM dist RR toMarking LL toMarking ML toMarking MR toMarking RR 1 0.077 32.014 29.940 1.862 2.077 1.788 29.340 23.409 29.929 1.804 1.199 1.114 1.748 20,000 0.031 2.938 2.987 0.197 0.227 0.208 3.872 4.019 3.961 0.210 0.176 0.167 0.195 35,000 0.030 2.864 3.116 0.212 0.262 0.233 3.545 3.452 3.535 0.226 0.191 0.170 0.177 55,000 0.041 3.691 4.073 0.242 0.275 0.242 4.223 4.660 4.914 0.250 0.236 0.235 0.247 70,000 0.036 3.386 3.786 0.215 0.252 0.220 4.036 4.382 4.669 0.223 0.216 0.204 0.196 90,000 0.036 3.683 3.895 0.210 0.269 0.234 3.943 4.514 4.603 0.239 0.216 0.200 0.210 105,000 0.034 3.637 3.847 0.226 0.262 0.226 3.663 4.272 3.902 0.200 0.197 0.195 0.202 125,000 0.037 3.215 3.259 0.209 0.247 0.220 3.945 4.303 4.034 0.223 0.225 0.221 0.220 140,000 0.031 2.778 2.721 0.187 0.220 0.198 3.517 3.559 3.473 0.203 0.202 0.181 0.204 Normal 0.023 2.047 2.113 0.145 0.174 0.152 2.829 2.758 2.959 0.158 0.126 0.130 0.157 TORCS Net 0.023 1.983 2.142 0.140 0.160 0.144 2.774 2.704 2.881 0.152 0.127 0.127 0.156 Figure 4.8: Mean Absolute Error on whole training set during self-paced curriculum training
  • 80. Mean Absolute Error during self-paced curriculum training on 1 st training set Iteration angle dist L dist R toMarking L toMarking M toMarking R dist LL dist MM dist RR toMarking LL toMarking ML toMarking MR toMarking RR 1 0.065 33.525 31.305 1.984 2.253 1.886 30.040 24.231 32.088 1.786 1.113 1.037 1.935 20,000 0.027 1.558 1.662 0.148 0.166 0.166 2.173 2.305 2.069 0.168 0.131 0.134 0.171 35,000 0.025 1.544 1.679 0.163 0.198 0.188 1.882 1.749 1.513 0.193 0.156 0.142 0.148 55,000 0.031 1.270 1.473 0.153 0.170 0.154 1.681 1.826 1.810 0.183 0.169 0.177 0.179 70,000 0.027 1.197 1.304 0.141 0.161 0.145 1.555 1.662 1.580 0.164 0.148 0.140 0.139 90,000 0.028 1.404 1.401 0.139 0.167 0.155 1.669 1.982 1.821 0.184 0.149 0.140 0.155 105,000 0.026 1.243 1.287 0.147 0.162 0.149 1.383 1.823 1.500 0.148 0.135 0.141 0.157 125,000 0.032 1.833 1.817 0.163 0.192 0.173 2.226 2.479 2.097 0.182 0.176 0.186 0.187 140,000 0.026 1.485 1.540 0.148 0.167 0.162 1.815 1.848 1.819 0.171 0.164 0.152 0.187 TORCS Net 0.019 1.048 1.259 0.113 0.123 0.122 1.527 1.455 1.466 0.129 0.099 0.104 0.144 Figure 4.9: Mean Absolute Error during self-paced curriculum training on 1 st training set
  • 81. Mean Absolute Error during normal training on 1 st training set Iteration angle dist L dist R toMarking L toMarking M toMarking R dist LL dist MM dist RR toMarking LL toMarking ML toMarking MR toMarking RR 1 0.065 33.525 31.305 1.984 2.253 1.886 30.040 24.231 32.088 1.786 1.113 1.037 1.935 20,000 0.027 1.505 1.707 0.165 0.203 0.178 2.051 2.163 2.091 0.167 0.137 0.137 0.179 35,000 0.027 1.304 1.385 0.135 0.161 0.158 1.789 2.267 1.807 0.169 0.145 0.153 0.163 55,000 0.023 1.487 1.455 0.142 0.154 0.145 1.911 1.789 1.631 0.147 0.129 0.124 0.149 70,000 0.022 1.160 1.122 0.114 0.133 0.123 2.016 1.758 1.481 0.149 0.126 0.117 0.131 90,000 0.021 1.171 1.289 0.124 0.144 0.142 1.688 1.846 1.457 0.165 0.126 0.124 0.157 105,000 0.021 1.221 1.319 0.123 0.146 0.139 1.613 1.580 1.455 0.135 0.106 0.107 0.136 125,000 0.020 1.095 1.181 0.116 0.124 0.125 1.620 1.699 1.397 0.131 0.105 0.106 0.144 140,000 0.020 1.088 1.144 0.120 0.136 0.124 1.588 1.502 1.475 0.136 0.097 0.107 0.145 TORCS Net 0.019 1.048 1.259 0.113 0.123 0.122 1.527 1.455 1.466 0.129 0.099 0.104 0.144 Figure 4.10: Mean Absolute Error during normal training on 1 st training set
  • 82. Chapter 5 Discussion A lot of work remains to be done. While the initial application of these learning strategies appears to be a failure, there remain many possibilities to improve this result. This research will serve as a guide for future exploration and the following discussion will highlight some of the questions yet to be answered. 5.1 Grading In grading examples, we see that use of risk residuals creates a more robust and holistic difficulty measure. Comparing figure 3.17 to figure 3.11, distances to cars are no longer the main risk contributors. This means that risk residuals have reduced the effect of noise in those indicators, as noted in [3]. The amount of error accounted for by top indicators, increases much more gradually, compare figure 3.18 to figures 3.12 and 3.6. These results indicate that this may be a good measure of difficulty. It remains to be seen how this measure impacts training. It would also be interesting to determine a logical procedure for computing C and d for risk residuals. The probabilistic measure, 3.15, would be interesting to experiment with as its defini- tion is very intuitive. A faster means of computing the probability must be found first. In future research, algorithms from [4] and [5] should be implemented or a Monte Carlo method employed to speed up computation. In figures 3.35, 3.32, 3.33 and 3.34, residuals have linear dependencies. It is unclear what causes these. My hypothesis is that since these are distances to lane marking indicators corresponding to opposite lanes, the linear dependency in residuals is due to the fact that the network learned the relationship between the two distances. The network learned that the distances sum to a constant, the closer the car is to the left line the further it is from the right line. If this is the case, the network making an error in one indicator would induce an error in another indicator. Of course, this does not explain 81
  • 83. the slope of these dependencies. A careful study should be made to fully explain these structures, possibly linking specific examples to each part of the structure. 5.2 Learning As seen in figure 4.8, the mean absolute error is significantly worse than that of TORCS net and the normal training network for all indicators. The error is worse even for the first training set (figure 4.9). The 97% of the examples in that set where present for the entire 140,000 iterations of training. Yet, in figure 4.6 we see the error for these examples increase at iteration 105,000 after more examples are introduced to the training set. These increases in error are a sign, I think, of overfitting. From a random start, most of the error decreases within the first 20,000 iterations. Majority of the learning happens this quickly, even when all 484,815 are considered. With 64 examples per batch, at 20,000 iterations the network has been exposed to 1,280,000 examples. The network has seen each of the 484,815 examples 2 to 3 times. If we restrict the training set to 161,605 examples, the network will see each example about 8 times in that 20,000 iterations. The weights are adjusted to specifically fit these examples. The error does not increase for most indicators on the first training set when the number of examples is first restricted, thus not every change of the training set increases the error. At 70,000 iterations another 161,605 examples are introduced. These examples already had a larger error than the examples in the first training set, by design. It is very likely that now they will have a larger error than the examples in the first set, since the network has only been minimizing the error for the first set of examples. The probability of randomly selecting one of these new examples is about 1/2. Back propagation algorithm adjusts the weights proportionally to the error. Therefore, the network is adjusted to accommodate the new examples, even at the expense of the old examples. This tug- of-war may be responsible for the increase in the error. There are two ideas to try in order to solve this problem. The first is to use a different error measure which ensures that the initial set is not biased toward particular indicators. Reducing the error on this set generalizes to the next training set. The second idea is to reduce the number of iterations between grading. This would be similar to the method of early stopping. It might prevent overfitting and the conflict between training sets. Besides applying those ideas to resolving the problem, there are also questions of best and optimal grading frequencies and error measures. There are still many stones left unturned. 82
  • 84. Appendix A GTA V A.1 Overview In [3], Chen et al. used a racing simulator called Torcs to generate a dataset of driving scenes which they then used to train a neural network. One limitation of Torcs is a lack of realism. The graphics are plain and the only roadways are racetracks, which means there are no intersections, pedestrian crossings, etc. At the beginning of the summer, I discovered an alternative which promises to generate life-like driving scenes. This alternative is a game call Grand Theft Auto 5 (GTA 5). This game features realistic graphics and a complex transportation system of roads, highways, ramps, intersections, traffic, pedestrians, railroad crossings, and tunnels. Unlike Torcs, GTA 5 has more car models, urban, suburban, and rural environments, and control over weather and time. With the control of time and weather, GTA 5 has an edge over datasets collected from the real world, such as KITTI, as real world data cannot be collected in all conditions possible in GTA. Continuing this line of research, Bill Zhang, Daniel Stanley, and I created a system which uses a convolutional neural network from [3] to drive a car in GTA 5 autonomously based solely on a real time stream of game screenshots. The system setup and initial observations are presented. A.2 The System Testing TorcsNet [3] in GTA 5 presents 2 major difficulties. First, both the game and the neural network are GPU intensive processes. Running both on a single machine would require a lot of computational power. Second, GTA 5 will only work on Windows PCs, while TorcsNet is Linux based. Porting either application is close to infeasible. Our solution is to run the processes on separate machines and have them communicate via a 83
  • 85. shared folder on a local network. Since the amount of data transfered is small, a text file of 13 floats and a 280 by 210 png image, this setup should be fast enough to allow for near real time performance. After dealing with registry settings on the Windows PC, we were able to get the system running at around 10 Hz. Figure A.1: GTA V Experimental Setup Experimental Setup Video: https://www.youtube.com/watch?v=8N-oQuP5GJg&feature=youtu.be A.3 Initial Observations We were able to drive a vehicle in GTA 5 using the output of the network. For the initial experiment, we just used the angle between the heading of the car and the heading of the road. The blue ball indicates where the car is planning on going. As seen in the video, the program is capable of rather complex lane keeping. Performance Video: https://www.youtube.com/watch?v=d-T8gV5mprY We did notice that there are challenges that GTA’s environment presents. The network has trouble detecting lane marking on roads where the contrast between the lane and the road is small. This is a problem on concrete roads. The network also struggles with roads where cracks obscure parts of the lane marking. These are fundamental problems which may require retraining. 84
  • 86. A.4 Camera Models Since the CNN from [3] may be sensitive to the camera model (field of view, depth, etc), I explored the code of both games and discovered the parameters of the camera used in Torcs as well as the model of the camera used in GTA V. Figure A.2 and figure A.3 detail the findings. Figure A.2: Camera model and parameters in TORCS 85
  • 87. Figure A.3: Camera model and parameters in GTA 5 A.5 Future Research Goals Moving forward, I would like to make GTA V a research tool by building a library of functions for manipulating driving scenes. The following goals are toward that end. Build a function for getting lane marking positions from GTA V Implement a system for collecting and sending groundtruths along with each screenshot Build a database of GTA V road signs Build a database of GTA V pedestrians and cars Create an editor for driving scenes in GTA 5 Create a project website and documentation Match the parameters of the camera models in GTA V and Torcs to see if performance improves Check how well the TORCS network can identify cars in GTA V Build a robust controller in GTA V which uses all 13 indicators 86
  • 88. Expend the system to identify pedestrians and traffic signs Explore the effects of curriculum learning on driving performance Test trained models in a real vehicle (PAVE) The ultimate goal is to build an artificial intelligence system which can safely traverse any road in GTA, and then test that system in a real vehicle. 87
  • 89. Bibliography [1] B. P. Battula and R. S. Prasad. A novel framework using similar to different learn- ing strategy. International Journal of Computer Science and Information Security, 11(6):55, 2013. [2] Y. Bengio, J. Louradour, R. Collobert, and J. Weston. Curriculum learning. In Proceedings of the 26th annual international conference on machine learning, pages 41–48. ACM, 2009. [3] C. Chen, A. Seff, A. Kornhauser, and J. Xiao. Deepdriving: Learning affordance for direct perception in autonomous driving. arXiv preprint arXiv:1505.00256, 2015. [4] C. Daskalakis, R. M. Karp, E. Mossel, S. J. Riesenfeld, and E. Verbin. Sorting and selection in posets. SIAM Journal on Computing, 40(3):597–622, 2011. [5] D. P. Dubhashi, K. Mehlhorn, D. Ranjan, and C. Thiel. Searching, sorting and randomised algorithms for central elements and ideal counting in posets. In Foun- dations of Software Technology and Theoretical Computer Science, pages 436–443. Springer, 1993. [6] D. Erhan, Y. Bengio, A. Courville, P.-A. Manzagol, P. Vincent, and S. Bengio. Why does unsupervised pre-training help deep learning? The Journal of Machine Learning Research, 11:625–660, 2010. [7] L. Jiang, D. Meng, S.-I. Yu, Z. Lan, S. Shan, and A. Hauptmann. Self-paced learning with diversity. In Advances in Neural Information Processing Systems, pages 2078– 2086, 2014. [8] L. Jiang, D. Meng, Q. Zhao, S. Shan, and A. G. Hauptmann. Self-paced curriculum learning. In Twenty-Ninth AAAI Conference on Artificial Intelligence, 2015. [9] A. Karpathy and M. Van De Panne. Curriculum learning for motor skills. In Advances in Artificial Intelligence, pages 325–330. Springer, 2012. [10] M. P. Kumar, B. Packer, and D. Koller. Self-paced learning for latent variable models. In J. Lafferty, C. Williams, J. Shawe-Taylor, R. Zemel, and A. Culotta, editors, Advances in Neural Information Processing Systems 23, pages 1189–1197. Curran Associates, Inc., 2010. 88
  • 90. [11] J. Louradour and C. Kermorvant. Curriculum learning for handwritten text line recognition. In Document Analysis Systems (DAS), 2014 11th IAPR International Workshop on, pages 56–60. IEEE, 2014. [12] E. A. Ni and C. X. Ling. Supervised learning with minimal effort. In Advances in Knowledge Discovery and Data Mining, pages 476–487. Springer, 2010. [13] A. Pentina, V. Sharmanska, and C. H. Lampert. Curriculum learning of multiple tasks. arXiv preprint arXiv:1412.1353, 2014. [14] J. S. Supancic and D. Ramanan. Self-paced learning for long-term tracking. In Com- puter Vision and Pattern Recognition (CVPR), 2013 IEEE Conference on, pages 2379–2386. IEEE, 2013. [15] Q. Zhao, D. Meng, L. Jiang, Q. Xie, Z. Xu, and A. G. Hauptmann. Self-paced learning for matrix factorization. In Twenty-Ninth AAAI Conference on Artificial Intelligence, 2015. 89