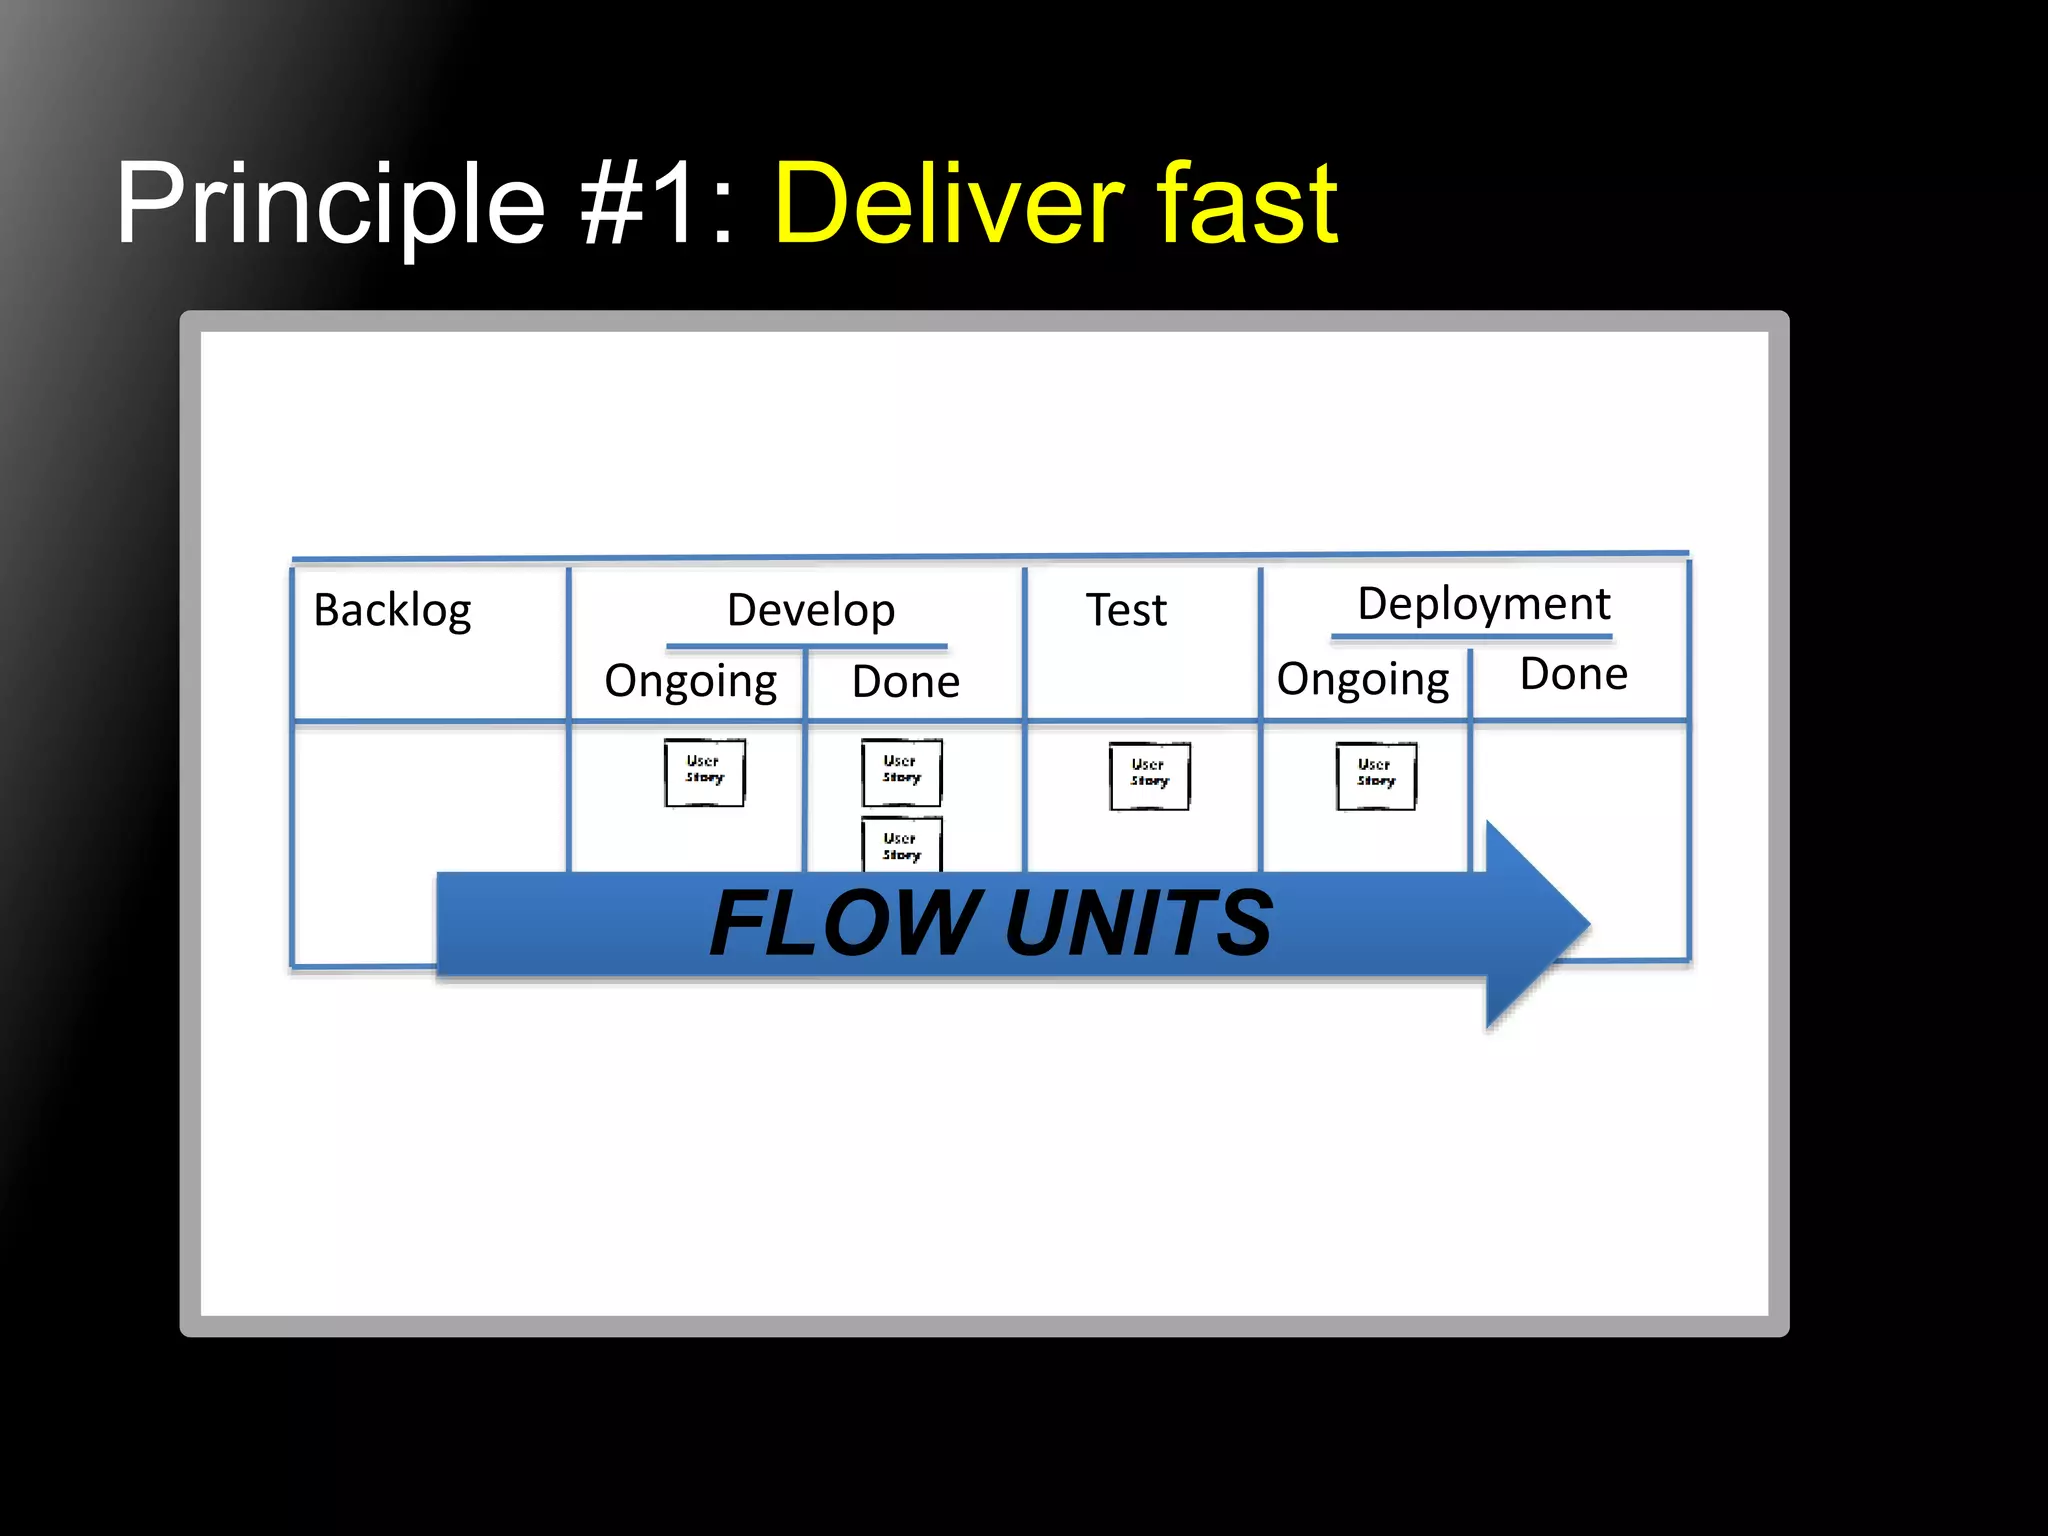
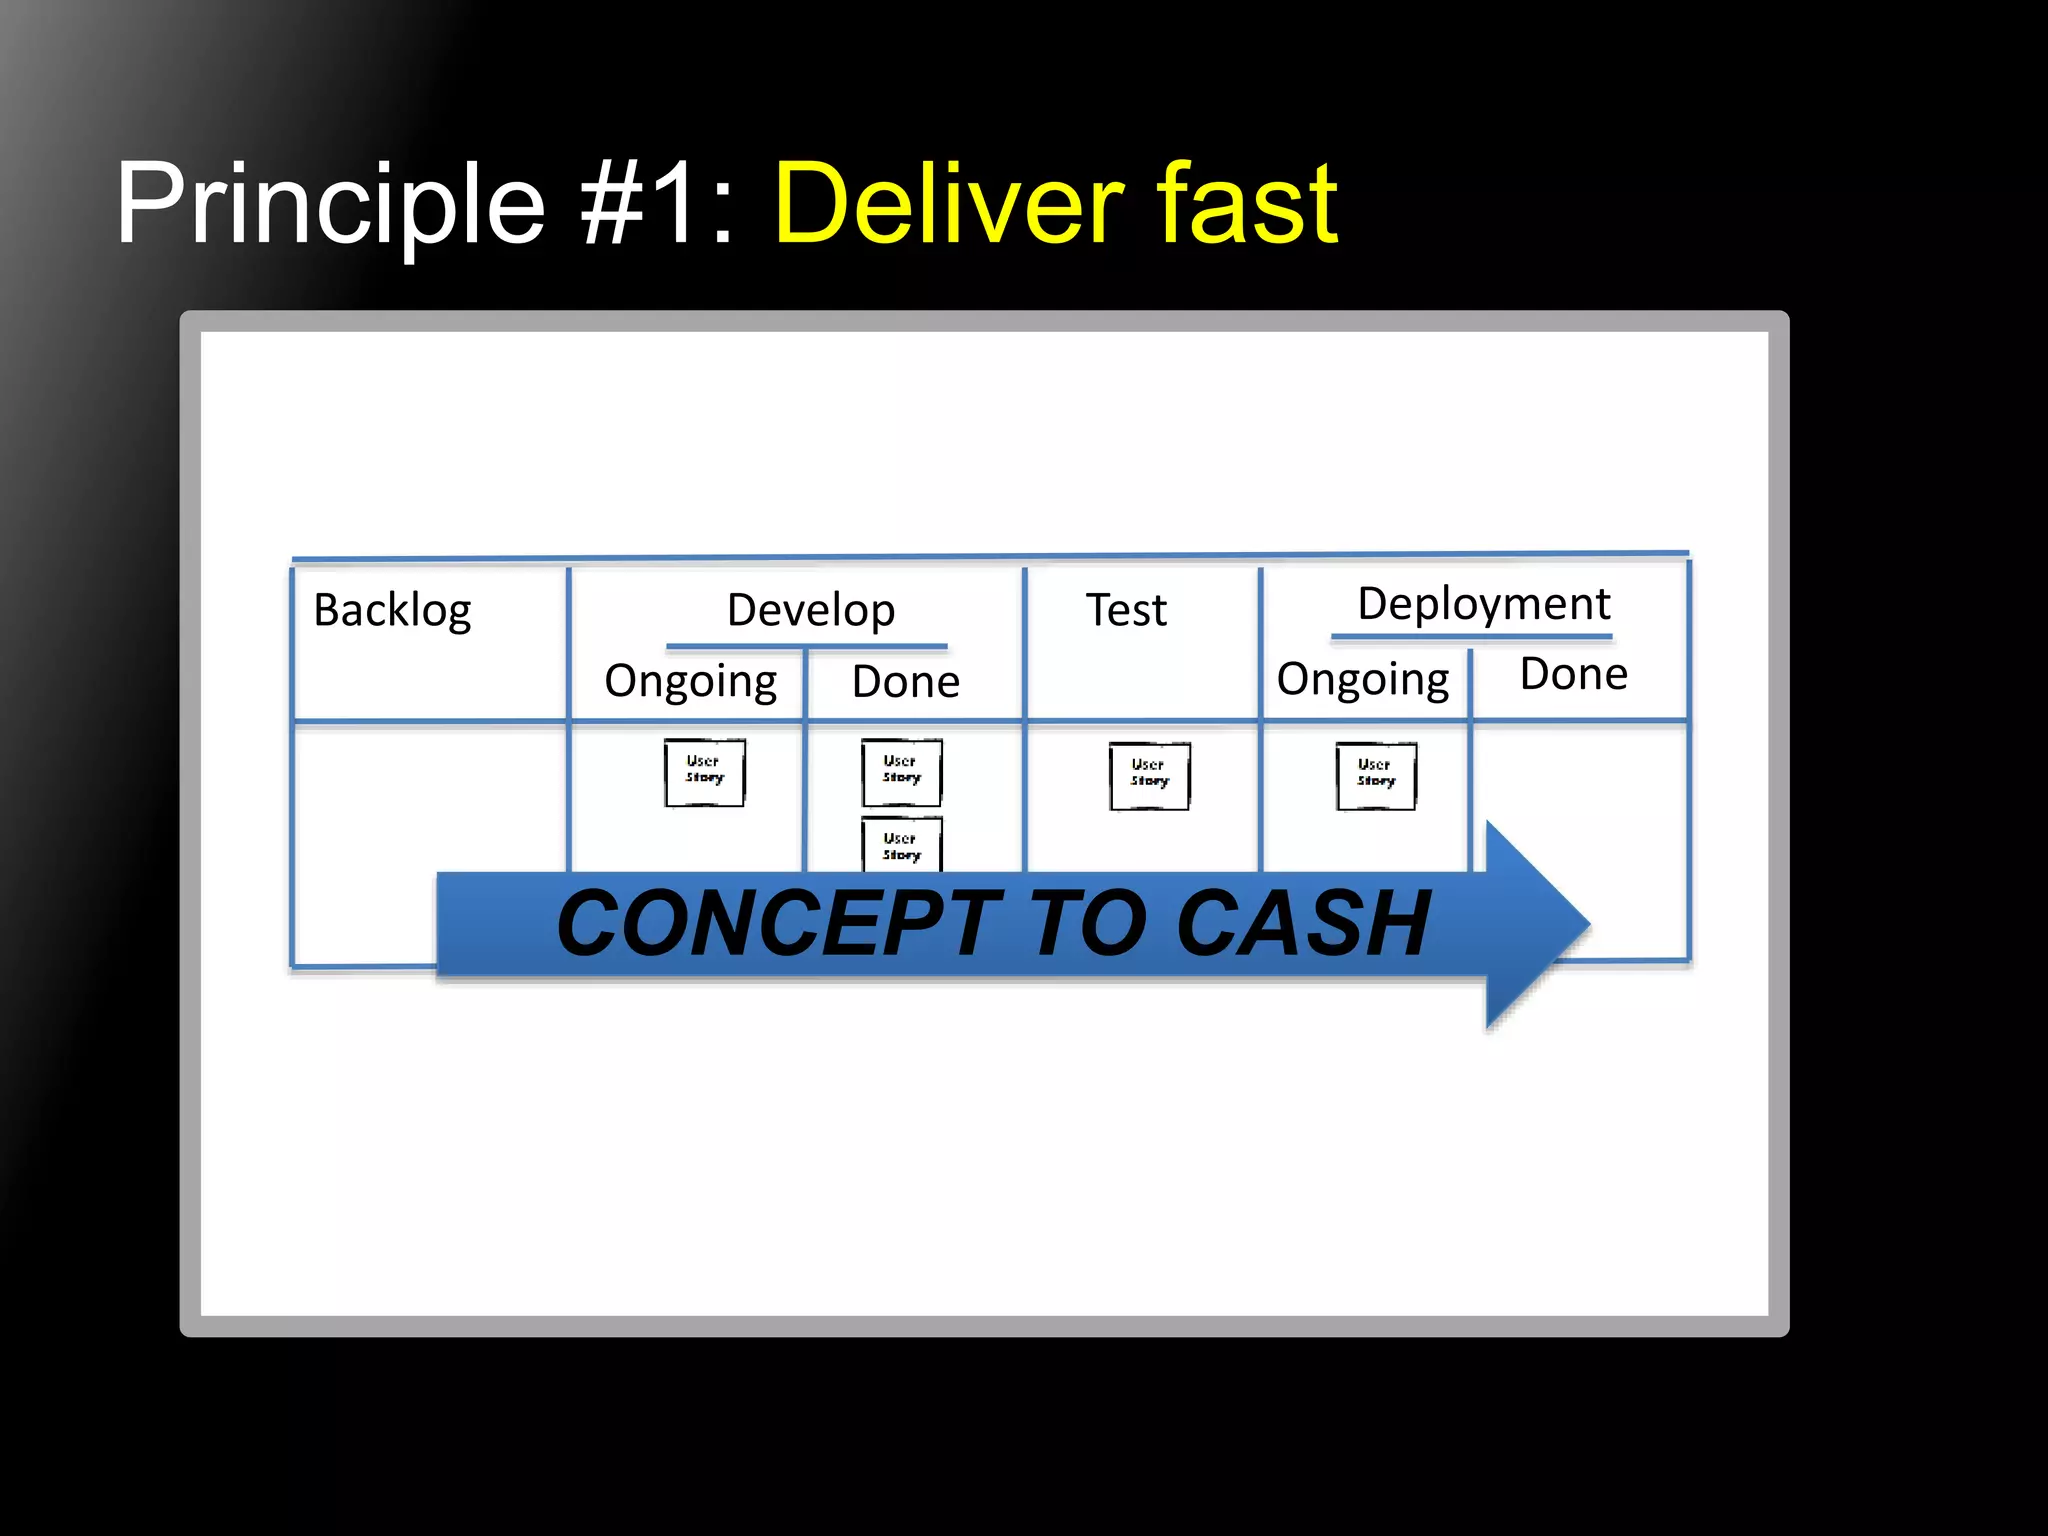
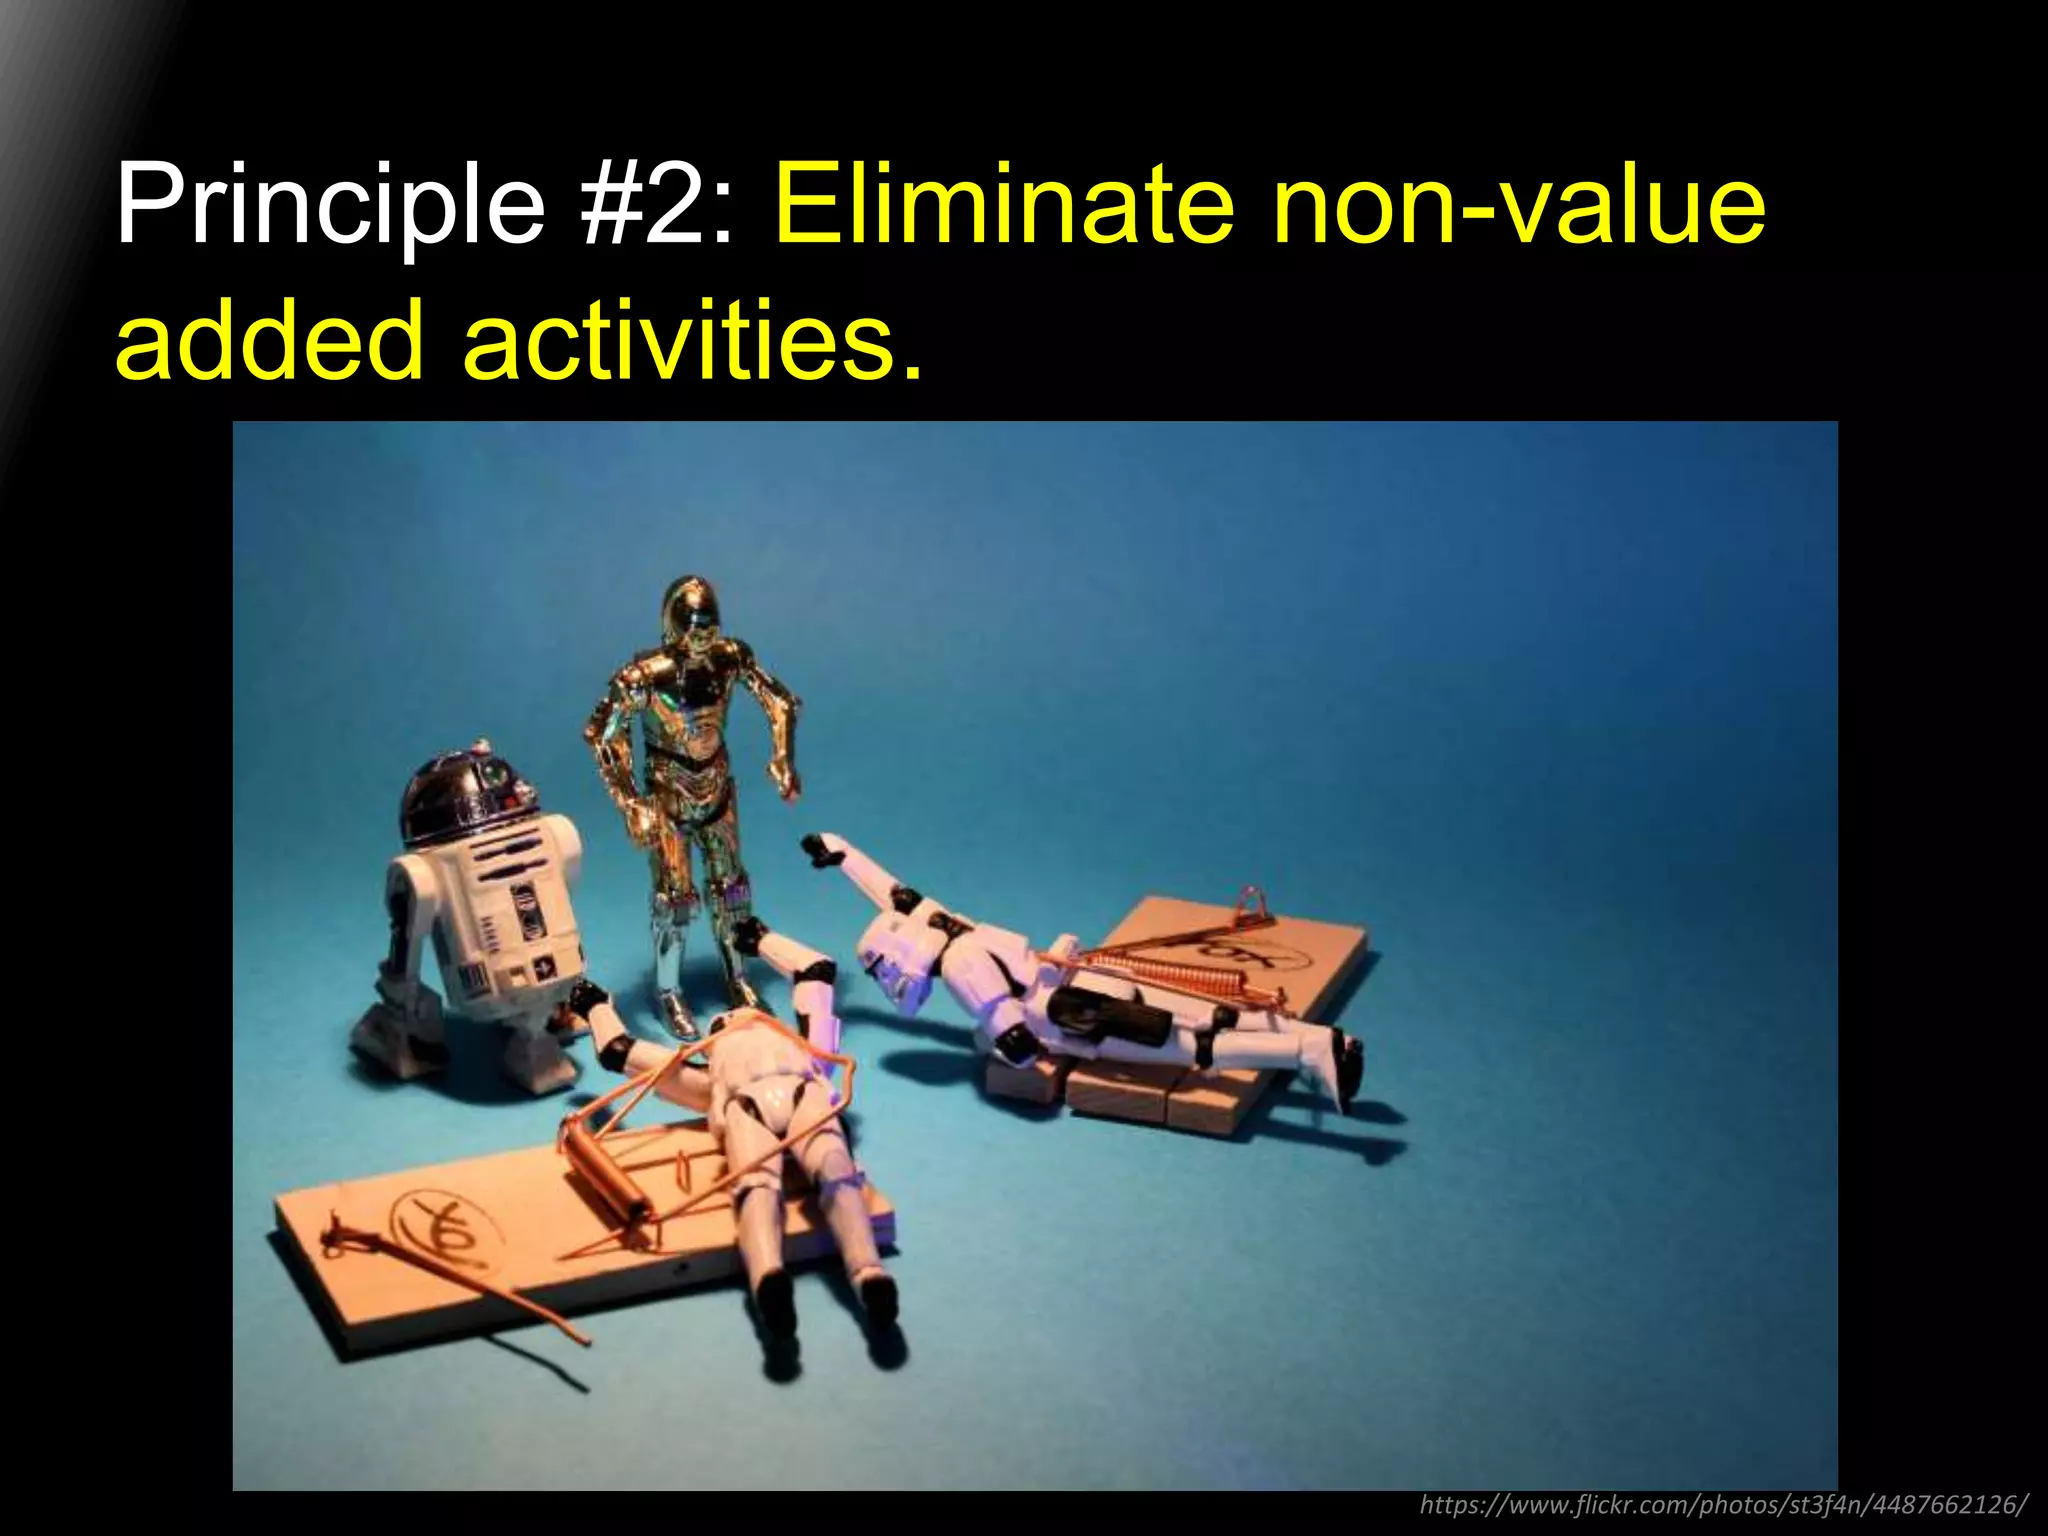
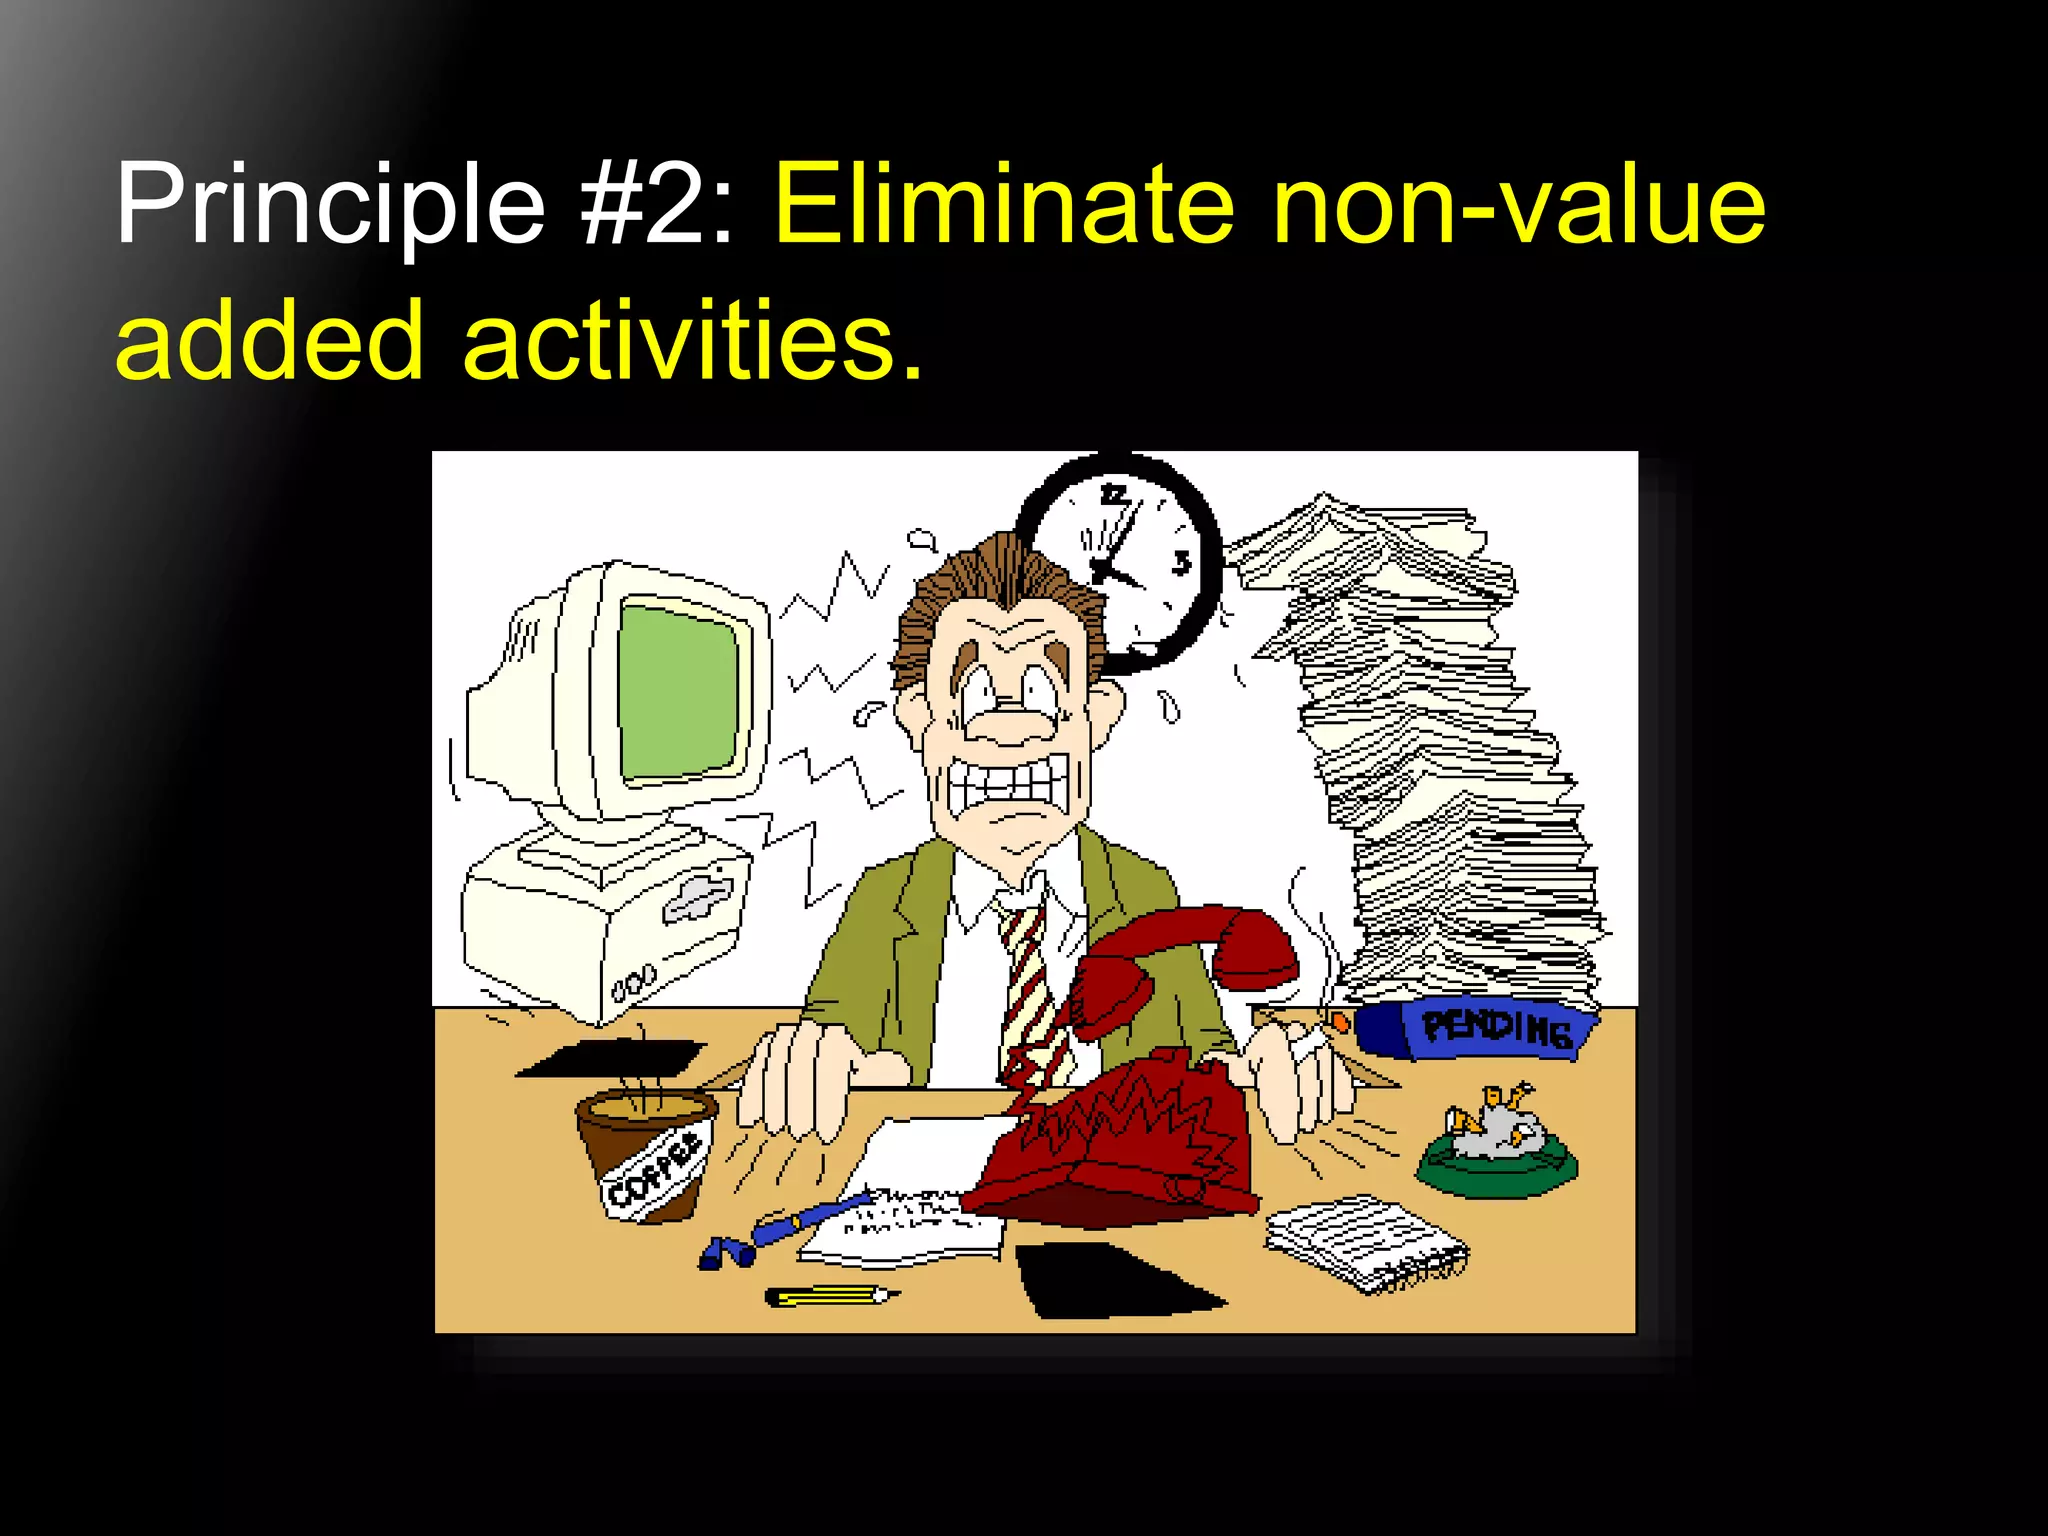
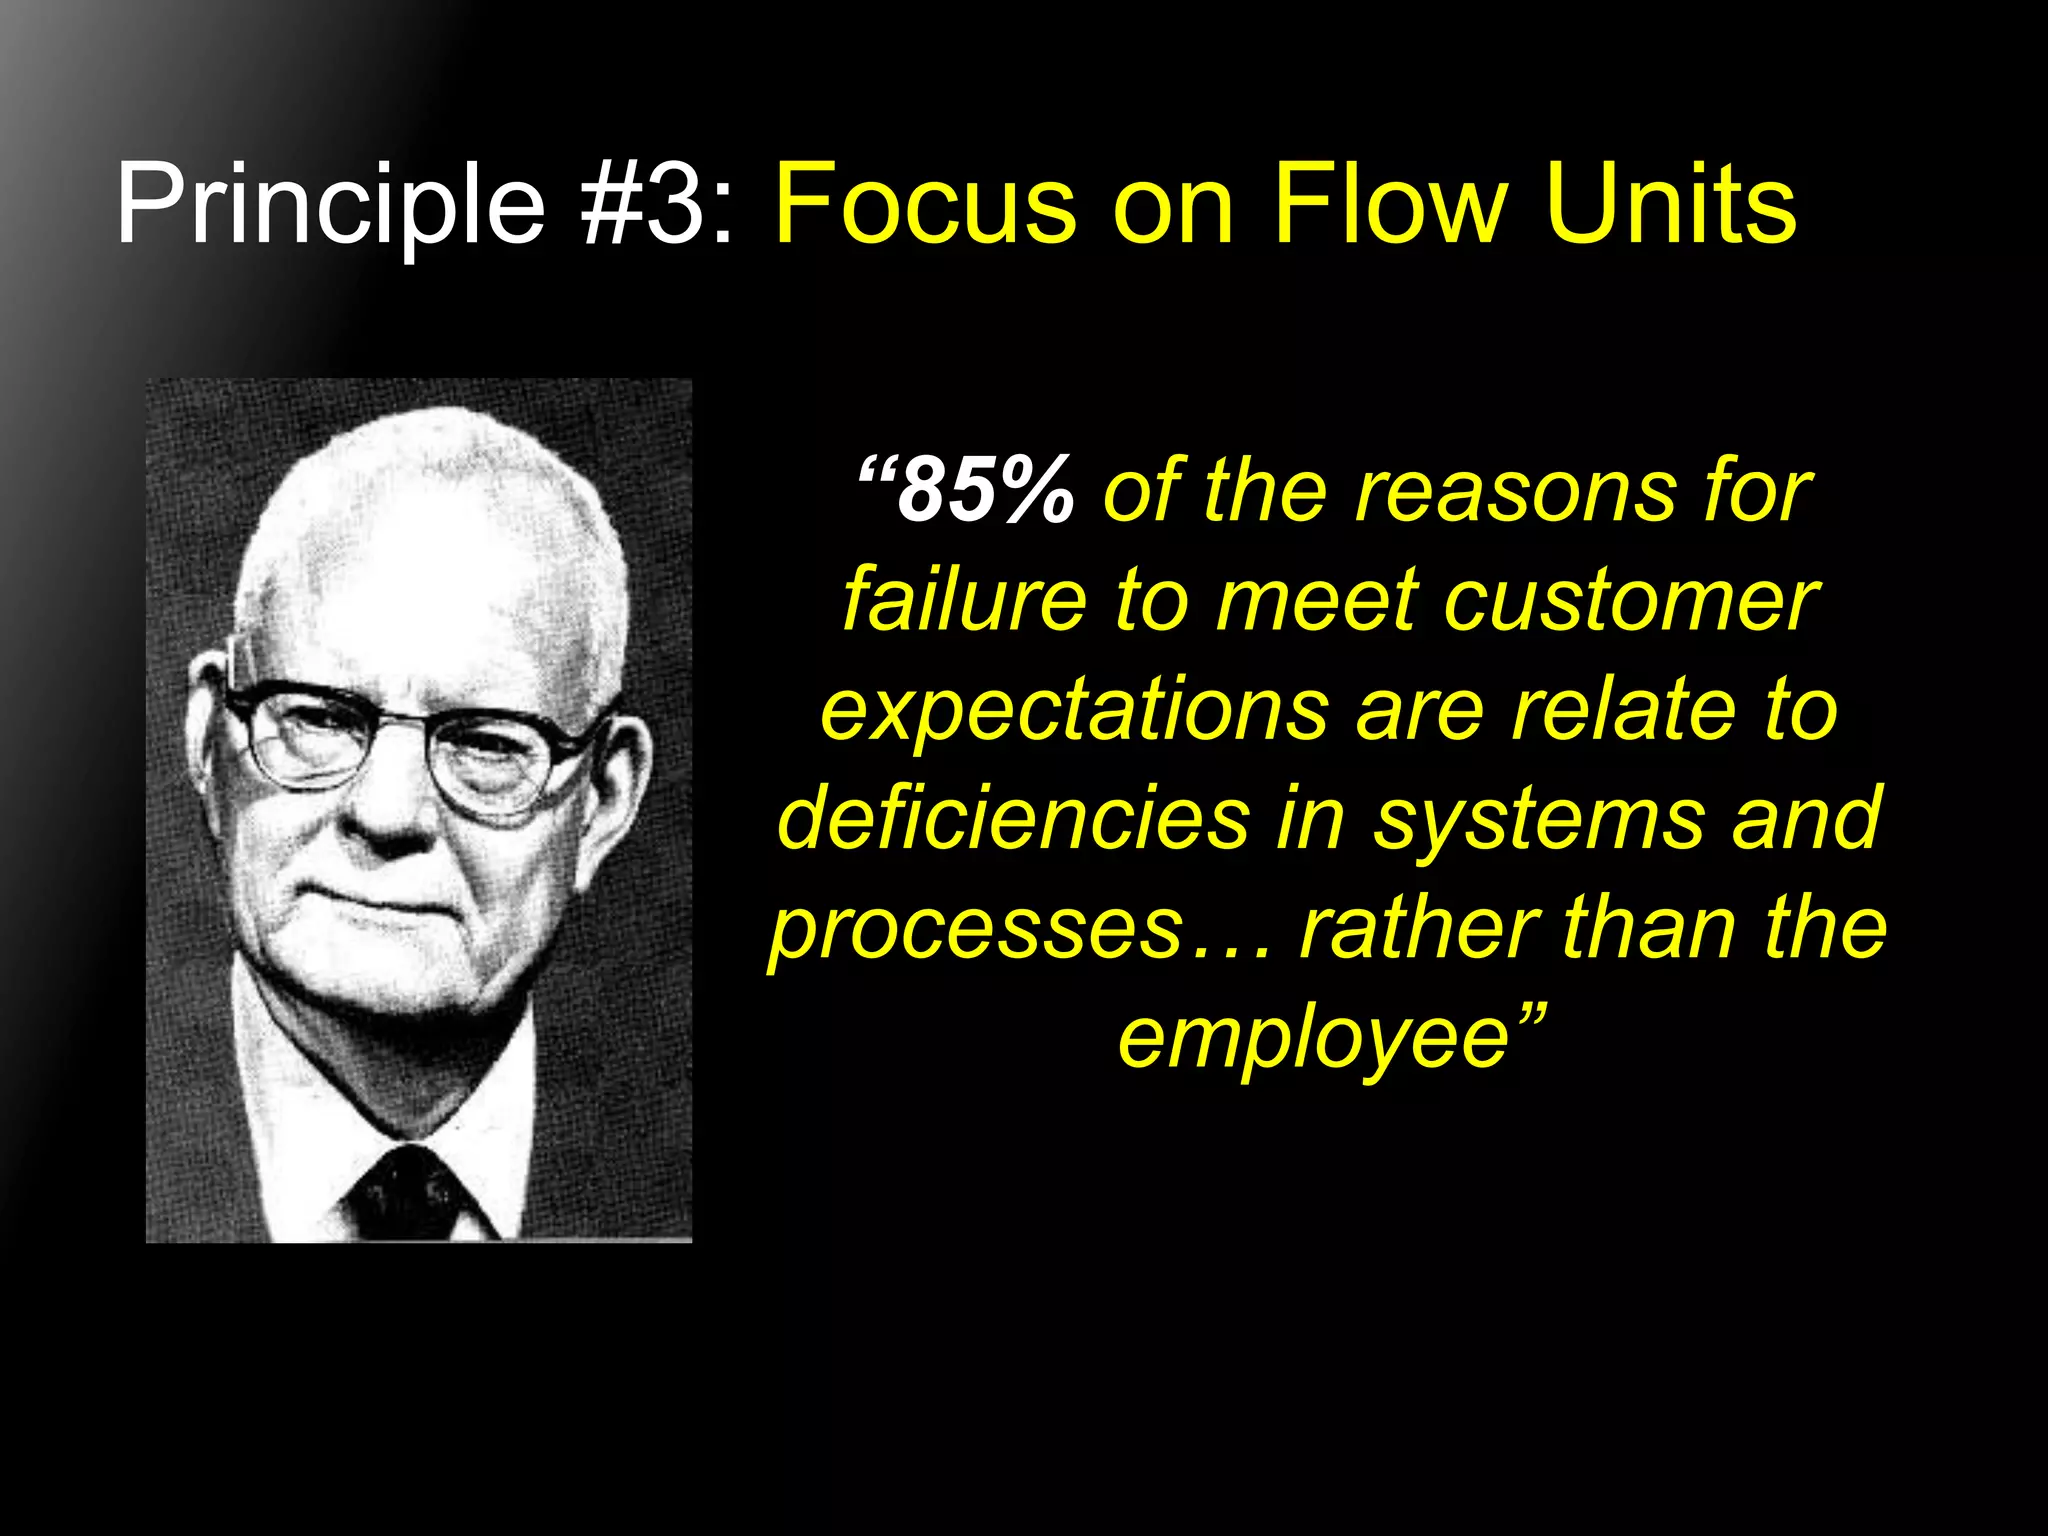
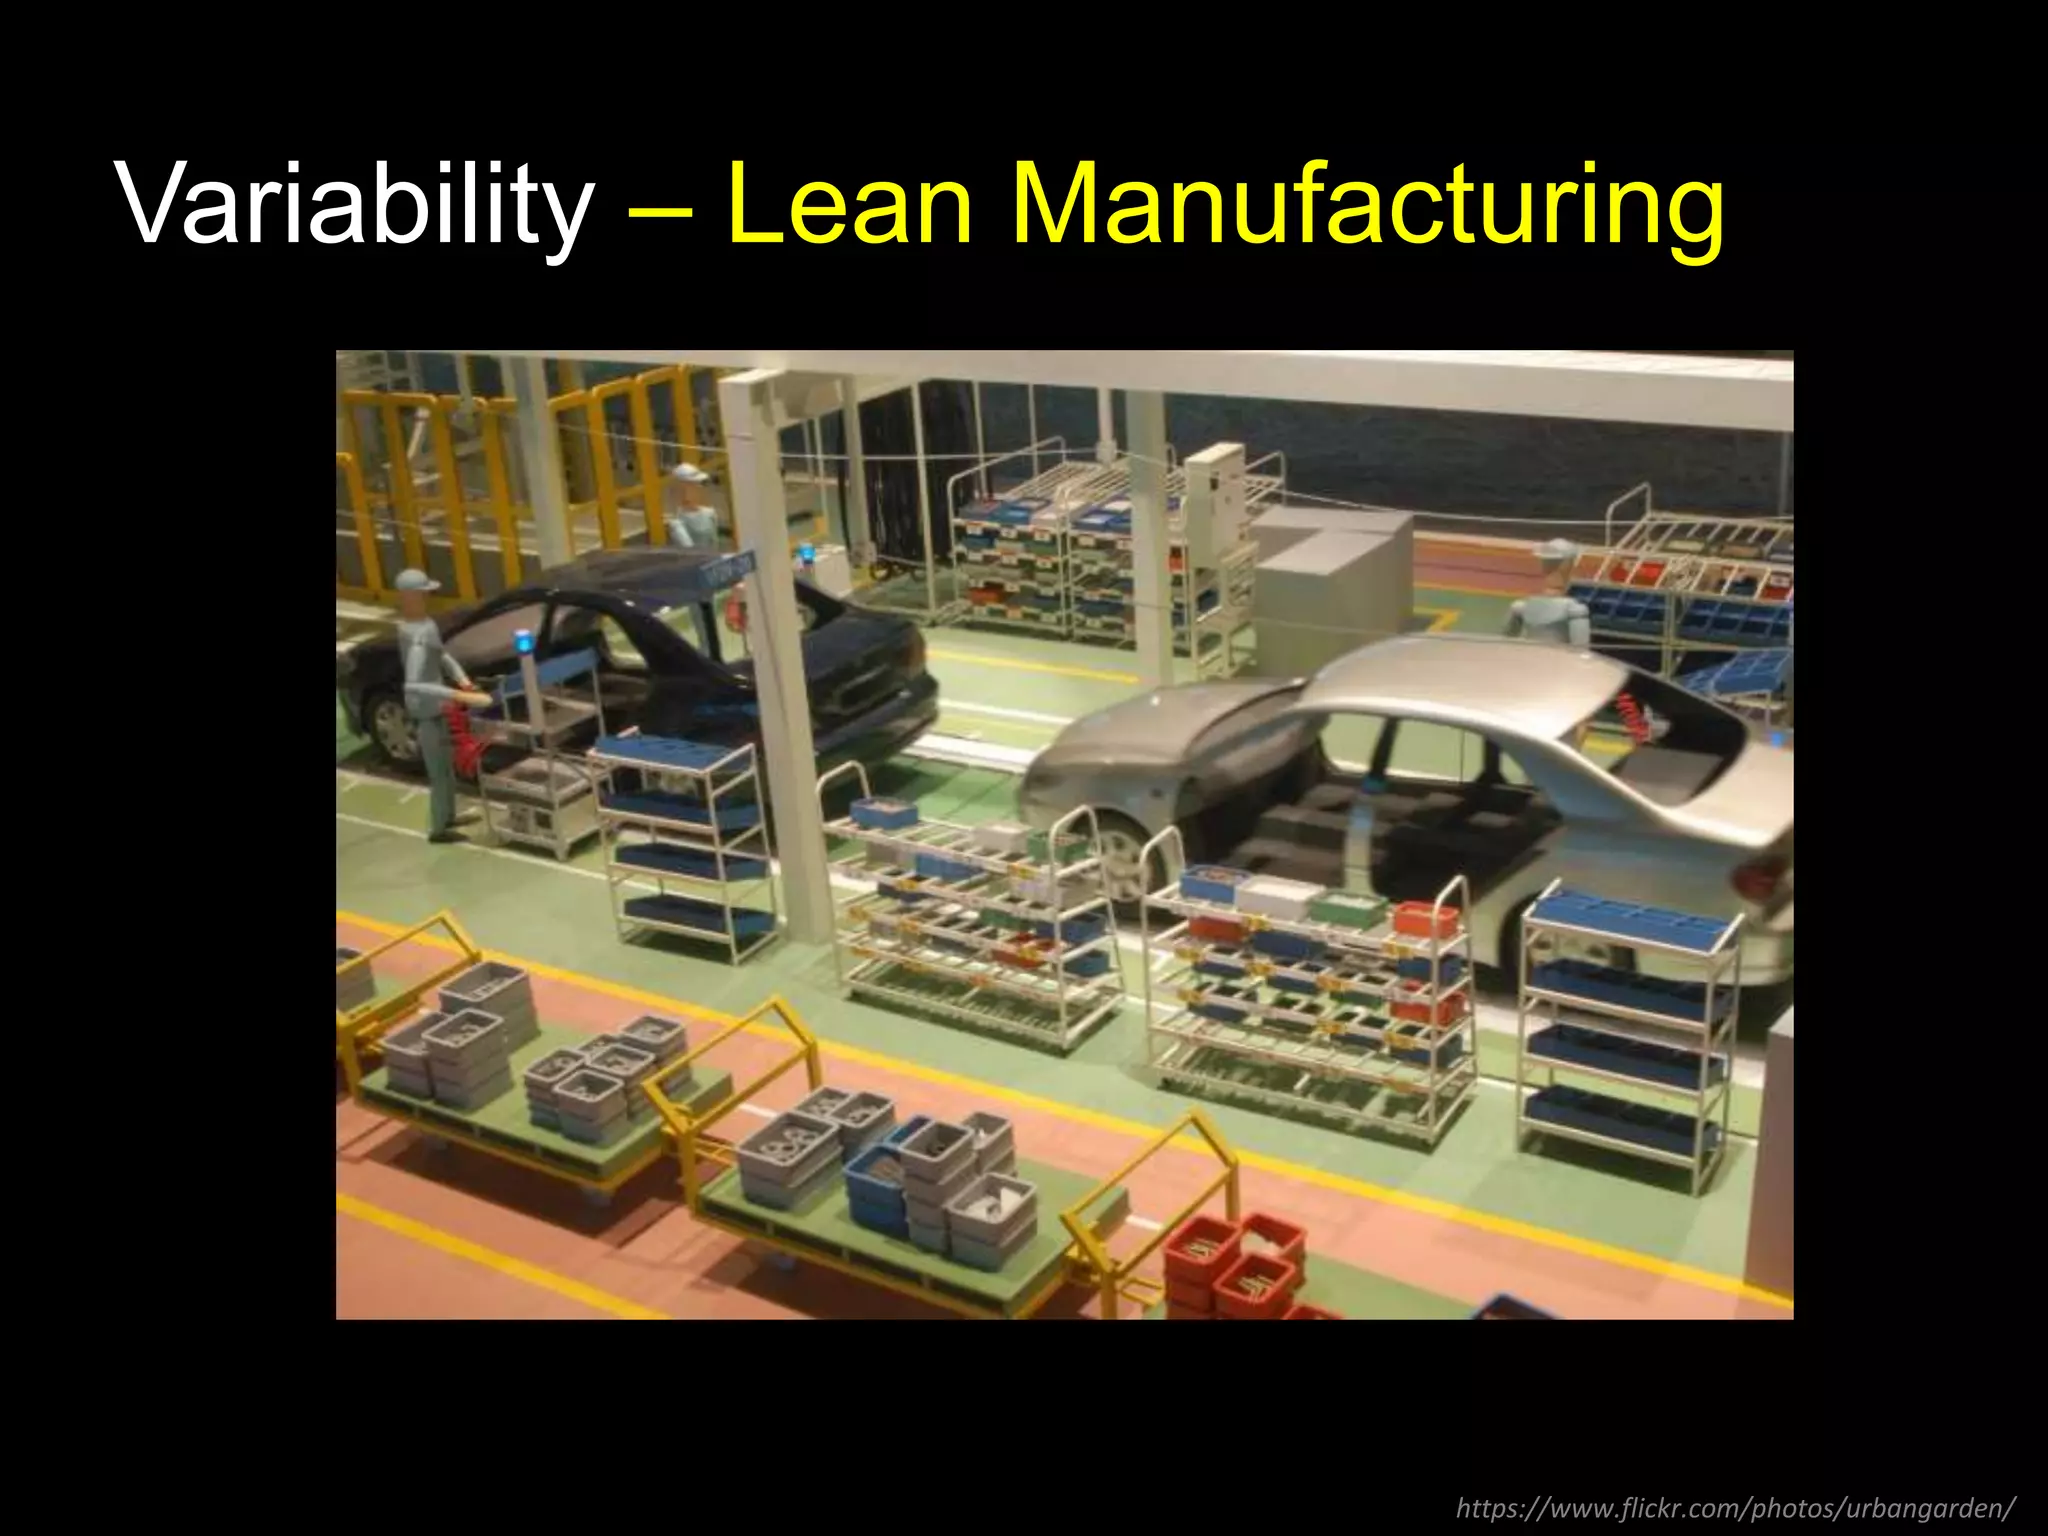
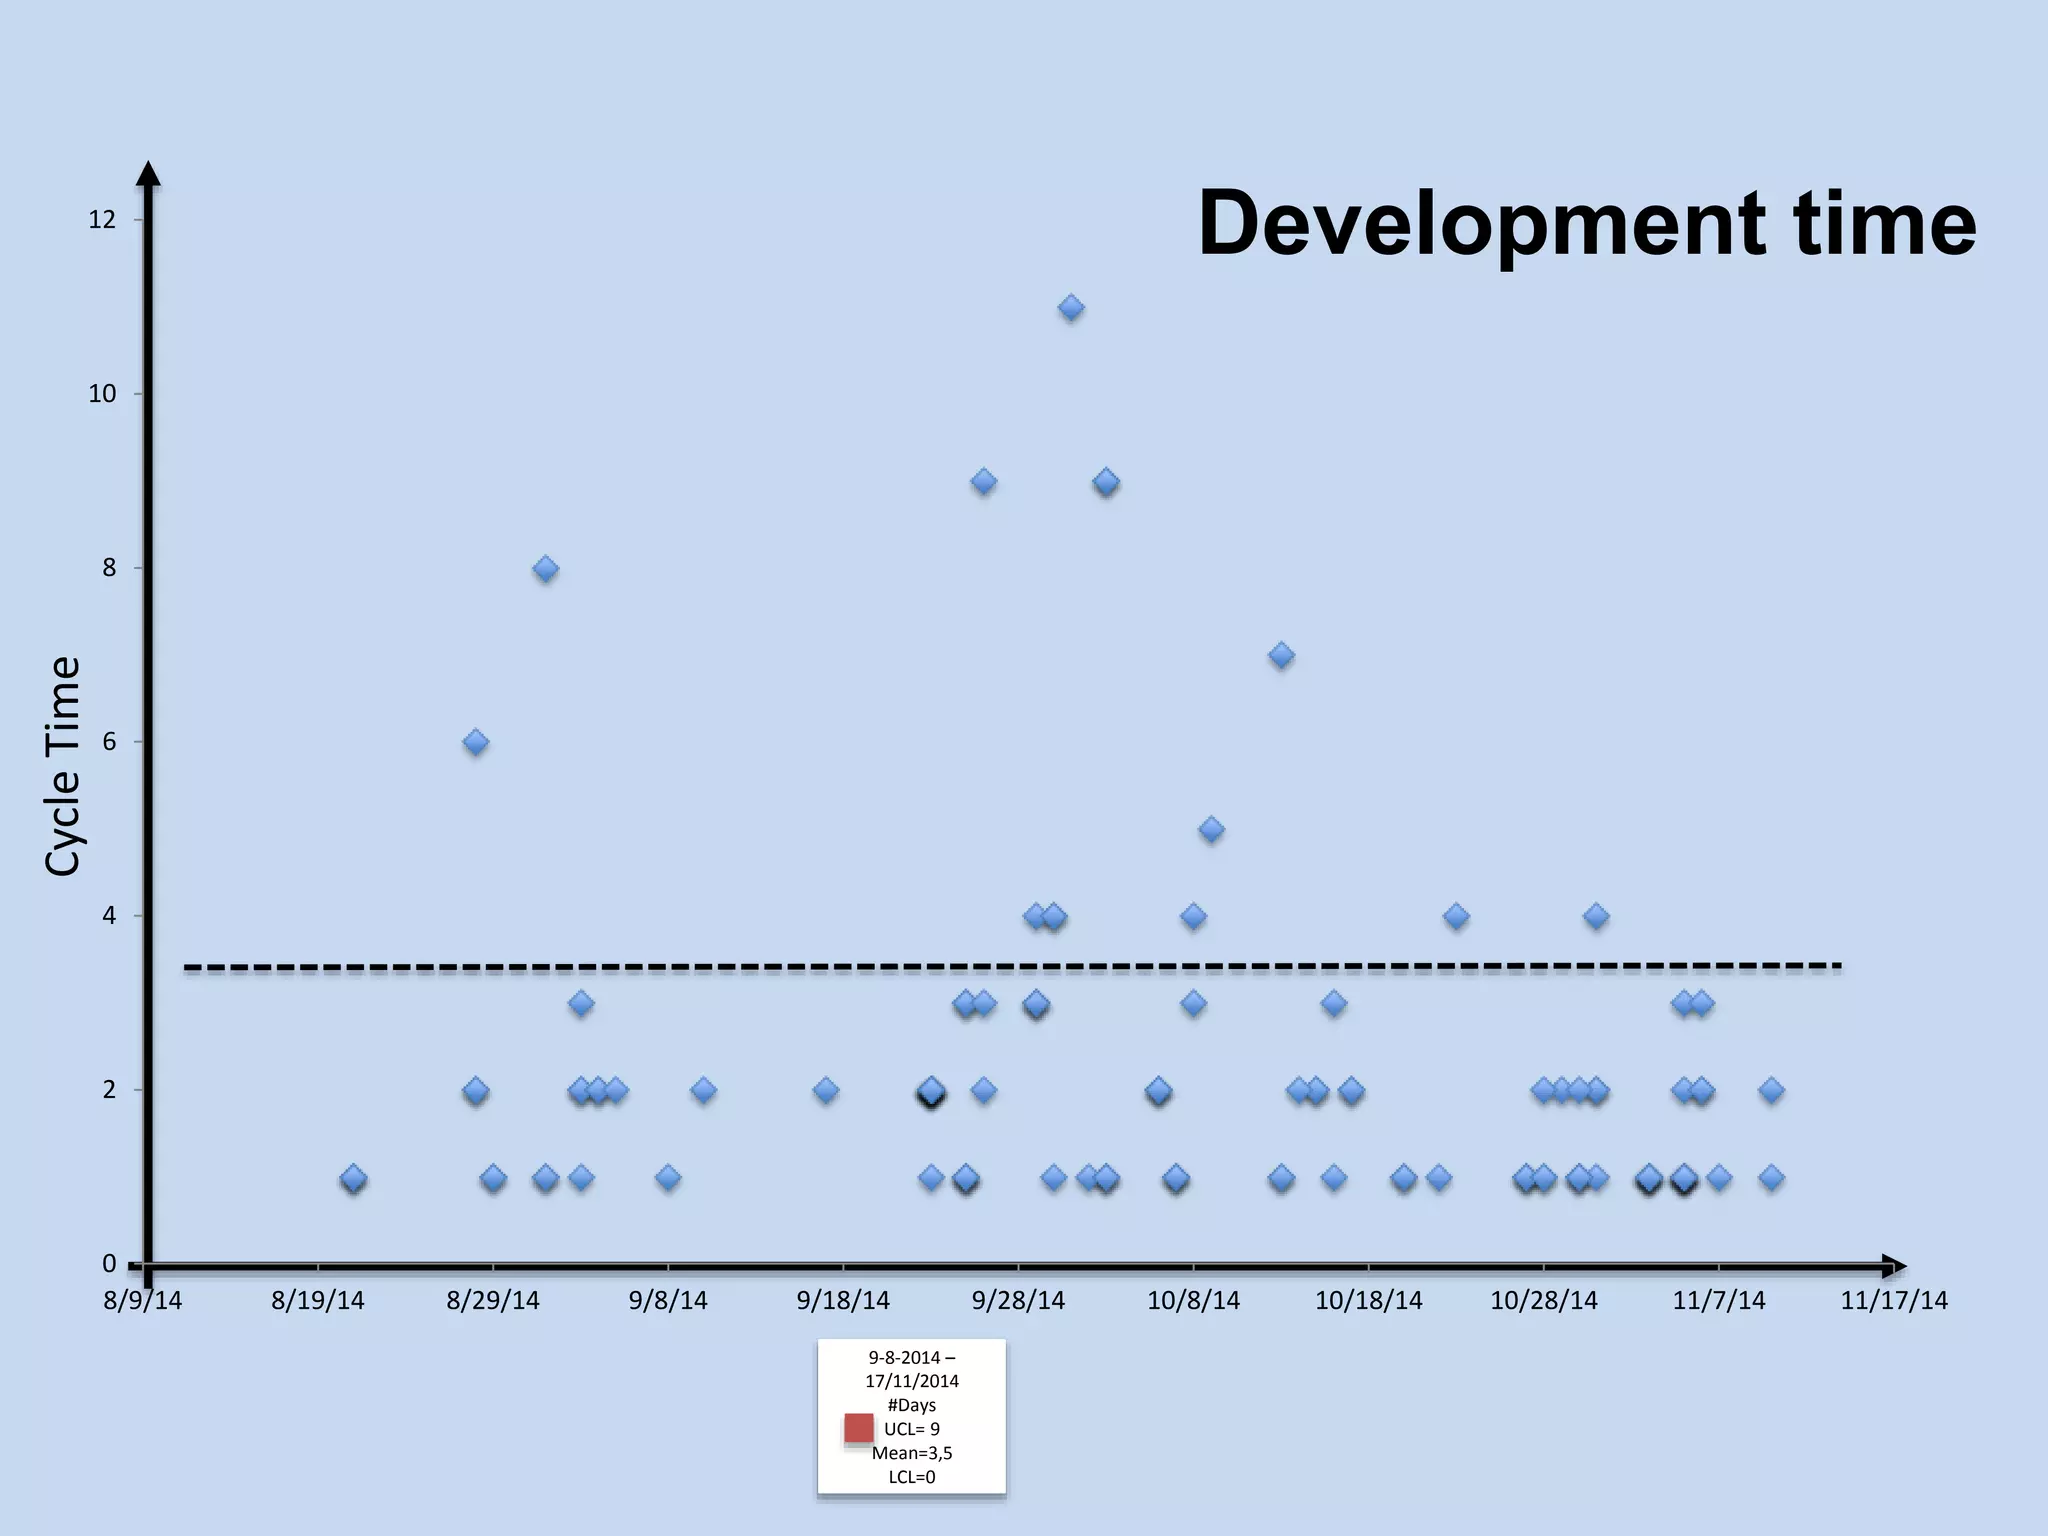
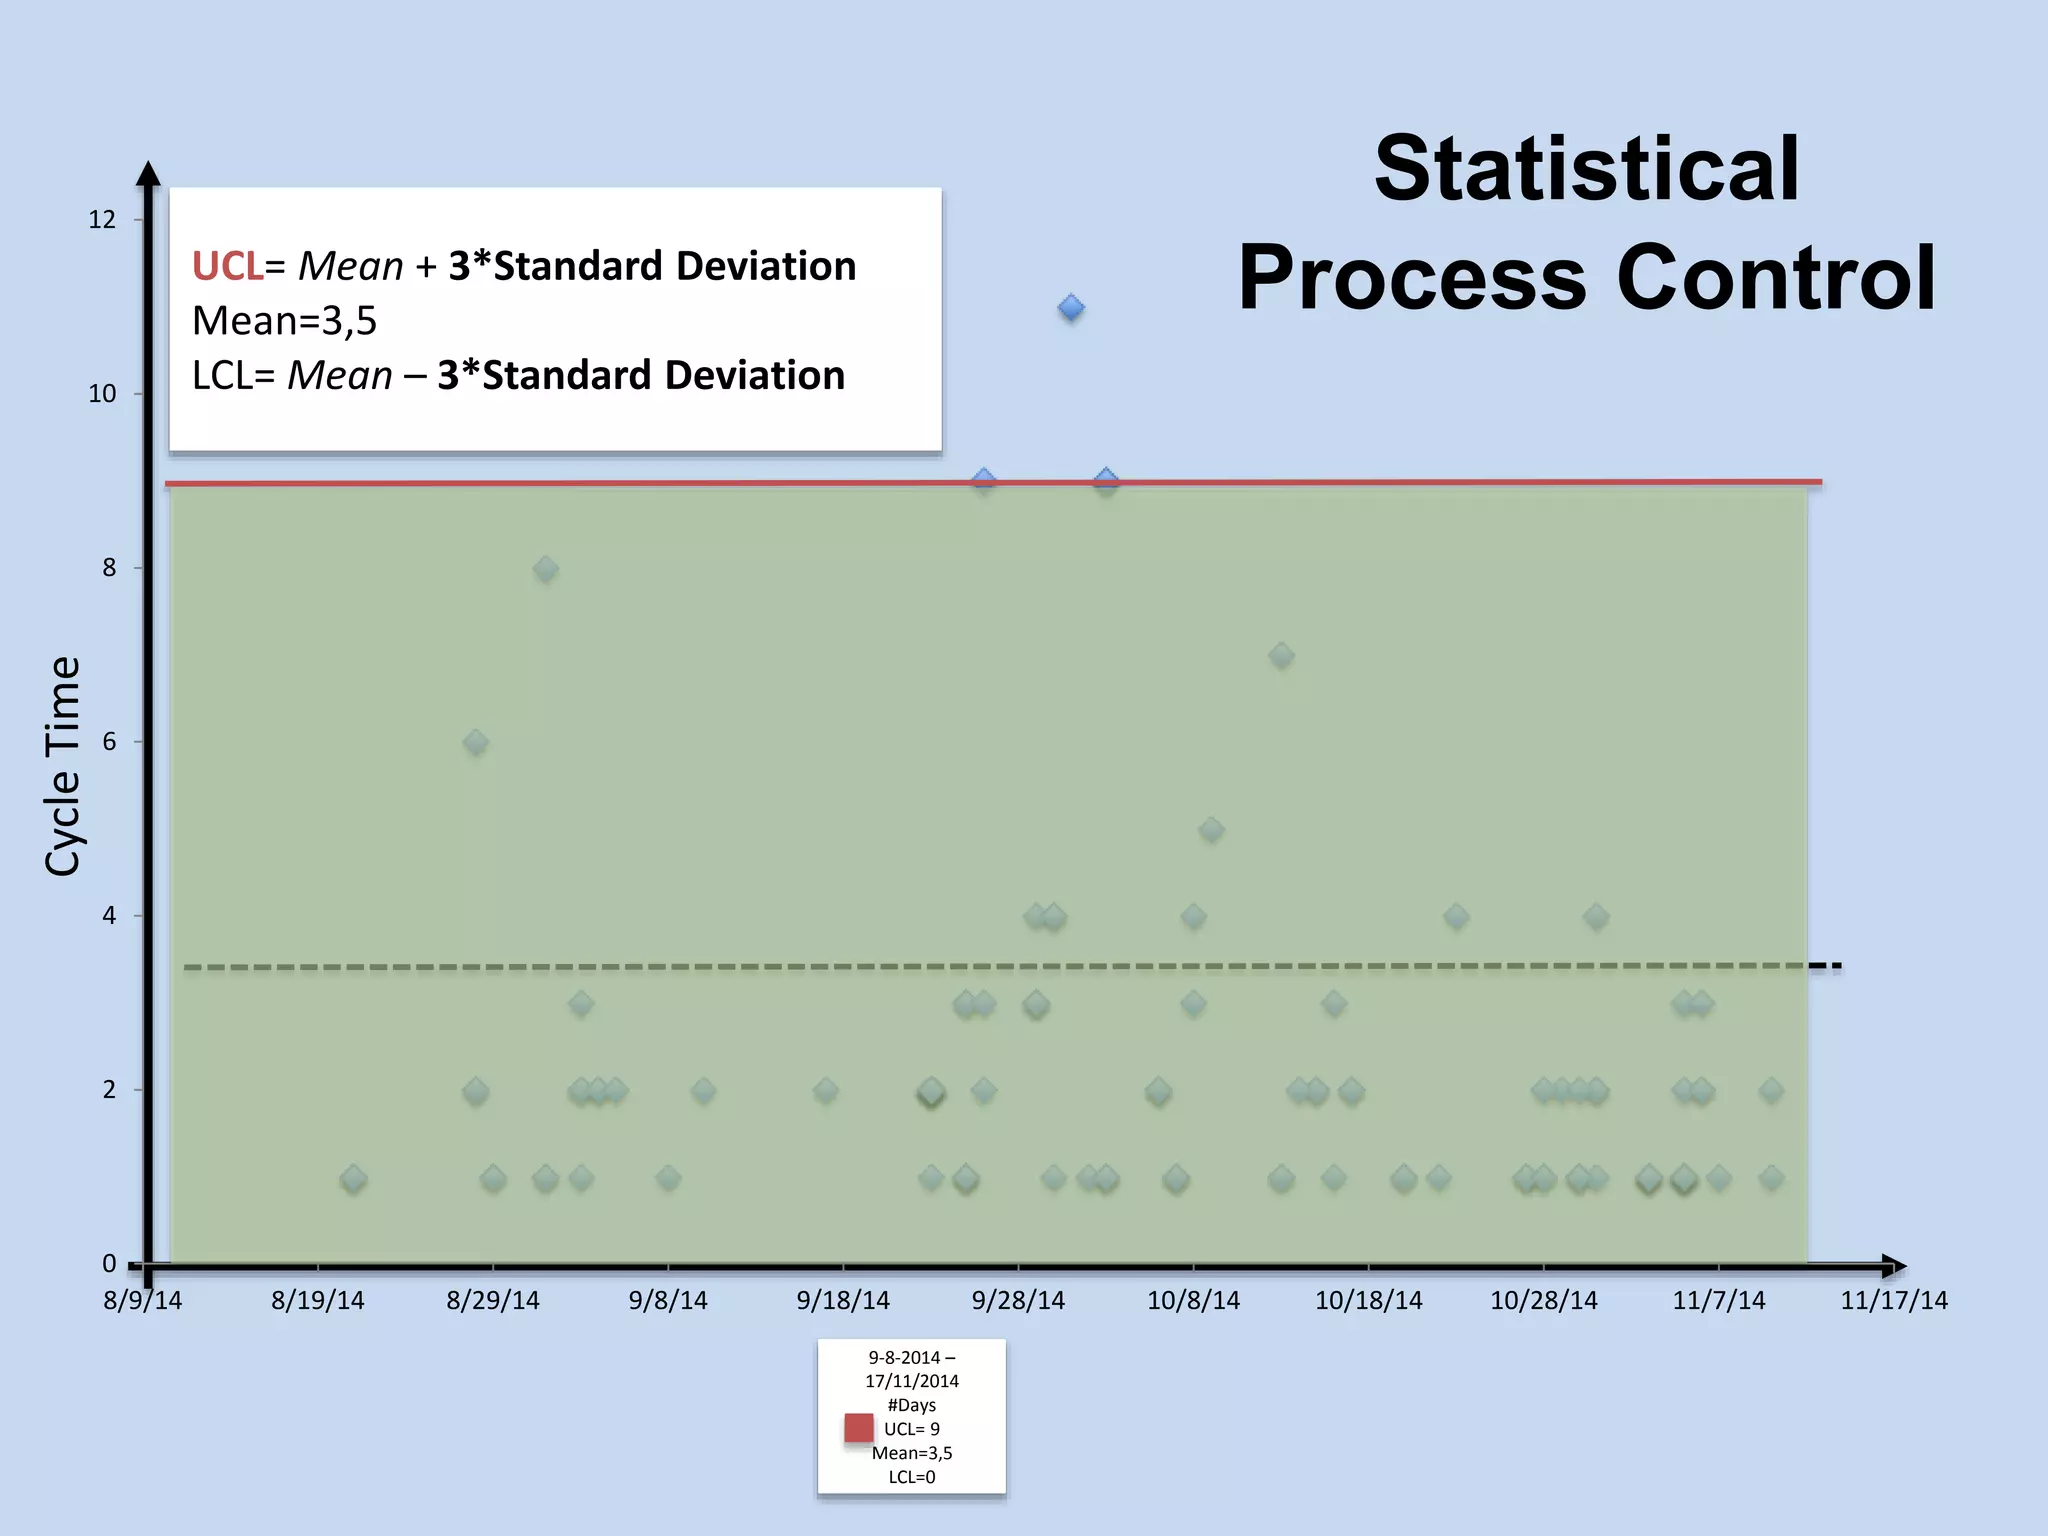
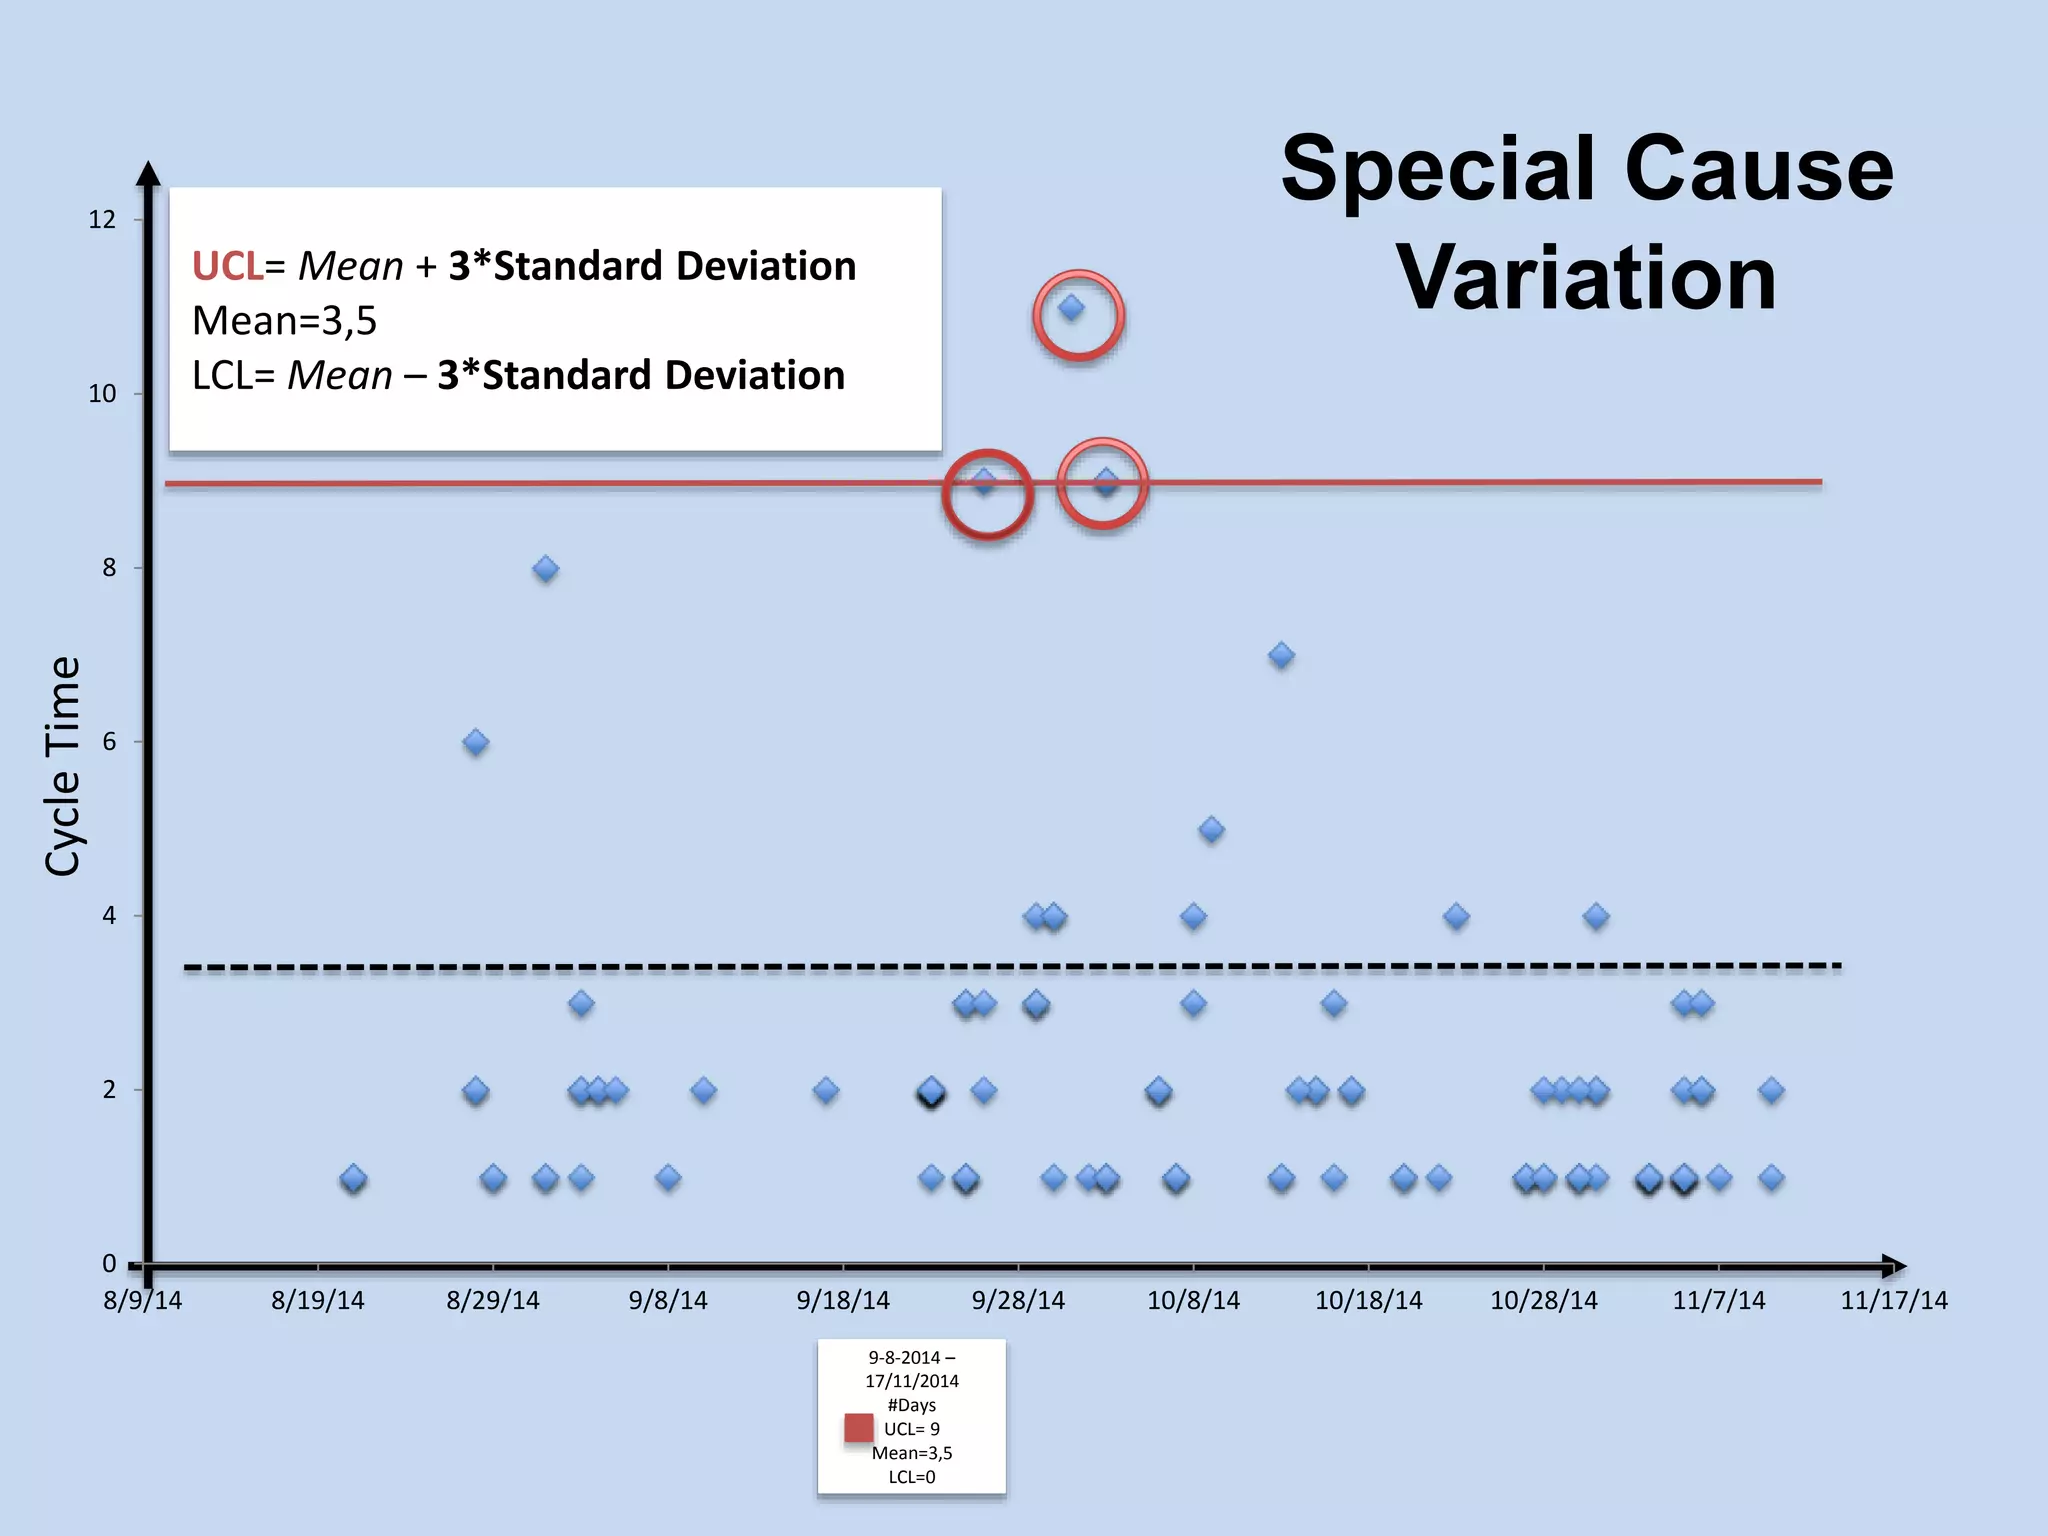
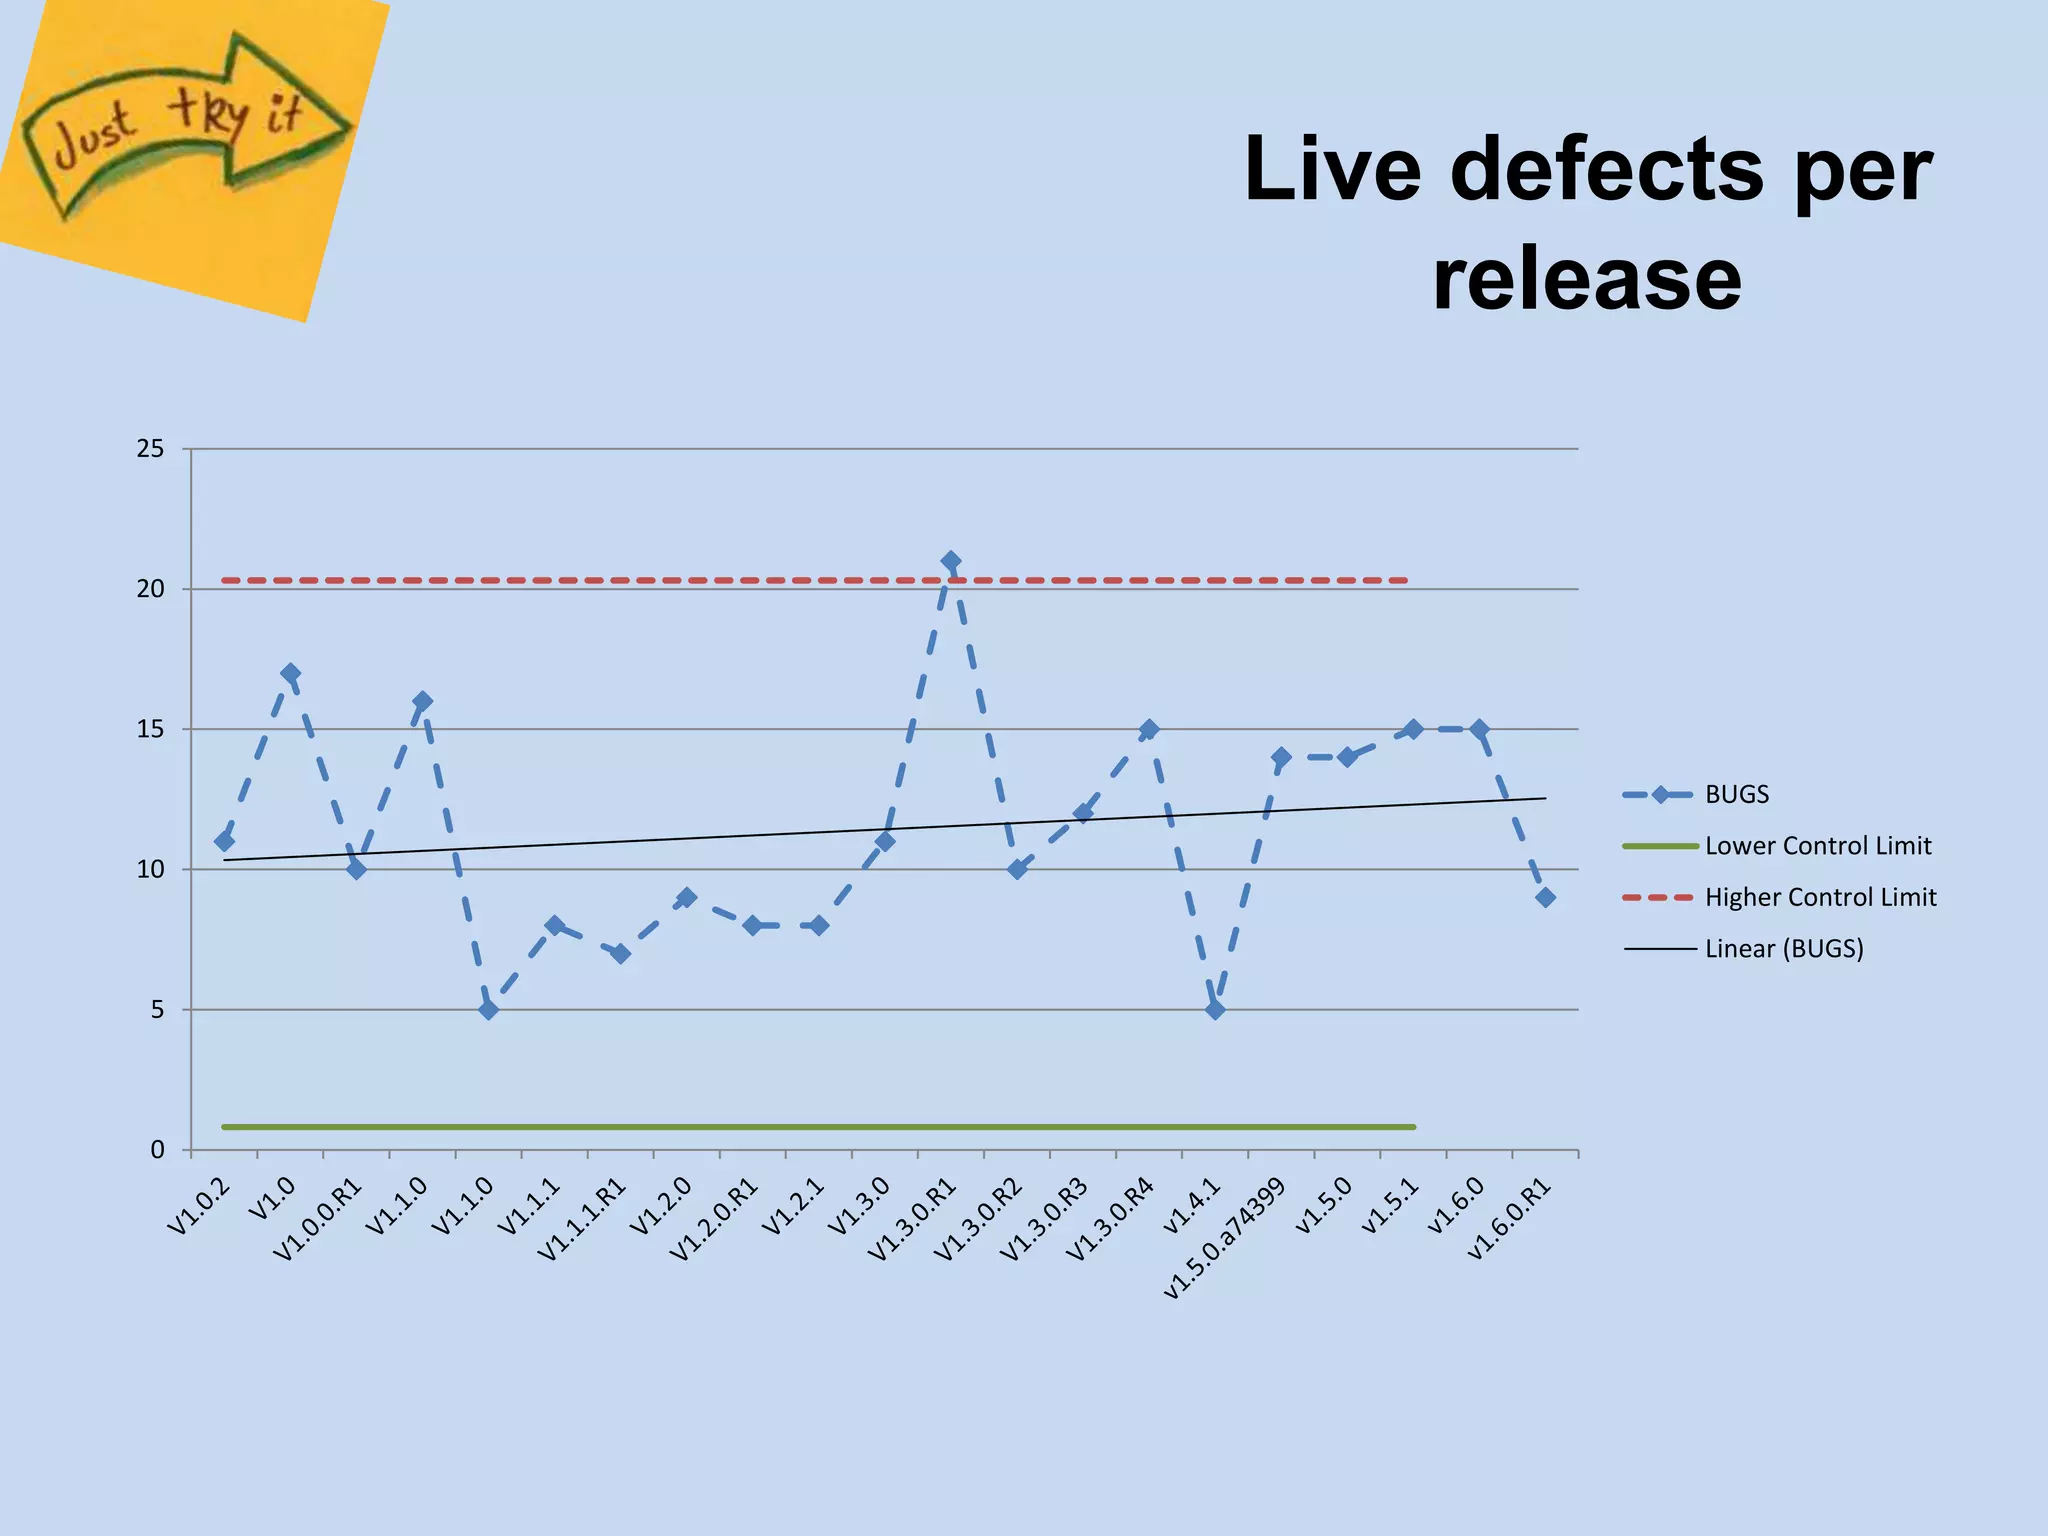
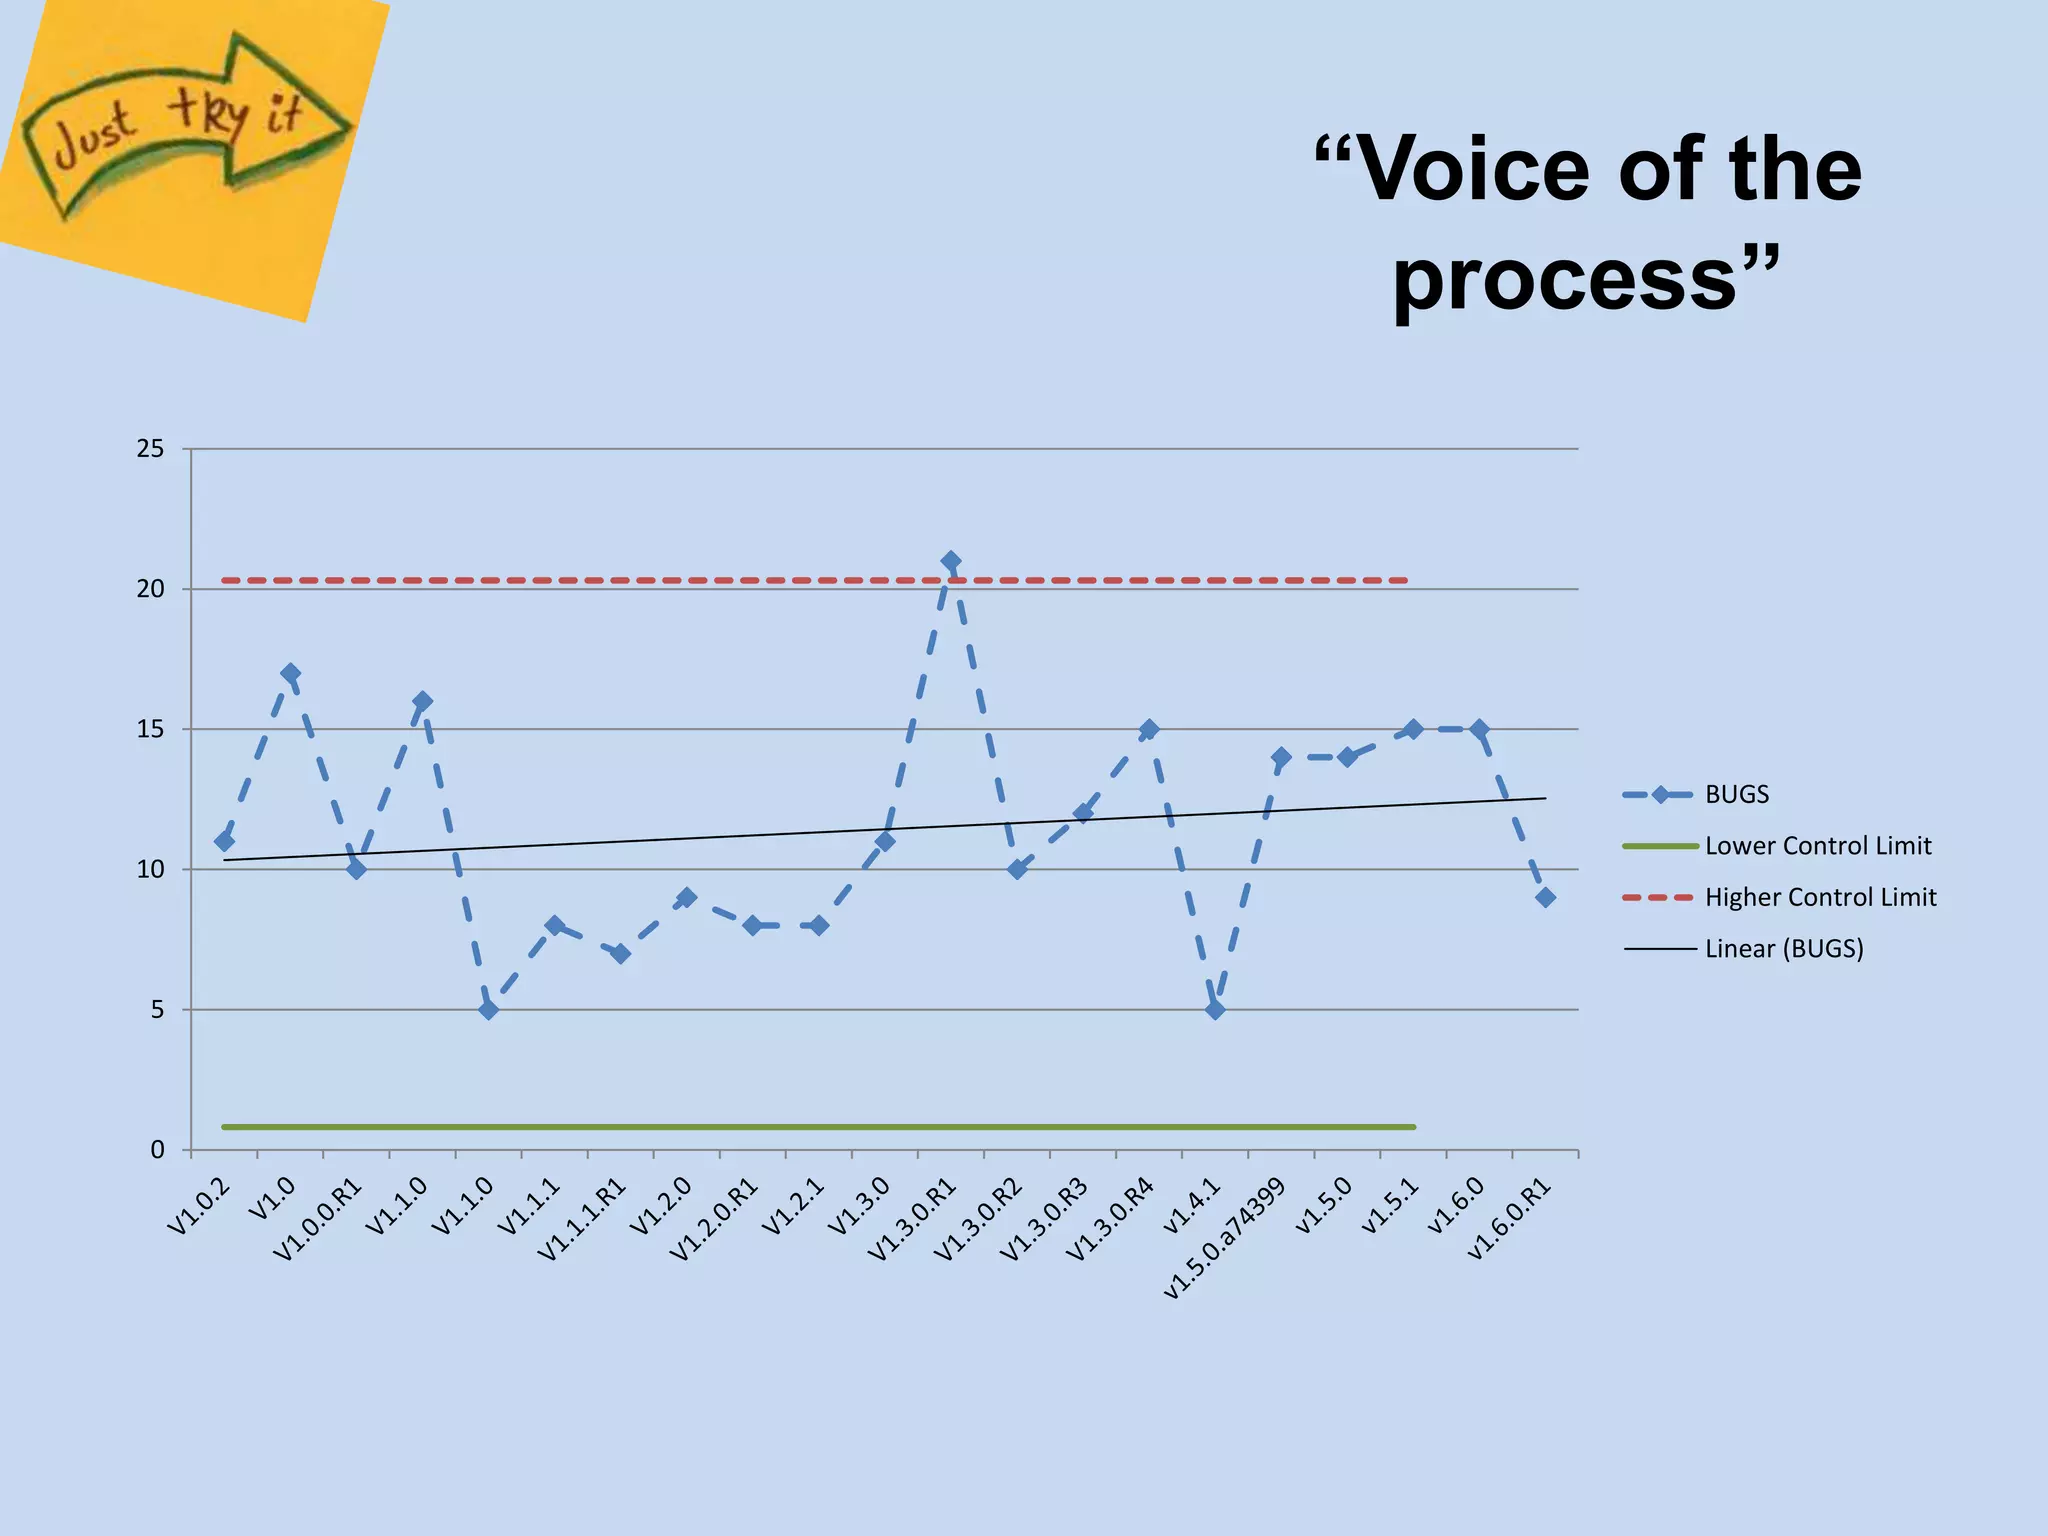
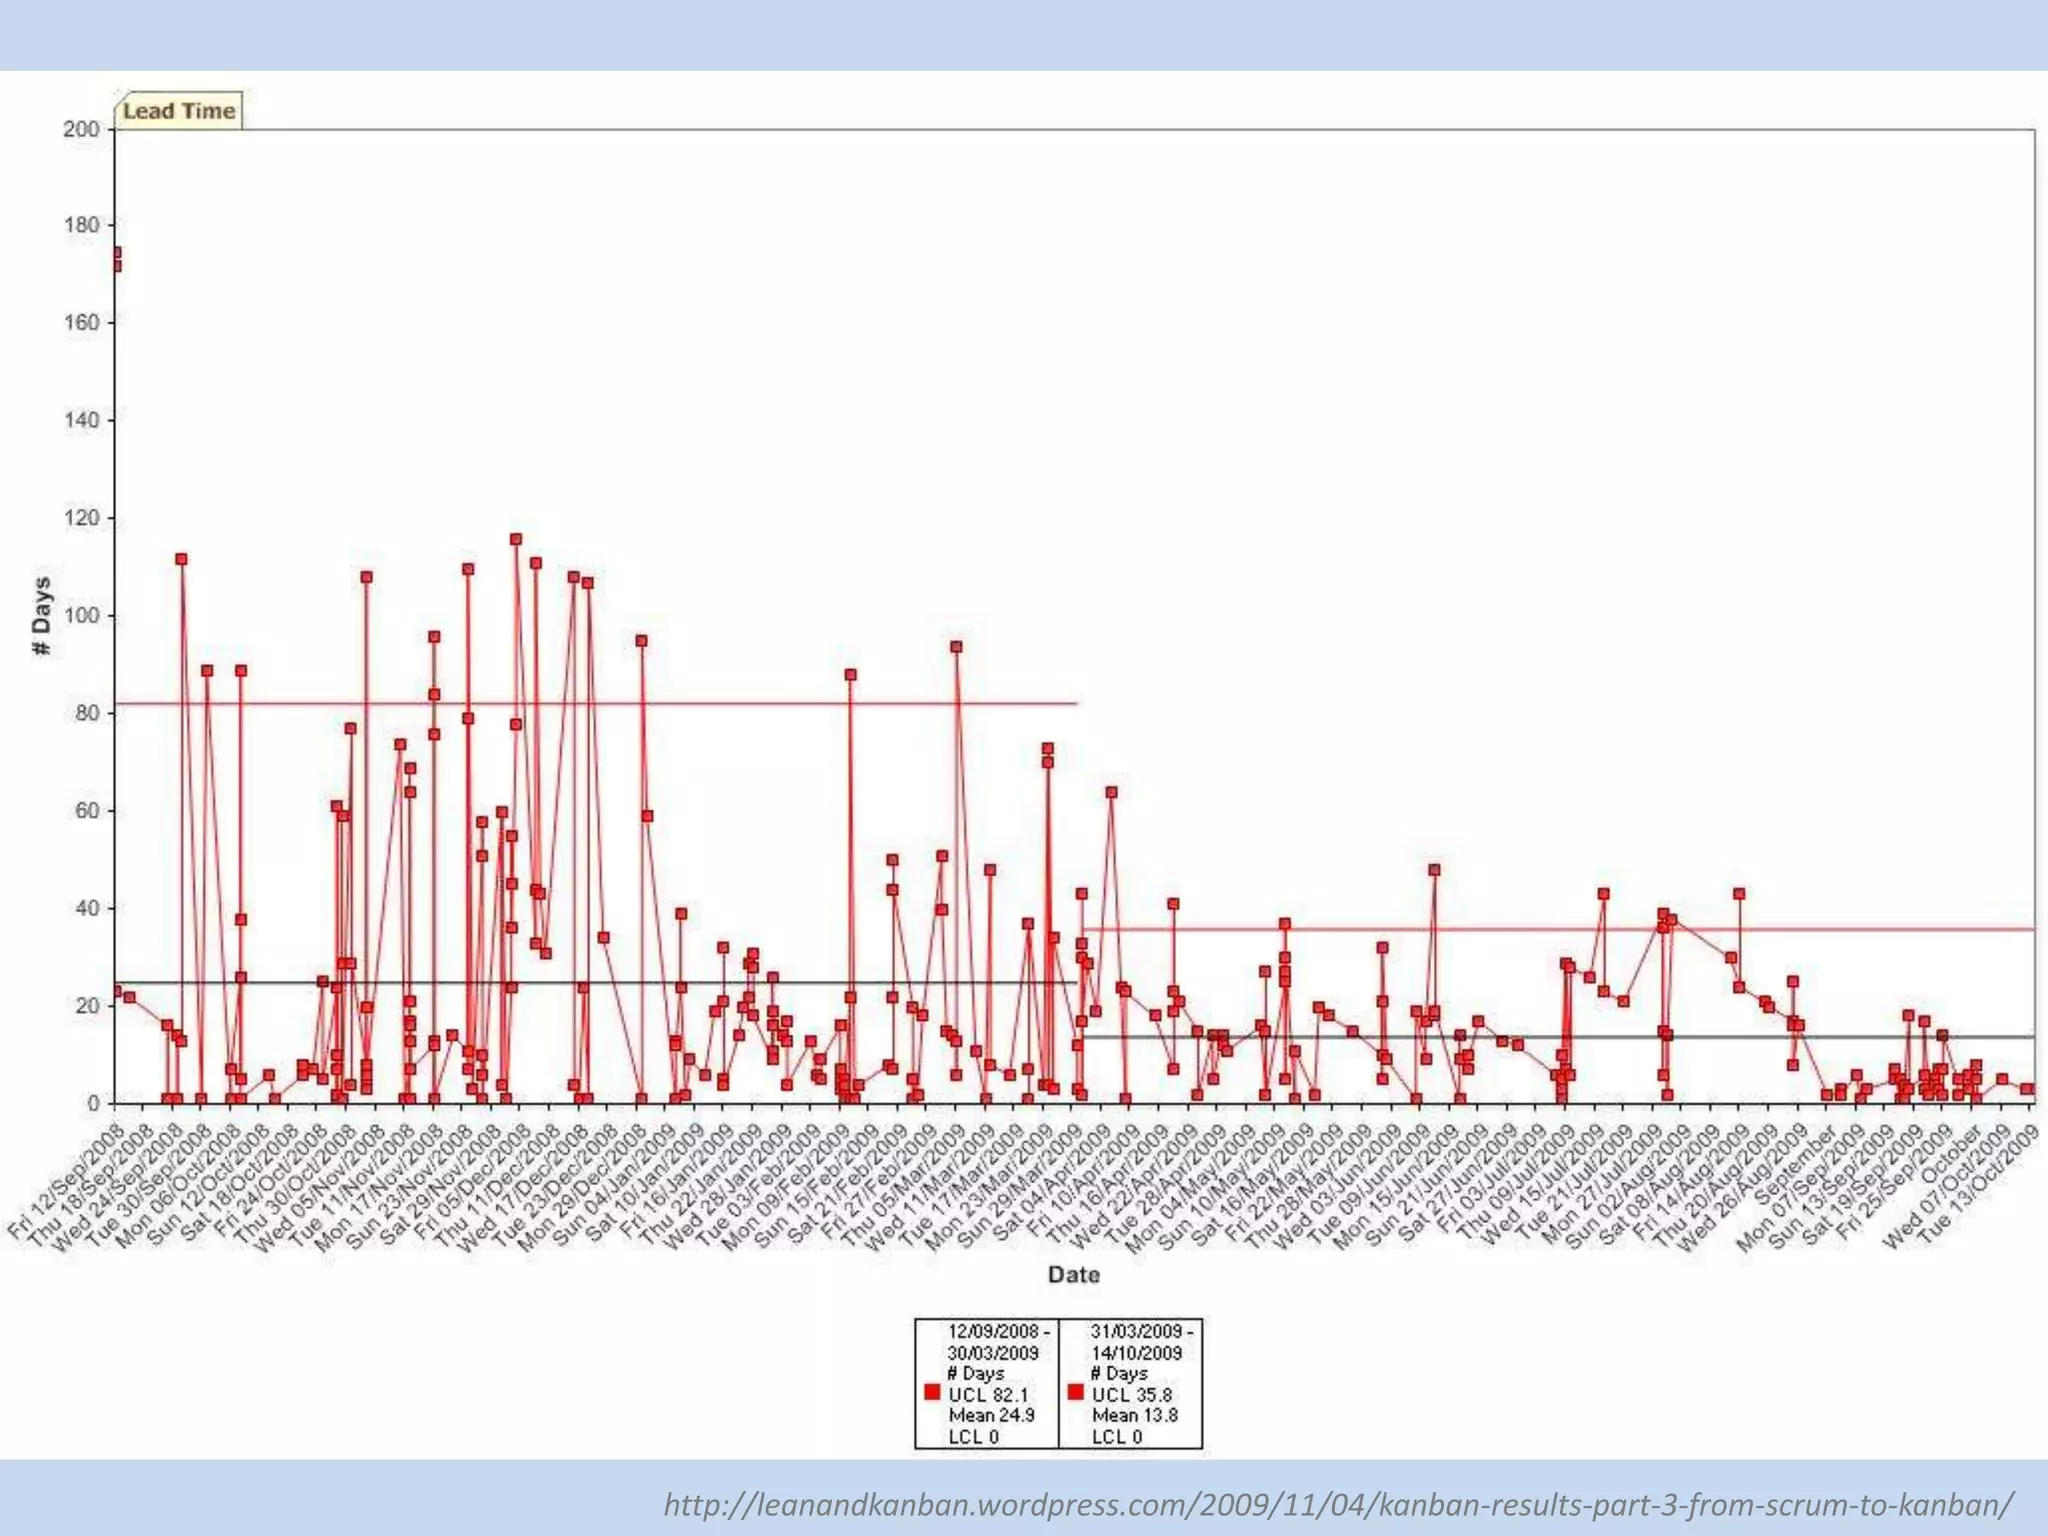
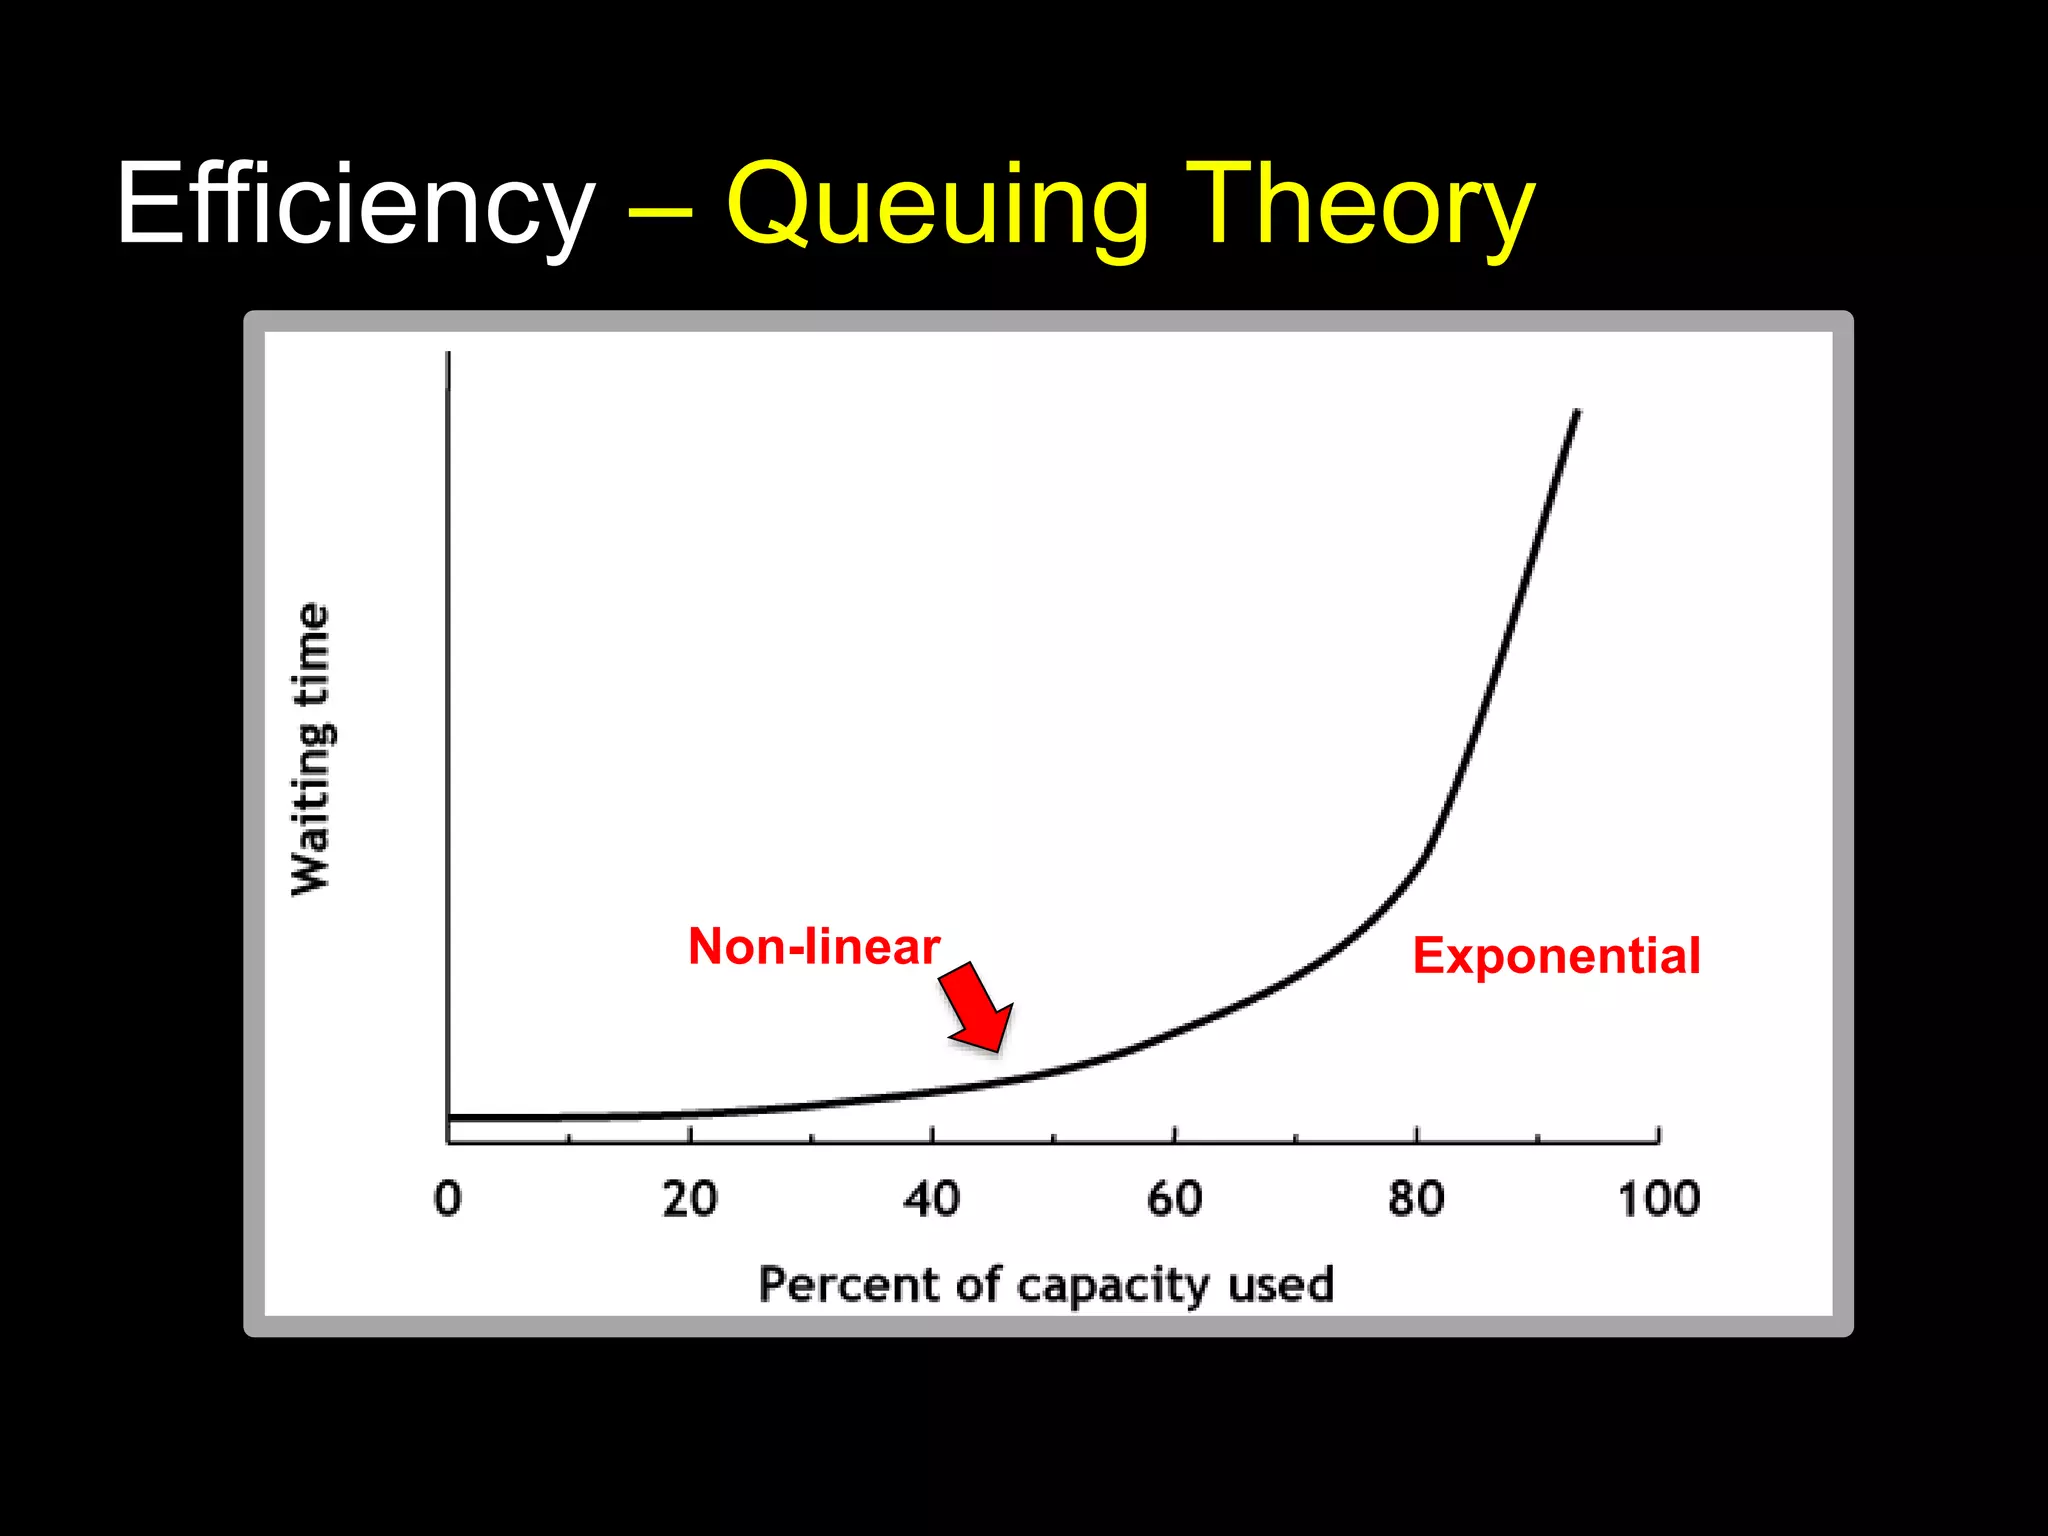
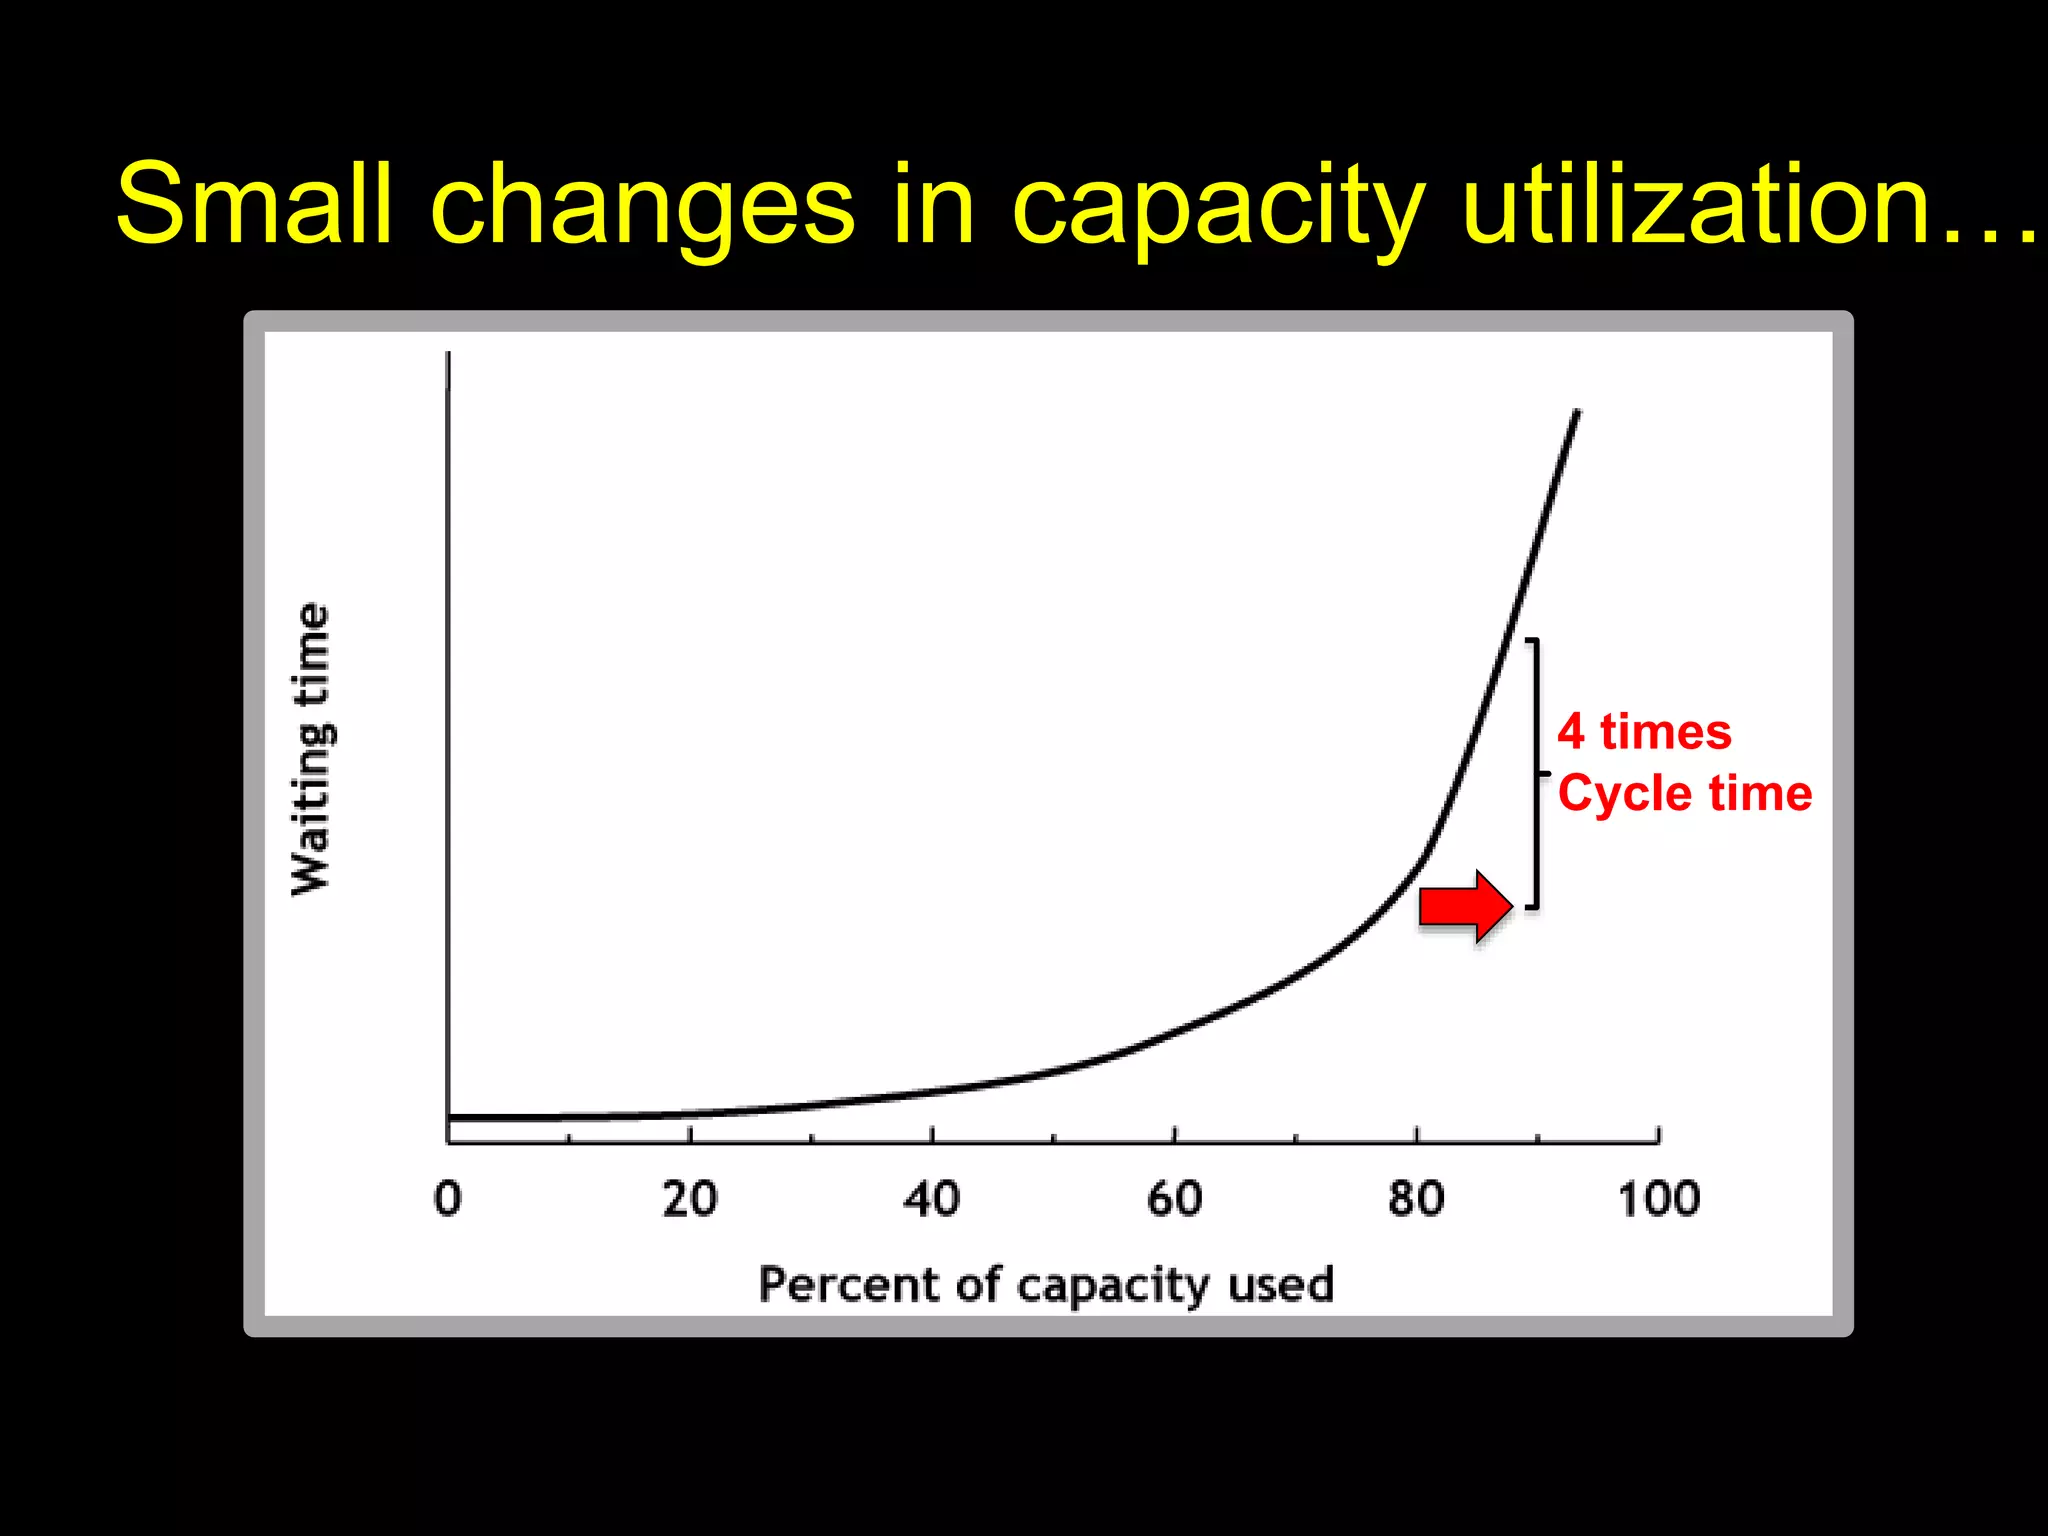
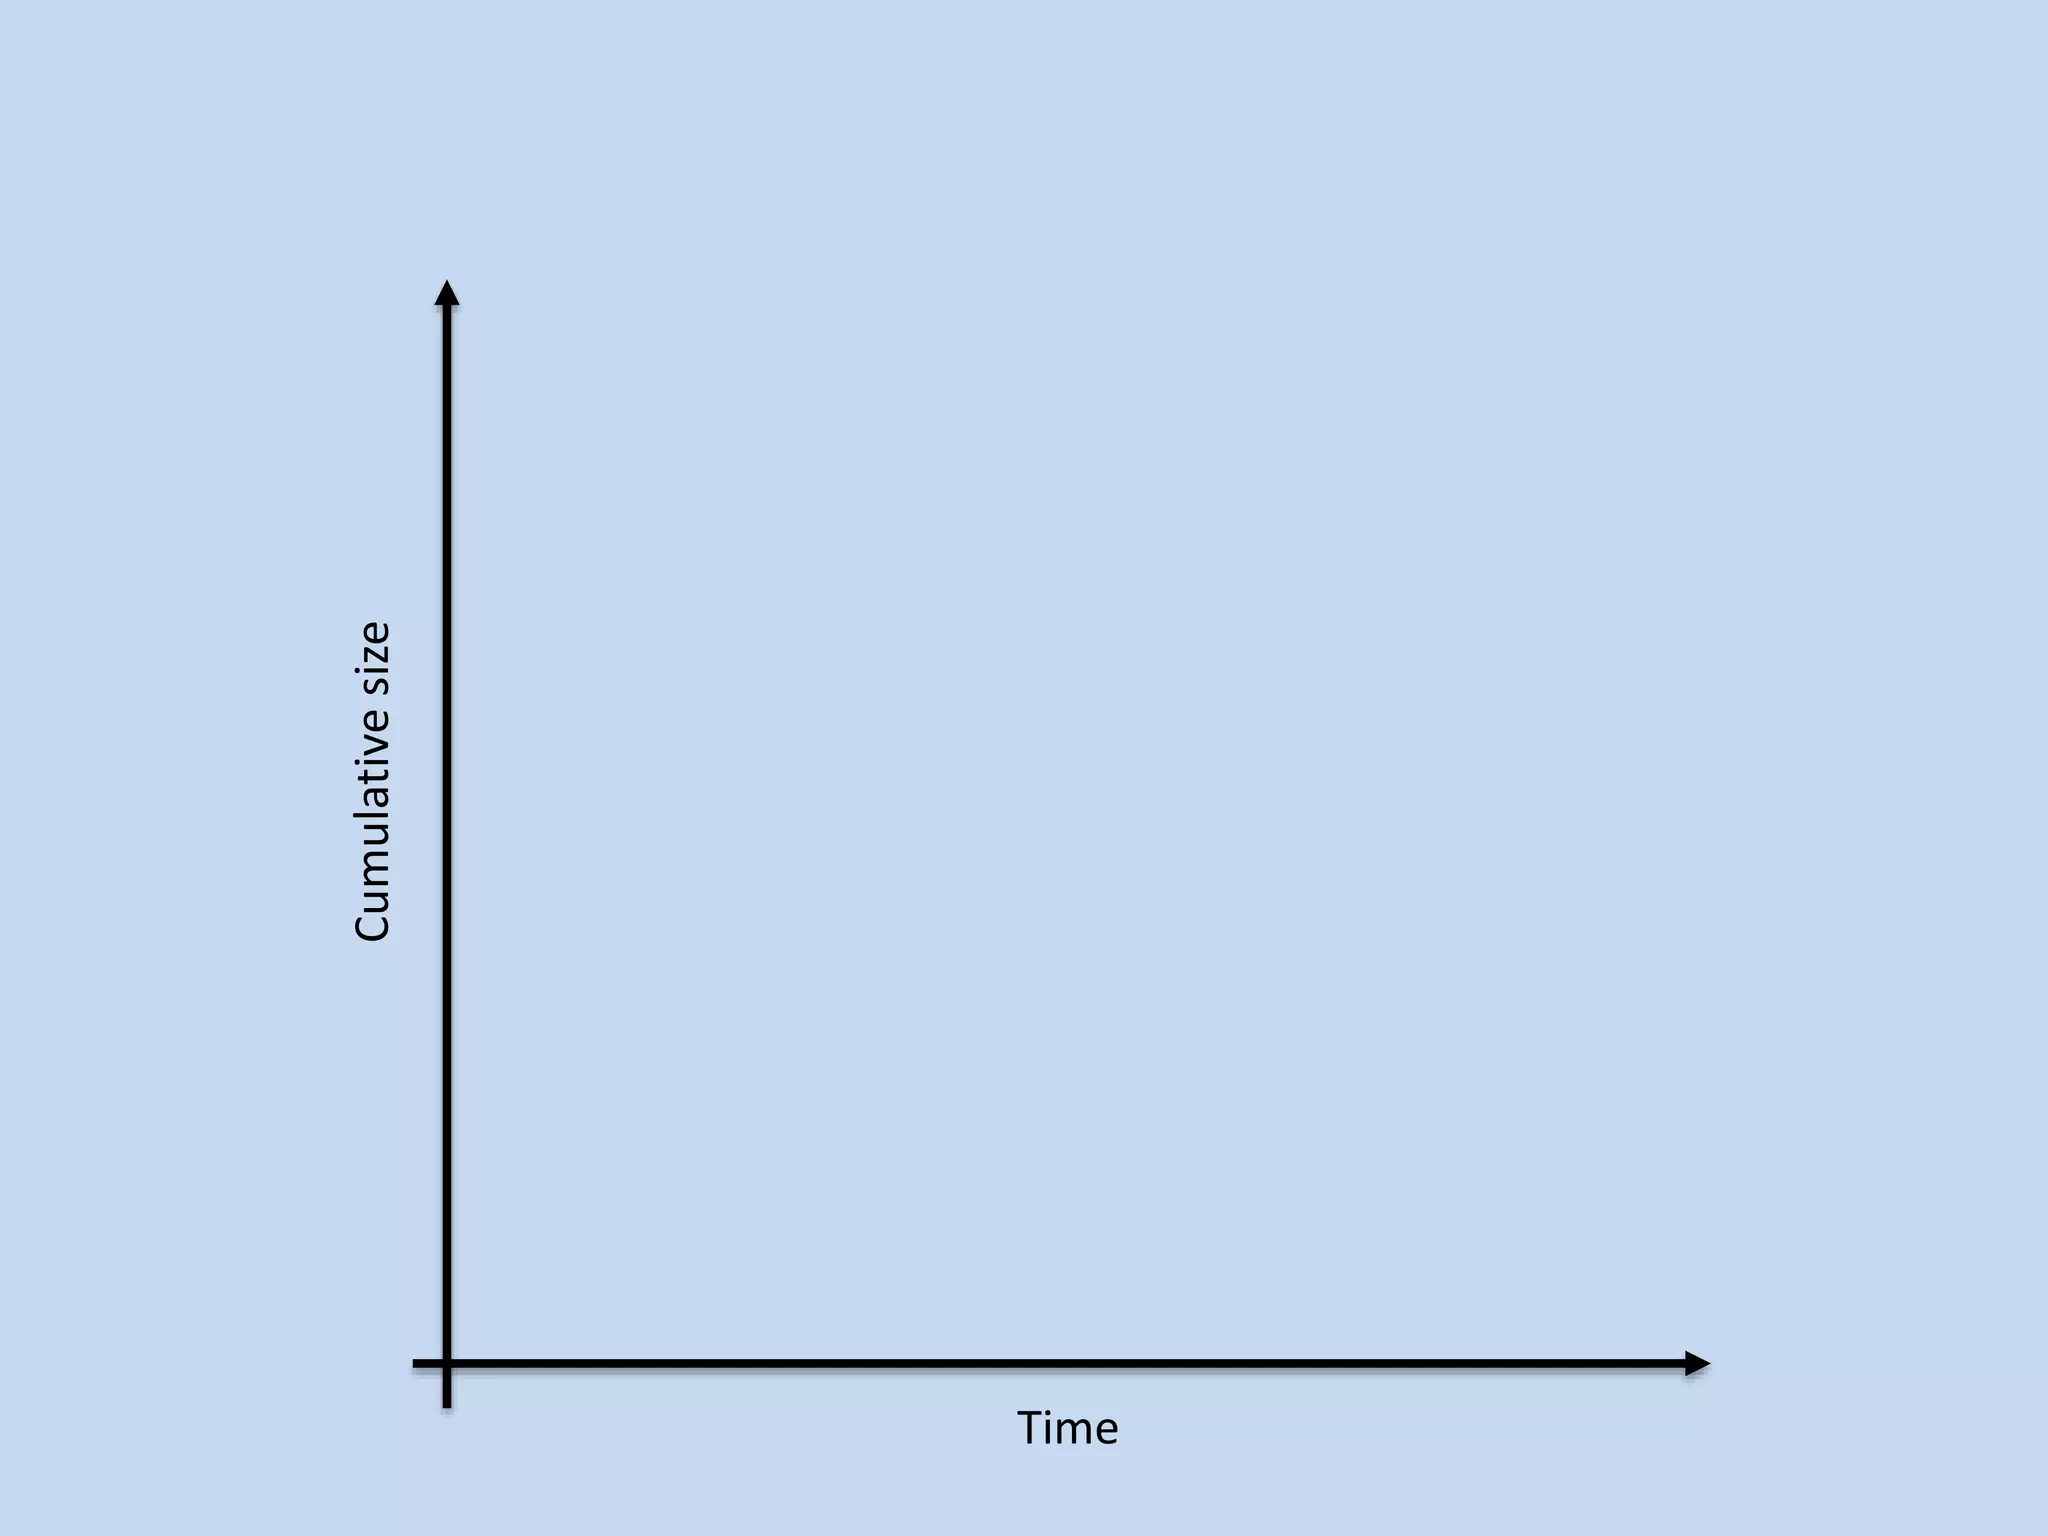
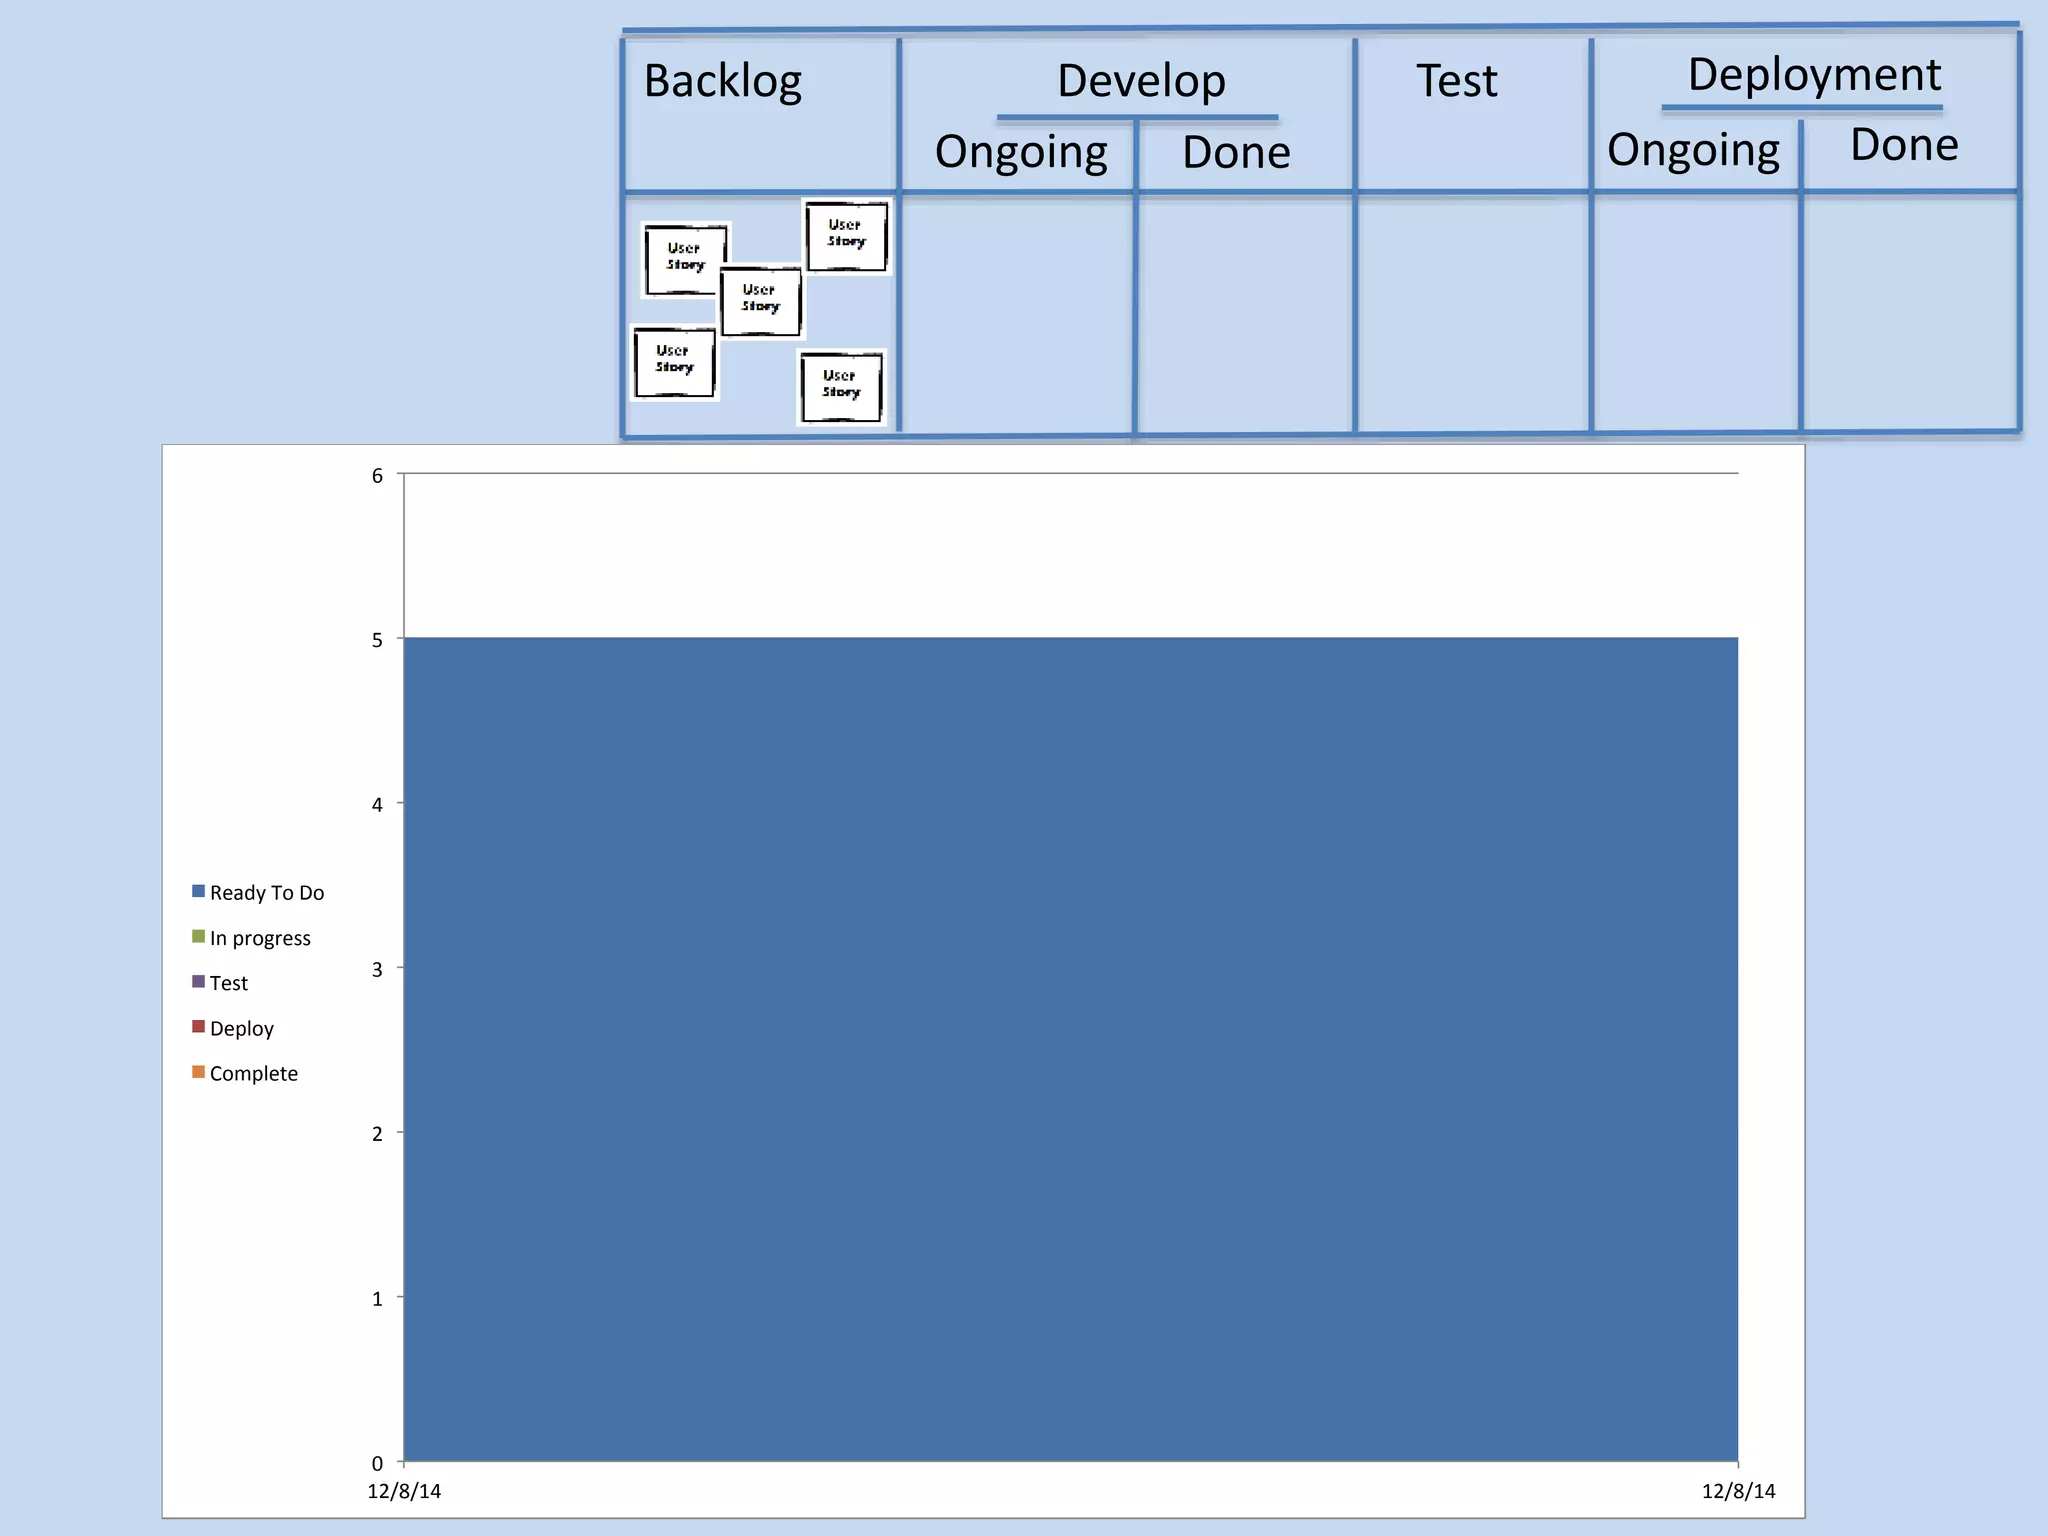
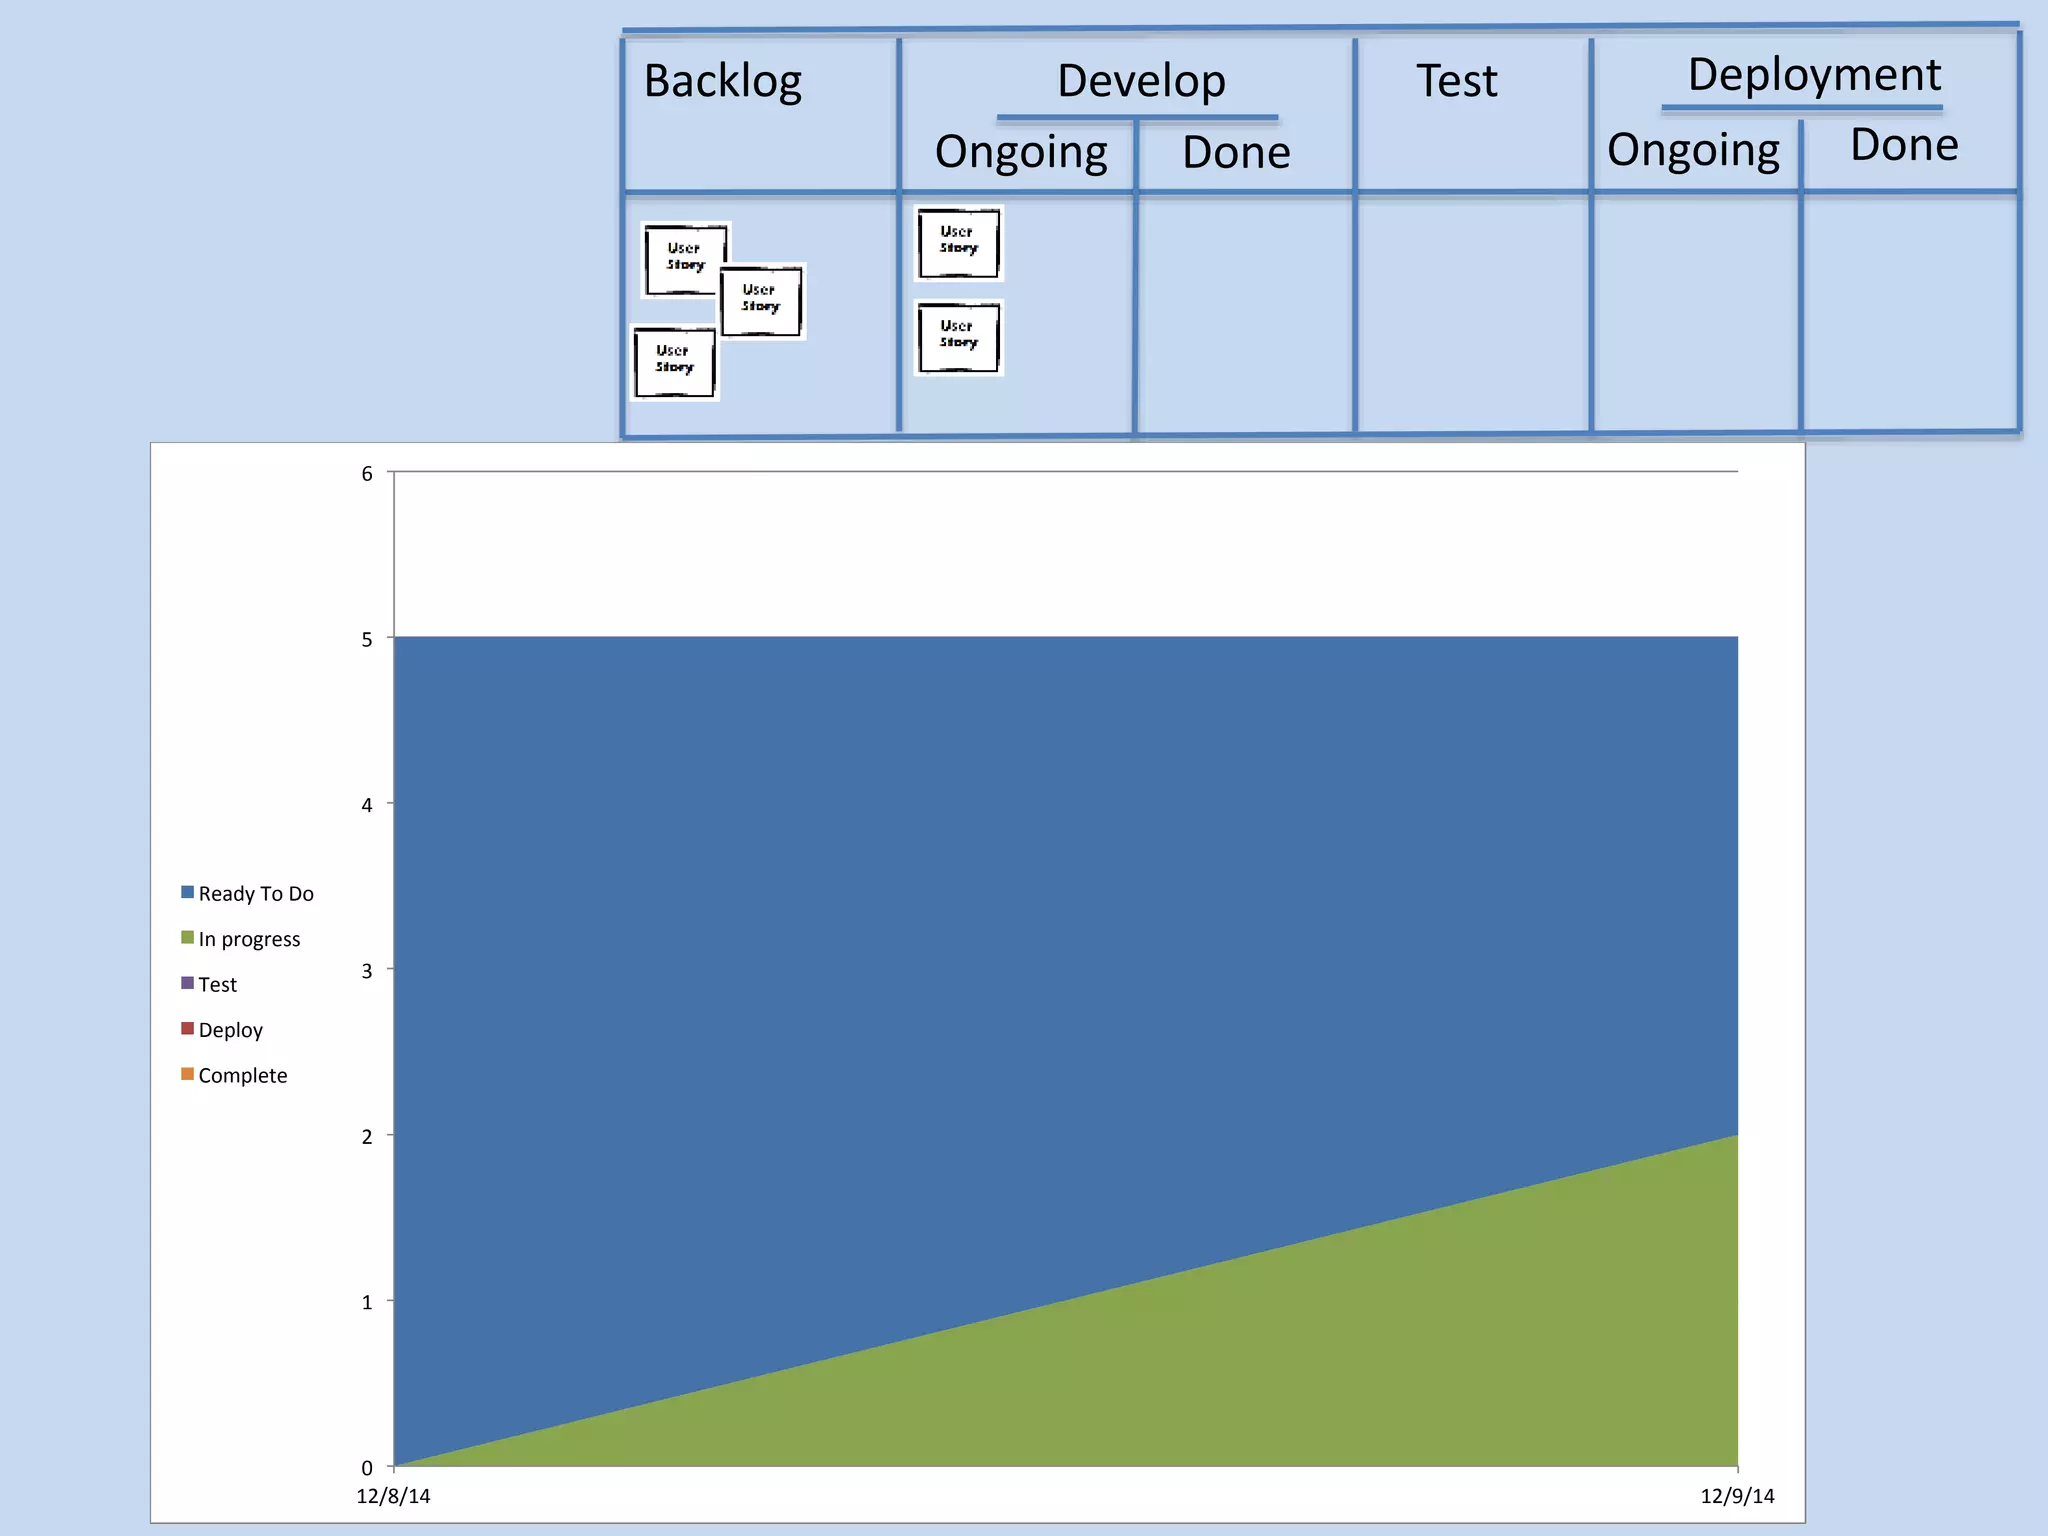
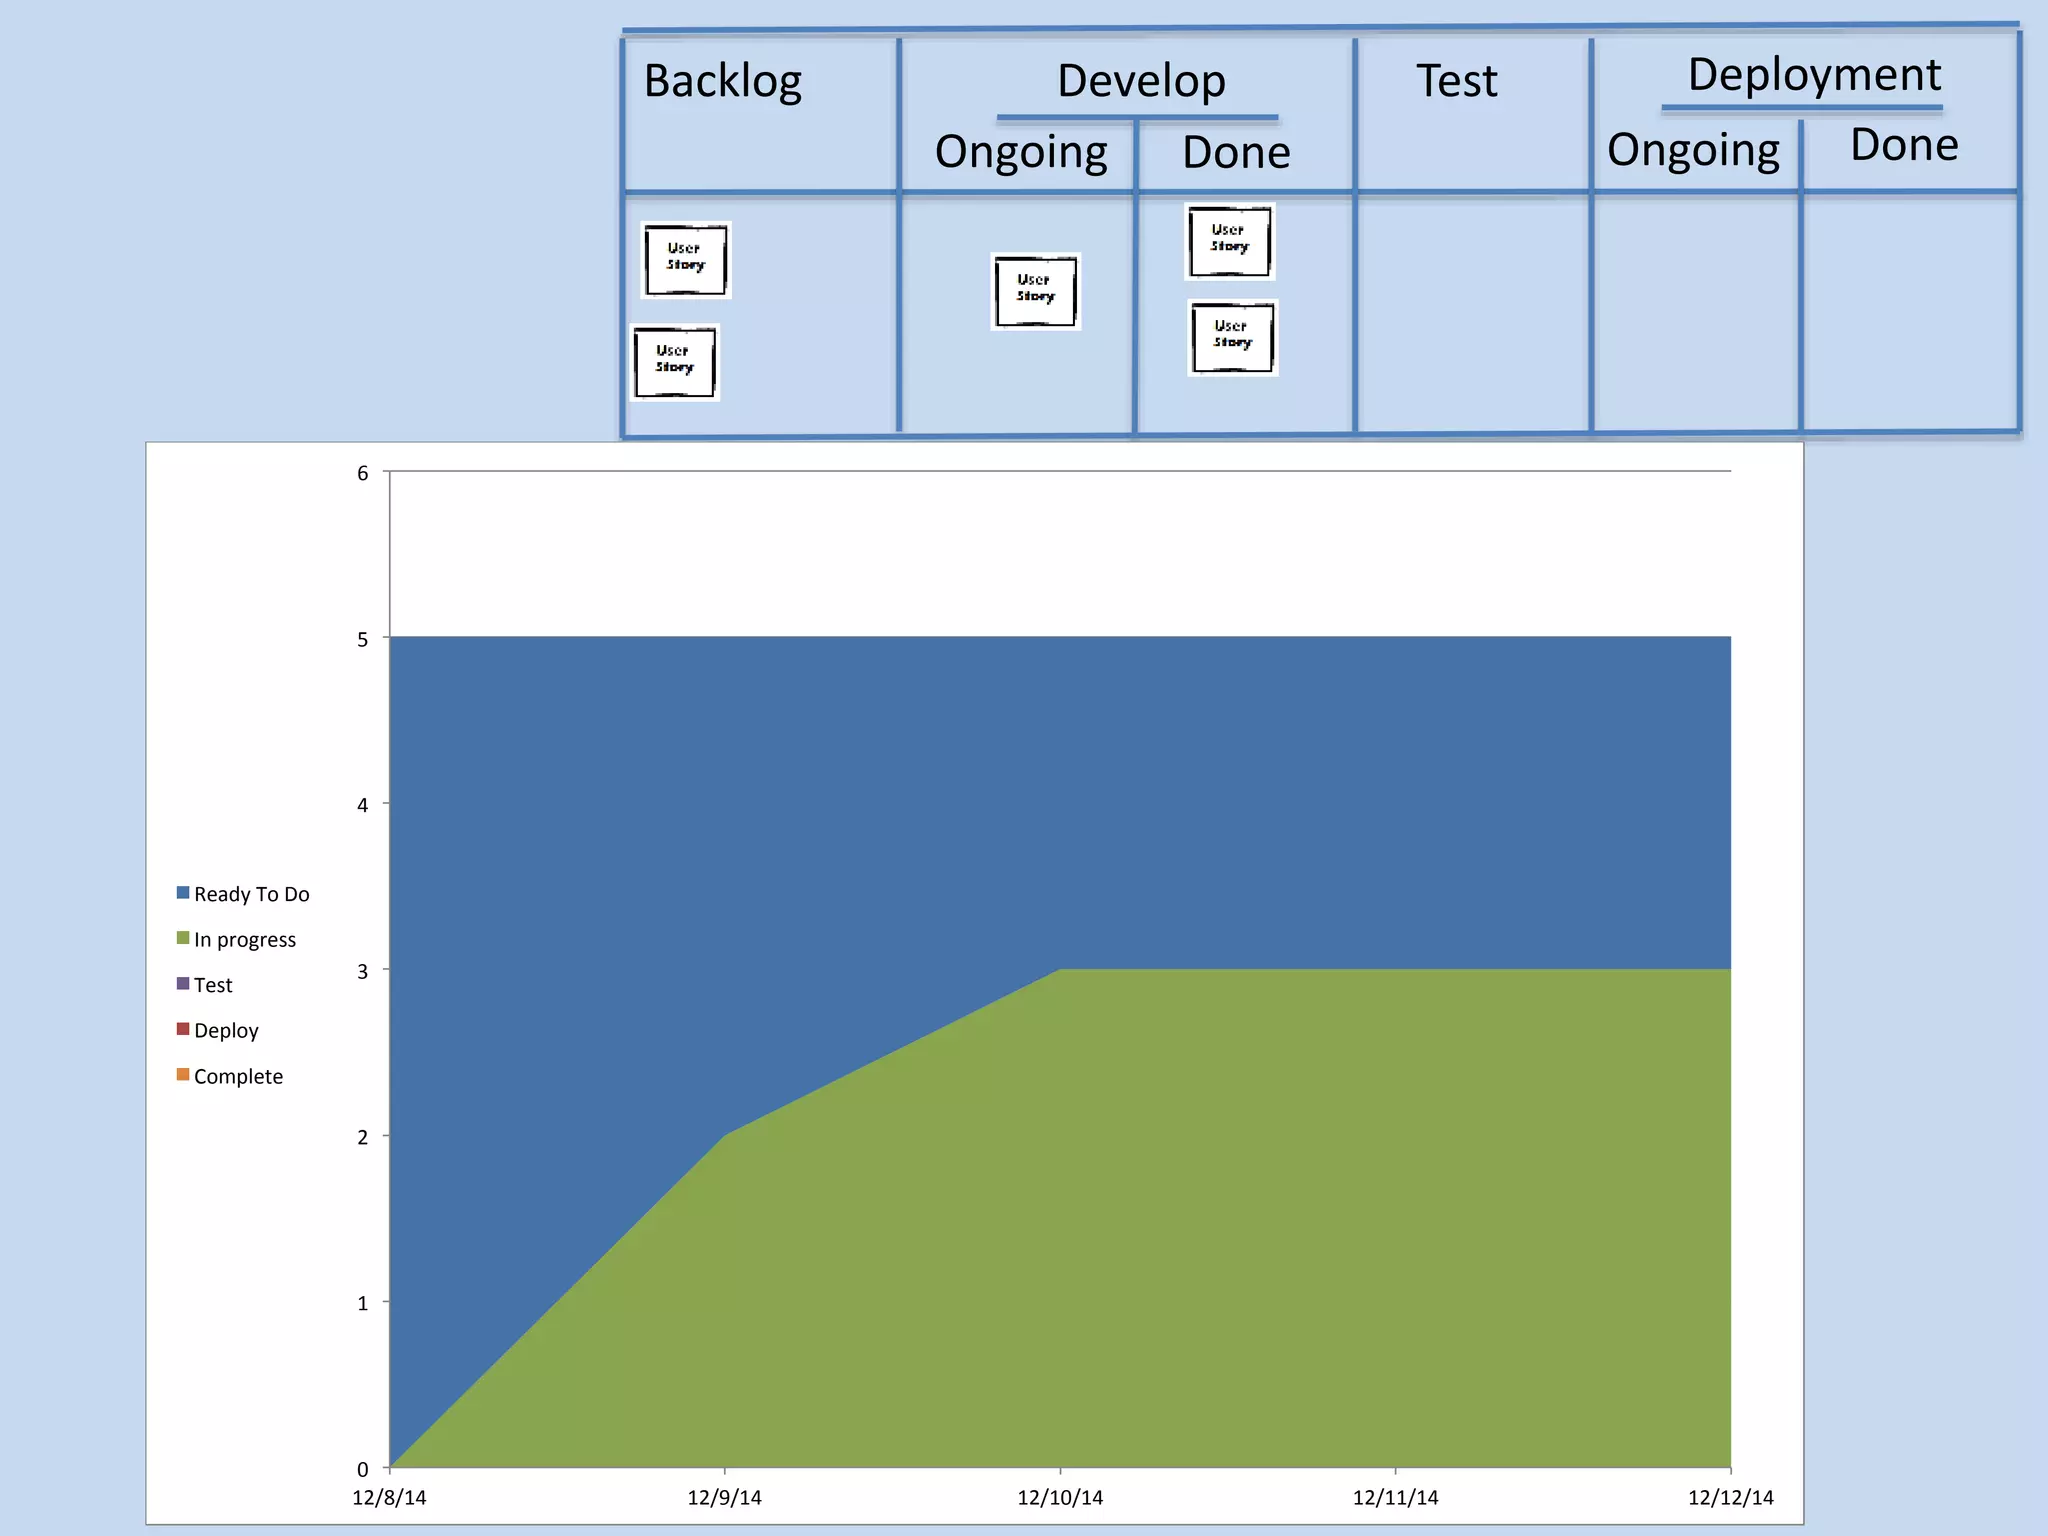
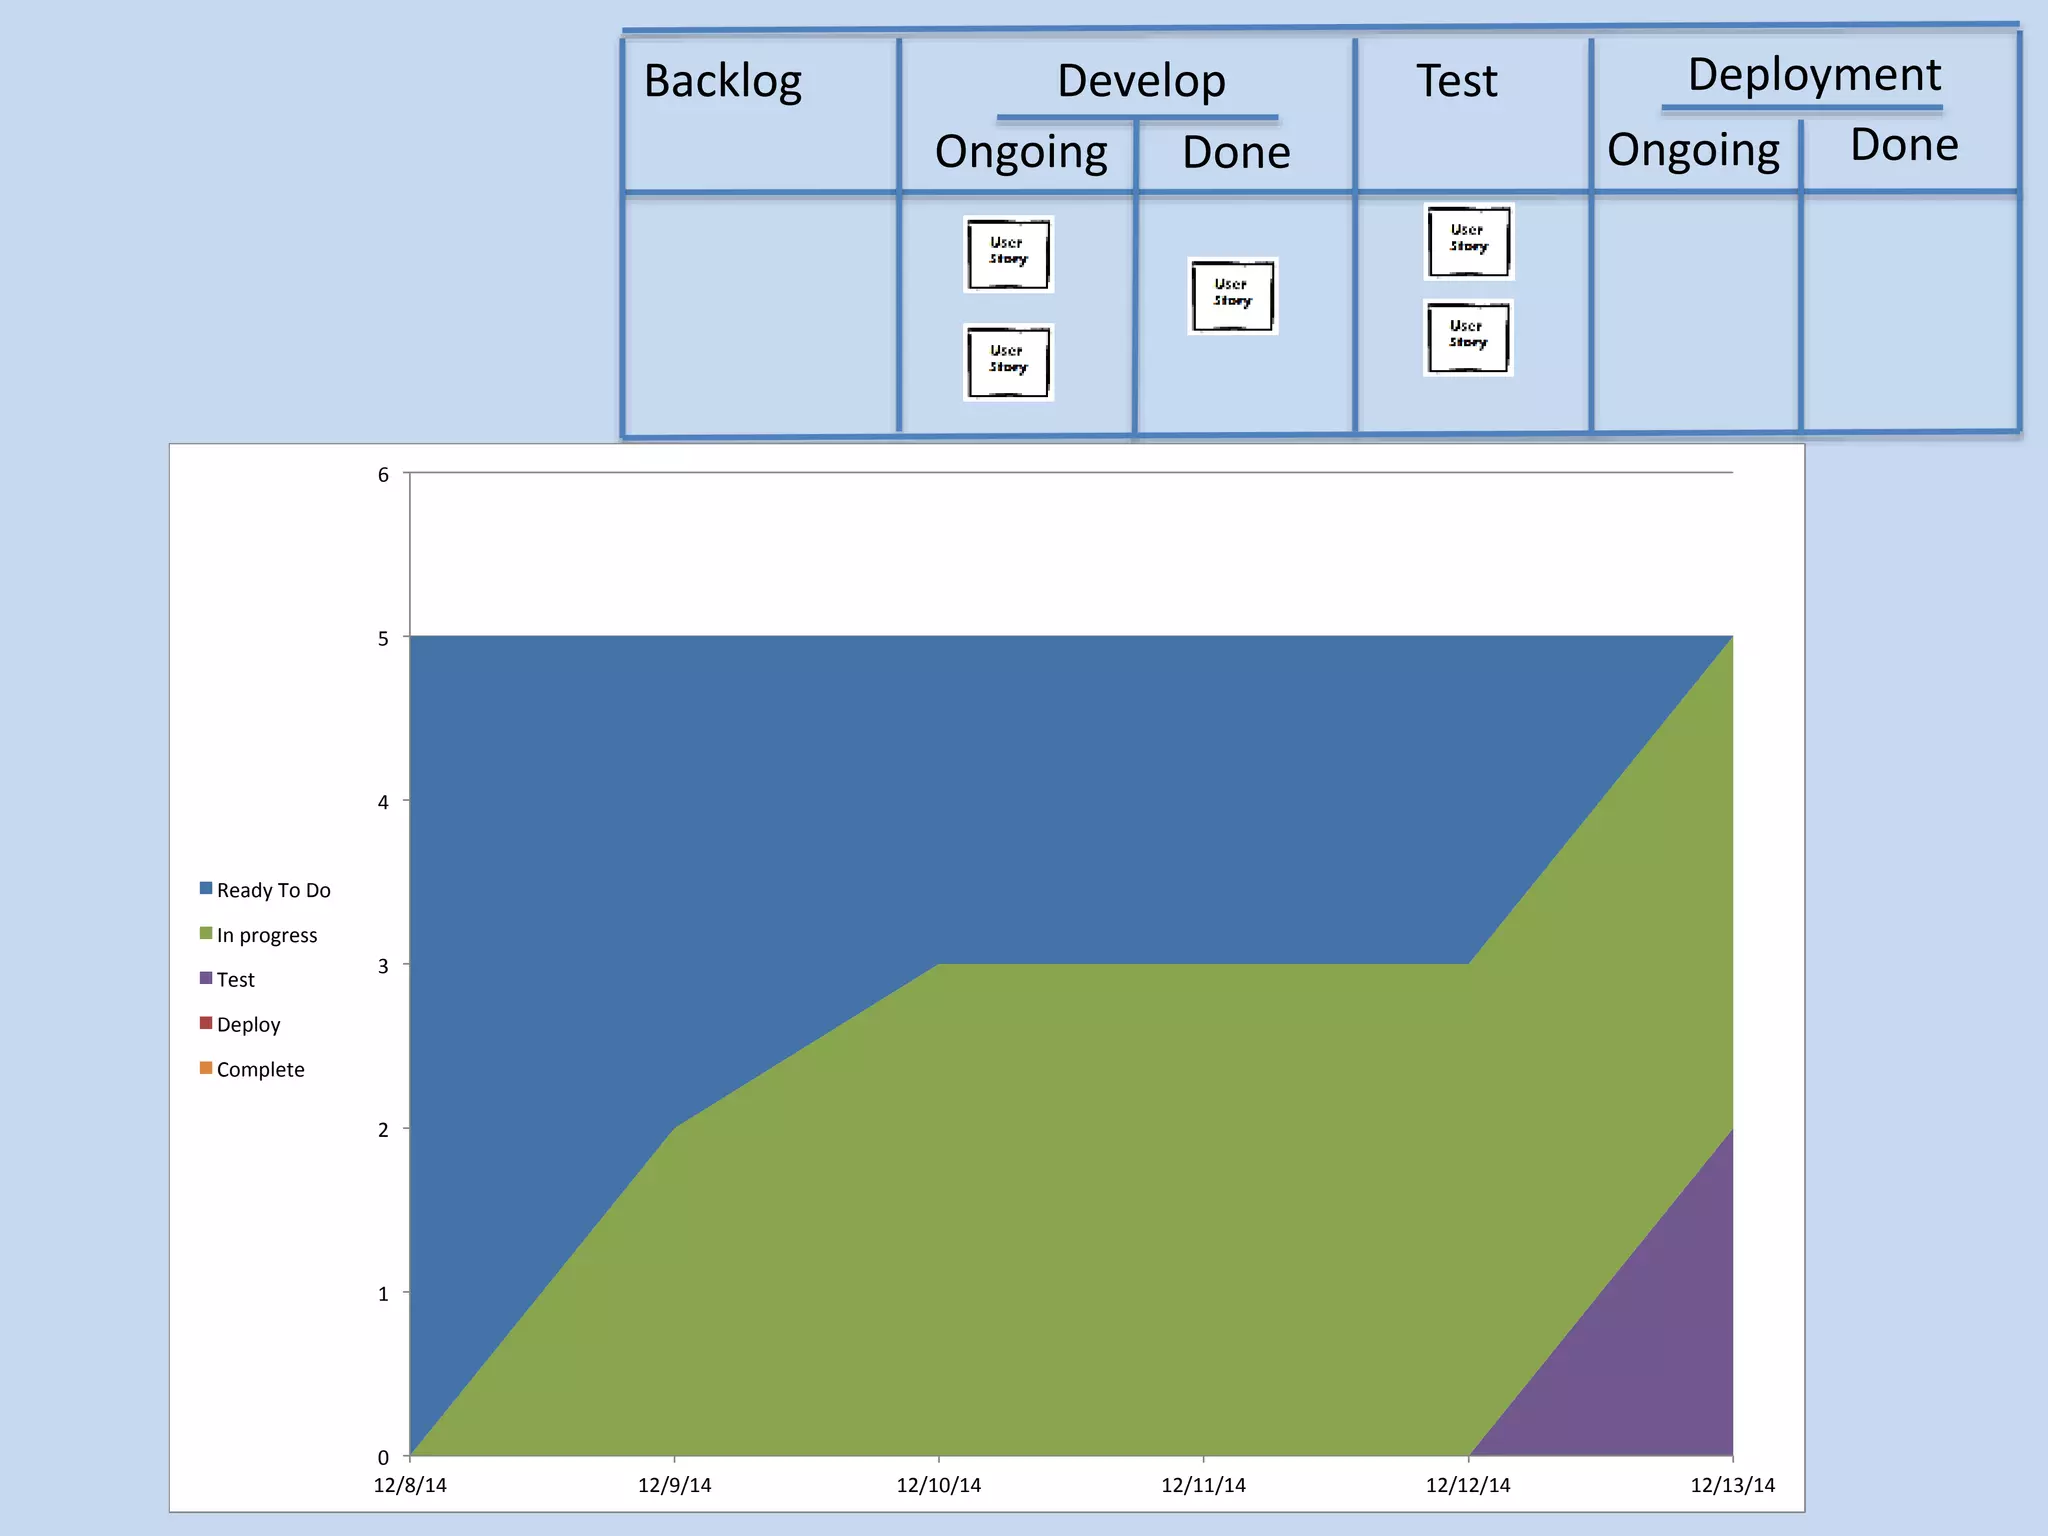
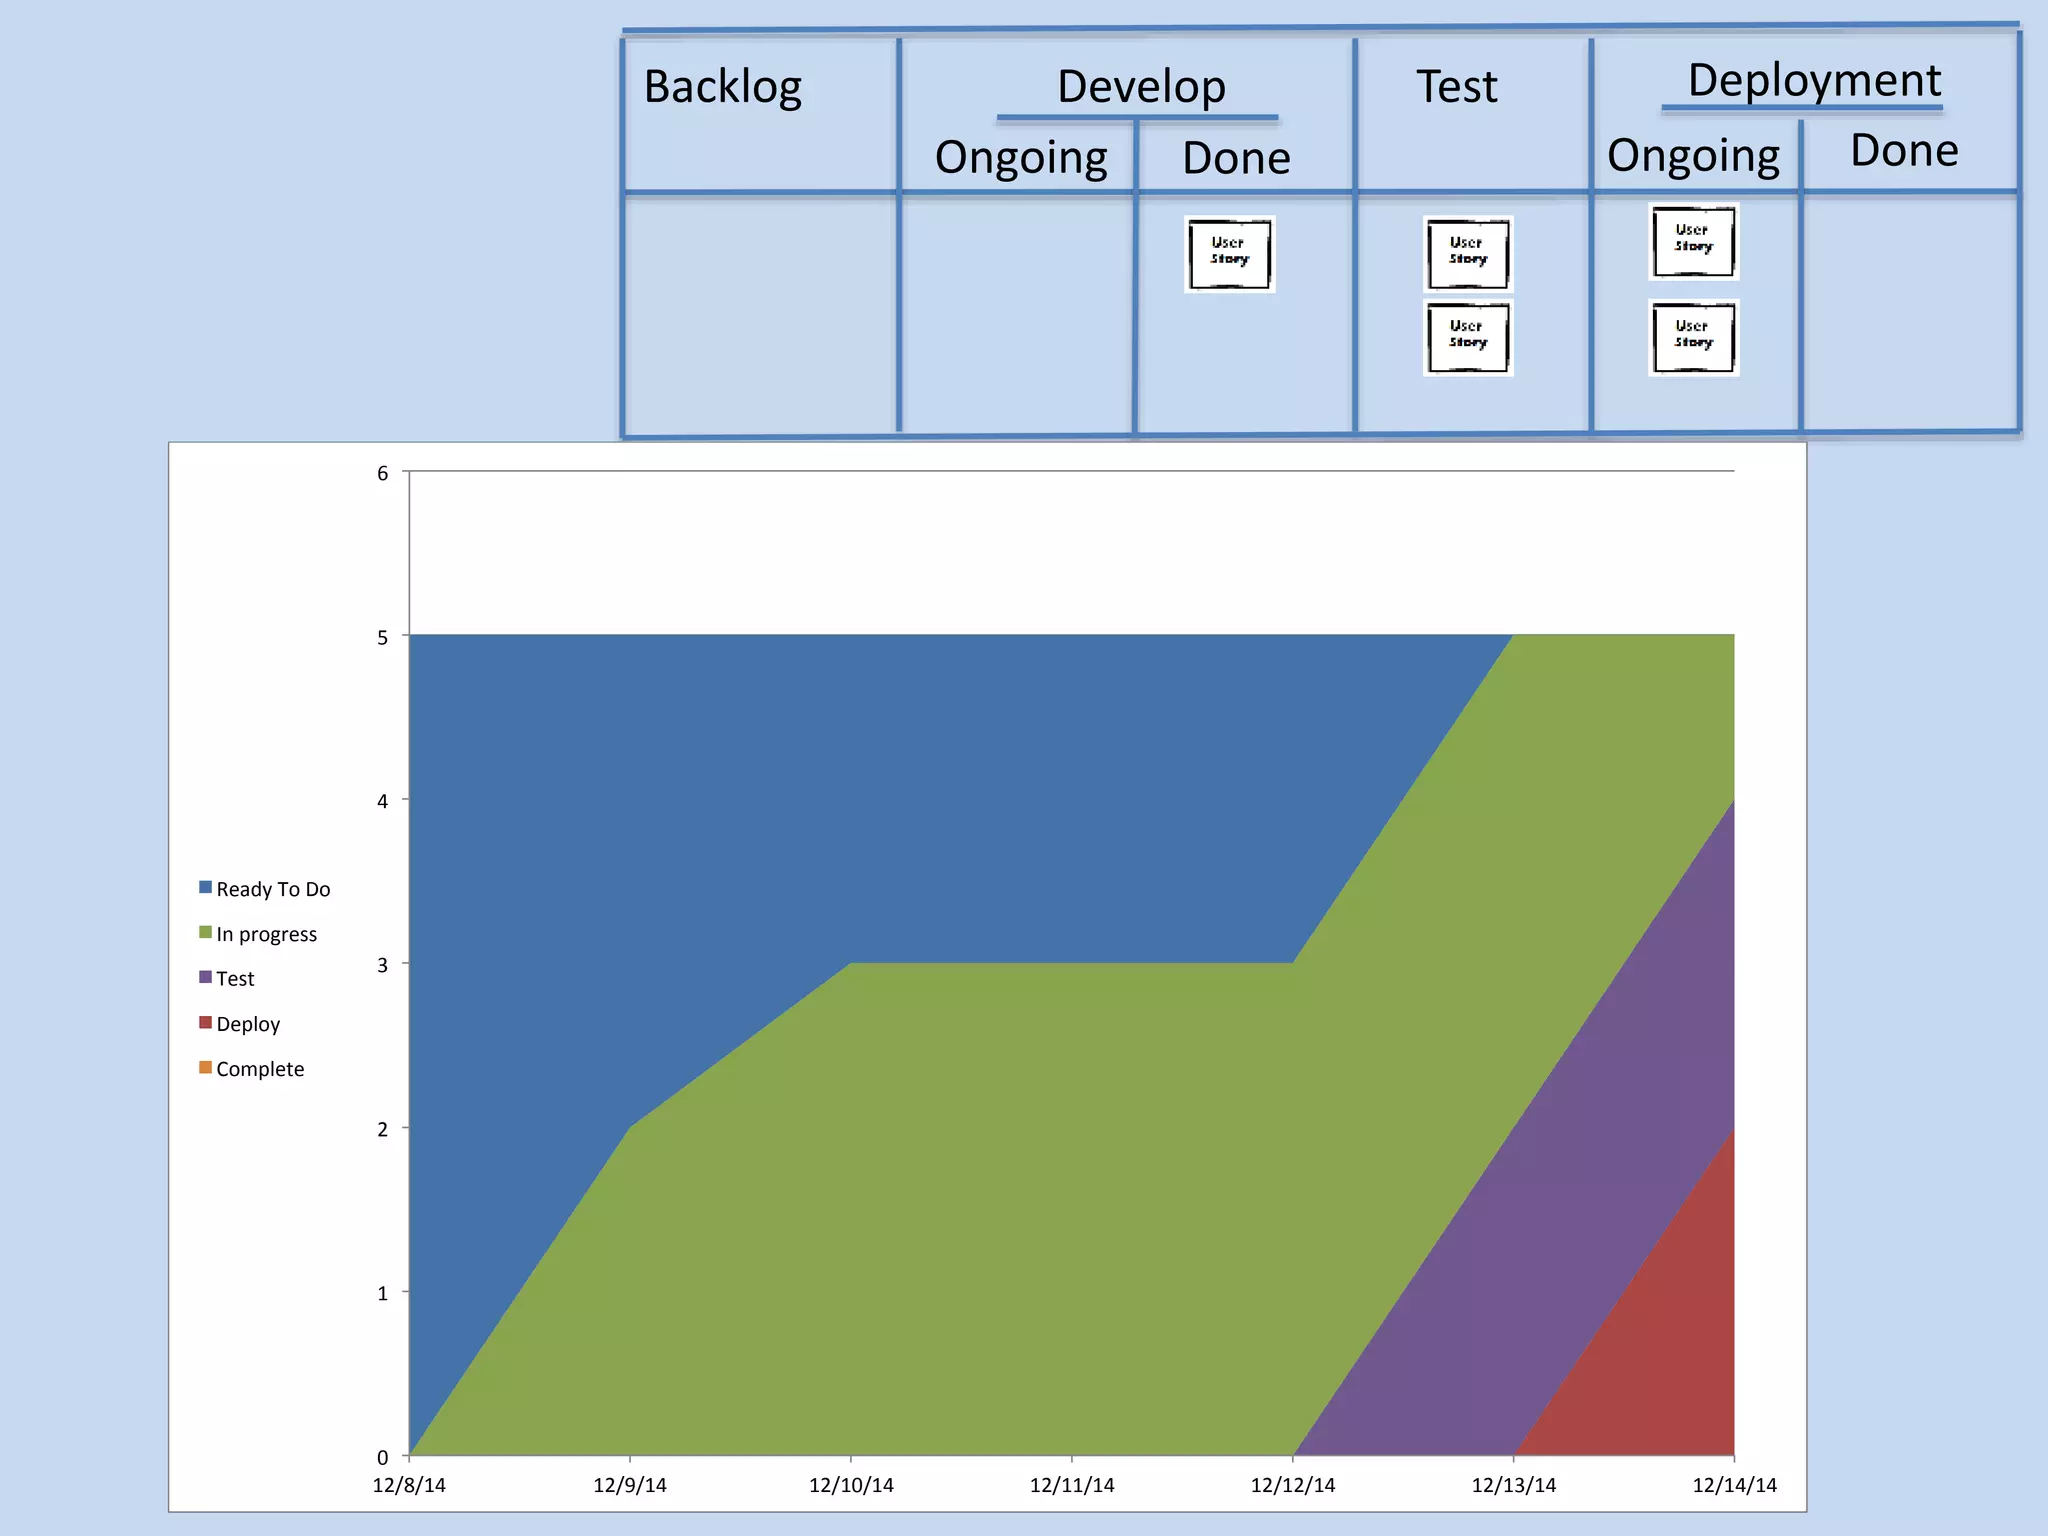
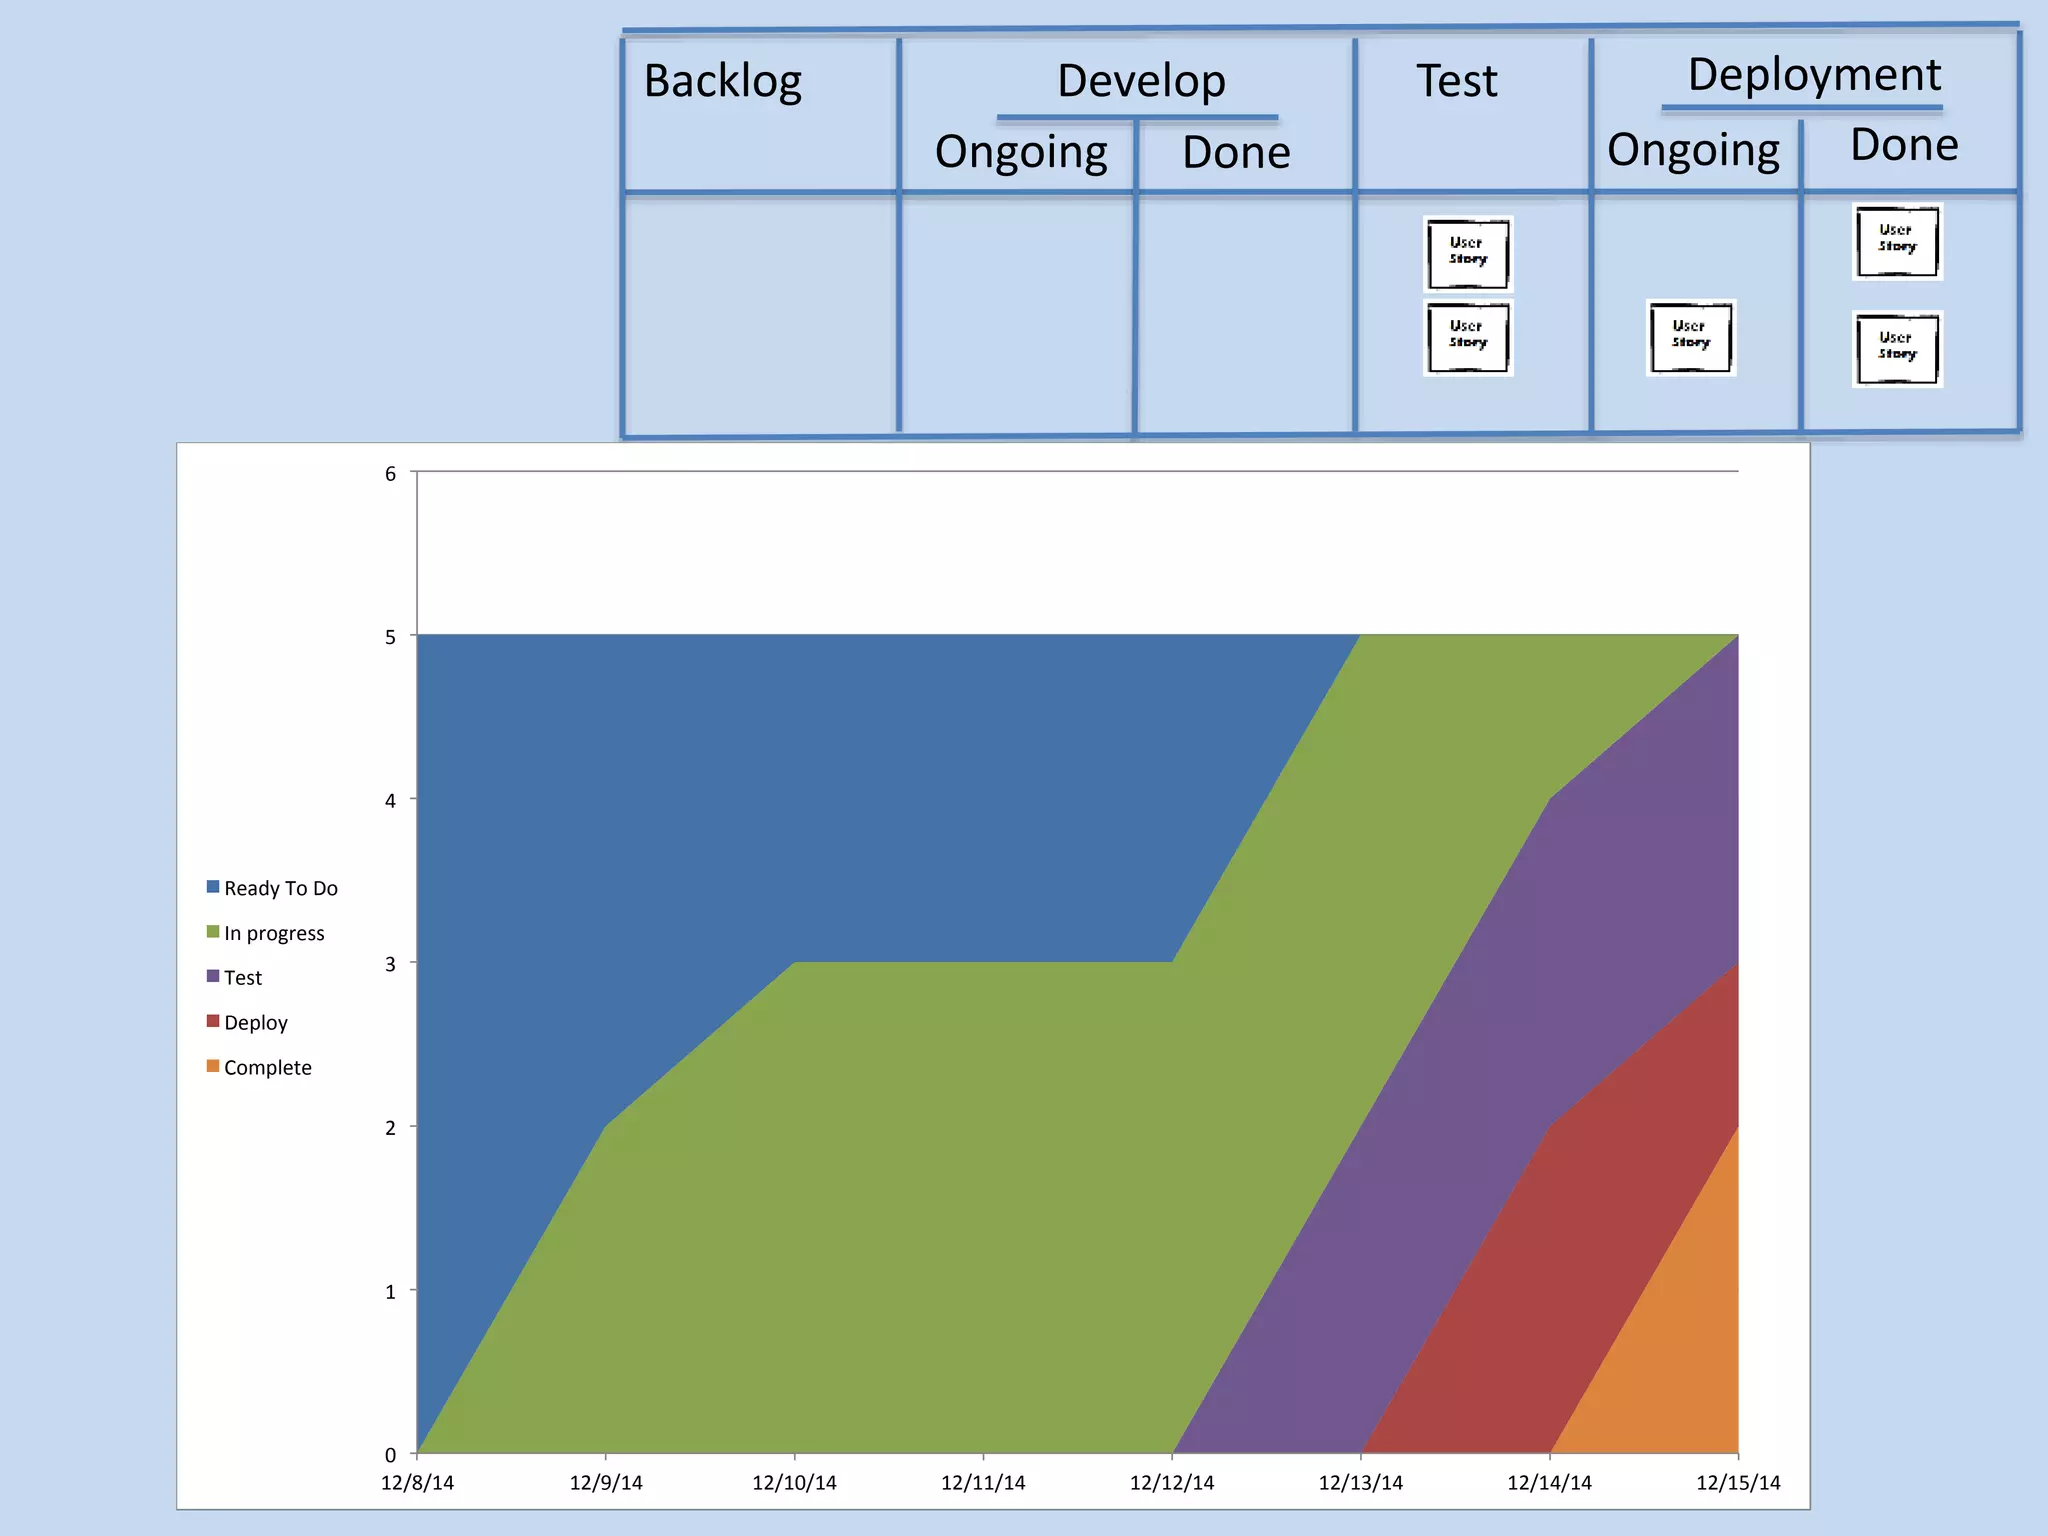
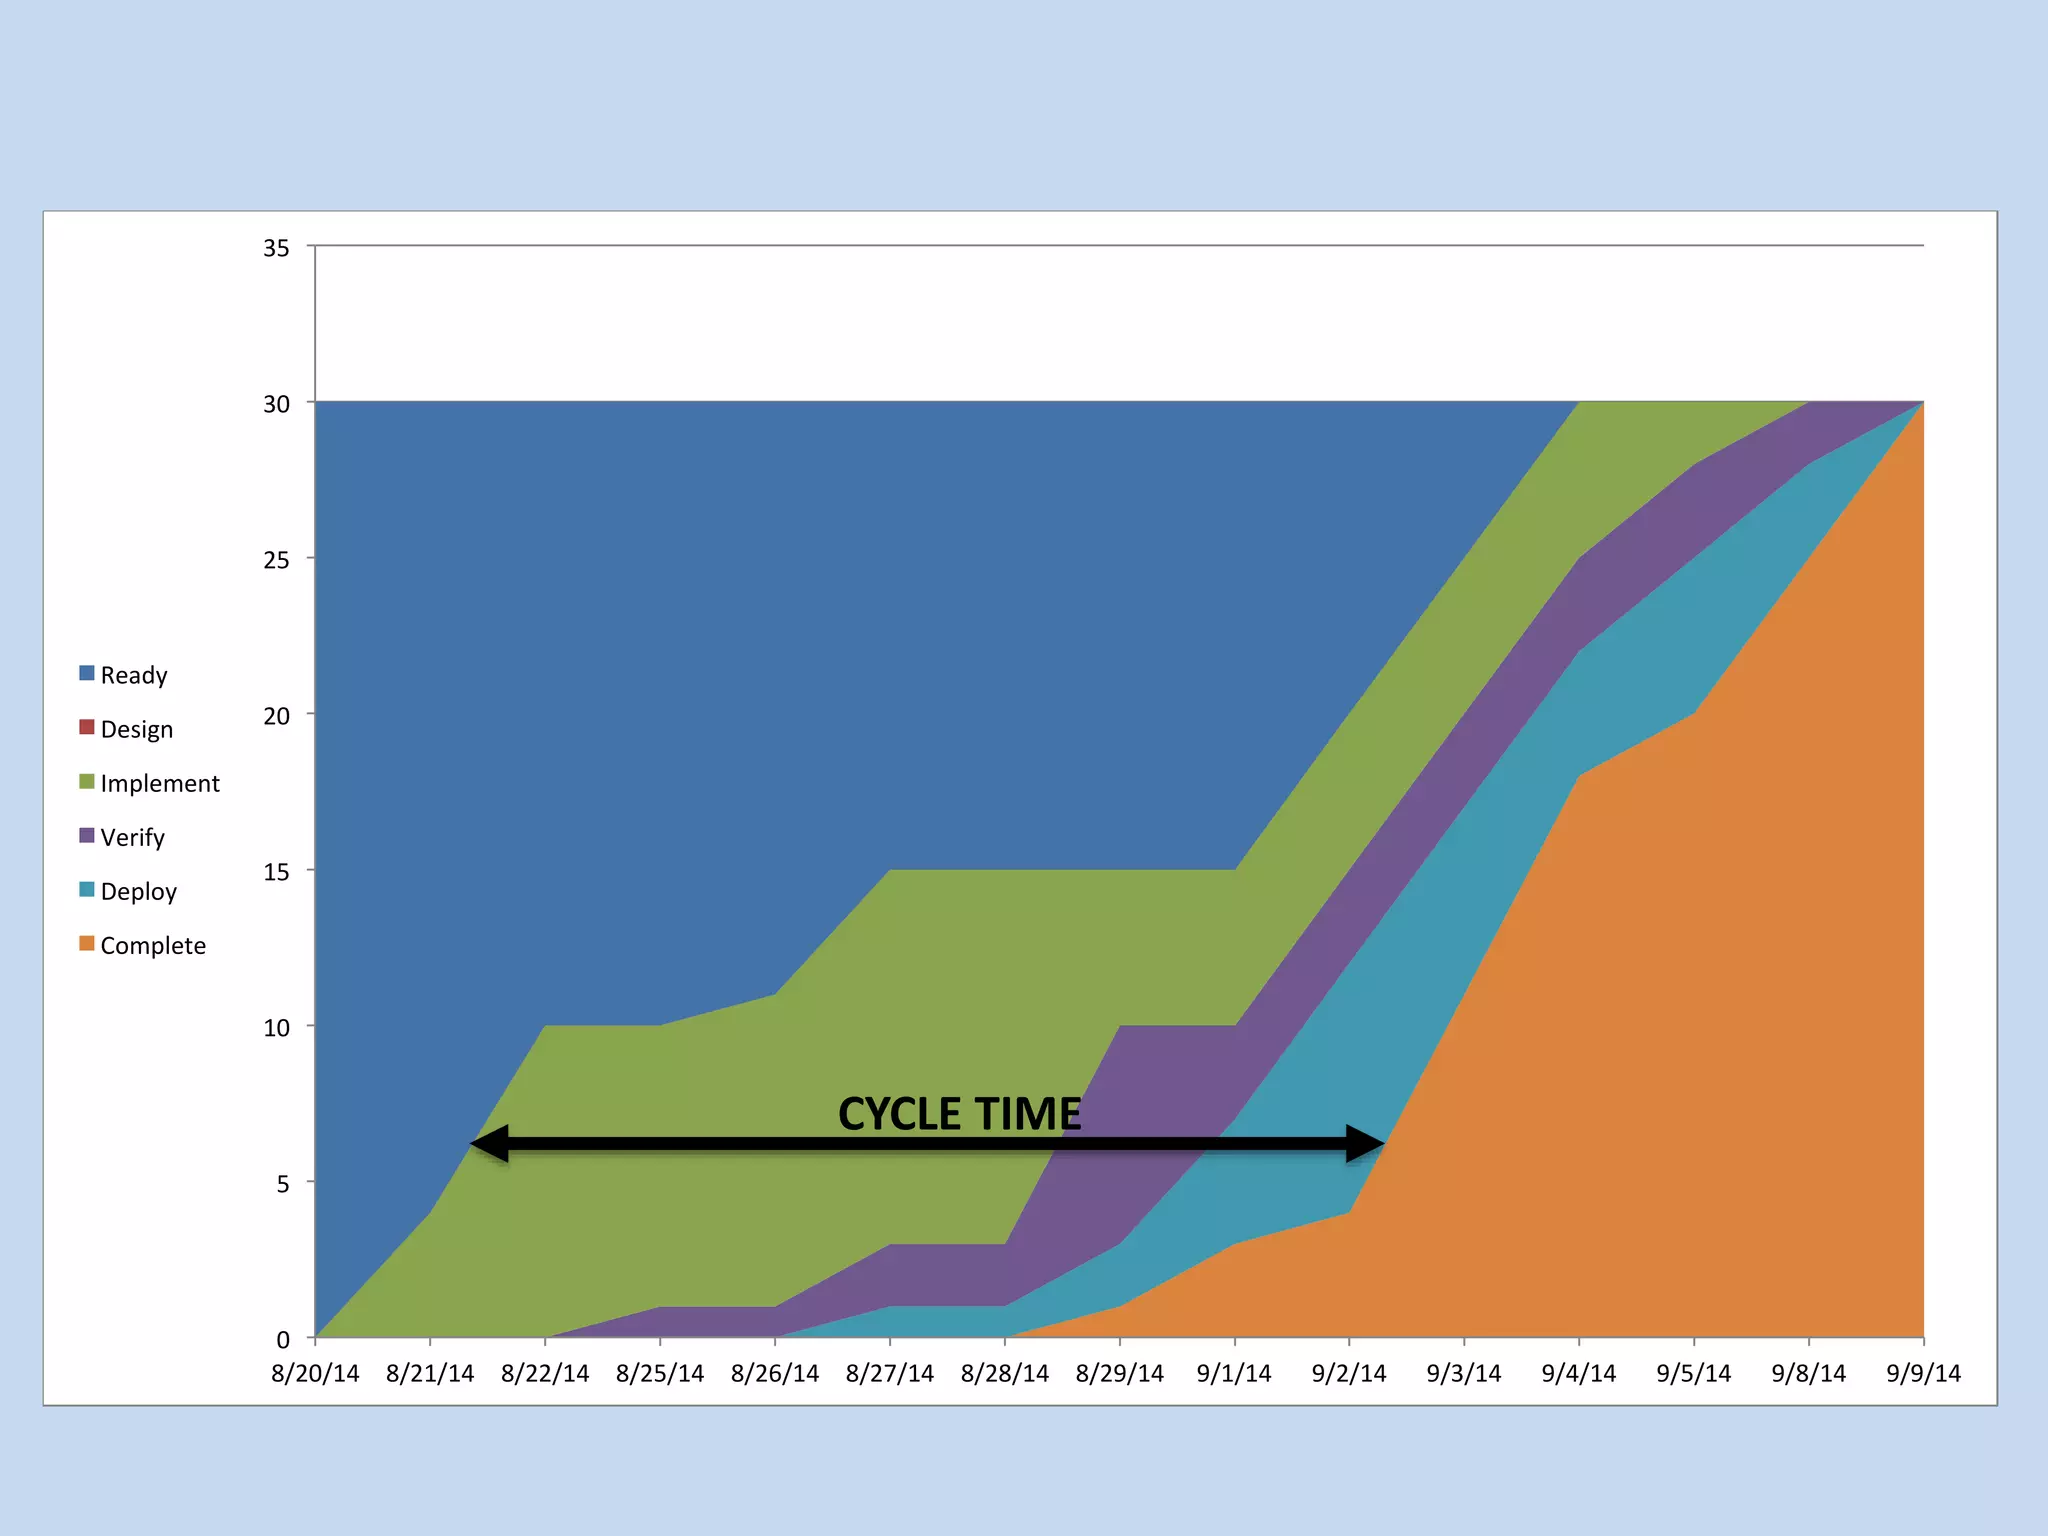
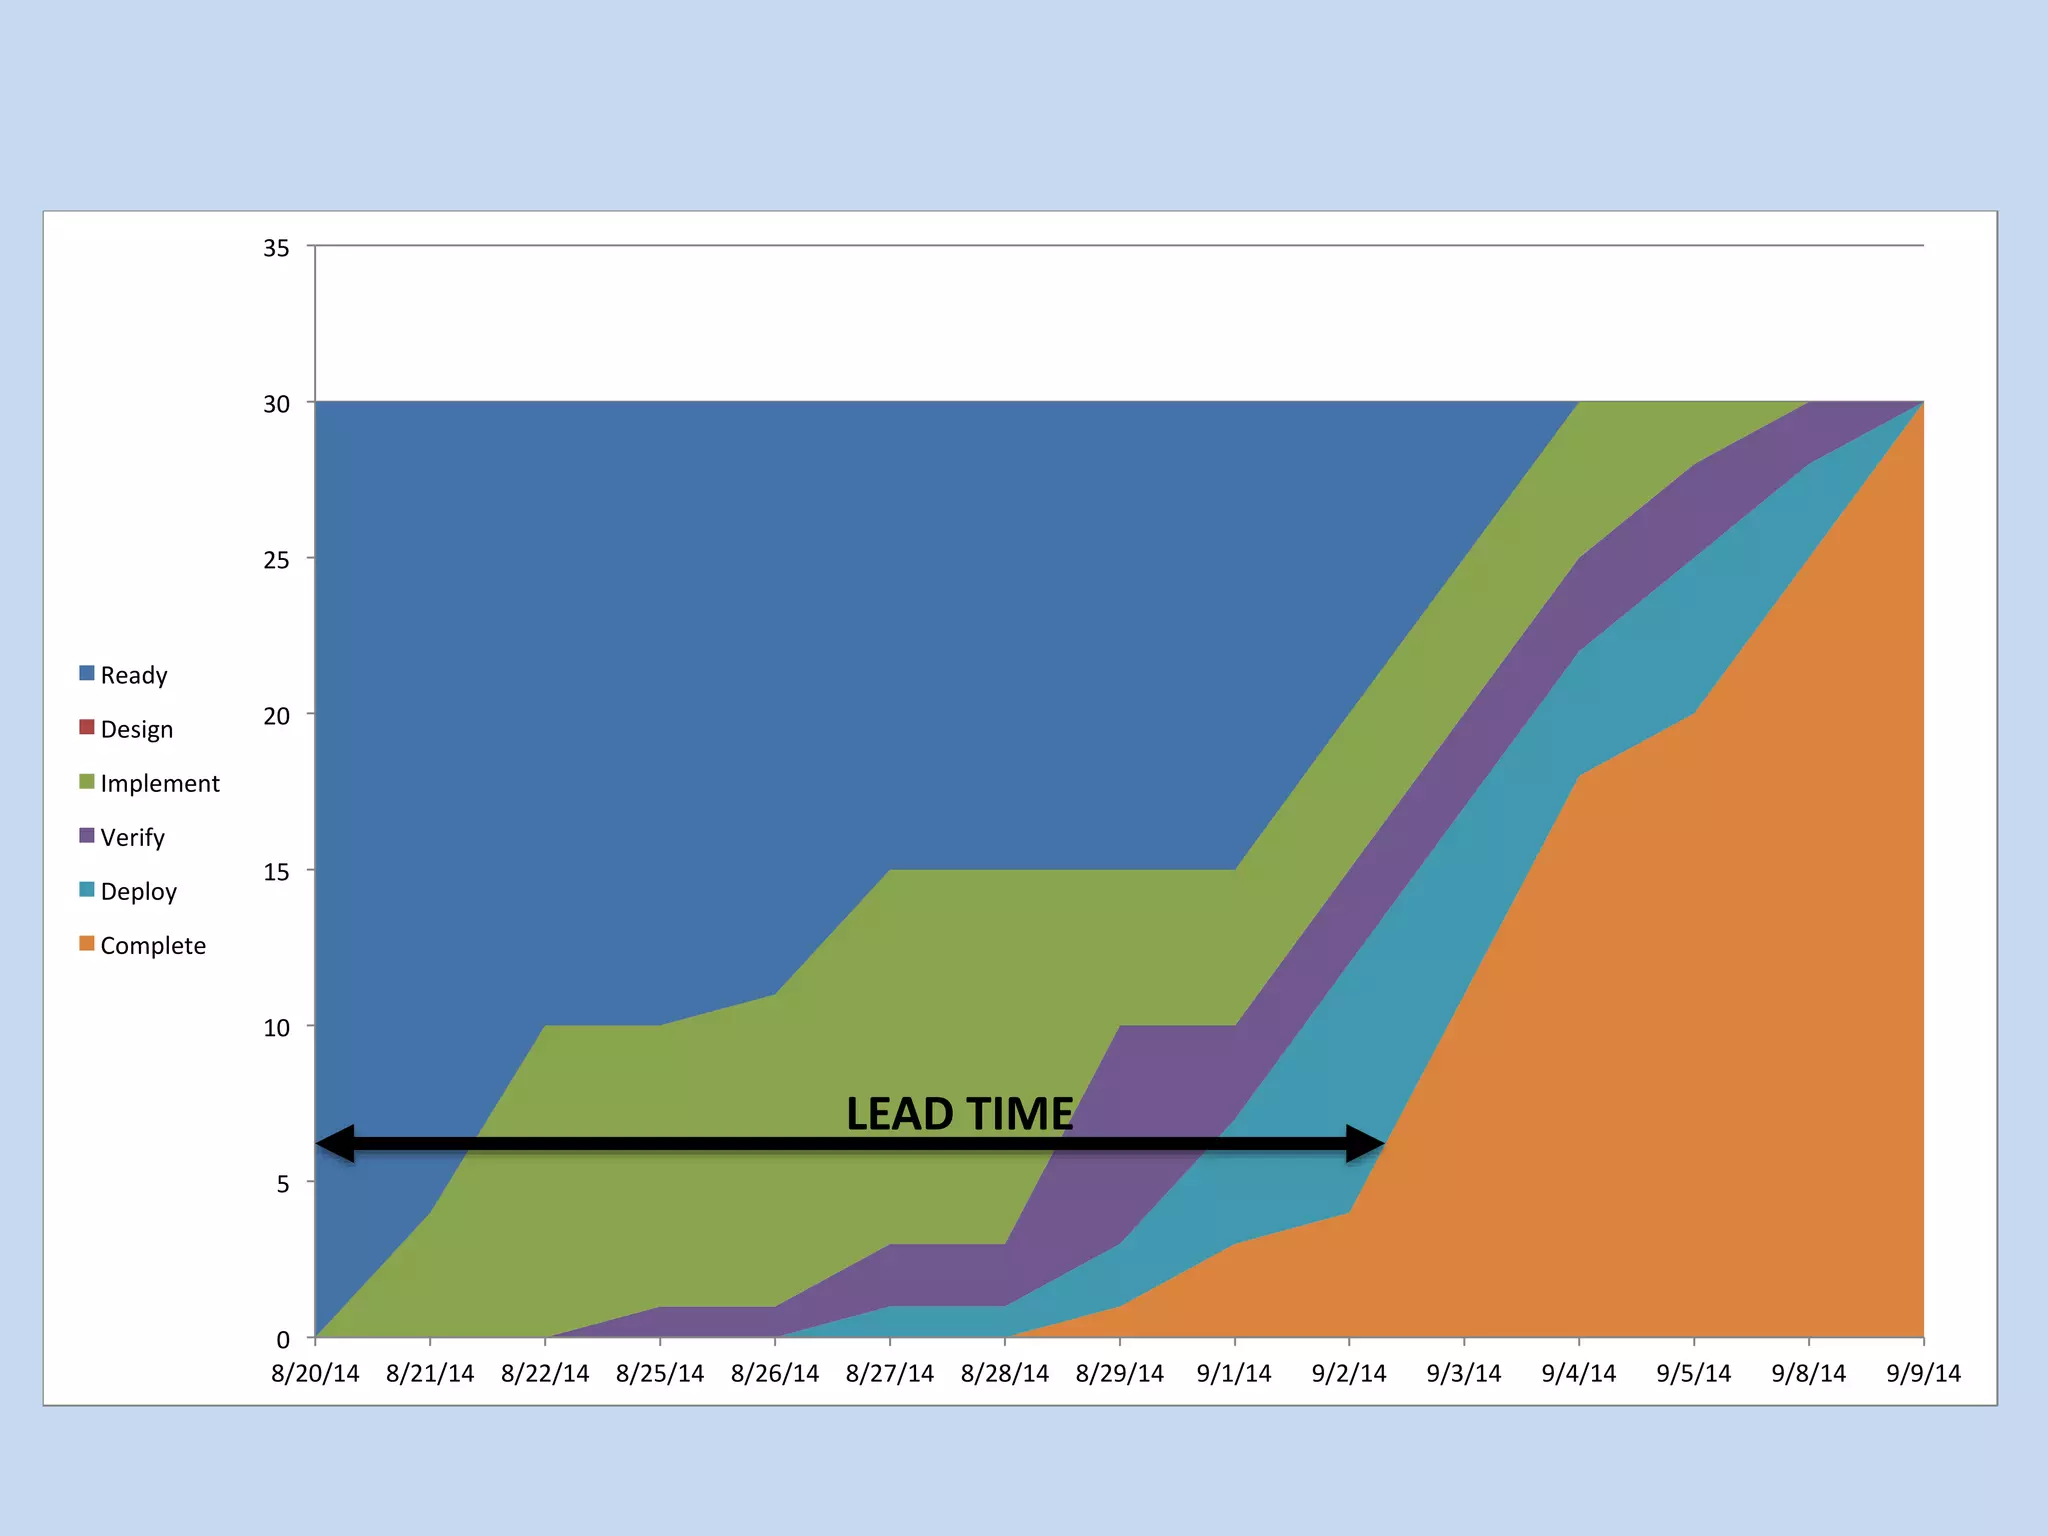
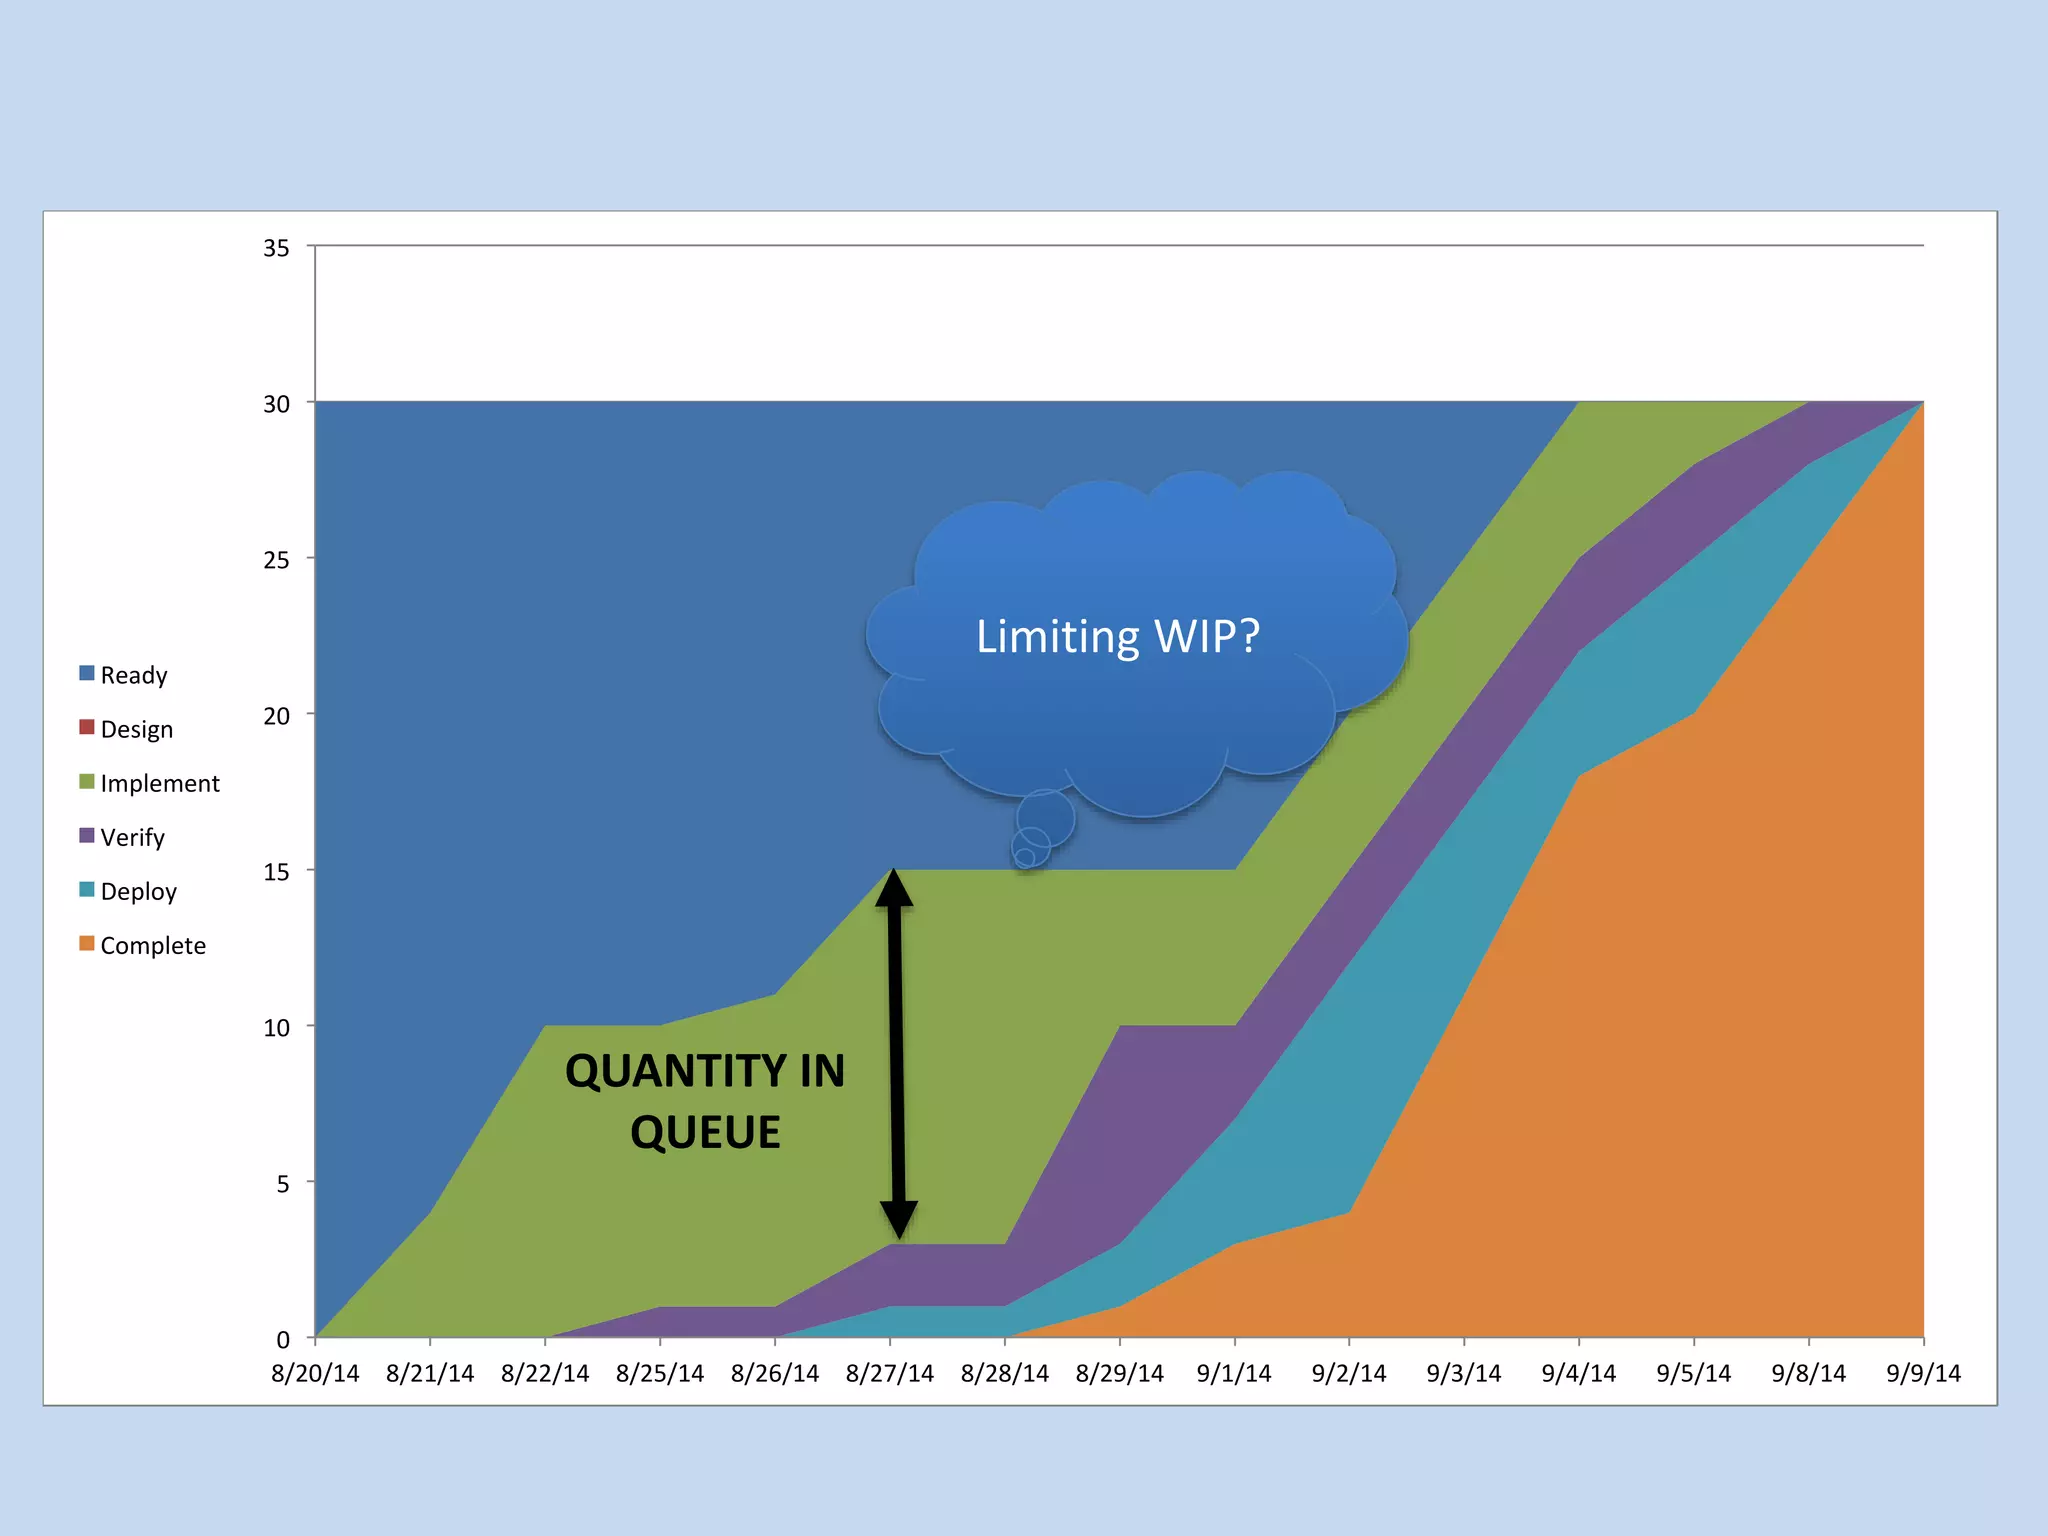
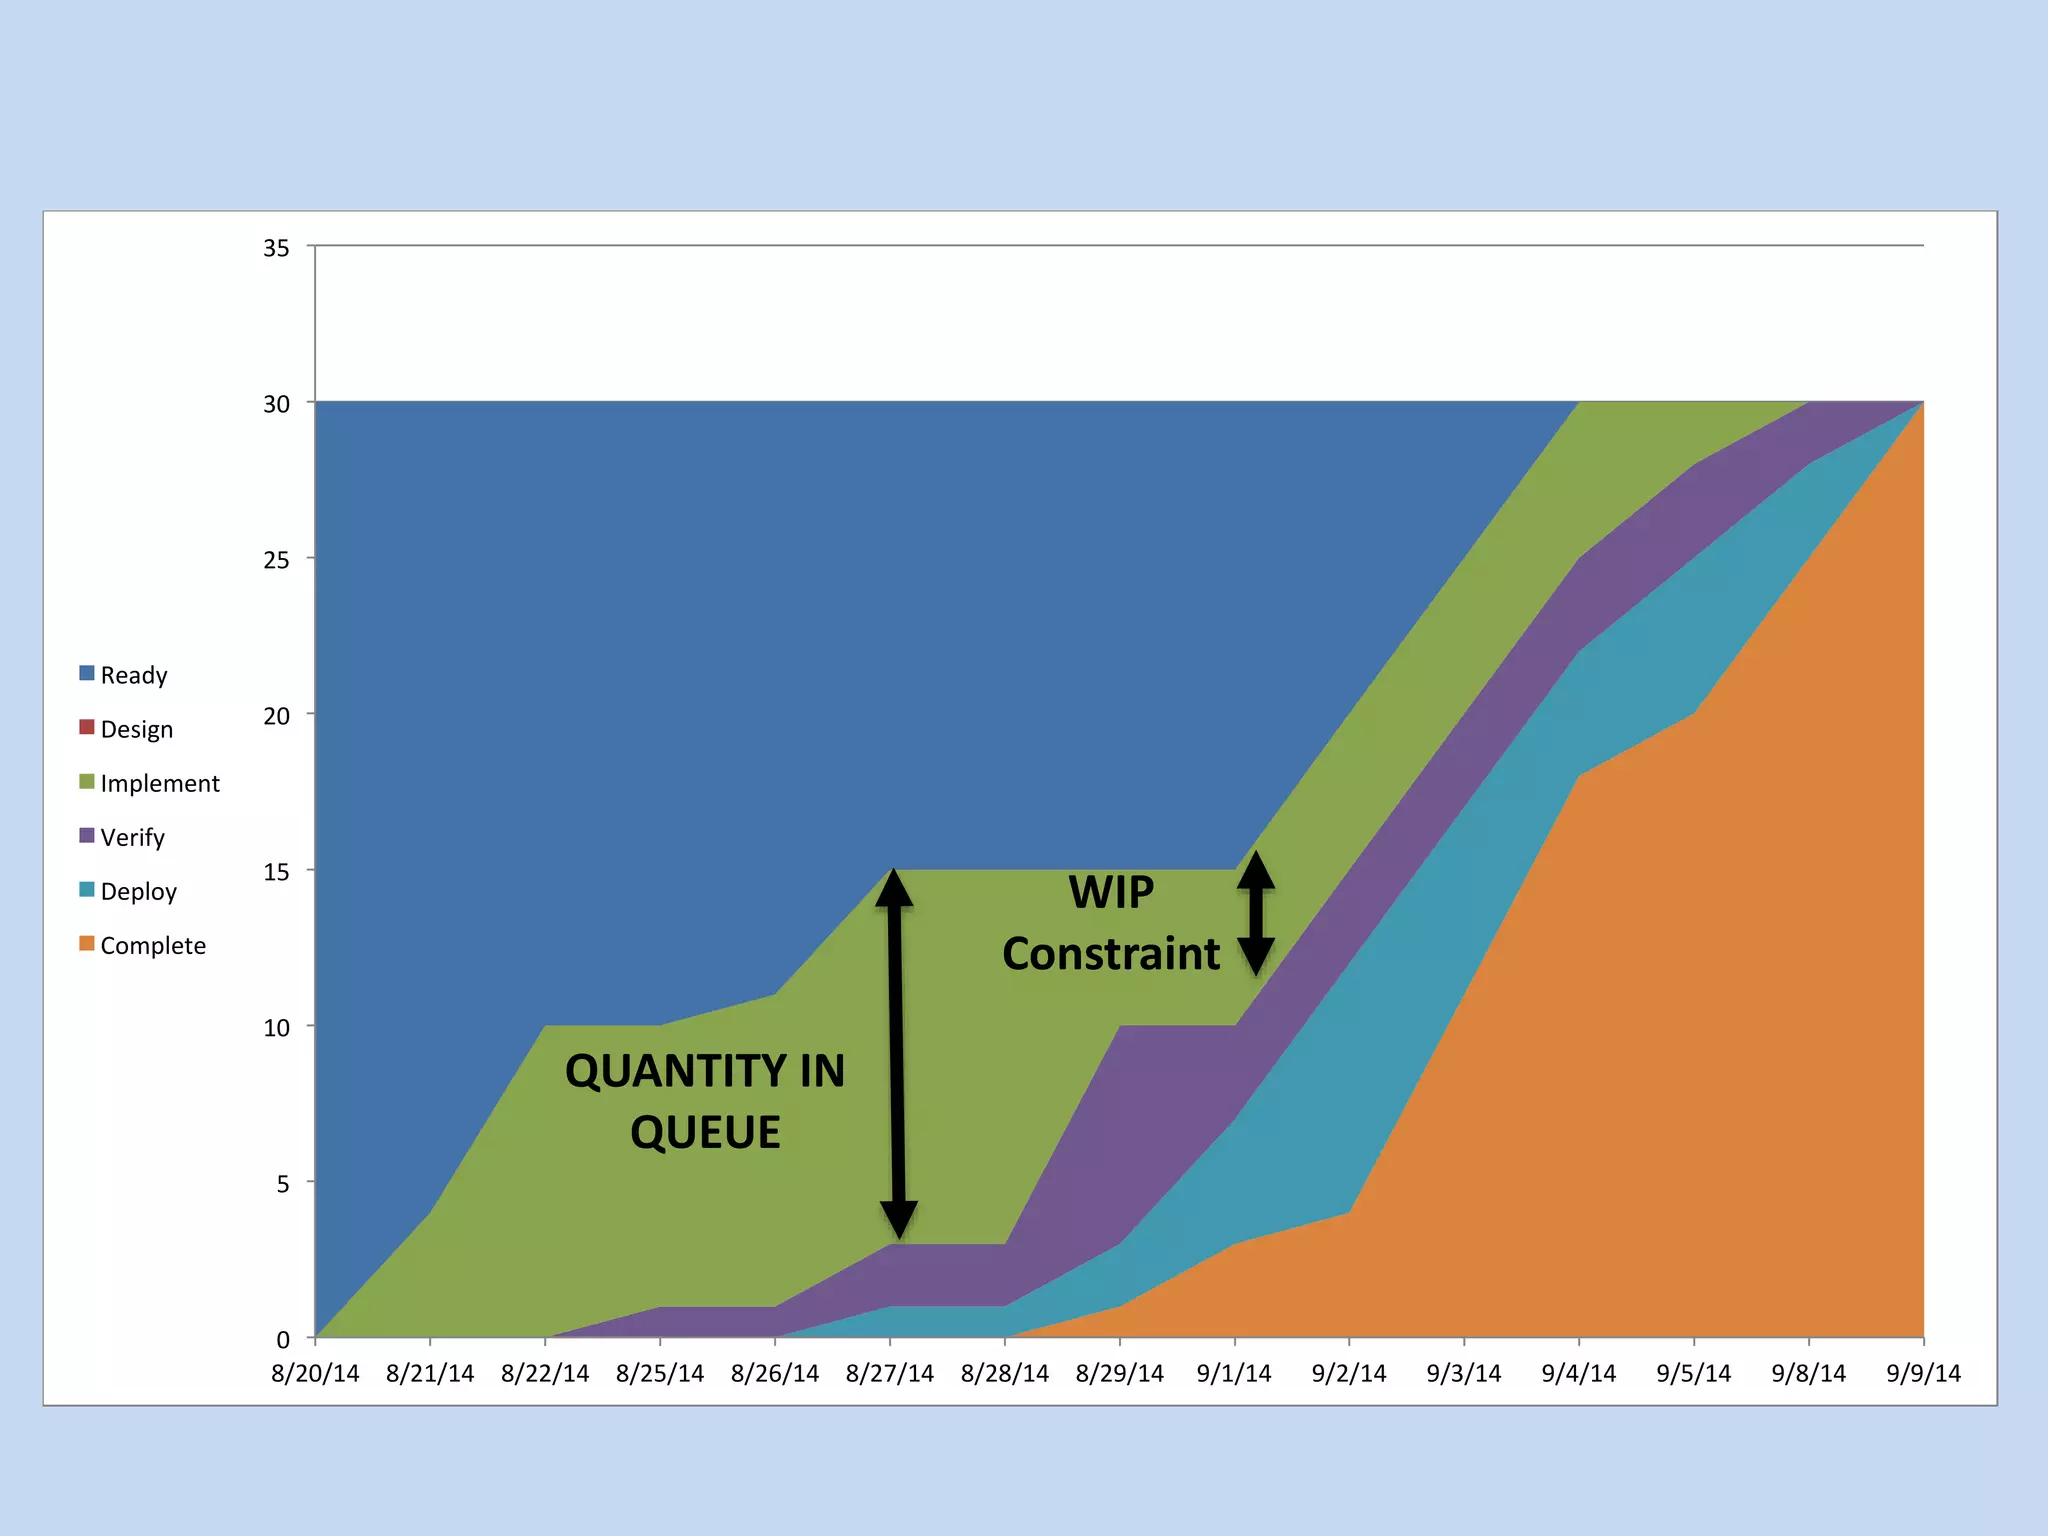
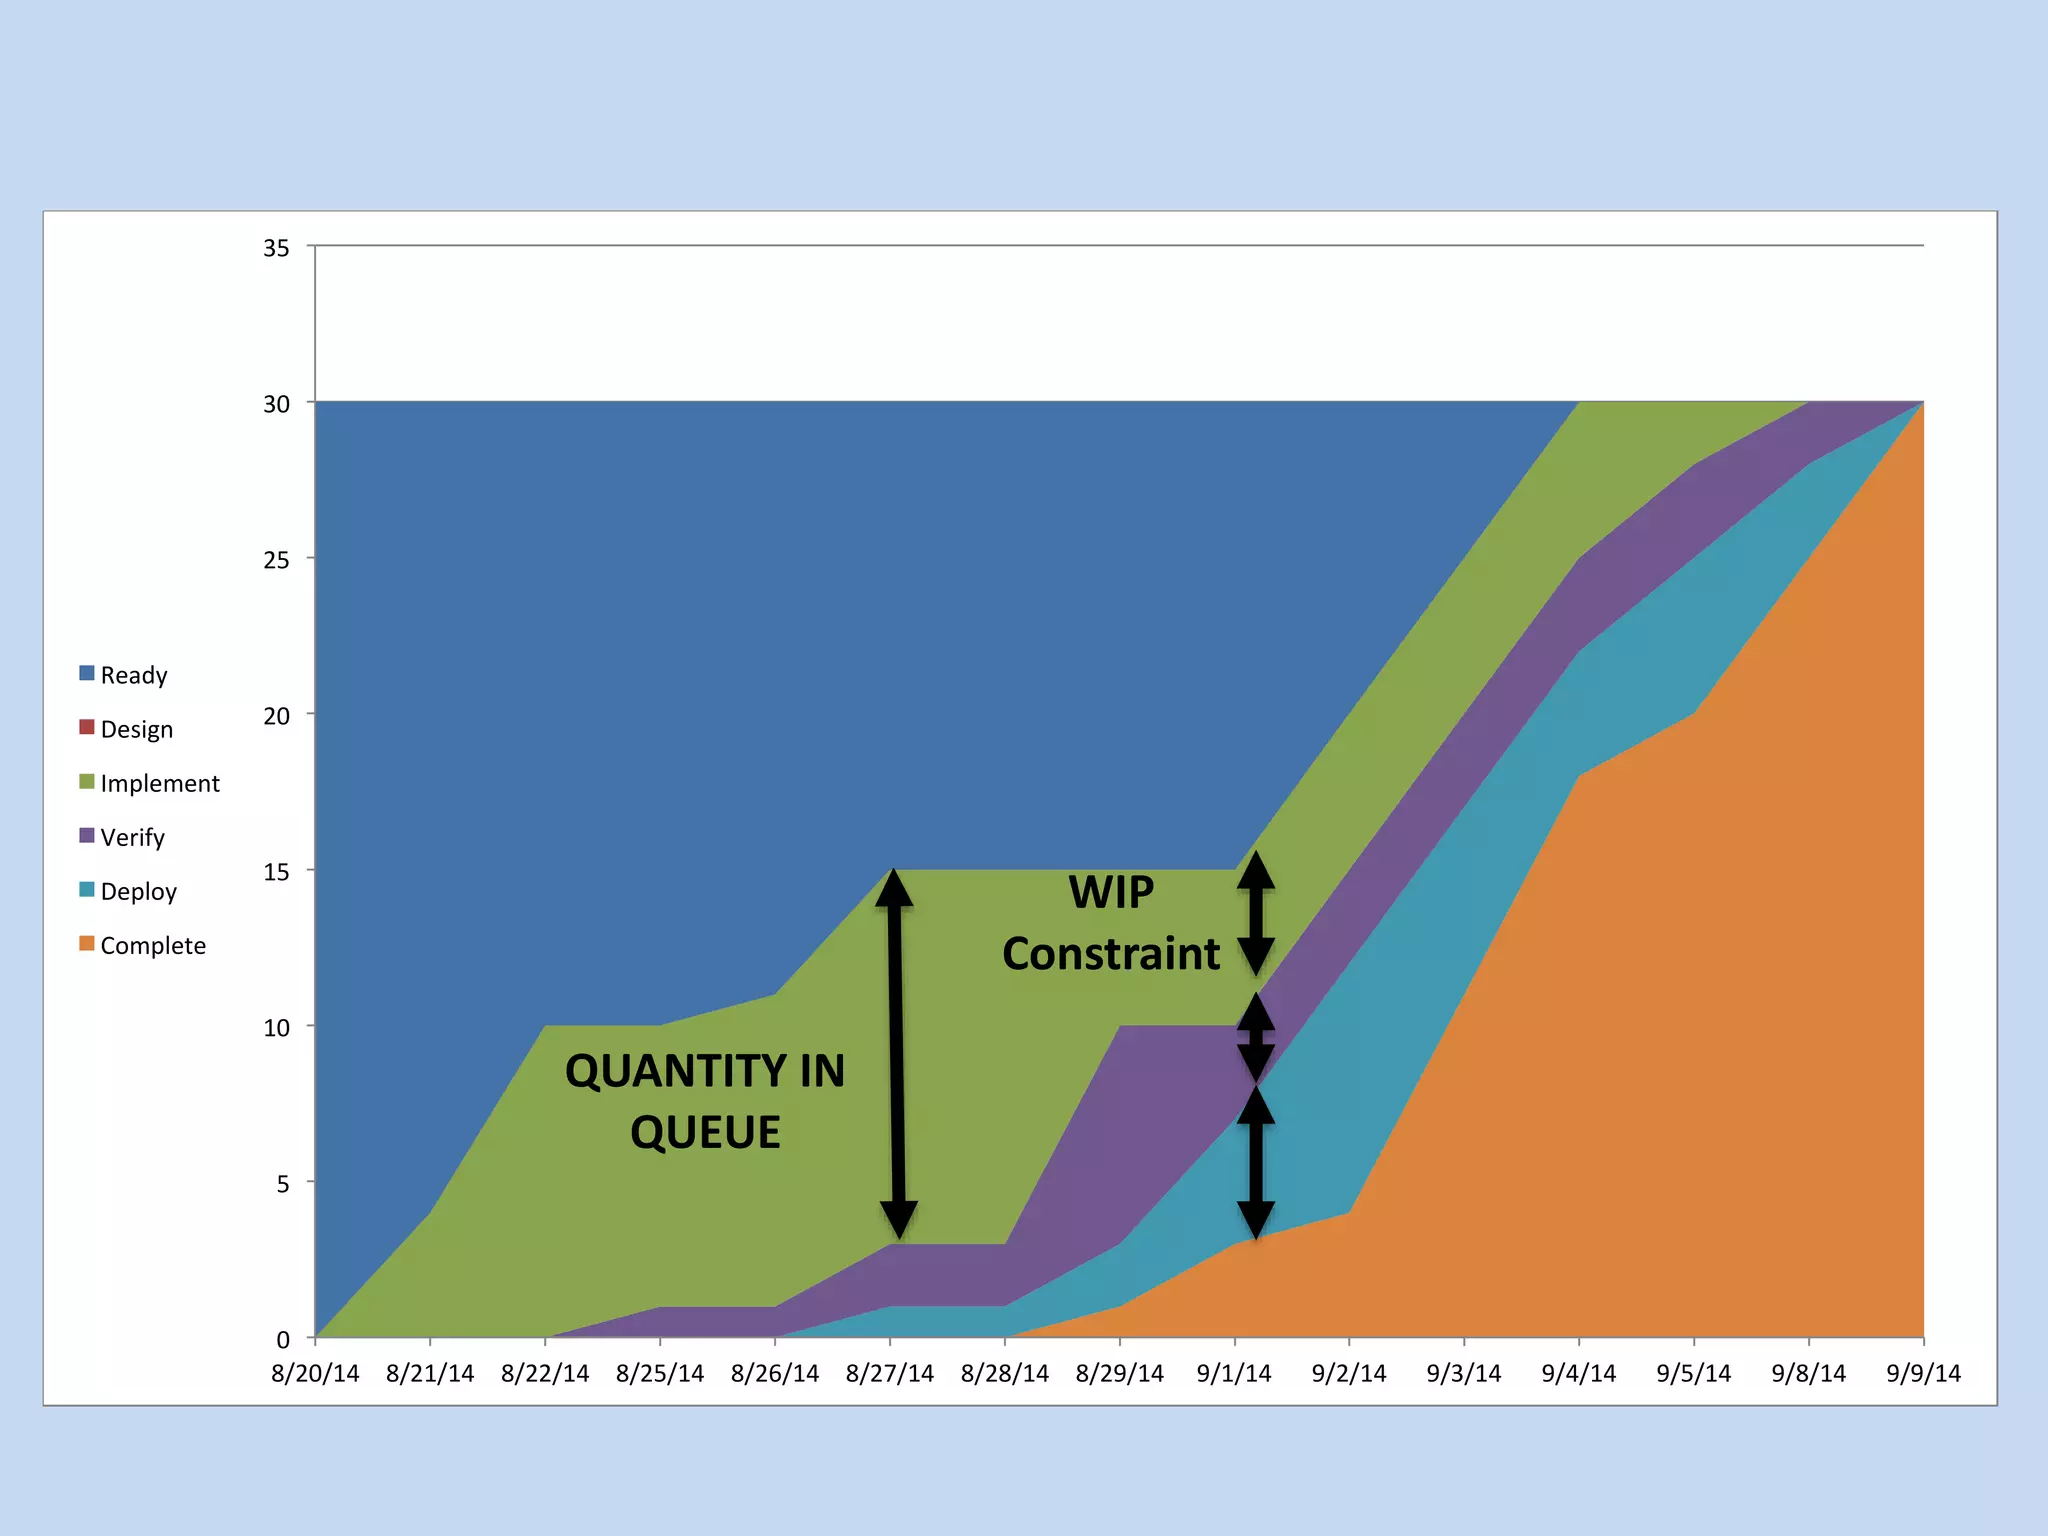
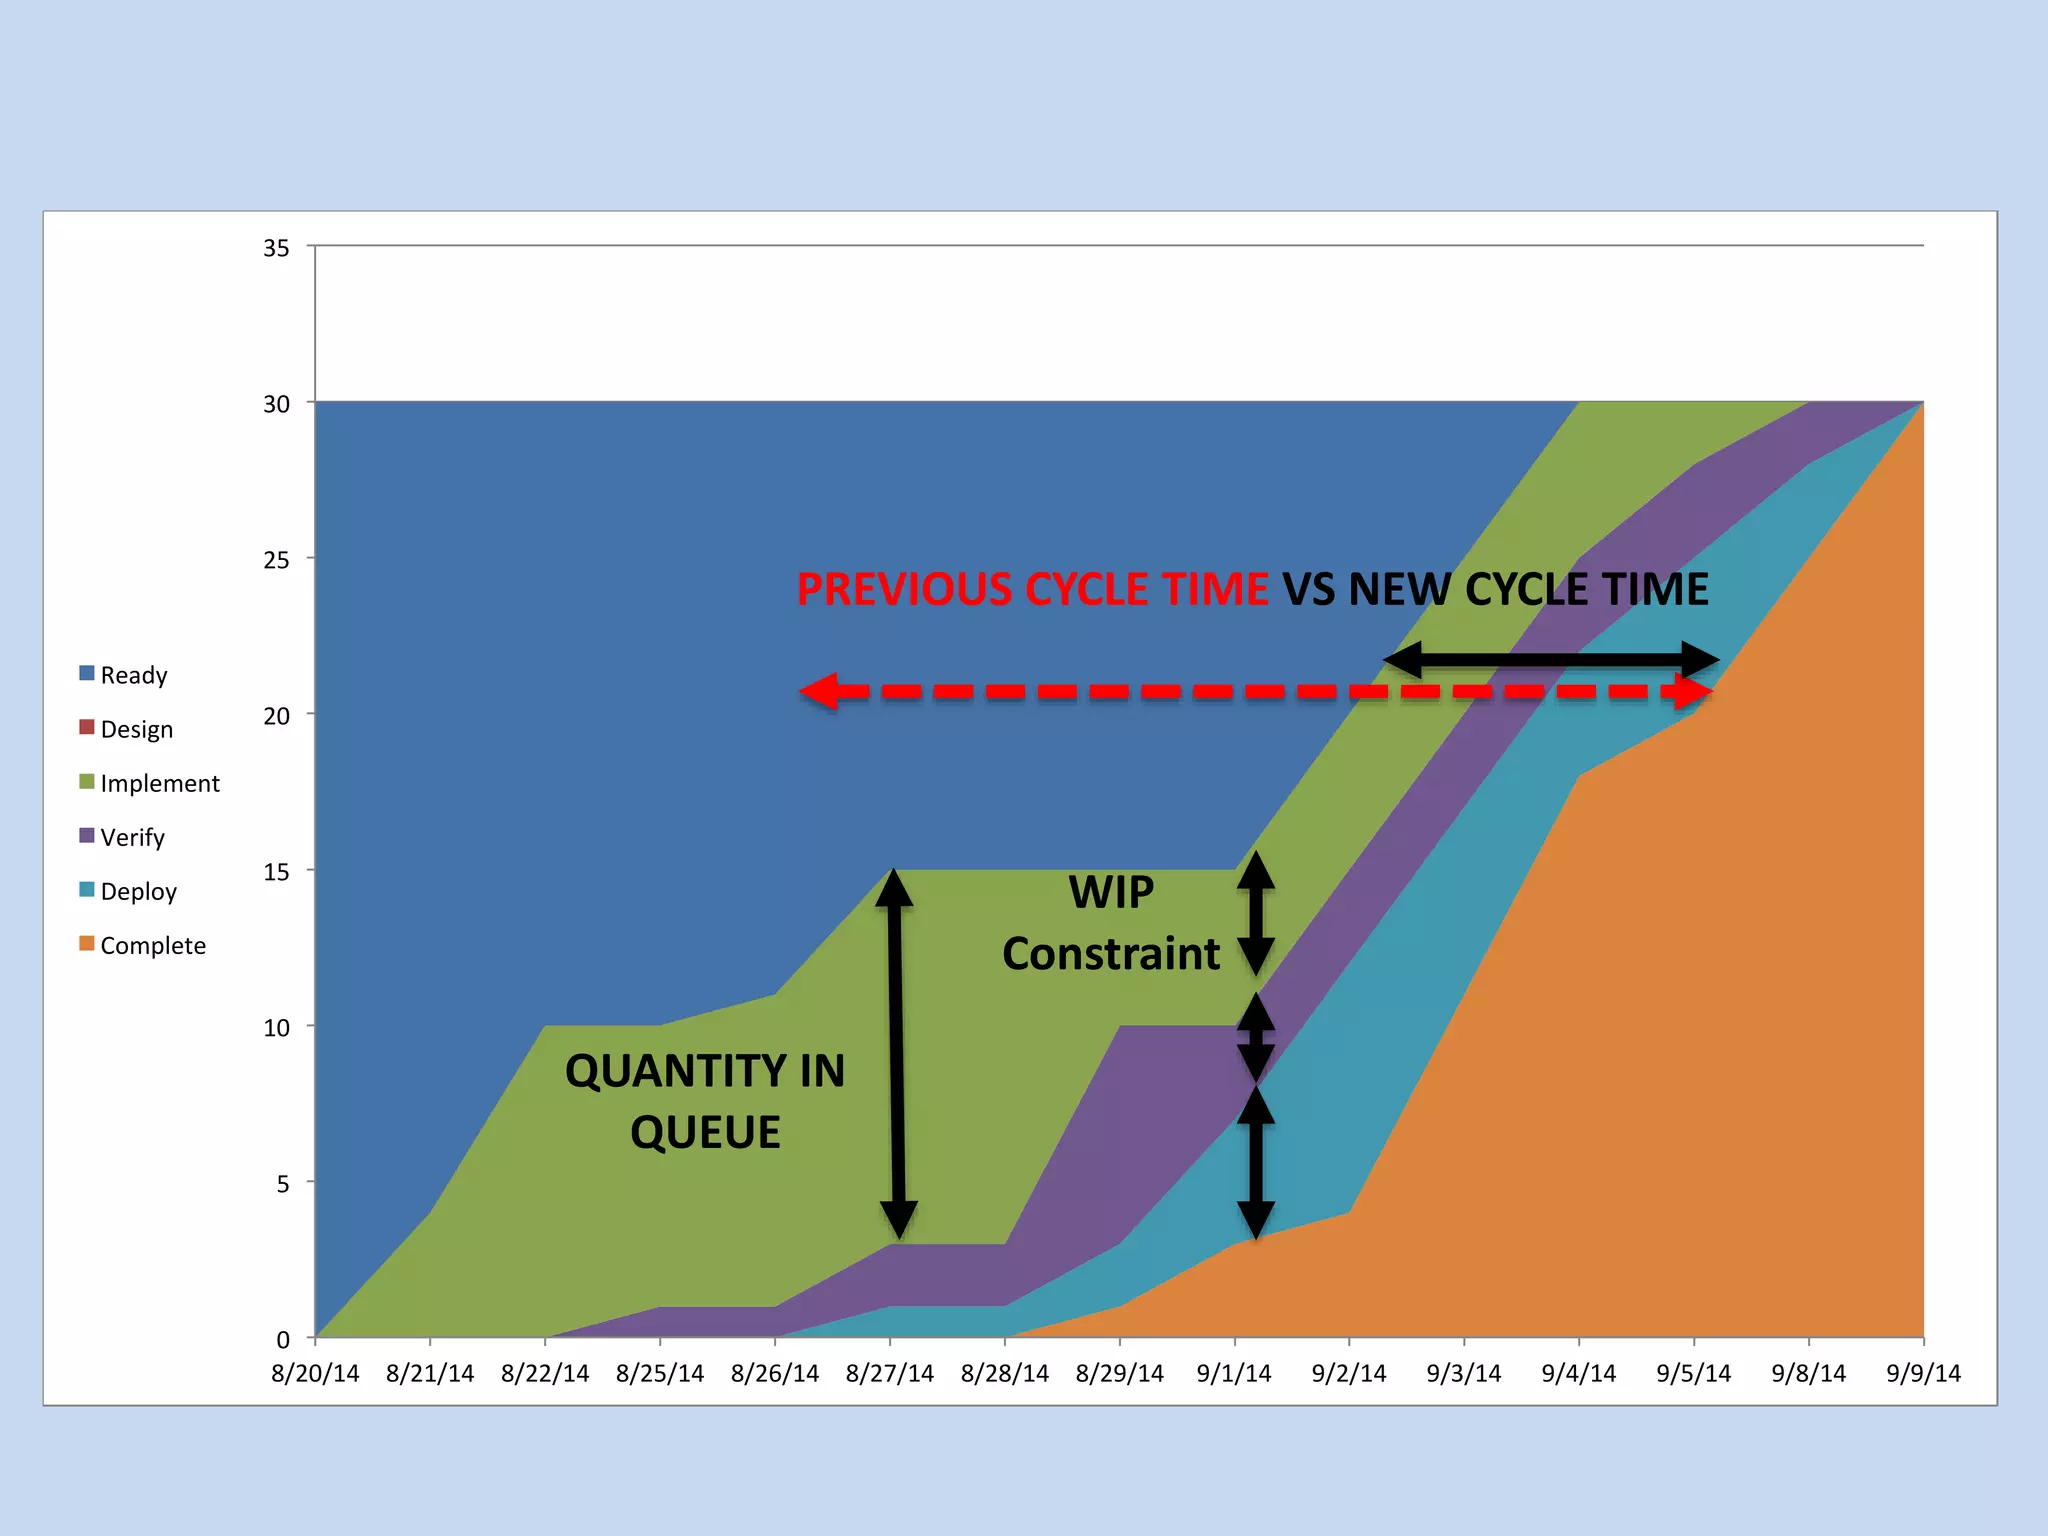
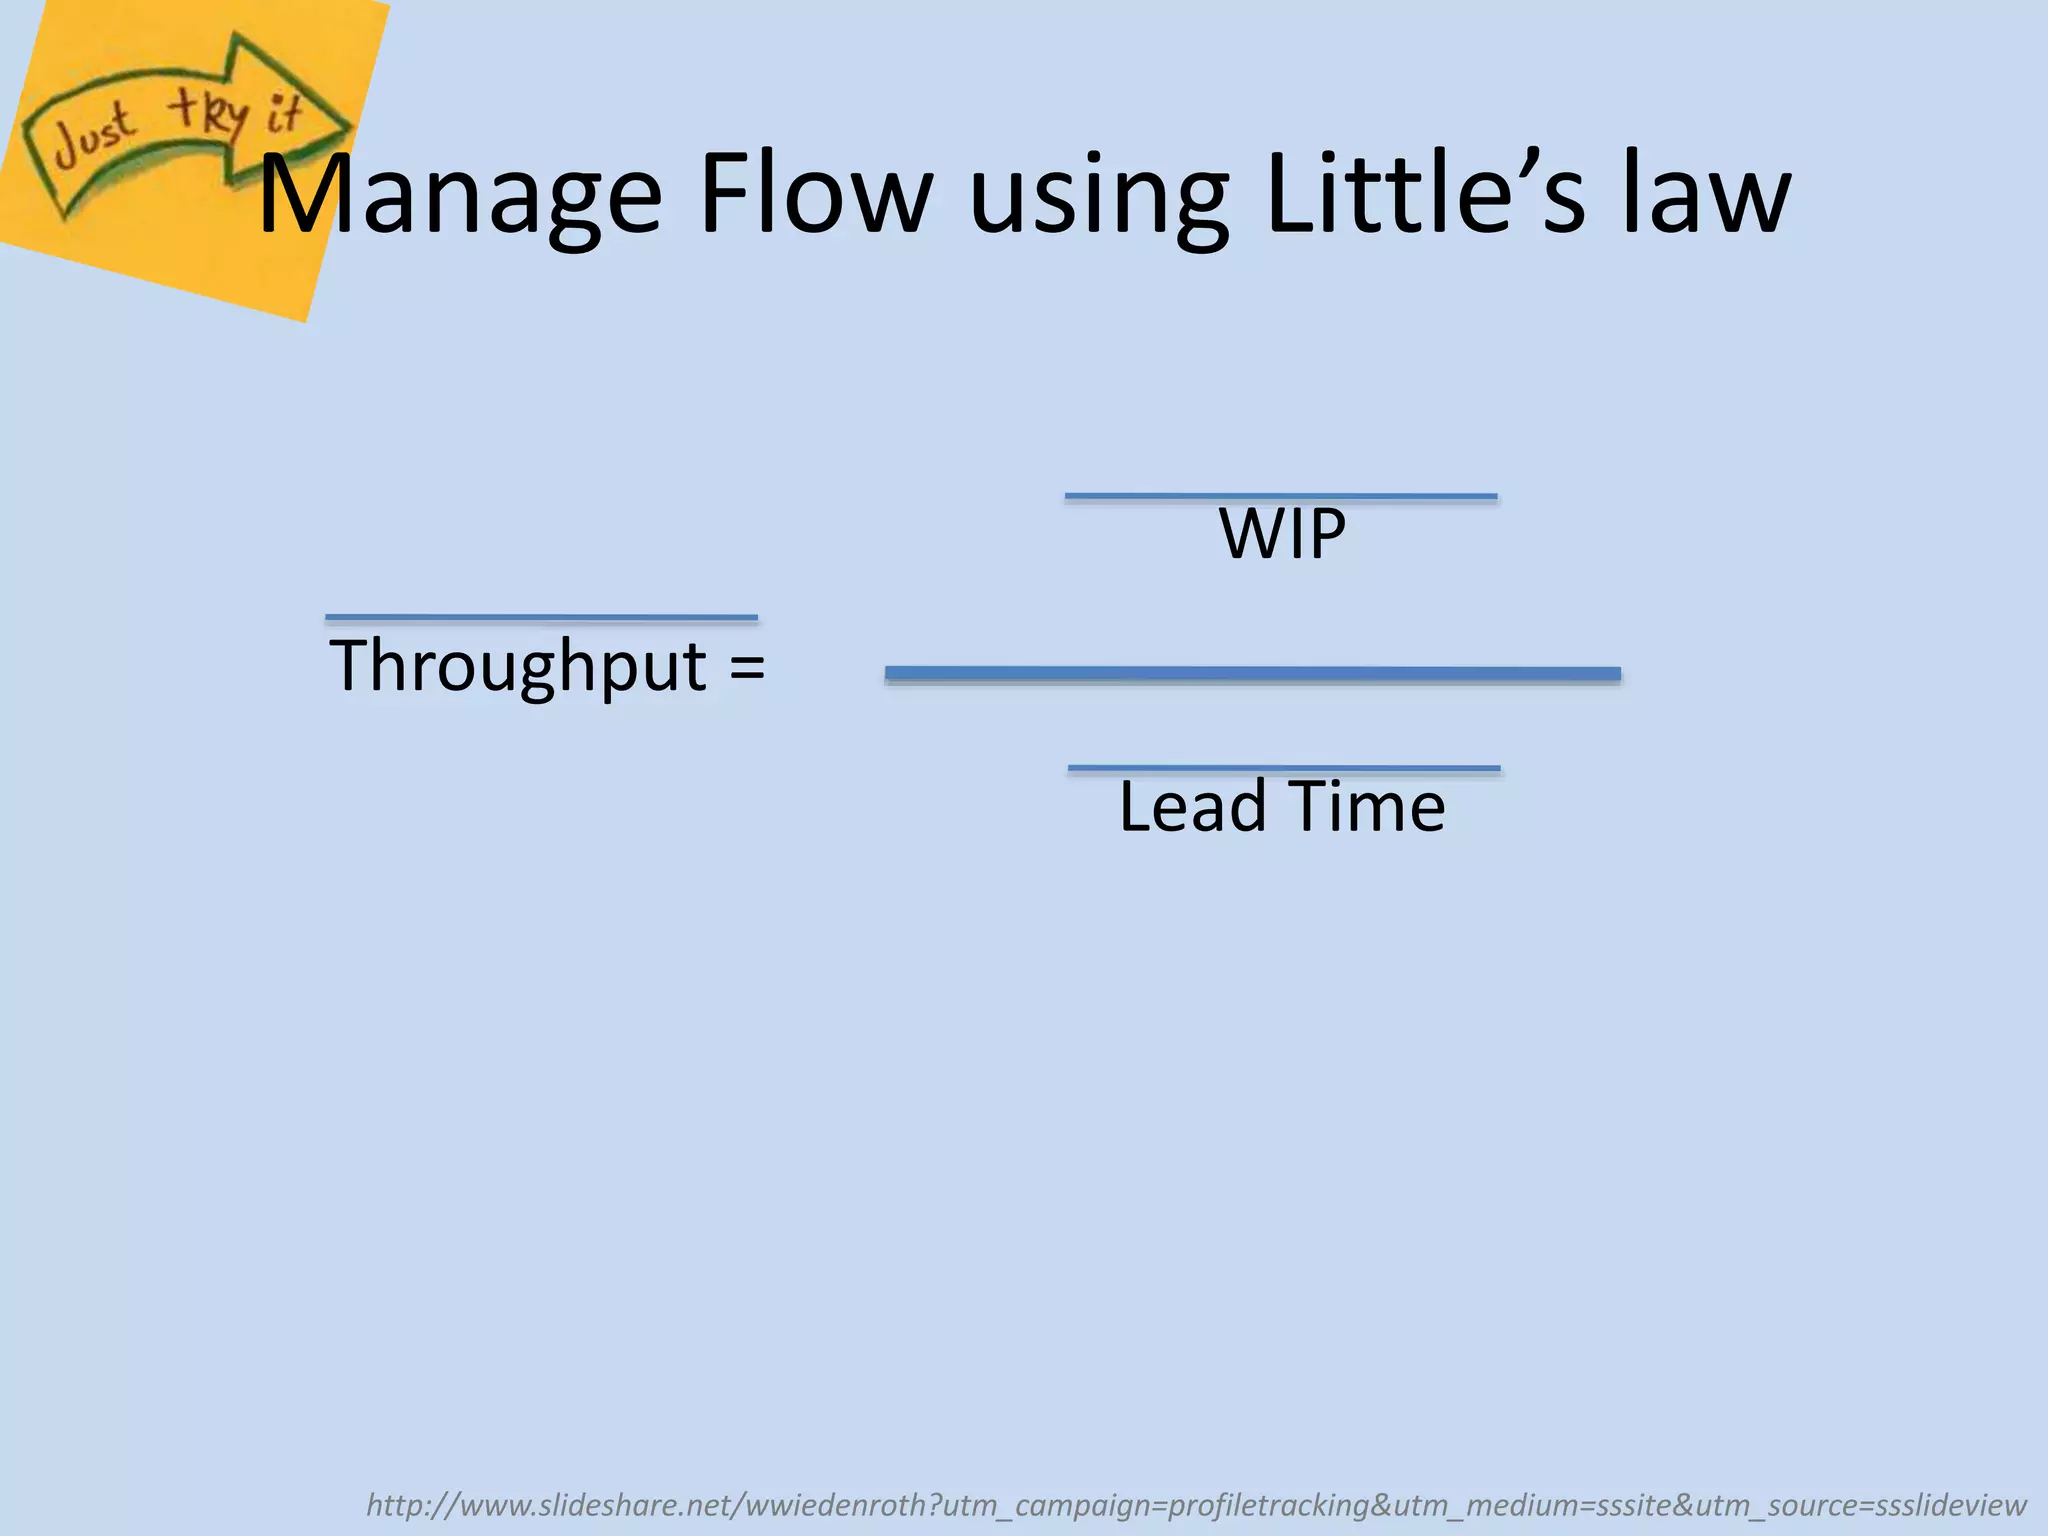
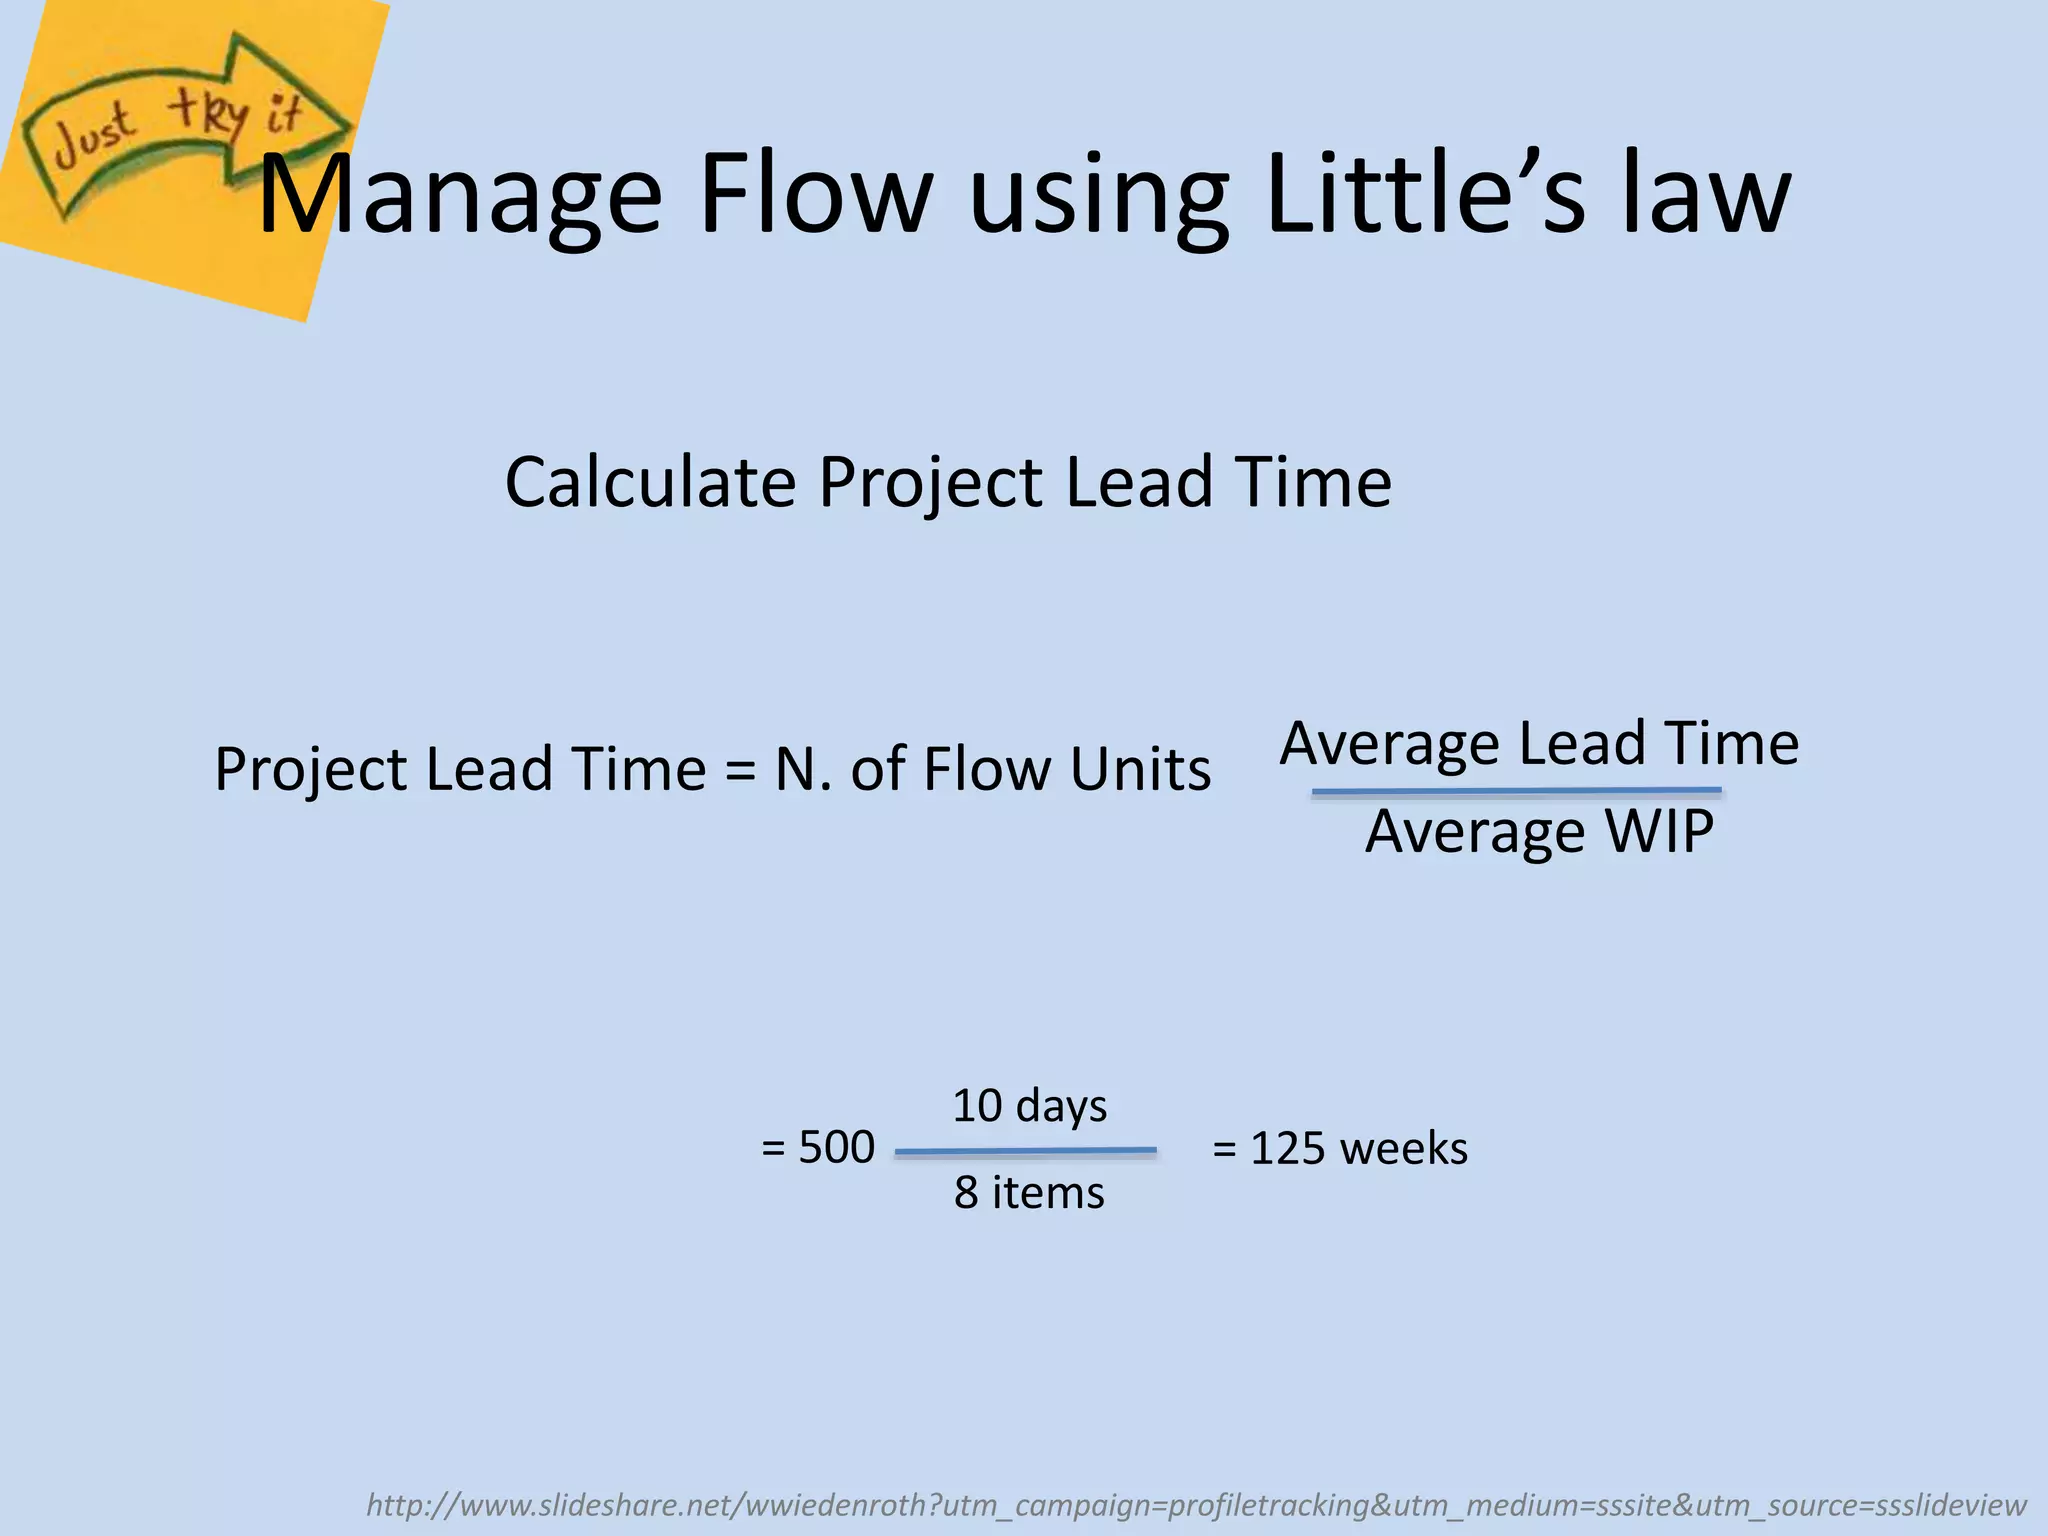
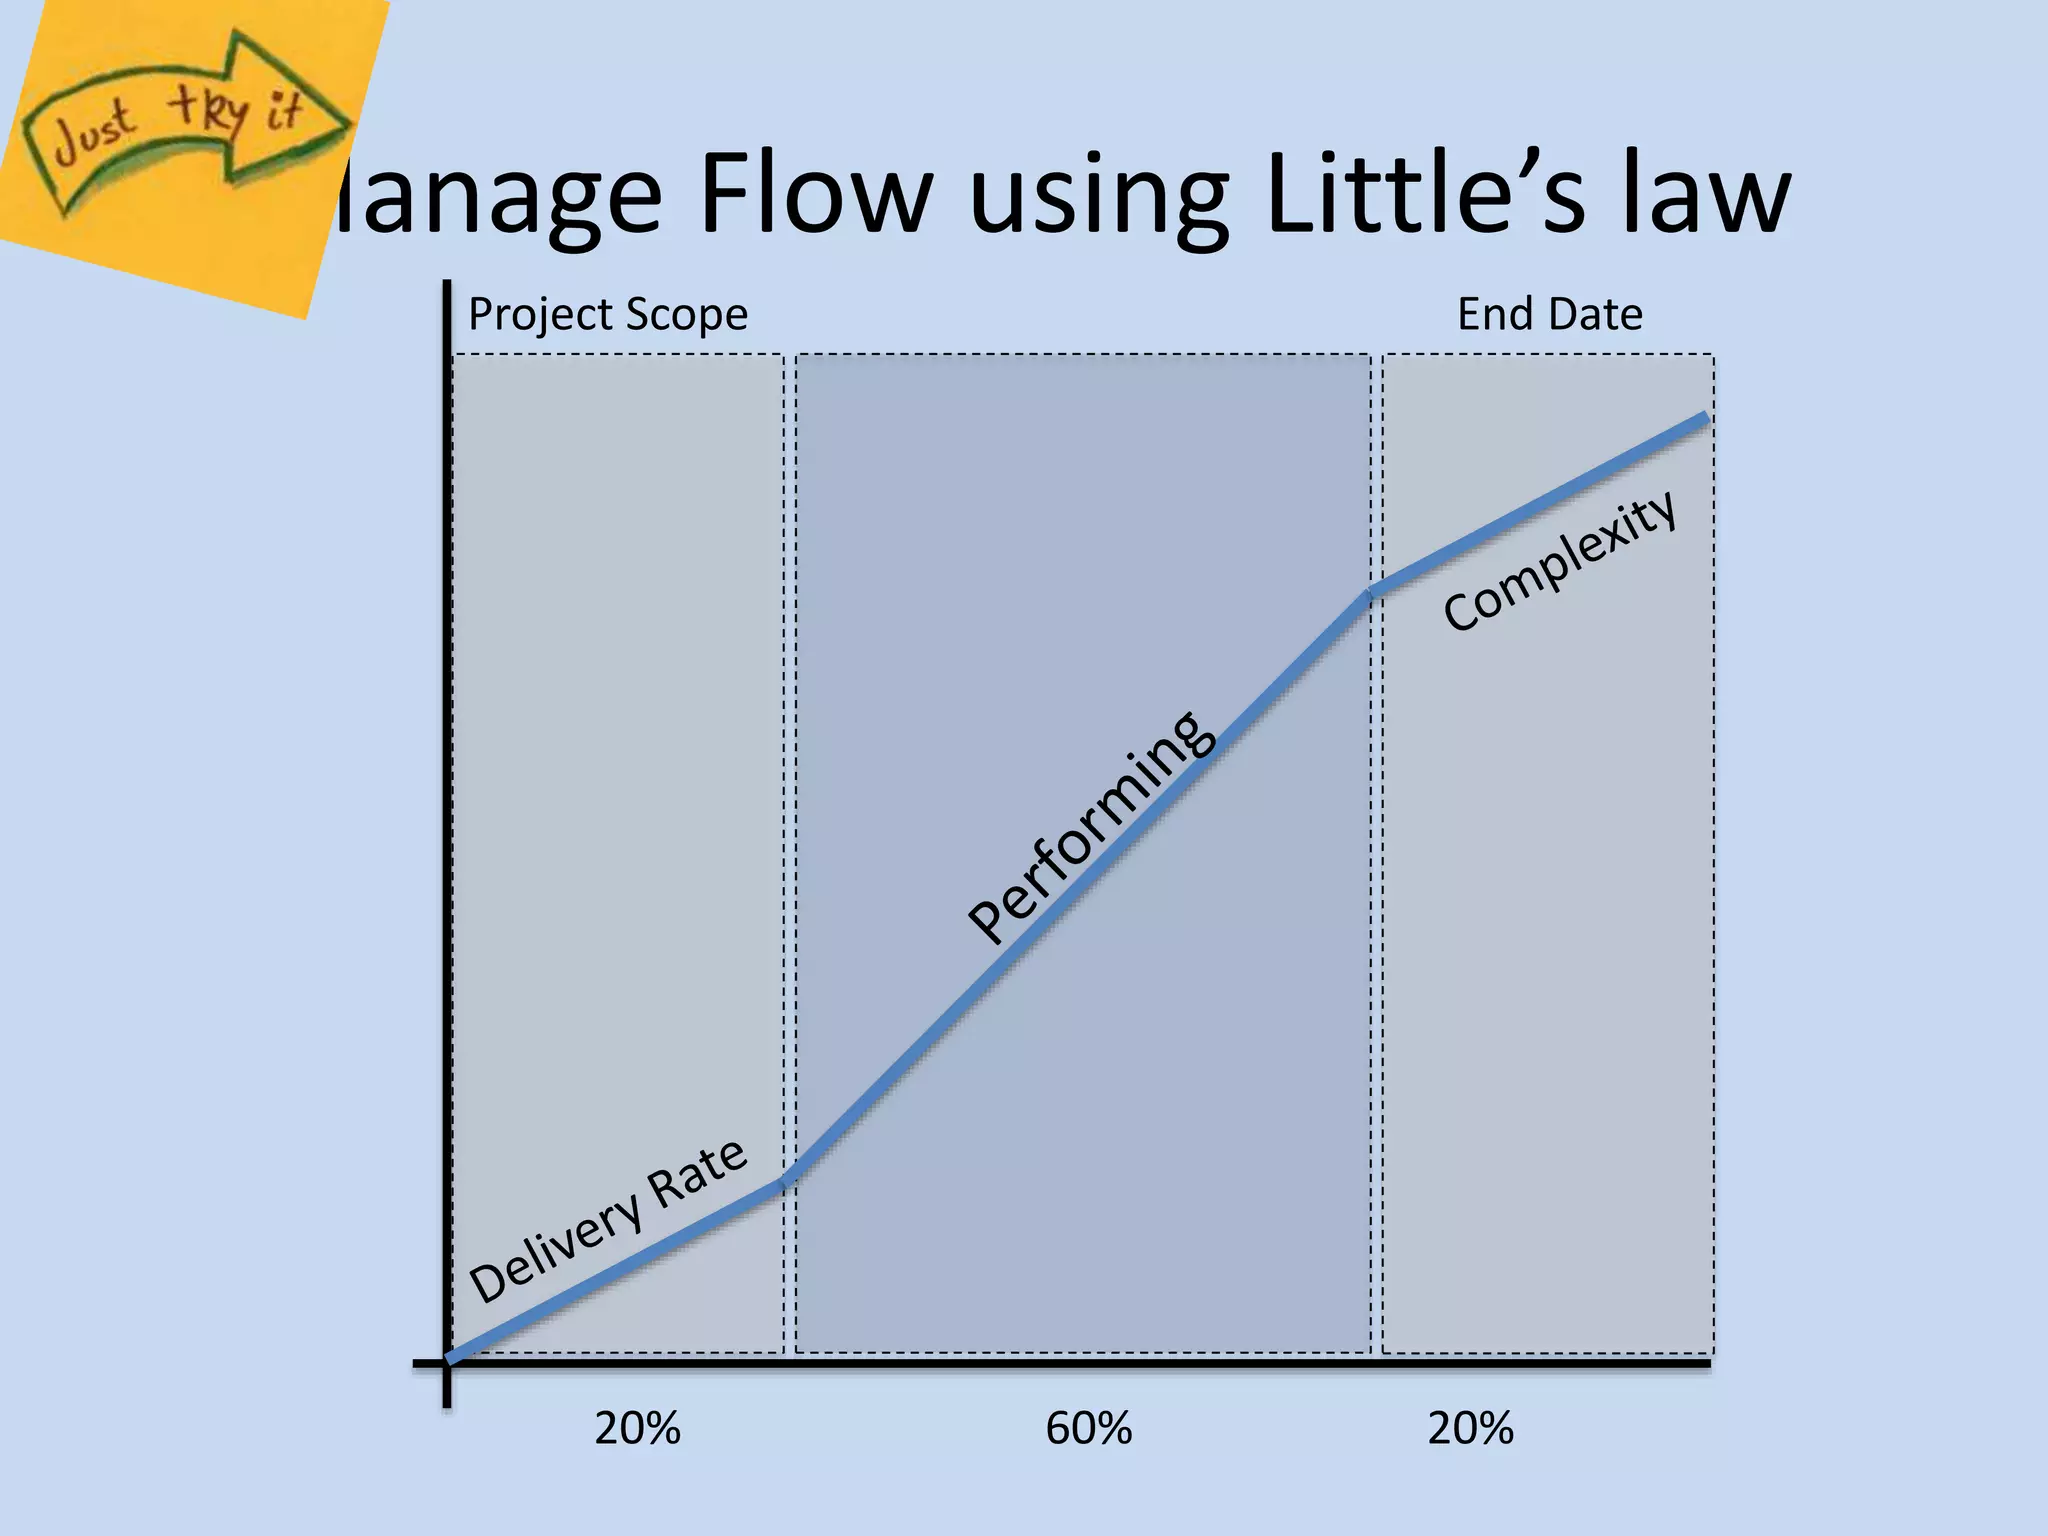
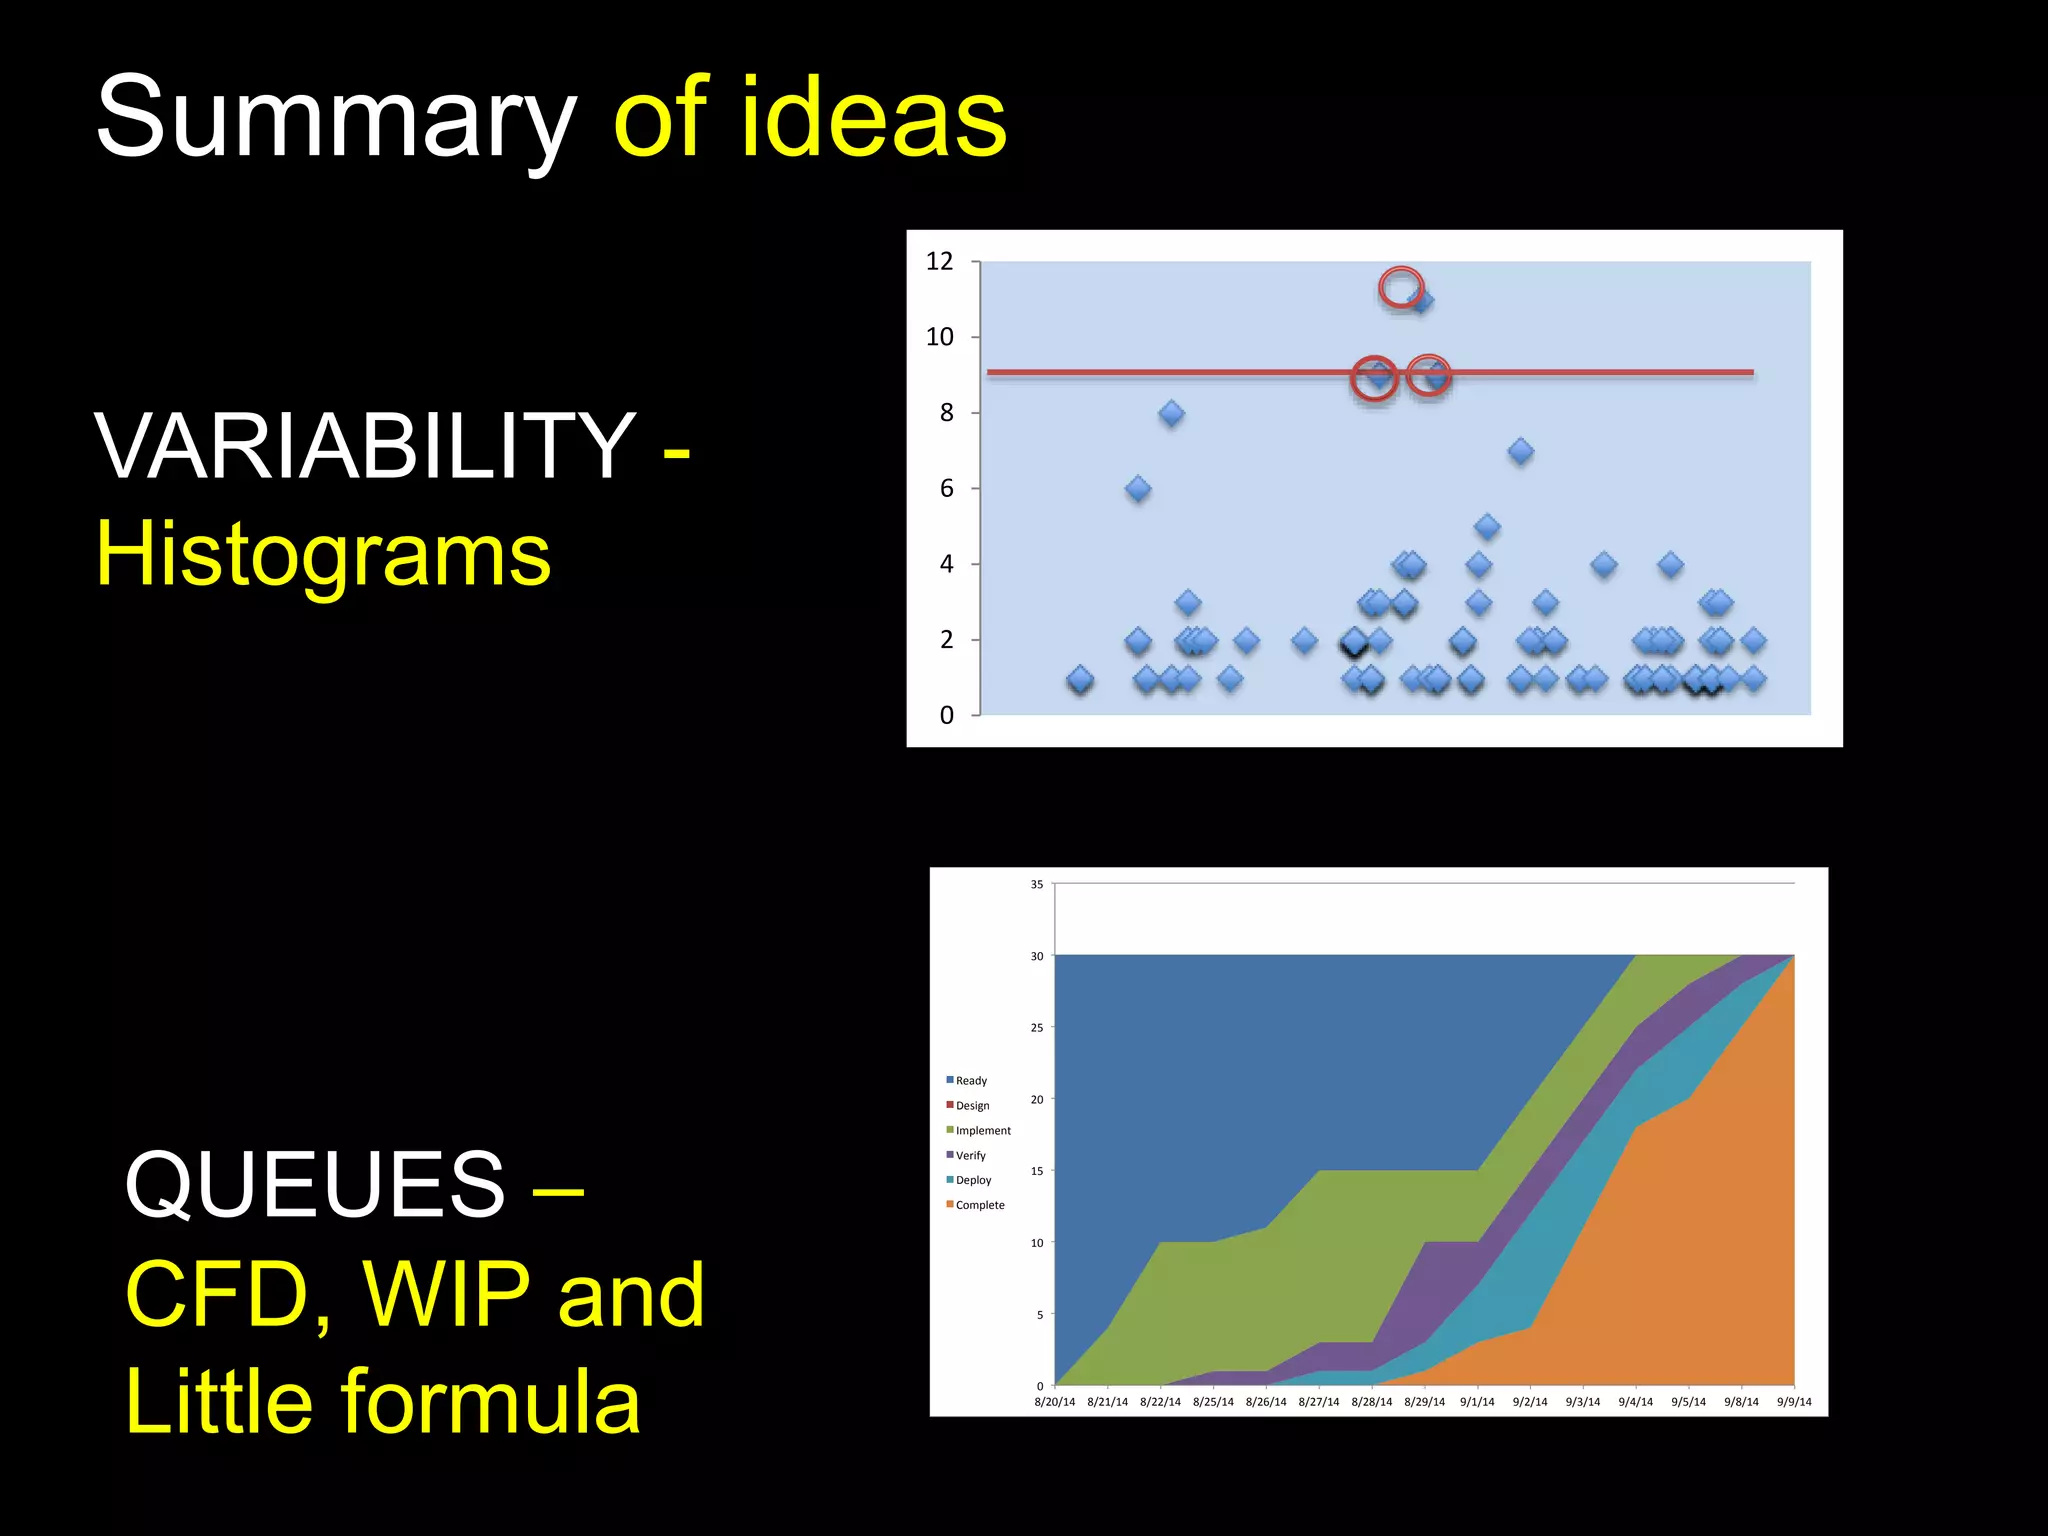
Flow Product 
Development 
Pablo Domingo 
@pavleras
Principles 
Variability 
Queues & Resource Efficiency
Flow Product 
Development 
Principles
Principle #1: Deliver fast
Principle #1: Deliver fast 
Backlog Develop 
Ongoing Done 
Test Deployment 
Ongoing Done 
FLOW UNITS
Principle #1: Deliver fast 
Backlog Develop 
Ongoing Done 
Test Deployment 
Ongoing Done 
CONCEPT TO CASH
Principle #2: Eliminate non-value 
added activities. 
https://www.flickr.com/people/92944716@N05/ 
Only give 
me good 
news
Principle #2: Eliminate non-value 
added activities. 
https://www.flickr.com/photos/st3f4n/4487662126/
Principle #2: Eliminate non-value 
added activities. 
15% 
80% 
Features 
Value
Principle #2: Eliminate non-value 
added activities.
Principle #2: Eliminate non-value 
added activities. 
http://www.heraldo.es/galerias-imagenes/chapuzas-en-aragon/#2
Principle #3: Focus on Flow Units 
“85% of the reasons for 
failure to meet customer 
expectations are relate to 
deficiencies in systems and 
processes… rather than the 
employee”
Flow Product 
Development 
Variability
#1: Variability 
https://www.flickr.com/photos/donsolo/2332814270/
Variability – Lean Manufacturing 
You cannot add value without 
adding variability 
https://www.flickr.com/photos/urbangarden/
Variability – Product Development 
You cannot add value without 
adding variability
Variability – Product Development 
You cannot add value without 
adding variability but you can add 
variability without adding value 
Donald Reinertsen
#1 Histograms
Time 
Cycle Time
12 
10 
Cycle Time 
8 
6 
4 
2 
0 
Development time 
8/9/14 8/19/14 8/29/14 9/8/14 9/18/14 9/28/14 10/8/14 10/18/14 10/28/14 11/7/14 11/17/14 
9-8-2014 – 
17/11/2014 
#Days 
UCL= 9 
Mean=3,5 
LCL=0
12 
10 
Cycle Time 
8 
6 
4 
2 
0 
Statistical 
Process Control 
8/9/14 8/19/14 8/29/14 9/8/14 9/18/14 9/28/14 10/8/14 10/18/14 10/28/14 11/7/14 11/17/14 
9-8-2014 – 
17/11/2014 
#Days 
UCL= 9 
Mean=3,5 
LCL=0 
UCL= Mean + 3*Standard Deviation 
Mean=3,5 
LCL= Mean – 3*Standard Deviation
12 
10 
Cycle Time 
8 
6 
4 
2 
0 
Special Cause 
Variation 
8/9/14 8/19/14 8/29/14 9/8/14 9/18/14 9/28/14 10/8/14 10/18/14 10/28/14 11/7/14 11/17/14 
9-8-2014 – 
17/11/2014 
#Days 
UCL= 9 
Mean=3,5 
LCL=0 
UCL= Mean + 3*Standard Deviation 
Mean=3,5 
LCL= Mean – 3*Standard Deviation
Live defects per 
release 
25 
20 
15 
10 
5 
0 
BUGS 
Lower Control Limit 
Higher Control Limit 
Linear (BUGS)
25 
20 
15 
10 
5 
0 
“Voice of the 
process” 
BUGS 
Lower Control Limit 
Higher Control Limit 
Linear (BUGS)
http://leanandkanban.wordpress.com/2009/11/04/kanban-results-part-3-from-scrum-to-kanban/
Flow Product 
Development 
Queues & Resource Efficiency
#2: Queues & 
Resource Efficiency 
https://www.flickr.com/photos/donsolo/2332814270/
Efficiency – Queues 
Backlog Develop 
Ongoing Done 
Test Deployment 
Ongoing Done 
Increase Cycle Time 
Increase Variability & Risk 
Decrease Efficiency 
Decrease Quality - Feedback 
Decrease Motivation
Efficiency – Queues 
https://www.flickr.com/photos/wwarby/11682625885/
Efficiency – Queuing Theory 
Queues + Variability + Resource 
efficiency? 
https://www.flickr.com/photos/skycaptaintwo/
Efficiency – Queuing Theory 
Non-linear Exponential
Small changes in capacity utilization… 
4 times 
Cycle time
Tool:#2 
Cumulative Flow Diagram
Time 
Cumulative size
Backlog Develop 
Ongoing Done 
Test Deployment 
Ongoing Done 
6	 
5	 
4	 
3	 
2	 
1	 
0	 
12/8/14	 12/8/14	 
Ready	To	Do	 
In	progress	 
Test	 
Deploy	 
Complete
Backlog Develop 
Ongoing Done 
Test Deployment 
Ongoing Done 
6	 
5	 
4	 
3	 
2	 
1	 
0	 
12/8/14	 12/9/14	 
Ready	To	Do	 
In	progress	 
Test	 
Deploy	 
Complete
Backlog Develop 
Ongoing Done 
Test Deployment 
Ongoing Done 
6	 
5	 
4	 
3	 
2	 
1	 
0	 
12/8/14	 12/9/14	 12/10/14	 12/11/14	 12/12/14	 
Ready	To	Do	 
In	progress	 
Test	 
Deploy	 
Complete
Backlog Develop 
Ongoing Done 
Test Deployment 
Ongoing Done 
6	 
5	 
4	 
3	 
2	 
1	 
0	 
12/8/14	 12/9/14	 12/10/14	 12/11/14	 12/12/14	 12/13/14	 
Ready	To	Do	 
In	progress	 
Test	 
Deploy	 
Complete
Backlog Develop 
Ongoing Done 
Test Deployment 
Ongoing Done 
6	 
5	 
4	 
3	 
2	 
1	 
0	 
12/8/14	 12/9/14	 12/10/14	 12/11/14	 12/12/14	 12/13/14	 12/14/14	 
Ready	To	Do	 
In	progress	 
Test	 
Deploy	 
Complete
Backlog Develop 
Ongoing Done 
Test Deployment 
Ongoing Done 
6	 
5	 
4	 
3	 
2	 
1	 
0	 
12/8/14	 12/9/14	 12/10/14	 12/11/14	 12/12/14	 12/13/14	 12/14/14	 12/15/14	 
Ready	To	Do	 
In	progress	 
Test	 
Deploy	 
Complete
35	 
30	 
25	 
20	 
15	 
10	 
5	 
0	 
8/20/14	 8/21/14	 8/22/14	 8/25/14	 8/26/14	 8/27/14	 8/28/14	 8/29/14	 9/1/14	 9/2/14	 9/3/14	 9/4/14	 9/5/14	 9/8/14	 9/9/14	 
Ready	 
Design	 
Implement	 
Verify	 
Deploy	 
Complete	 
CYCLE TIME
35	 
30	 
25	 
20	 
15	 
10	 
5	 
0	 
8/20/14	 8/21/14	 8/22/14	 8/25/14	 8/26/14	 8/27/14	 8/28/14	 8/29/14	 9/1/14	 9/2/14	 9/3/14	 9/4/14	 9/5/14	 9/8/14	 9/9/14	 
Ready	 
Design	 
Implement	 
Verify	 
Deploy	 
Complete	 
LEAD TIME
35	 
30	 
25	 
20	 
15	 
10	 
5	 
0	 
8/20/14	 8/21/14	 8/22/14	 8/25/14	 8/26/14	 8/27/14	 8/28/14	 8/29/14	 9/1/14	 9/2/14	 9/3/14	 9/4/14	 9/5/14	 9/8/14	 9/9/14	 
Ready	 
Design	 
Implement	 
Verify	 
Deploy	 
Complete	 
Limiting WIP? 
QUANTITY IN 
QUEUE
35	 
30	 
25	 
20	 
15	 
10	 
5	 
0	 
8/20/14	 8/21/14	 8/22/14	 8/25/14	 8/26/14	 8/27/14	 8/28/14	 8/29/14	 9/1/14	 9/2/14	 9/3/14	 9/4/14	 9/5/14	 9/8/14	 9/9/14	 
Ready	 
Design	 
Implement	 
Verify	 
Deploy	 
Complete	 
QUANTITY IN 
QUEUE 
WIP 
Constraint
35	 
30	 
25	 
20	 
15	 
10	 
5	 
0	 
8/20/14	 8/21/14	 8/22/14	 8/25/14	 8/26/14	 8/27/14	 8/28/14	 8/29/14	 9/1/14	 9/2/14	 9/3/14	 9/4/14	 9/5/14	 9/8/14	 9/9/14	 
Ready	 
Design	 
Implement	 
Verify	 
Deploy	 
Complete	 
QUANTITY IN 
QUEUE 
WIP 
Constraint
35	 
30	 
25	 
20	 
15	 
10	 
5	 
0	 
PREVIOUS CYCLE TIME VS NEW CYCLE TIME 
8/20/14	 8/21/14	 8/22/14	 8/25/14	 8/26/14	 8/27/14	 8/28/14	 8/29/14	 9/1/14	 9/2/14	 9/3/14	 9/4/14	 9/5/14	 9/8/14	 9/9/14	 
Ready	 
Design	 
Implement	 
Verify	 
Deploy	 
Complete	 
QUANTITY IN 
QUEUE 
WIP 
Constraint
Tool:#3 
Little’s Formula
Manage Flow using Little’s law 
Throughput = 
WIP 
Lead Time 
http://www.slideshare.net/wwiedenroth?utm_campaign=profiletracking&utm_medium=sssite&utm_source=ssslideview
Manage Flow using Little’s law 
Calculate Project Lead Time 
Project Lead Time = N. of Flow Units Average Lead Time 
Average WIP 
= 500 
10 days 
8 items 
= 125 weeks 
http://www.slideshare.net/wwiedenroth?utm_campaign=profiletracking&utm_medium=sssite&utm_source=ssslideview
Manage Flow using Little’s law 
Project Scope End Date 
20% 60% 20%
Tool:#4 
Limiting Work In Progress
1. Demand 
1. Escalation 
2. Throttle 
2. Service 
More tools 
1. T-Shape resources 
2. SWAT Team 
3. Part-time resources 
4. Training & Cross-training
Summary of ideas 
Cycle Time 
12 
10 
8 
6 
4 
2 
0 
VARIABILITY - 
Histograms 
35	 
30	 
25	 
20	 
QUEUES – 
15	 
10	 
CFD, WIP and 
5	 
Little formula 0	 
8/20/14	 8/21/14	 8/22/14	 8/25/14	 8/26/14	 8/27/14	 8/28/14	 8/29/14	 9/1/14	 9/2/14	 9/3/14	 9/4/14	 9/5/14	 9/8/14	 9/9/14	 
Ready	 
Design	 
Implement	 
Verify	 
Deploy	 
Complete
Research more reading these books
More about me 
Pablo Domingo 
@pavleras 
Becomingagile.wordpress.com

Flow Product Development

  • 1.
    Flow Product Development Pablo Domingo @pavleras
  • 2.
    Principles Variability Queues& Resource Efficiency
  • 3.
  • 4.
  • 5.
    Principle #1: Deliverfast Backlog Develop Ongoing Done Test Deployment Ongoing Done FLOW UNITS
  • 6.
    Principle #1: Deliverfast Backlog Develop Ongoing Done Test Deployment Ongoing Done CONCEPT TO CASH
  • 7.
    Principle #2: Eliminatenon-value added activities. https://www.flickr.com/people/92944716@N05/ Only give me good news
  • 8.
    Principle #2: Eliminatenon-value added activities. https://www.flickr.com/photos/st3f4n/4487662126/
  • 9.
    Principle #2: Eliminatenon-value added activities. 15% 80% Features Value
  • 10.
    Principle #2: Eliminatenon-value added activities.
  • 11.
    Principle #2: Eliminatenon-value added activities. http://www.heraldo.es/galerias-imagenes/chapuzas-en-aragon/#2
  • 12.
    Principle #3: Focuson Flow Units “85% of the reasons for failure to meet customer expectations are relate to deficiencies in systems and processes… rather than the employee”
  • 13.
  • 14.
  • 15.
    Variability – LeanManufacturing You cannot add value without adding variability https://www.flickr.com/photos/urbangarden/
  • 16.
    Variability – ProductDevelopment You cannot add value without adding variability
  • 17.
    Variability – ProductDevelopment You cannot add value without adding variability but you can add variability without adding value Donald Reinertsen
  • 18.
  • 19.
  • 20.
    12 10 CycleTime 8 6 4 2 0 Development time 8/9/14 8/19/14 8/29/14 9/8/14 9/18/14 9/28/14 10/8/14 10/18/14 10/28/14 11/7/14 11/17/14 9-8-2014 – 17/11/2014 #Days UCL= 9 Mean=3,5 LCL=0
  • 21.
    12 10 CycleTime 8 6 4 2 0 Statistical Process Control 8/9/14 8/19/14 8/29/14 9/8/14 9/18/14 9/28/14 10/8/14 10/18/14 10/28/14 11/7/14 11/17/14 9-8-2014 – 17/11/2014 #Days UCL= 9 Mean=3,5 LCL=0 UCL= Mean + 3*Standard Deviation Mean=3,5 LCL= Mean – 3*Standard Deviation
  • 22.
    12 10 CycleTime 8 6 4 2 0 Special Cause Variation 8/9/14 8/19/14 8/29/14 9/8/14 9/18/14 9/28/14 10/8/14 10/18/14 10/28/14 11/7/14 11/17/14 9-8-2014 – 17/11/2014 #Days UCL= 9 Mean=3,5 LCL=0 UCL= Mean + 3*Standard Deviation Mean=3,5 LCL= Mean – 3*Standard Deviation
  • 23.
    Live defects per release 25 20 15 10 5 0 BUGS Lower Control Limit Higher Control Limit Linear (BUGS)
  • 24.
    25 20 15 10 5 0 “Voice of the process” BUGS Lower Control Limit Higher Control Limit Linear (BUGS)
  • 25.
  • 26.
    Flow Product Development Queues & Resource Efficiency
  • 27.
    #2: Queues & Resource Efficiency https://www.flickr.com/photos/donsolo/2332814270/
  • 28.
    Efficiency – Queues Backlog Develop Ongoing Done Test Deployment Ongoing Done Increase Cycle Time Increase Variability & Risk Decrease Efficiency Decrease Quality - Feedback Decrease Motivation
  • 29.
    Efficiency – Queues https://www.flickr.com/photos/wwarby/11682625885/
  • 30.
    Efficiency – QueuingTheory Queues + Variability + Resource efficiency? https://www.flickr.com/photos/skycaptaintwo/
  • 31.
    Efficiency – QueuingTheory Non-linear Exponential
  • 32.
    Small changes incapacity utilization… 4 times Cycle time
  • 33.
  • 34.
  • 35.
    Backlog Develop OngoingDone Test Deployment Ongoing Done 6 5 4 3 2 1 0 12/8/14 12/8/14 Ready To Do In progress Test Deploy Complete
  • 36.
    Backlog Develop OngoingDone Test Deployment Ongoing Done 6 5 4 3 2 1 0 12/8/14 12/9/14 Ready To Do In progress Test Deploy Complete
  • 37.
    Backlog Develop OngoingDone Test Deployment Ongoing Done 6 5 4 3 2 1 0 12/8/14 12/9/14 12/10/14 12/11/14 12/12/14 Ready To Do In progress Test Deploy Complete
  • 38.
    Backlog Develop OngoingDone Test Deployment Ongoing Done 6 5 4 3 2 1 0 12/8/14 12/9/14 12/10/14 12/11/14 12/12/14 12/13/14 Ready To Do In progress Test Deploy Complete
  • 39.
    Backlog Develop OngoingDone Test Deployment Ongoing Done 6 5 4 3 2 1 0 12/8/14 12/9/14 12/10/14 12/11/14 12/12/14 12/13/14 12/14/14 Ready To Do In progress Test Deploy Complete
  • 40.
    Backlog Develop OngoingDone Test Deployment Ongoing Done 6 5 4 3 2 1 0 12/8/14 12/9/14 12/10/14 12/11/14 12/12/14 12/13/14 12/14/14 12/15/14 Ready To Do In progress Test Deploy Complete
  • 41.
    35 30 25 20 15 10 5 0 8/20/14 8/21/14 8/22/14 8/25/14 8/26/14 8/27/14 8/28/14 8/29/14 9/1/14 9/2/14 9/3/14 9/4/14 9/5/14 9/8/14 9/9/14 Ready Design Implement Verify Deploy Complete CYCLE TIME
  • 42.
    35 30 25 20 15 10 5 0 8/20/14 8/21/14 8/22/14 8/25/14 8/26/14 8/27/14 8/28/14 8/29/14 9/1/14 9/2/14 9/3/14 9/4/14 9/5/14 9/8/14 9/9/14 Ready Design Implement Verify Deploy Complete LEAD TIME
  • 43.
    35 30 25 20 15 10 5 0 8/20/14 8/21/14 8/22/14 8/25/14 8/26/14 8/27/14 8/28/14 8/29/14 9/1/14 9/2/14 9/3/14 9/4/14 9/5/14 9/8/14 9/9/14 Ready Design Implement Verify Deploy Complete Limiting WIP? QUANTITY IN QUEUE
  • 44.
    35 30 25 20 15 10 5 0 8/20/14 8/21/14 8/22/14 8/25/14 8/26/14 8/27/14 8/28/14 8/29/14 9/1/14 9/2/14 9/3/14 9/4/14 9/5/14 9/8/14 9/9/14 Ready Design Implement Verify Deploy Complete QUANTITY IN QUEUE WIP Constraint
  • 45.
    35 30 25 20 15 10 5 0 8/20/14 8/21/14 8/22/14 8/25/14 8/26/14 8/27/14 8/28/14 8/29/14 9/1/14 9/2/14 9/3/14 9/4/14 9/5/14 9/8/14 9/9/14 Ready Design Implement Verify Deploy Complete QUANTITY IN QUEUE WIP Constraint
  • 46.
    35 30 25 20 15 10 5 0 PREVIOUS CYCLE TIME VS NEW CYCLE TIME 8/20/14 8/21/14 8/22/14 8/25/14 8/26/14 8/27/14 8/28/14 8/29/14 9/1/14 9/2/14 9/3/14 9/4/14 9/5/14 9/8/14 9/9/14 Ready Design Implement Verify Deploy Complete QUANTITY IN QUEUE WIP Constraint
  • 47.
  • 48.
    Manage Flow usingLittle’s law Throughput = WIP Lead Time http://www.slideshare.net/wwiedenroth?utm_campaign=profiletracking&utm_medium=sssite&utm_source=ssslideview
  • 49.
    Manage Flow usingLittle’s law Calculate Project Lead Time Project Lead Time = N. of Flow Units Average Lead Time Average WIP = 500 10 days 8 items = 125 weeks http://www.slideshare.net/wwiedenroth?utm_campaign=profiletracking&utm_medium=sssite&utm_source=ssslideview
  • 50.
    Manage Flow usingLittle’s law Project Scope End Date 20% 60% 20%
  • 51.
  • 53.
    1. Demand 1.Escalation 2. Throttle 2. Service More tools 1. T-Shape resources 2. SWAT Team 3. Part-time resources 4. Training & Cross-training
  • 54.
    Summary of ideas Cycle Time 12 10 8 6 4 2 0 VARIABILITY - Histograms 35 30 25 20 QUEUES – 15 10 CFD, WIP and 5 Little formula 0 8/20/14 8/21/14 8/22/14 8/25/14 8/26/14 8/27/14 8/28/14 8/29/14 9/1/14 9/2/14 9/3/14 9/4/14 9/5/14 9/8/14 9/9/14 Ready Design Implement Verify Deploy Complete
  • 55.
  • 56.
    More about me Pablo Domingo @pavleras Becomingagile.wordpress.com

Editor's Notes

  • #5  ----- Meeting Notes (26/11/14 14:55) ----- DESPACIO
  • #6  ----- Meeting Notes (26/11/14 14:55) ----- Innovation Competitive advantage Reducing cycle time
  • #9 ARBITRARY deadlines SPECIALIST bottlenecks OVERTIME
  • #10 ARBITRARY deadlines SPECIALIST bottlenecks OVERTIME
  • #11  ----- Meeting Notes (26/11/14 14:55) ----- feature creep
  • #13  ----- Meeting Notes (26/11/14 14:55) ----- REWORK
  • #20  ----- Meeting Notes (26/11/14 15:05) ----- monitorize system's events
  • #21  ----- Meeting Notes (26/11/14 15:05) ----- horizontal = tiempo vertical = variable
  • #23  ----- Meeting Notes (26/11/14 15:05) ----- Determine if process is in Statistical Process Control
  • #24  ----- Meeting Notes (26/11/14 15:05) ----- Continuous improvement