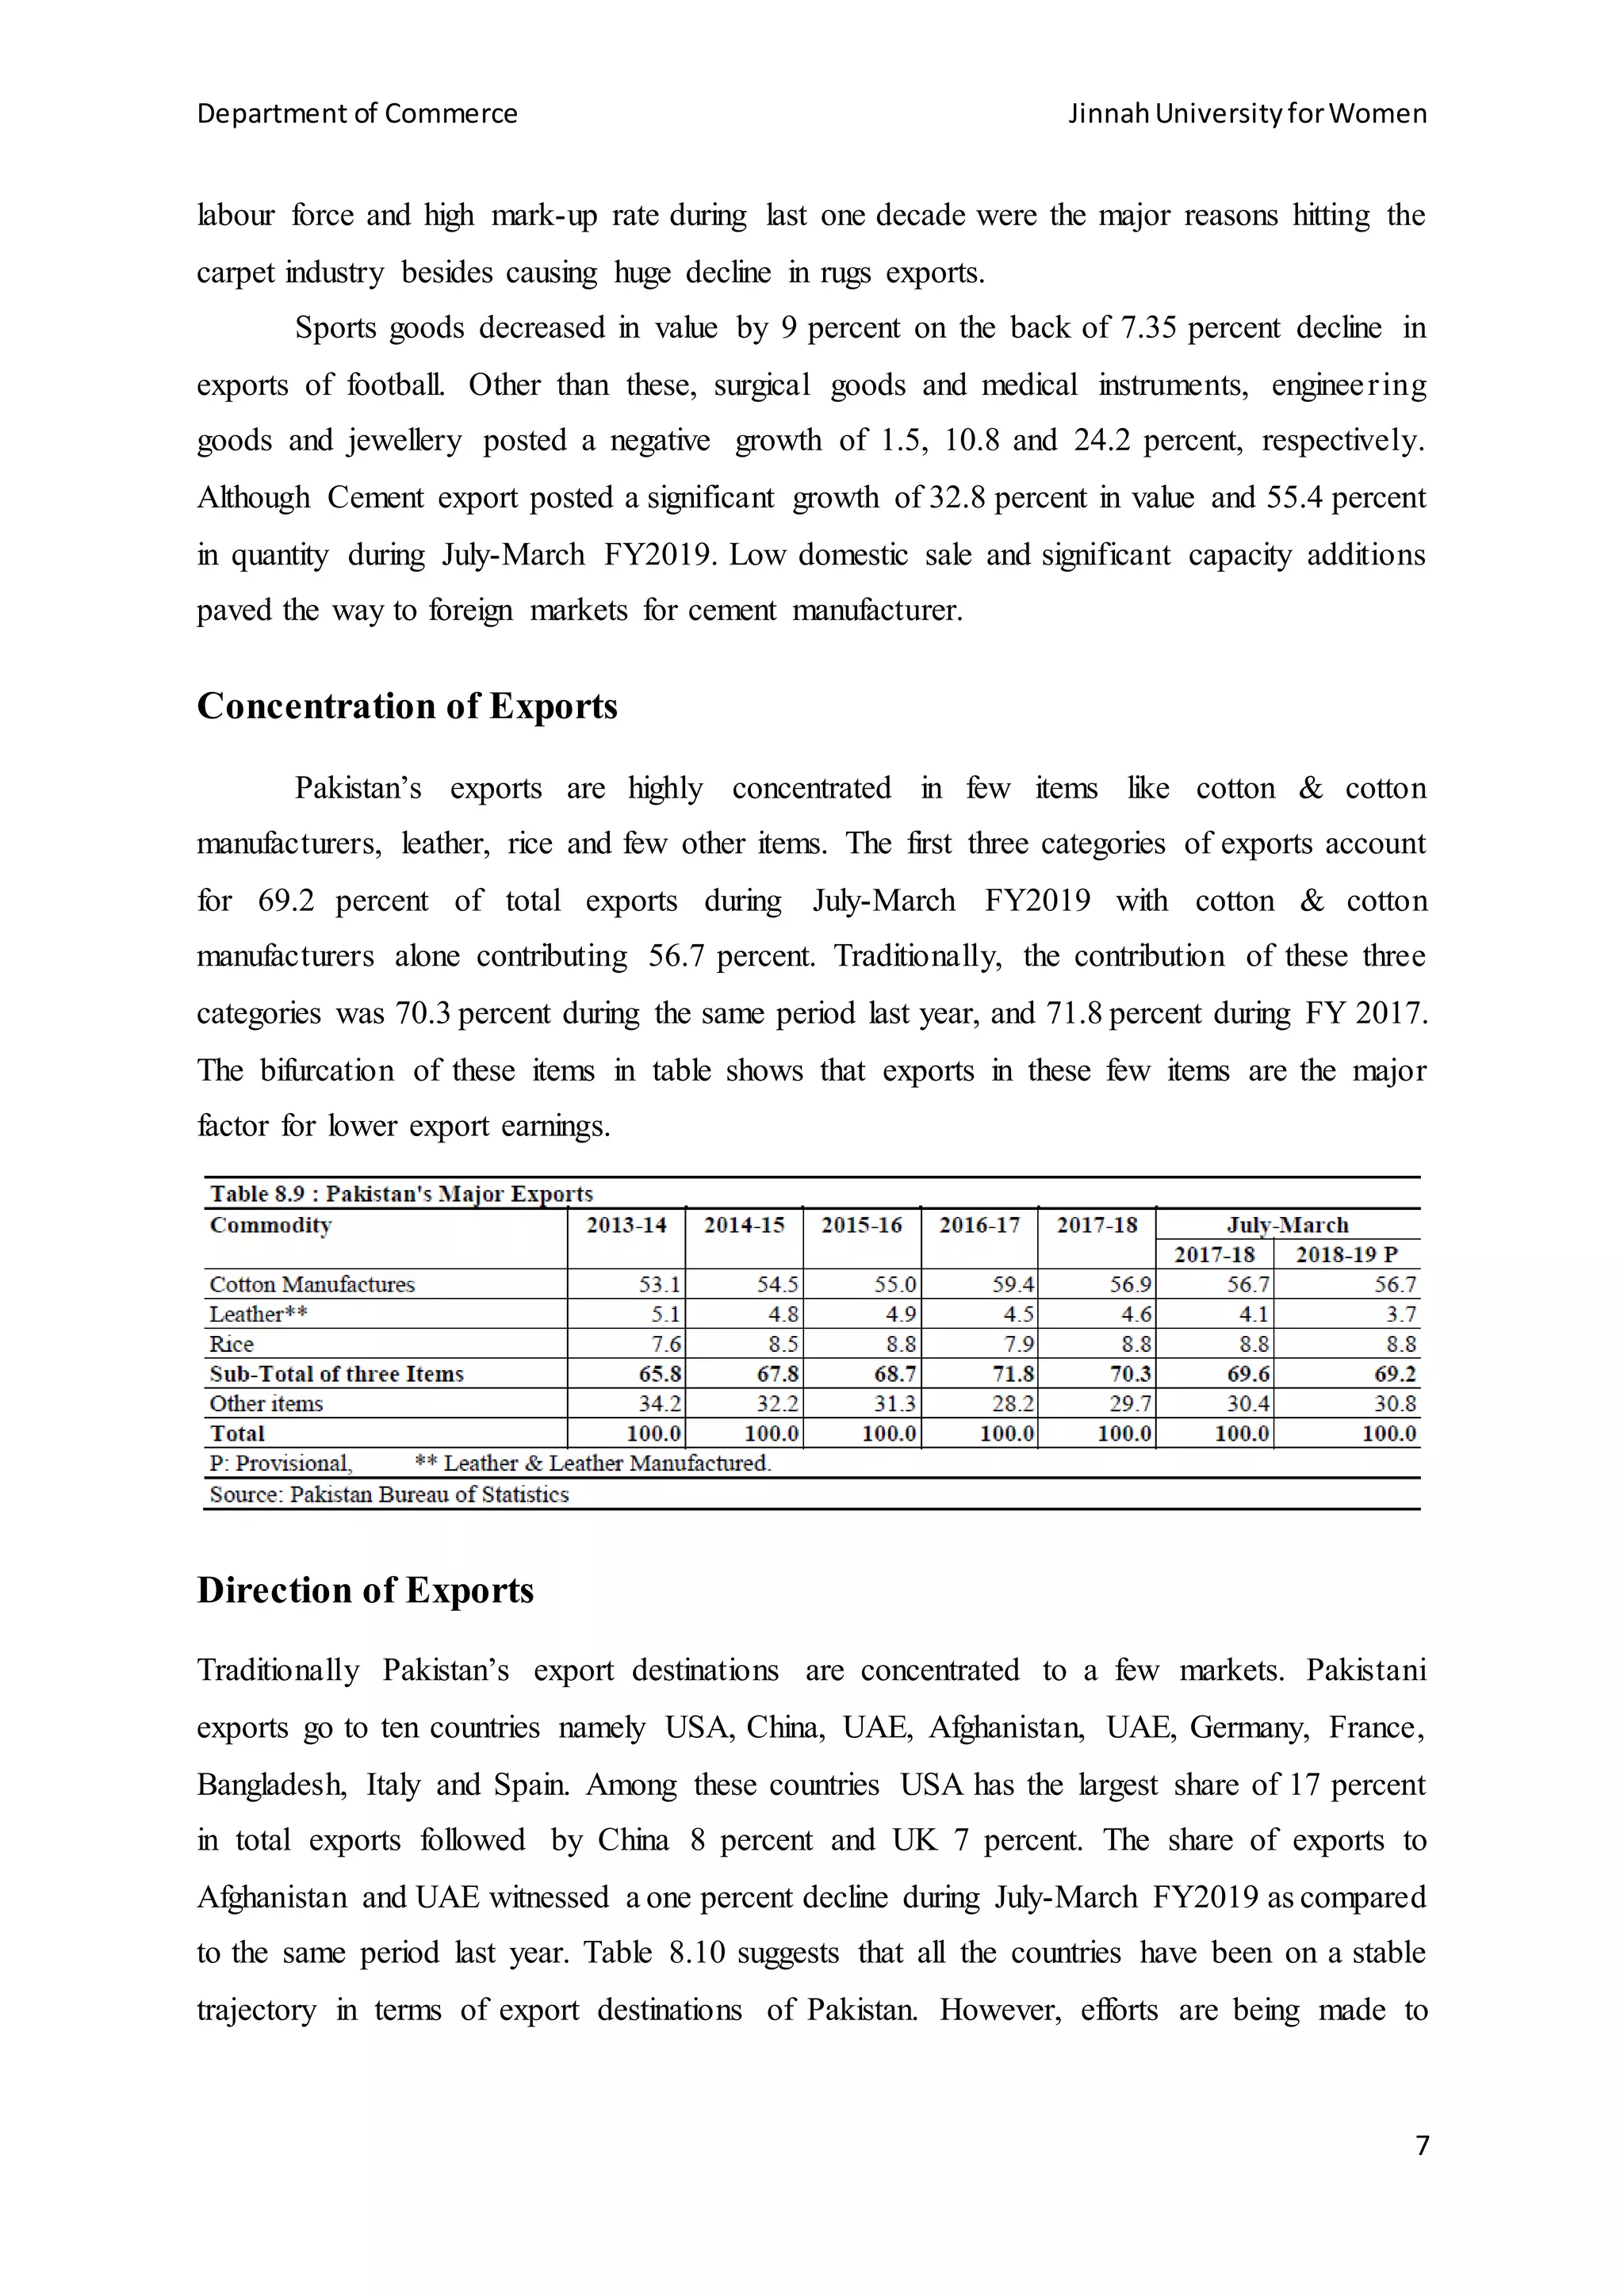
SlideShare a Scribd company logo
Department of Commerce JinnahUniversityforWomen
1
JINNAH UNIVERSITY FOR WOMEN
DEPARTMENT OF COMMERCE
ASSIGNMENT
IMPORTS AND EXPORTS OF PAKISTAN
NAME
WAJIHA MUHAMMAD ISMAIL
DEGREE PROGRAM
BS-COMMERCE (SECOND YEAR)
SUBJECT
ECONOMIC ISSUES OF PAKISTAN
SUBMISSION DATE:
JUNE 30, 2020
SUBMITTED TO:
MISS MEHWISH ZIA
Department of Commerce JinnahUniversityforWomen
2
Table of Contents
Exports .......................................................................................................................................3
Merchandise Exports..................................................................................................................4
Concentration of Exports ...........................................................................................................7
Direction of Exports...................................................................................................................7
Imports .......................................................................................................................................8
Direction of Imports.................................................................................................................11
Conclusion ...............................................................................................................................12
References................................................................................................................................13
Department of Commerce JinnahUniversityforWomen
3
Exports
The current government is focusing on making the exports a driver of sustainable
economic growth. It is endeavouring to improve competitiveness and efficiency of the industry
especially export oriented sector and import substituting production, reducing structural
anomalies and improving trade by increasing institutional efficiencies and reducing cost of
doing business.
The export target for FY 2019 was set at US$ 28 billion. Exports registered a decline
of 0.1 percent growth during July-April FY 2019. As per PBS data, exports during July-April
FY 2019 reached to US$ 19.17 billion as compared to US$ 19.19 in July-April FY 2018. A
slowdown in economic growth in the EU, along with spill overs from US-China trade tensions,
led to subdued performance in exports. Textile sector remained the most vulnerable sector in
these global headwinds.
Monthly analysis shows that global synchronized slowdown has started hitting our
economy. After showing some resilience exports started to retreat. However, March 2018
showed a phenomenal growth with US$ 2.2 billion exports in one month so it was expected
that the March 2019 might not be that much phenomenal. April 2019 has registered highest
export figure in the current fiscal year. It is pertinent to note that exports remained above US$
2 billion in four months of FY2019. However, overall exports have got dampened due to global
headwinds.
The government has taken number of initiatives like economic reform package (2019),
supply of gas and electricity to zero rated industry at lower cost, continuation of prime
minister’s export package of 2017, sales tax refunds and duty drawbacks, incentive package
(2019) and formulation of Strategic Trade Policy Framework (2018-2023). Government has
reduced cost of production of textile sector by abolishing regulatory duty on cotton imports.
Department of Commerce JinnahUniversityforWomen
4
Moreover, second free trade agreement has been signed with China, providing tariff
concessions to 313 items. Pakistan is expanding its marketing and trade promotion campaign
to all the major markets.
The State Bank of Pakistan has maintained low rates for export refinancing schemes
and fixed investment to allow export sector industries to make investments on competitive
basis.
In order to increase exports, the government has continued the five export-oriented
sectors - including textile, leather, sports goods, surgical goods and carpets - as part of zero-
rated sales tax regime. Devaluation has surely increased the cost of imported raw materials.
However, this has been largely offset by the generous export incentives provided including
larger export rebates, withdrawal of import duties on inputs of raw materials and intermediate
goods and, more recently, the issuance of promissory notes against refunds due along with
subsidies on gas and electricity consumed. All these measures likely to pay dividend with lag
effect.
Merchandise Exports
During July-March FY2019, the exports reached to US$ 17.07 billion as compared to
US$ 17.06 billion in the same period last year, which shows a meagre growth of 0.1 percent as
compared to 11.6 percent growth same period last year.
Disaggregated analysis suggests that performance of all the groups including food
group, textile group, petroleum group and other manufactured groups remained subdued in the
current fiscal year on the account of global headwinds.
Department of Commerce JinnahUniversityforWomen
5
Food group constituting 19.6 percent of overall exports posted a decline of 2.4 percent
as compared to same period last year. Within the food group, export of rice comprises 44.4
percent of total food group declined by 0.5 percent causing a major setback in overall food
exports. The quantum drop in rice was 5.0 percent, but its value declined by 0.5 percent. This
underwhelming picture is attributed to the competition faced by Pakistan from its competitors
like Africa and China. Pakistani exporters are facing tough time against Chinese competitors
as they are offloading their stock at lower prices.
However, to tackle this situation government is taking necessary steps including
reclaiming traditional markets besides accessing to new markets. Removal of restriction by
Qatar on Pakistani rice export is a step in this direction that will reclaim Pakistan’s share in the
global rice market. Moreover, China has agreed to give duty free access to 200,000 tons of rice
from Pakistan in the current calendar year. Among other products fruits, capturing the second
highest position in food group, posted a growth of 8.7 percent in value during the current fiscal
year. Pakistan managed to explore new international markets for this group by participating in
Berlin fair.
The other important components of food group which registered a growth include oil
seeds, nuts & kernels, spices and wheat. Sugar exports declined by 68.2 percent on account of
the withdrawal of subsidies and completion of earlier announced quotas.
Exports of textile manufacturers, which accounts 58.5 percent in total exports witnessed
a trivial growth of 0.1 percent and remained at US$ 9.99 billion in July-March FY2019 as
compared to US$ 9.98 billion during the same period last year. Within the group, knitwear and
Department of Commerce JinnahUniversityforWomen
6
bed wear registered a growth but it was offset by the decline in cotton yarn and cotton cloth.
Low demand from EU and lower unit prices, particularly for knitwear, contributed to the
lacklustre performance of this group. Textile trade agreements have been signed at Texport
Pakistan 2019 which will support textile exports.
Export of the textile items like knitwear comprises 12.6 percent of total exports and
21.6 percent of textile exports increased in both quantity and value by 14.8 and 9.29 percent
respectively. Readymade garments with 11.5 percent share in total exports and 19.6 percent
share in textile exports registered a growth of 2 percent in value and 28.1 percent in quantity.
Value-added exports increased due to growing demand and improvement in export
competitiveness after exchange rate adjustment.
Cotton cloth having 9.3 percent share in total exports and 16 percent in textile exports
declined by 2.1 percent in value, but its quantum increase was 18.1 percent. Bed wear with a
share of 10.1 percent in exports and 17.21 percent in textile group, increased both in quantity
and in value by 10.3 percent and 2.7 percent, respectively. Cotton yarn has 4.9 percent share in
total exports and 8.35 percent in textile group, decreased in both quantity and value by 15.7
percent and 15.4 percent, respectively.
Towels having share of 3.4 percent in total exports and 5.88 percent share in textile
group, decreased both in quantity and in value by 11.0 percent and 1.8 percent, respectively.
Raw cotton having a share of 0.1 percent in total exports and 0.16 percent in textile
group, decreased in both quantity and value by 71.2 percent and 71.8 percent, respectively.
May be due to declining international cotton prices from 2.15 $/kg in June 2018 to 1.92 $/kg
in April 2019.
Petroleum group having a negligible share of 2 percent in total exports registered a
negative growth of 0.2 percent on account of 7.6 percent decline in petroleum exports.
Other manufacturers accounting 14.6 percent of total exports registered a negative
growth of 1.5 percent during the period July-March FY2019.
Within the group chemical and pharmaceutical products, bearing the largest share in
the group, posted a growth of 5.7 percent in value. This is the only category showing significant
growth in the group. Leather manufacturers continues to struggle but registered a negative
growth of 8.4 percent in value. 21. percent decline in value is witnessed in leather tanned while
its quantity decreased by 19 percent.
Exports of carpets, rugs and mats registered a negative growth of 12.5 percent in value.
The acute shortage of electricity, bad law and order, ever-soaring inflation, shortage of skilled
Department of Commerce JinnahUniversityforWomen
7
labour force and high mark-up rate during last one decade were the major reasons hitting the
carpet industry besides causing huge decline in rugs exports.
Sports goods decreased in value by 9 percent on the back of 7.35 percent decline in
exports of football. Other than these, surgical goods and medical instruments, engineering
goods and jewellery posted a negative growth of 1.5, 10.8 and 24.2 percent, respectively.
Although Cement export posted a significant growth of 32.8 percent in value and 55.4 percent
in quantity during July-March FY2019. Low domestic sale and significant capacity additions
paved the way to foreign markets for cement manufacturer.
Concentration of Exports
Pakistan’s exports are highly concentrated in few items like cotton & cotton
manufacturers, leather, rice and few other items. The first three categories of exports account
for 69.2 percent of total exports during July-March FY2019 with cotton & cotton
manufacturers alone contributing 56.7 percent. Traditionally, the contribution of these three
categories was 70.3 percent during the same period last year, and 71.8 percent during FY 2017.
The bifurcation of these items in table shows that exports in these few items are the major
factor for lower export earnings.
Direction of Exports
Traditionally Pakistan’s export destinations are concentrated to a few markets. Pakistani
exports go to ten countries namely USA, China, UAE, Afghanistan, UAE, Germany, France,
Bangladesh, Italy and Spain. Among these countries USA has the largest share of 17 percent
in total exports followed by China 8 percent and UK 7 percent. The share of exports to
Afghanistan and UAE witnessed a one percent decline during July-March FY2019 as compared
to the same period last year. Table 8.10 suggests that all the countries have been on a stable
trajectory in terms of export destinations of Pakistan. However, efforts are being made to
Department of Commerce JinnahUniversityforWomen
8
explore new markets where lots of potential exists. Formulation of Strategic Trade Policy
Framework (2019-24) is a way forward towards securing more international markets’ access.
Imports
Import target for FY2019 was set to US$ 56.5 billion. As per PBS data, imports stood
at US$ 45.471 billion in July-April FY2019 as compared to US$ 49.360 billion in the same
period last year showing a decline of 7.9 percent. The reduction in imports is due to decrease
in imports of furnace oil, machinery & electric equipment, palm oil and textiles. Current
scenario of declining imports shows that imports will be according to the estimates. With the
falling global demand, weakening consumer and business sentiment among the major
economies, trade tensions and economic stabilization measures at home, the imports are
expected to be further decrease.
Additionally, the government has launched import substitution drive that will be
instrumental in reducing pressure on current account. The Finance Supplementary (Second
Amendment) Act, 2019 particularly offered tariff concessions to those industries that can offer
import substitution. It lowered tariffs on the raw materials and intermediate goods that can help
local firms in meeting local demand that is currently being fulfilled by the foreign firms.
Department of Commerce JinnahUniversityforWomen
9
Year on year analysis shows that government’s import contractions measures have
started delivering early results. Imports have been continuously declining on year on year basis
and March FY2019 has witnessed a tremendous decrease of 21 percent as compared to March
FY2018 followed by January FY2019 with 20 percent decline as compare to January FY2018.
Fig 8.3 shows that import reduction drive led by recent government started picking up the pace
since October FY2019.
Disaggregated analysis reveals that all the groups including food group, machinery
group, petroleum good, consumer durables and raw materials witnessed hefty decline in
imports during the current fiscal year.
Department of Commerce JinnahUniversityforWomen
10
Food group constitutes 10.5 percent of overall import bill. Food import bill stood at
US$ 4.261 billion in first nine months of FY2019 as compared to US$ 4.730 billion in the same
period last year. Hence witnessed a significant decline of 9.9 percent. Within the group heaviest
decline has been observed in imports of dry fruits, sugar, edible oil (soybeans and palm oil)
and spices by 64.7, 24.8, 12.1 and 8.5 respectively. Although a quantum increase in palm oil
has been witnessed during the period. Yet, lower international palm oil prices also suppressed
import values.
Other mentionable items in the group are tea, milk & related items and pulses. All of
these showed negative trend of 1.1, 6.1 and 3.6 respectively. Declined imports in this sector
can also be attributed to the SRO issued by the government, demanding the proper labelling
requirements on the fastmoving consumer goods accompanied with Halal certificate.
Machinery group with a 16.5 percent share in overall imports declined by 29.9 percent
to US$ 4.604 billion, pushing down the import bill. Import of power generating machinery
declined by 49 percent in July-March FY2019 as compared to the same period last year. A
sharp pull back in power generating machinery drove most of the decline machinery import
bill. Early harvest of CPEC projects and cut in PSDP spending contributed to the low
machinery import bill.
Office and textile machinery decreased by 4.4 and 10.61 respectively in first nine
months of FY2019. Construction and mining machinery import decreased by 24.3 percent
mainly because of the slowdown in construction activities in the given period. Agriculture
machinery import is the only segment with a growth of 4.7 percent. This seems to be on account
of present government initiatives to enhance agriculture production under Prime Minister
Agriculture Emergency Plan.
Transport group with 5.1 percent share in total imports declined by 35.7 percent. With
a hefty decline of 15.8 percent in road motor vehicles.
Department of Commerce JinnahUniversityforWomen
11
Petroleum group, being the largest contributor to total import bill, declined by 4.7
percent in July- March FY2019 as compared to the previous period last year and stood at US$
8.002 billion as compare to US$ 8.393 billion in the corresponding period last year. Among
the petroleum group, petroleum products declined by 15.3 percent in value while 33.9 percent
in quantity which is stemmed from the Pak rupee depreciation. Import bill of the petroleum
crude increased by 15.2 percent despite a 14.5 percent decline in quantum import because of
higher international oil prices. So, a heavy decline in quantum import completely offset the
decline in import of crude oil. Refineries have curtailed their crude oil imports to prevent a glut
of domestic furnace oil from building up as a result of crude refining process.
In textile group, import of raw material decreased both in quantity and value by 32.37
and 28.11 percent respectively during July-March FY2019 as compared to the same period last
year. The import bill of fertilizers increased in both quantity and value by 5.01 and 16.4 percent
respectively on the back of lower domestic production. Fertilizer import increased to
supplement the stock and to meet up the demands for Rabi and Kharif crops.
Iron & steel scrap and iron & steel import bill decreased by 4.8 and 10 percent
respectively. Lower construction activity and PSDP spending have urged local steel industry
to curtail their production which has ultimately lowered the demand for imported raw material.
The import bill of telecommunication group decreased by 8.9 percent to US$ 1.031
billion in July-March FY2019. The import of mobile handsets decreased by 7.6 percent in the
said period as compared to 14.5 percent increase in the same period last year. Import duties on
mobile sets contributed to this positive development. Import of the other apparatus also
decreased by 10.28 percent in July-March FY2019 as compared to same period last year.
Direction of Imports
Like exports, Pakistan’s imports are also concentrated to few countries. Based on the
current year data around 65 percent of total imports originated from countries like China, UAE,
Saudi Arabia, Kuwait, Indonesia, India, USA, Japan, Germany and Malaysia. China being the
largest import destination accounts for the 24 percent of total imports. Share of import from
UAE has increased from 12 percent in FY2018 to 14 percent in FY2019. Change in Pakistan’s
import pattern is shown in the table 8.13:
Department of Commerce JinnahUniversityforWomen
12
Conclusion
Although expansionary monetary policy in recent years, business activities and export-
oriented sector had not been happening as it should be rather exports remained low after seeing
higher growth in 2013-14. The present government is sternly focused on enhancing exports
and in this direction taken various initiatives with respect to adjustment of exchange rates and
monetary tightening.
Imports during Jul-Apr FY2019 declined by 4.9 percent while worker’s remittances
increased by 8.45 percent. This proved to be a major support to the current account balance
which improved by 26.9 percent during the period. However, exports remained a source of
concern as they declined during Jul-Apr FY2019.
There is a continuous increase in the flows of credit to private sector in manufacturing
and export-oriented industry which is a welcome development in terms of business activities.
However, the downside risk of the impact of continuous rise in policy rate and global slowdown
in trade activities may influence the exports.
Financial account posted a surplus of US$ 11.32 billion during Jul-Apr FY2019. The
improvement is mainly due to the bilateral inflows from China, India and UAE. However,
foreign investment remained low during the period after a consistent increase over the last three
years under CPEC. This is because of the completion of early harvest projects under CPEC.
There is a need to implement a range of structural reforms including growth enhancing
fiscal consolidation, reducing cost of doing business, attracting foreign private investments,
exploiting the potential of Pakistani diaspora, introduction of effective and responsive foreign
exchange regime, and most importantly, focus on enhancing exports through improving
productivity at different stages of production. Moreover, integrating the domestic production
Department of Commerce JinnahUniversityforWomen
13
with global value change, research and development, technology up-gradation, value addition
and branding will help in increasing the exports.
The establishment of special economic zone and free trade zone at Gwadar will enhance
export growth and access to regional markets going forward. The trade diplomacy also needs
to be strengthened.
References
http://www.finance.gov.pk/survey_1819.html

More Related Content

What's hot

impact of trade policy of Pakistan on imports and exports of Pakistan
impact of trade policy of Pakistan on imports and exports of Pakistanimpact of trade policy of Pakistan on imports and exports of Pakistan
impact of trade policy of Pakistan on imports and exports of Pakistan
Nouman Rafique
 
India’s foreign trade policy 1
India’s foreign trade policy 1 India’s foreign trade policy 1
India’s foreign trade policy 1
StudsPlanet.com
 
TRADE POLICY OF PAKISTAN
TRADE POLICY OF PAKISTANTRADE POLICY OF PAKISTAN
TRADE POLICY OF PAKISTAN
Neelam Asad
 
Final Article
Final ArticleFinal Article
Final Article
Jom Jacob
 
Ift trends and direction
Ift trends and directionIft trends and direction
Ift trends and direction
StudsPlanet.com
 
10_Trade & Poverty Link_Garment
10_Trade & Poverty Link_Garment10_Trade & Poverty Link_Garment
10_Trade & Poverty Link_Garment
Samsen Neak
 

What's hot (20)

impact of trade policy of Pakistan on imports and exports of Pakistan
impact of trade policy of Pakistan on imports and exports of Pakistanimpact of trade policy of Pakistan on imports and exports of Pakistan
impact of trade policy of Pakistan on imports and exports of Pakistan
 
Trade policy
Trade policyTrade policy
Trade policy
 
Trade policy of pakistan
Trade policy of pakistanTrade policy of pakistan
Trade policy of pakistan
 
Exim intro
Exim introExim intro
Exim intro
 
International trade flows of pakistan
International trade flows of pakistanInternational trade flows of pakistan
International trade flows of pakistan
 
Pakistan’s Exports Sector: Challenges and Response
Pakistan’s Exports Sector: Challenges and ResponsePakistan’s Exports Sector: Challenges and Response
Pakistan’s Exports Sector: Challenges and Response
 
export import Policy
export import Policyexport import Policy
export import Policy
 
Trade policies of pakistan
Trade policies of pakistanTrade policies of pakistan
Trade policies of pakistan
 
Trade Policy and Regulation of India
Trade Policy and Regulation of IndiaTrade Policy and Regulation of India
Trade Policy and Regulation of India
 
Trade sector of Pakistan
Trade sector of PakistanTrade sector of Pakistan
Trade sector of Pakistan
 
India’s foreign trade policy 1
India’s foreign trade policy 1 India’s foreign trade policy 1
India’s foreign trade policy 1
 
NON-TEXTILE MAJOR EXPORTS OF PAKISTAN
NON-TEXTILE MAJOR EXPORTS OF PAKISTANNON-TEXTILE MAJOR EXPORTS OF PAKISTAN
NON-TEXTILE MAJOR EXPORTS OF PAKISTAN
 
Industry sustainity and worker's job security during pandemic
Industry sustainity and worker's job security during pandemicIndustry sustainity and worker's job security during pandemic
Industry sustainity and worker's job security during pandemic
 
TRADE POLICY OF PAKISTAN
TRADE POLICY OF PAKISTANTRADE POLICY OF PAKISTAN
TRADE POLICY OF PAKISTAN
 
Final Article
Final ArticleFinal Article
Final Article
 
Exim policy of india.
Exim policy of india.Exim policy of india.
Exim policy of india.
 
Ift trends and direction
Ift trends and directionIft trends and direction
Ift trends and direction
 
India foreign trade policy
India foreign trade policy India foreign trade policy
India foreign trade policy
 
10_Trade & Poverty Link_Garment
10_Trade & Poverty Link_Garment10_Trade & Poverty Link_Garment
10_Trade & Poverty Link_Garment
 
Textile exports
Textile exportsTextile exports
Textile exports
 

Similar to Import and Export of Pakistan report

crisis-in-textile-industry
crisis-in-textile-industrycrisis-in-textile-industry
crisis-in-textile-industry
Anjan Banda
 
08 trade and_payments
08 trade and_payments08 trade and_payments
08 trade and_payments
prettytluxe
 
Foreign trade policy 2009 14
Foreign trade policy 2009 14Foreign trade policy 2009 14
Foreign trade policy 2009 14
Belinda Francis
 

Similar to Import and Export of Pakistan report (20)

crisis-in-textile-industry
crisis-in-textile-industrycrisis-in-textile-industry
crisis-in-textile-industry
 
08 trade and_payments
08 trade and_payments08 trade and_payments
08 trade and_payments
 
Overview of Pakistan textile industry
Overview of Pakistan textile industryOverview of Pakistan textile industry
Overview of Pakistan textile industry
 
Financial Management Research on BD Economy
Financial Management Research on BD EconomyFinancial Management Research on BD Economy
Financial Management Research on BD Economy
 
Rezuan anzum rifat 18 eco 016
Rezuan anzum rifat 18 eco 016Rezuan anzum rifat 18 eco 016
Rezuan anzum rifat 18 eco 016
 
An assignment on INTERMEDIATE MACROECONOMICS
An assignment on INTERMEDIATE MACROECONOMICSAn assignment on INTERMEDIATE MACROECONOMICS
An assignment on INTERMEDIATE MACROECONOMICS
 
Pakistan textile industry challenges
Pakistan textile industry challengesPakistan textile industry challenges
Pakistan textile industry challenges
 
MAJOR IMPORTS AND EXPORTS OF PAKISTAN
MAJOR IMPORTS  AND EXPORTS OF PAKISTANMAJOR IMPORTS  AND EXPORTS OF PAKISTAN
MAJOR IMPORTS AND EXPORTS OF PAKISTAN
 
China and pakistan. abuzar
China and pakistan. abuzarChina and pakistan. abuzar
China and pakistan. abuzar
 
Challenges of Apparel Exports from India - Presentation @ Indian Institute...
Challenges of Apparel Exports from India   - Presentation @  Indian Institute...Challenges of Apparel Exports from India   - Presentation @  Indian Institute...
Challenges of Apparel Exports from India - Presentation @ Indian Institute...
 
The Covid.docx
The Covid.docxThe Covid.docx
The Covid.docx
 
Foreign trade policy 2009 14
Foreign trade policy 2009 14Foreign trade policy 2009 14
Foreign trade policy 2009 14
 
Economy of Bangladesh
Economy of BangladeshEconomy of Bangladesh
Economy of Bangladesh
 
Import Export of Pakistan
Import Export of  Pakistan Import Export of  Pakistan
Import Export of Pakistan
 
Why export is important to economy
Why export is important to economyWhy export is important to economy
Why export is important to economy
 
Review of FBR Export Exemption Schemes
Review of FBR Export Exemption Schemes Review of FBR Export Exemption Schemes
Review of FBR Export Exemption Schemes
 
Monthly newsletter-jul-2019
Monthly newsletter-jul-2019Monthly newsletter-jul-2019
Monthly newsletter-jul-2019
 
Role of the Cotton Textiles Export Promotion Council (TEXPROCIL) In the Devel...
Role of the Cotton Textiles Export Promotion Council (TEXPROCIL) In the Devel...Role of the Cotton Textiles Export Promotion Council (TEXPROCIL) In the Devel...
Role of the Cotton Textiles Export Promotion Council (TEXPROCIL) In the Devel...
 
Covid-19 and decline in export of Readymade Garments in Bangladesh
Covid-19 and decline in export of Readymade Garments in BangladeshCovid-19 and decline in export of Readymade Garments in Bangladesh
Covid-19 and decline in export of Readymade Garments in Bangladesh
 
VCOSA - VIETNAM COTTON - YARN MARKET REPORT - 02/2023 ISSUE
VCOSA - VIETNAM COTTON - YARN MARKET REPORT - 02/2023 ISSUEVCOSA - VIETNAM COTTON - YARN MARKET REPORT - 02/2023 ISSUE
VCOSA - VIETNAM COTTON - YARN MARKET REPORT - 02/2023 ISSUE
 

More from Wajiha Muhammad Ismail

Pakistan Economy and Pakistan Stock Exchange
Pakistan Economy and Pakistan Stock ExchangePakistan Economy and Pakistan Stock Exchange
Pakistan Economy and Pakistan Stock Exchange
Wajiha Muhammad Ismail
 

More from Wajiha Muhammad Ismail (20)

Pakistan Economy and Pakistan Stock Exchange
Pakistan Economy and Pakistan Stock ExchangePakistan Economy and Pakistan Stock Exchange
Pakistan Economy and Pakistan Stock Exchange
 
Investment and Portfolio Management
Investment and Portfolio ManagementInvestment and Portfolio Management
Investment and Portfolio Management
 
International Business Analysis of Netflix
International Business Analysis of NetflixInternational Business Analysis of Netflix
International Business Analysis of Netflix
 
Financial Institution and Regulation
Financial Institution and Regulation Financial Institution and Regulation
Financial Institution and Regulation
 
International Business
International BusinessInternational Business
International Business
 
Cost and Management Accounting
Cost and Management AccountingCost and Management Accounting
Cost and Management Accounting
 
Managerial Economics Problems
Managerial Economics ProblemsManagerial Economics Problems
Managerial Economics Problems
 
Junaid Jamshed (J.)
Junaid Jamshed (J.)Junaid Jamshed (J.)
Junaid Jamshed (J.)
 
Junaid Jamshed (J.) Operations
Junaid Jamshed (J.) OperationsJunaid Jamshed (J.) Operations
Junaid Jamshed (J.) Operations
 
Financial Accounting Problems
Financial Accounting ProblemsFinancial Accounting Problems
Financial Accounting Problems
 
Advanced Accounting Problems
Advanced Accounting ProblemsAdvanced Accounting Problems
Advanced Accounting Problems
 
During the past some years, we see many ads clutter on TV. Do you think it cr...
During the past some years, we see many ads clutter on TV. Do you think it cr...During the past some years, we see many ads clutter on TV. Do you think it cr...
During the past some years, we see many ads clutter on TV. Do you think it cr...
 
Ads Clutter
Ads ClutterAds Clutter
Ads Clutter
 
Sample Test
Sample TestSample Test
Sample Test
 
Technical Writing and Presentation Skills
Technical Writing and Presentation SkillsTechnical Writing and Presentation Skills
Technical Writing and Presentation Skills
 
Organizational Behavior and Psychology
Organizational Behavior and PsychologyOrganizational Behavior and Psychology
Organizational Behavior and Psychology
 
Retail Merchandising Wars and XYZ Corporation
Retail Merchandising Wars and XYZ CorporationRetail Merchandising Wars and XYZ Corporation
Retail Merchandising Wars and XYZ Corporation
 
Analyzing Company Performance using Ratios
Analyzing Company Performance using RatiosAnalyzing Company Performance using Ratios
Analyzing Company Performance using Ratios
 
Emotional intelligence
Emotional intelligenceEmotional intelligence
Emotional intelligence
 
Nationalism Document
Nationalism DocumentNationalism Document
Nationalism Document
 

Recently uploaded

一比一原版BCU毕业证伯明翰城市大学毕业证成绩单如何办理
一比一原版BCU毕业证伯明翰城市大学毕业证成绩单如何办理一比一原版BCU毕业证伯明翰城市大学毕业证成绩单如何办理
一比一原版BCU毕业证伯明翰城市大学毕业证成绩单如何办理
ydubwyt
 
NO1 Uk Black Magic Specialist Expert In Sahiwal, Okara, Hafizabad, Mandi Bah...
NO1 Uk Black Magic Specialist Expert In Sahiwal, Okara, Hafizabad,  Mandi Bah...NO1 Uk Black Magic Specialist Expert In Sahiwal, Okara, Hafizabad,  Mandi Bah...
NO1 Uk Black Magic Specialist Expert In Sahiwal, Okara, Hafizabad, Mandi Bah...
Amil Baba Dawood bangali
 
一比一原版Adelaide毕业证阿德莱德大学毕业证成绩单如何办理
一比一原版Adelaide毕业证阿德莱德大学毕业证成绩单如何办理一比一原版Adelaide毕业证阿德莱德大学毕业证成绩单如何办理
一比一原版Adelaide毕业证阿德莱德大学毕业证成绩单如何办理
zsewypy
 
Introduction to Economics II Chapter 28 Unemployment (1).pdf
Introduction to Economics II Chapter 28 Unemployment (1).pdfIntroduction to Economics II Chapter 28 Unemployment (1).pdf
Introduction to Economics II Chapter 28 Unemployment (1).pdf
Safa444074
 
Latino Buying Power - May 2024 Presentation for Latino Caucus
Latino Buying Power - May 2024 Presentation for Latino CaucusLatino Buying Power - May 2024 Presentation for Latino Caucus
Latino Buying Power - May 2024 Presentation for Latino Caucus
Danay Escanaverino
 

Recently uploaded (20)

一比一原版BCU毕业证伯明翰城市大学毕业证成绩单如何办理
一比一原版BCU毕业证伯明翰城市大学毕业证成绩单如何办理一比一原版BCU毕业证伯明翰城市大学毕业证成绩单如何办理
一比一原版BCU毕业证伯明翰城市大学毕业证成绩单如何办理
 
where can I sell pi coins at the best rate (Market Price)
where can I sell pi coins at the best rate (Market Price)where can I sell pi coins at the best rate (Market Price)
where can I sell pi coins at the best rate (Market Price)
 
how to sell pi coins at high rate quickly.
how to sell pi coins at high rate quickly.how to sell pi coins at high rate quickly.
how to sell pi coins at high rate quickly.
 
Jio Financial service Multibagger 2024 from India stock Market
Jio Financial service  Multibagger 2024 from India stock MarketJio Financial service  Multibagger 2024 from India stock Market
Jio Financial service Multibagger 2024 from India stock Market
 
How can I sell my pi coins in Indonesia?
How can I  sell my pi coins in Indonesia?How can I  sell my pi coins in Indonesia?
How can I sell my pi coins in Indonesia?
 
The new type of smart, sustainable entrepreneurship and the next day | Europe...
The new type of smart, sustainable entrepreneurship and the next day | Europe...The new type of smart, sustainable entrepreneurship and the next day | Europe...
The new type of smart, sustainable entrepreneurship and the next day | Europe...
 
NO1 Uk Black Magic Specialist Expert In Sahiwal, Okara, Hafizabad, Mandi Bah...
NO1 Uk Black Magic Specialist Expert In Sahiwal, Okara, Hafizabad,  Mandi Bah...NO1 Uk Black Magic Specialist Expert In Sahiwal, Okara, Hafizabad,  Mandi Bah...
NO1 Uk Black Magic Specialist Expert In Sahiwal, Okara, Hafizabad, Mandi Bah...
 
Introduction to Economics II Chapter 25 Production and Growth.pdf
Introduction to Economics II Chapter 25 Production and Growth.pdfIntroduction to Economics II Chapter 25 Production and Growth.pdf
Introduction to Economics II Chapter 25 Production and Growth.pdf
 
9th issue of our inhouse magazine Ingenious May 2024.pdf
9th issue of our inhouse magazine Ingenious May 2024.pdf9th issue of our inhouse magazine Ingenious May 2024.pdf
9th issue of our inhouse magazine Ingenious May 2024.pdf
 
how can I sell my mined pi coins profitabily.
how can I sell my mined pi coins profitabily.how can I sell my mined pi coins profitabily.
how can I sell my mined pi coins profitabily.
 
how can I sell/buy bulk pi coins securely
how can I sell/buy bulk pi coins securelyhow can I sell/buy bulk pi coins securely
how can I sell/buy bulk pi coins securely
 
Digital Finance Summit 2024 Partners Brochure
Digital Finance Summit 2024 Partners BrochureDigital Finance Summit 2024 Partners Brochure
Digital Finance Summit 2024 Partners Brochure
 
Economics and Economic reasoning Chap. 1
Economics and Economic reasoning Chap. 1Economics and Economic reasoning Chap. 1
Economics and Economic reasoning Chap. 1
 
Commercial Bank Economic Capsule - May 2024
Commercial Bank Economic Capsule - May 2024Commercial Bank Economic Capsule - May 2024
Commercial Bank Economic Capsule - May 2024
 
一比一原版Adelaide毕业证阿德莱德大学毕业证成绩单如何办理
一比一原版Adelaide毕业证阿德莱德大学毕业证成绩单如何办理一比一原版Adelaide毕业证阿德莱德大学毕业证成绩单如何办理
一比一原版Adelaide毕业证阿德莱德大学毕业证成绩单如何办理
 
what is the best method to sell pi coins in 2024
what is the best method to sell pi coins in 2024what is the best method to sell pi coins in 2024
what is the best method to sell pi coins in 2024
 
is it possible to sell pi network coin in 2024.
is it possible to sell pi network coin in 2024.is it possible to sell pi network coin in 2024.
is it possible to sell pi network coin in 2024.
 
Introduction to Economics II Chapter 28 Unemployment (1).pdf
Introduction to Economics II Chapter 28 Unemployment (1).pdfIntroduction to Economics II Chapter 28 Unemployment (1).pdf
Introduction to Economics II Chapter 28 Unemployment (1).pdf
 
Latino Buying Power - May 2024 Presentation for Latino Caucus
Latino Buying Power - May 2024 Presentation for Latino CaucusLatino Buying Power - May 2024 Presentation for Latino Caucus
Latino Buying Power - May 2024 Presentation for Latino Caucus
 
Juspay Case study(Doubling Revenue Juspay's Success).pptx
Juspay Case study(Doubling Revenue Juspay's Success).pptxJuspay Case study(Doubling Revenue Juspay's Success).pptx
Juspay Case study(Doubling Revenue Juspay's Success).pptx
 

Import and Export of Pakistan report

  • 1. Department of Commerce JinnahUniversityforWomen 1 JINNAH UNIVERSITY FOR WOMEN DEPARTMENT OF COMMERCE ASSIGNMENT IMPORTS AND EXPORTS OF PAKISTAN NAME WAJIHA MUHAMMAD ISMAIL DEGREE PROGRAM BS-COMMERCE (SECOND YEAR) SUBJECT ECONOMIC ISSUES OF PAKISTAN SUBMISSION DATE: JUNE 30, 2020 SUBMITTED TO: MISS MEHWISH ZIA
  • 2. Department of Commerce JinnahUniversityforWomen 2 Table of Contents Exports .......................................................................................................................................3 Merchandise Exports..................................................................................................................4 Concentration of Exports ...........................................................................................................7 Direction of Exports...................................................................................................................7 Imports .......................................................................................................................................8 Direction of Imports.................................................................................................................11 Conclusion ...............................................................................................................................12 References................................................................................................................................13
  • 3. Department of Commerce JinnahUniversityforWomen 3 Exports The current government is focusing on making the exports a driver of sustainable economic growth. It is endeavouring to improve competitiveness and efficiency of the industry especially export oriented sector and import substituting production, reducing structural anomalies and improving trade by increasing institutional efficiencies and reducing cost of doing business. The export target for FY 2019 was set at US$ 28 billion. Exports registered a decline of 0.1 percent growth during July-April FY 2019. As per PBS data, exports during July-April FY 2019 reached to US$ 19.17 billion as compared to US$ 19.19 in July-April FY 2018. A slowdown in economic growth in the EU, along with spill overs from US-China trade tensions, led to subdued performance in exports. Textile sector remained the most vulnerable sector in these global headwinds. Monthly analysis shows that global synchronized slowdown has started hitting our economy. After showing some resilience exports started to retreat. However, March 2018 showed a phenomenal growth with US$ 2.2 billion exports in one month so it was expected that the March 2019 might not be that much phenomenal. April 2019 has registered highest export figure in the current fiscal year. It is pertinent to note that exports remained above US$ 2 billion in four months of FY2019. However, overall exports have got dampened due to global headwinds. The government has taken number of initiatives like economic reform package (2019), supply of gas and electricity to zero rated industry at lower cost, continuation of prime minister’s export package of 2017, sales tax refunds and duty drawbacks, incentive package (2019) and formulation of Strategic Trade Policy Framework (2018-2023). Government has reduced cost of production of textile sector by abolishing regulatory duty on cotton imports.
  • 4. Department of Commerce JinnahUniversityforWomen 4 Moreover, second free trade agreement has been signed with China, providing tariff concessions to 313 items. Pakistan is expanding its marketing and trade promotion campaign to all the major markets. The State Bank of Pakistan has maintained low rates for export refinancing schemes and fixed investment to allow export sector industries to make investments on competitive basis. In order to increase exports, the government has continued the five export-oriented sectors - including textile, leather, sports goods, surgical goods and carpets - as part of zero- rated sales tax regime. Devaluation has surely increased the cost of imported raw materials. However, this has been largely offset by the generous export incentives provided including larger export rebates, withdrawal of import duties on inputs of raw materials and intermediate goods and, more recently, the issuance of promissory notes against refunds due along with subsidies on gas and electricity consumed. All these measures likely to pay dividend with lag effect. Merchandise Exports During July-March FY2019, the exports reached to US$ 17.07 billion as compared to US$ 17.06 billion in the same period last year, which shows a meagre growth of 0.1 percent as compared to 11.6 percent growth same period last year. Disaggregated analysis suggests that performance of all the groups including food group, textile group, petroleum group and other manufactured groups remained subdued in the current fiscal year on the account of global headwinds.
  • 5. Department of Commerce JinnahUniversityforWomen 5 Food group constituting 19.6 percent of overall exports posted a decline of 2.4 percent as compared to same period last year. Within the food group, export of rice comprises 44.4 percent of total food group declined by 0.5 percent causing a major setback in overall food exports. The quantum drop in rice was 5.0 percent, but its value declined by 0.5 percent. This underwhelming picture is attributed to the competition faced by Pakistan from its competitors like Africa and China. Pakistani exporters are facing tough time against Chinese competitors as they are offloading their stock at lower prices. However, to tackle this situation government is taking necessary steps including reclaiming traditional markets besides accessing to new markets. Removal of restriction by Qatar on Pakistani rice export is a step in this direction that will reclaim Pakistan’s share in the global rice market. Moreover, China has agreed to give duty free access to 200,000 tons of rice from Pakistan in the current calendar year. Among other products fruits, capturing the second highest position in food group, posted a growth of 8.7 percent in value during the current fiscal year. Pakistan managed to explore new international markets for this group by participating in Berlin fair. The other important components of food group which registered a growth include oil seeds, nuts & kernels, spices and wheat. Sugar exports declined by 68.2 percent on account of the withdrawal of subsidies and completion of earlier announced quotas. Exports of textile manufacturers, which accounts 58.5 percent in total exports witnessed a trivial growth of 0.1 percent and remained at US$ 9.99 billion in July-March FY2019 as compared to US$ 9.98 billion during the same period last year. Within the group, knitwear and
  • 6. Department of Commerce JinnahUniversityforWomen 6 bed wear registered a growth but it was offset by the decline in cotton yarn and cotton cloth. Low demand from EU and lower unit prices, particularly for knitwear, contributed to the lacklustre performance of this group. Textile trade agreements have been signed at Texport Pakistan 2019 which will support textile exports. Export of the textile items like knitwear comprises 12.6 percent of total exports and 21.6 percent of textile exports increased in both quantity and value by 14.8 and 9.29 percent respectively. Readymade garments with 11.5 percent share in total exports and 19.6 percent share in textile exports registered a growth of 2 percent in value and 28.1 percent in quantity. Value-added exports increased due to growing demand and improvement in export competitiveness after exchange rate adjustment. Cotton cloth having 9.3 percent share in total exports and 16 percent in textile exports declined by 2.1 percent in value, but its quantum increase was 18.1 percent. Bed wear with a share of 10.1 percent in exports and 17.21 percent in textile group, increased both in quantity and in value by 10.3 percent and 2.7 percent, respectively. Cotton yarn has 4.9 percent share in total exports and 8.35 percent in textile group, decreased in both quantity and value by 15.7 percent and 15.4 percent, respectively. Towels having share of 3.4 percent in total exports and 5.88 percent share in textile group, decreased both in quantity and in value by 11.0 percent and 1.8 percent, respectively. Raw cotton having a share of 0.1 percent in total exports and 0.16 percent in textile group, decreased in both quantity and value by 71.2 percent and 71.8 percent, respectively. May be due to declining international cotton prices from 2.15 $/kg in June 2018 to 1.92 $/kg in April 2019. Petroleum group having a negligible share of 2 percent in total exports registered a negative growth of 0.2 percent on account of 7.6 percent decline in petroleum exports. Other manufacturers accounting 14.6 percent of total exports registered a negative growth of 1.5 percent during the period July-March FY2019. Within the group chemical and pharmaceutical products, bearing the largest share in the group, posted a growth of 5.7 percent in value. This is the only category showing significant growth in the group. Leather manufacturers continues to struggle but registered a negative growth of 8.4 percent in value. 21. percent decline in value is witnessed in leather tanned while its quantity decreased by 19 percent. Exports of carpets, rugs and mats registered a negative growth of 12.5 percent in value. The acute shortage of electricity, bad law and order, ever-soaring inflation, shortage of skilled
  • 7. Department of Commerce JinnahUniversityforWomen 7 labour force and high mark-up rate during last one decade were the major reasons hitting the carpet industry besides causing huge decline in rugs exports. Sports goods decreased in value by 9 percent on the back of 7.35 percent decline in exports of football. Other than these, surgical goods and medical instruments, engineering goods and jewellery posted a negative growth of 1.5, 10.8 and 24.2 percent, respectively. Although Cement export posted a significant growth of 32.8 percent in value and 55.4 percent in quantity during July-March FY2019. Low domestic sale and significant capacity additions paved the way to foreign markets for cement manufacturer. Concentration of Exports Pakistan’s exports are highly concentrated in few items like cotton & cotton manufacturers, leather, rice and few other items. The first three categories of exports account for 69.2 percent of total exports during July-March FY2019 with cotton & cotton manufacturers alone contributing 56.7 percent. Traditionally, the contribution of these three categories was 70.3 percent during the same period last year, and 71.8 percent during FY 2017. The bifurcation of these items in table shows that exports in these few items are the major factor for lower export earnings. Direction of Exports Traditionally Pakistan’s export destinations are concentrated to a few markets. Pakistani exports go to ten countries namely USA, China, UAE, Afghanistan, UAE, Germany, France, Bangladesh, Italy and Spain. Among these countries USA has the largest share of 17 percent in total exports followed by China 8 percent and UK 7 percent. The share of exports to Afghanistan and UAE witnessed a one percent decline during July-March FY2019 as compared to the same period last year. Table 8.10 suggests that all the countries have been on a stable trajectory in terms of export destinations of Pakistan. However, efforts are being made to
  • 8. Department of Commerce JinnahUniversityforWomen 8 explore new markets where lots of potential exists. Formulation of Strategic Trade Policy Framework (2019-24) is a way forward towards securing more international markets’ access. Imports Import target for FY2019 was set to US$ 56.5 billion. As per PBS data, imports stood at US$ 45.471 billion in July-April FY2019 as compared to US$ 49.360 billion in the same period last year showing a decline of 7.9 percent. The reduction in imports is due to decrease in imports of furnace oil, machinery & electric equipment, palm oil and textiles. Current scenario of declining imports shows that imports will be according to the estimates. With the falling global demand, weakening consumer and business sentiment among the major economies, trade tensions and economic stabilization measures at home, the imports are expected to be further decrease. Additionally, the government has launched import substitution drive that will be instrumental in reducing pressure on current account. The Finance Supplementary (Second Amendment) Act, 2019 particularly offered tariff concessions to those industries that can offer import substitution. It lowered tariffs on the raw materials and intermediate goods that can help local firms in meeting local demand that is currently being fulfilled by the foreign firms.
  • 9. Department of Commerce JinnahUniversityforWomen 9 Year on year analysis shows that government’s import contractions measures have started delivering early results. Imports have been continuously declining on year on year basis and March FY2019 has witnessed a tremendous decrease of 21 percent as compared to March FY2018 followed by January FY2019 with 20 percent decline as compare to January FY2018. Fig 8.3 shows that import reduction drive led by recent government started picking up the pace since October FY2019. Disaggregated analysis reveals that all the groups including food group, machinery group, petroleum good, consumer durables and raw materials witnessed hefty decline in imports during the current fiscal year.
  • 10. Department of Commerce JinnahUniversityforWomen 10 Food group constitutes 10.5 percent of overall import bill. Food import bill stood at US$ 4.261 billion in first nine months of FY2019 as compared to US$ 4.730 billion in the same period last year. Hence witnessed a significant decline of 9.9 percent. Within the group heaviest decline has been observed in imports of dry fruits, sugar, edible oil (soybeans and palm oil) and spices by 64.7, 24.8, 12.1 and 8.5 respectively. Although a quantum increase in palm oil has been witnessed during the period. Yet, lower international palm oil prices also suppressed import values. Other mentionable items in the group are tea, milk & related items and pulses. All of these showed negative trend of 1.1, 6.1 and 3.6 respectively. Declined imports in this sector can also be attributed to the SRO issued by the government, demanding the proper labelling requirements on the fastmoving consumer goods accompanied with Halal certificate. Machinery group with a 16.5 percent share in overall imports declined by 29.9 percent to US$ 4.604 billion, pushing down the import bill. Import of power generating machinery declined by 49 percent in July-March FY2019 as compared to the same period last year. A sharp pull back in power generating machinery drove most of the decline machinery import bill. Early harvest of CPEC projects and cut in PSDP spending contributed to the low machinery import bill. Office and textile machinery decreased by 4.4 and 10.61 respectively in first nine months of FY2019. Construction and mining machinery import decreased by 24.3 percent mainly because of the slowdown in construction activities in the given period. Agriculture machinery import is the only segment with a growth of 4.7 percent. This seems to be on account of present government initiatives to enhance agriculture production under Prime Minister Agriculture Emergency Plan. Transport group with 5.1 percent share in total imports declined by 35.7 percent. With a hefty decline of 15.8 percent in road motor vehicles.
  • 11. Department of Commerce JinnahUniversityforWomen 11 Petroleum group, being the largest contributor to total import bill, declined by 4.7 percent in July- March FY2019 as compared to the previous period last year and stood at US$ 8.002 billion as compare to US$ 8.393 billion in the corresponding period last year. Among the petroleum group, petroleum products declined by 15.3 percent in value while 33.9 percent in quantity which is stemmed from the Pak rupee depreciation. Import bill of the petroleum crude increased by 15.2 percent despite a 14.5 percent decline in quantum import because of higher international oil prices. So, a heavy decline in quantum import completely offset the decline in import of crude oil. Refineries have curtailed their crude oil imports to prevent a glut of domestic furnace oil from building up as a result of crude refining process. In textile group, import of raw material decreased both in quantity and value by 32.37 and 28.11 percent respectively during July-March FY2019 as compared to the same period last year. The import bill of fertilizers increased in both quantity and value by 5.01 and 16.4 percent respectively on the back of lower domestic production. Fertilizer import increased to supplement the stock and to meet up the demands for Rabi and Kharif crops. Iron & steel scrap and iron & steel import bill decreased by 4.8 and 10 percent respectively. Lower construction activity and PSDP spending have urged local steel industry to curtail their production which has ultimately lowered the demand for imported raw material. The import bill of telecommunication group decreased by 8.9 percent to US$ 1.031 billion in July-March FY2019. The import of mobile handsets decreased by 7.6 percent in the said period as compared to 14.5 percent increase in the same period last year. Import duties on mobile sets contributed to this positive development. Import of the other apparatus also decreased by 10.28 percent in July-March FY2019 as compared to same period last year. Direction of Imports Like exports, Pakistan’s imports are also concentrated to few countries. Based on the current year data around 65 percent of total imports originated from countries like China, UAE, Saudi Arabia, Kuwait, Indonesia, India, USA, Japan, Germany and Malaysia. China being the largest import destination accounts for the 24 percent of total imports. Share of import from UAE has increased from 12 percent in FY2018 to 14 percent in FY2019. Change in Pakistan’s import pattern is shown in the table 8.13:
  • 12. Department of Commerce JinnahUniversityforWomen 12 Conclusion Although expansionary monetary policy in recent years, business activities and export- oriented sector had not been happening as it should be rather exports remained low after seeing higher growth in 2013-14. The present government is sternly focused on enhancing exports and in this direction taken various initiatives with respect to adjustment of exchange rates and monetary tightening. Imports during Jul-Apr FY2019 declined by 4.9 percent while worker’s remittances increased by 8.45 percent. This proved to be a major support to the current account balance which improved by 26.9 percent during the period. However, exports remained a source of concern as they declined during Jul-Apr FY2019. There is a continuous increase in the flows of credit to private sector in manufacturing and export-oriented industry which is a welcome development in terms of business activities. However, the downside risk of the impact of continuous rise in policy rate and global slowdown in trade activities may influence the exports. Financial account posted a surplus of US$ 11.32 billion during Jul-Apr FY2019. The improvement is mainly due to the bilateral inflows from China, India and UAE. However, foreign investment remained low during the period after a consistent increase over the last three years under CPEC. This is because of the completion of early harvest projects under CPEC. There is a need to implement a range of structural reforms including growth enhancing fiscal consolidation, reducing cost of doing business, attracting foreign private investments, exploiting the potential of Pakistani diaspora, introduction of effective and responsive foreign exchange regime, and most importantly, focus on enhancing exports through improving productivity at different stages of production. Moreover, integrating the domestic production
  • 13. Department of Commerce JinnahUniversityforWomen 13 with global value change, research and development, technology up-gradation, value addition and branding will help in increasing the exports. The establishment of special economic zone and free trade zone at Gwadar will enhance export growth and access to regional markets going forward. The trade diplomacy also needs to be strengthened. References http://www.finance.gov.pk/survey_1819.html