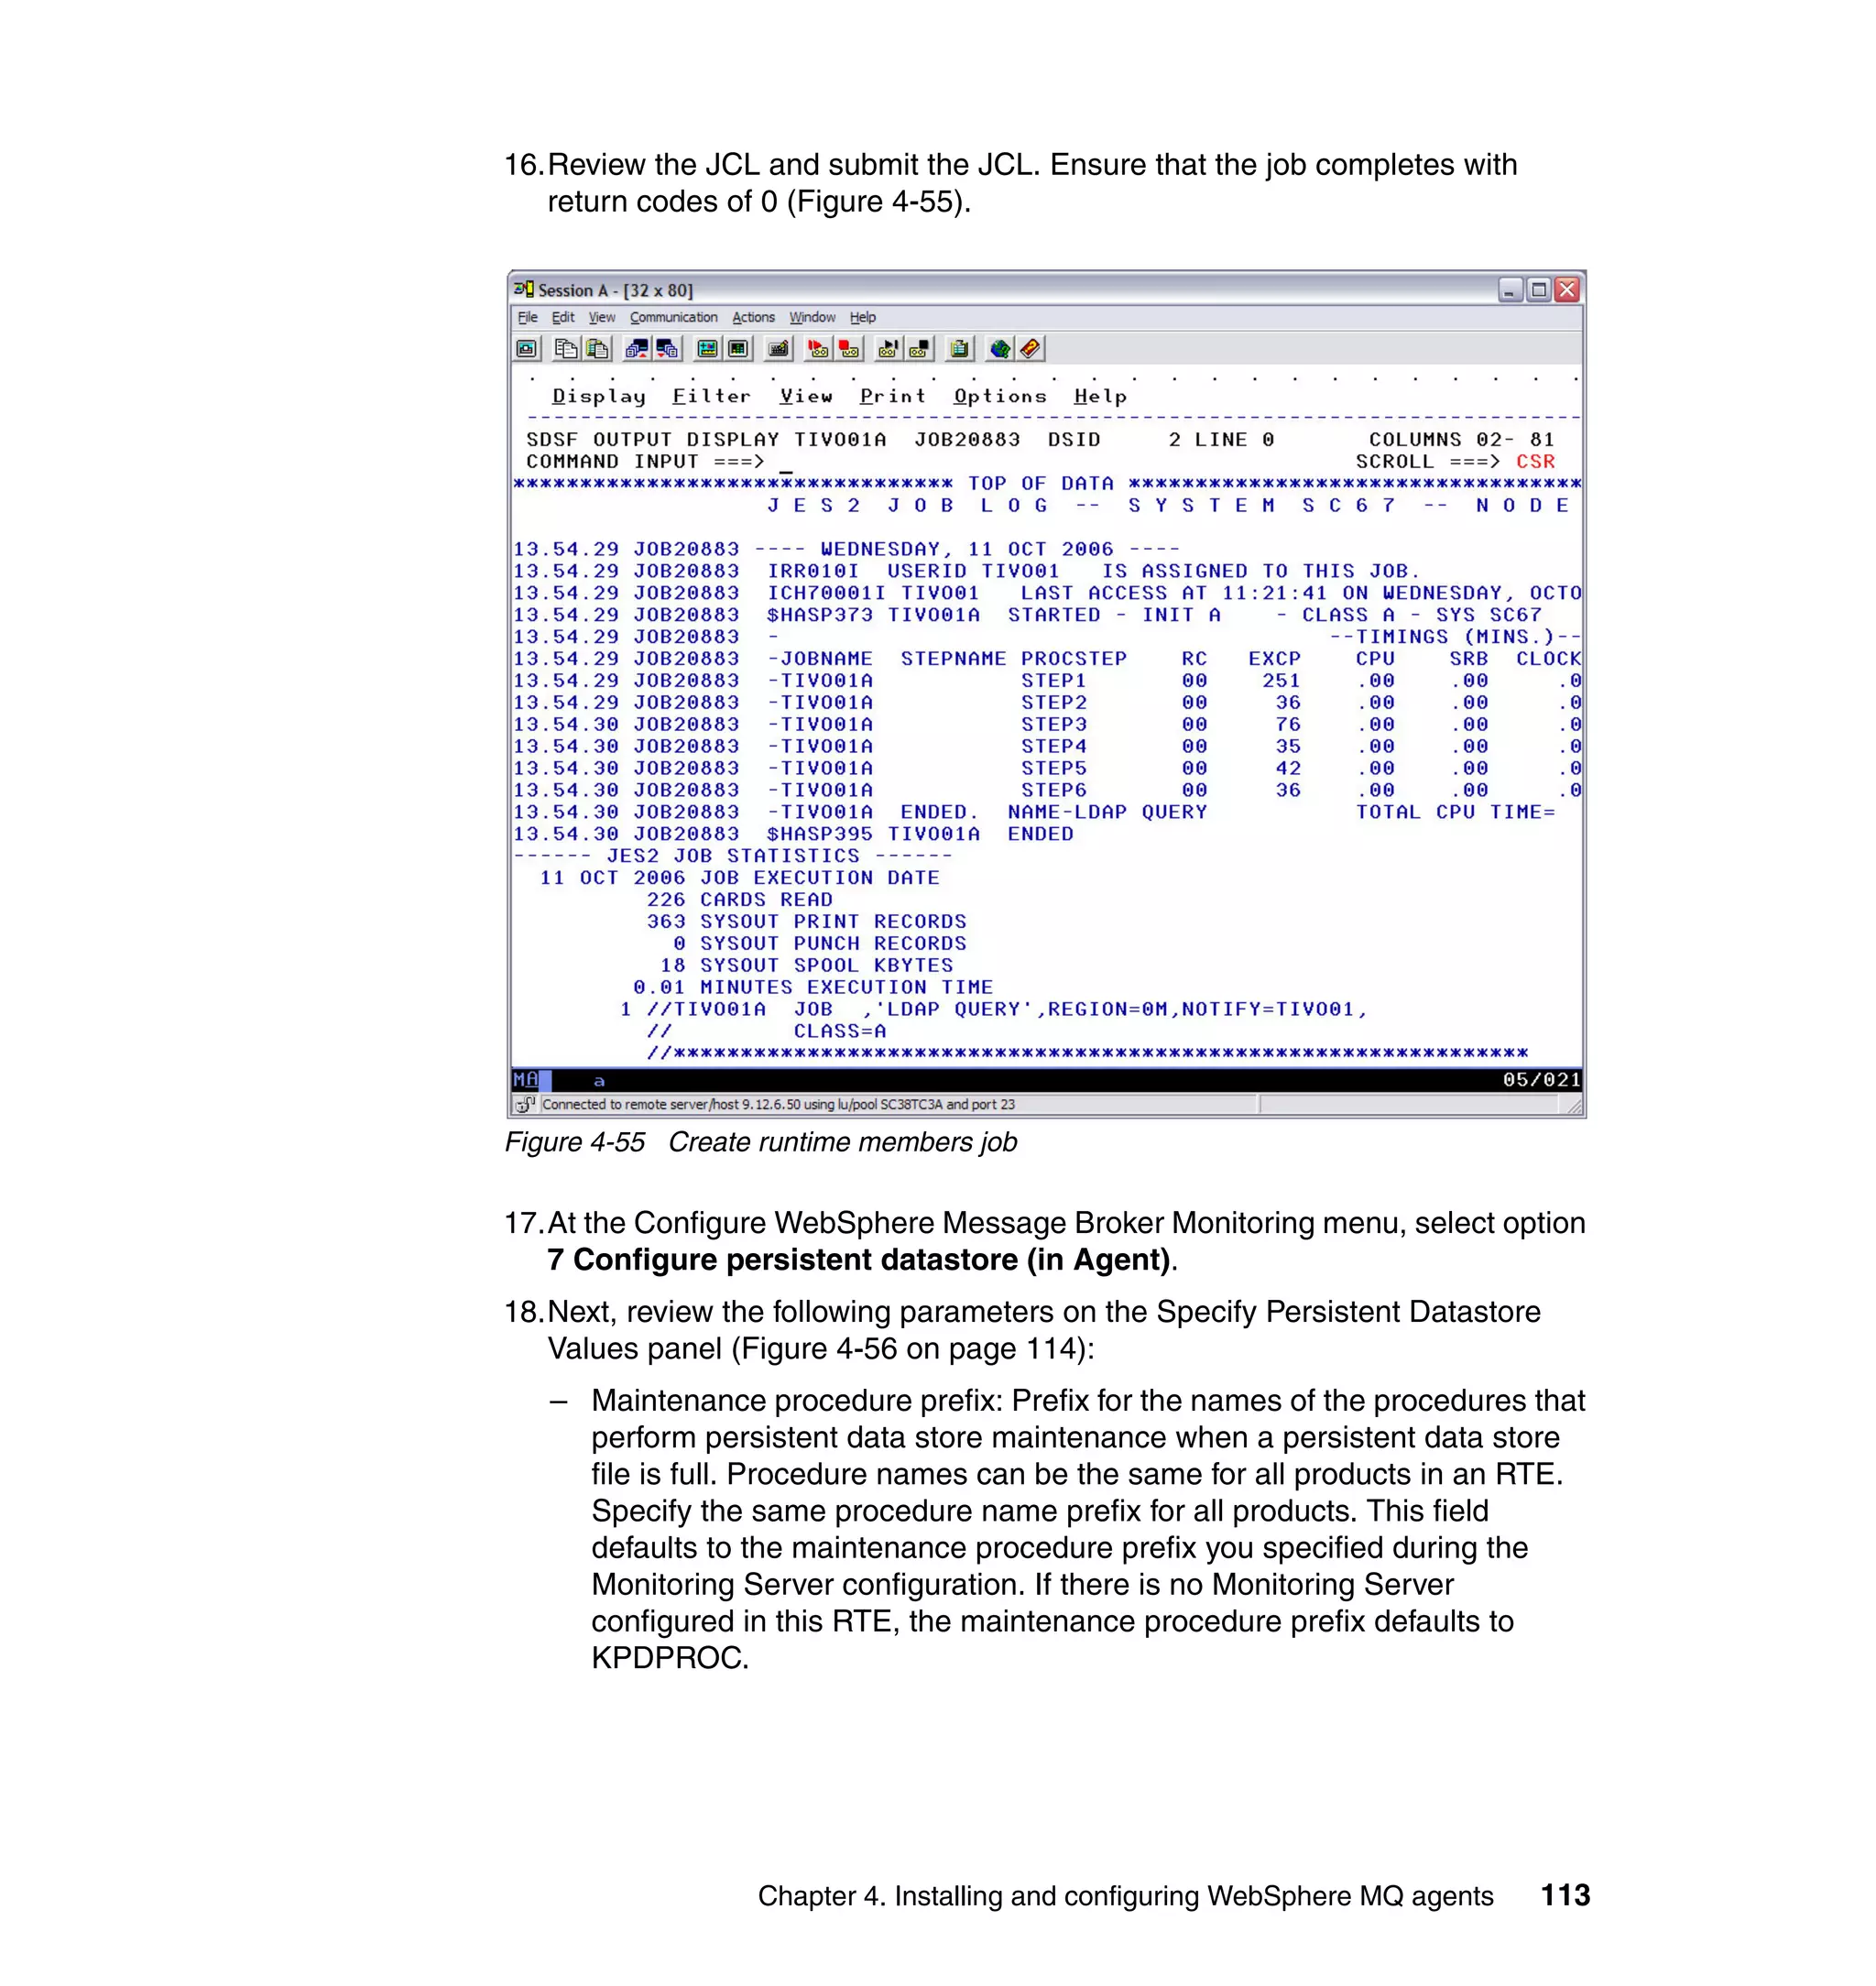
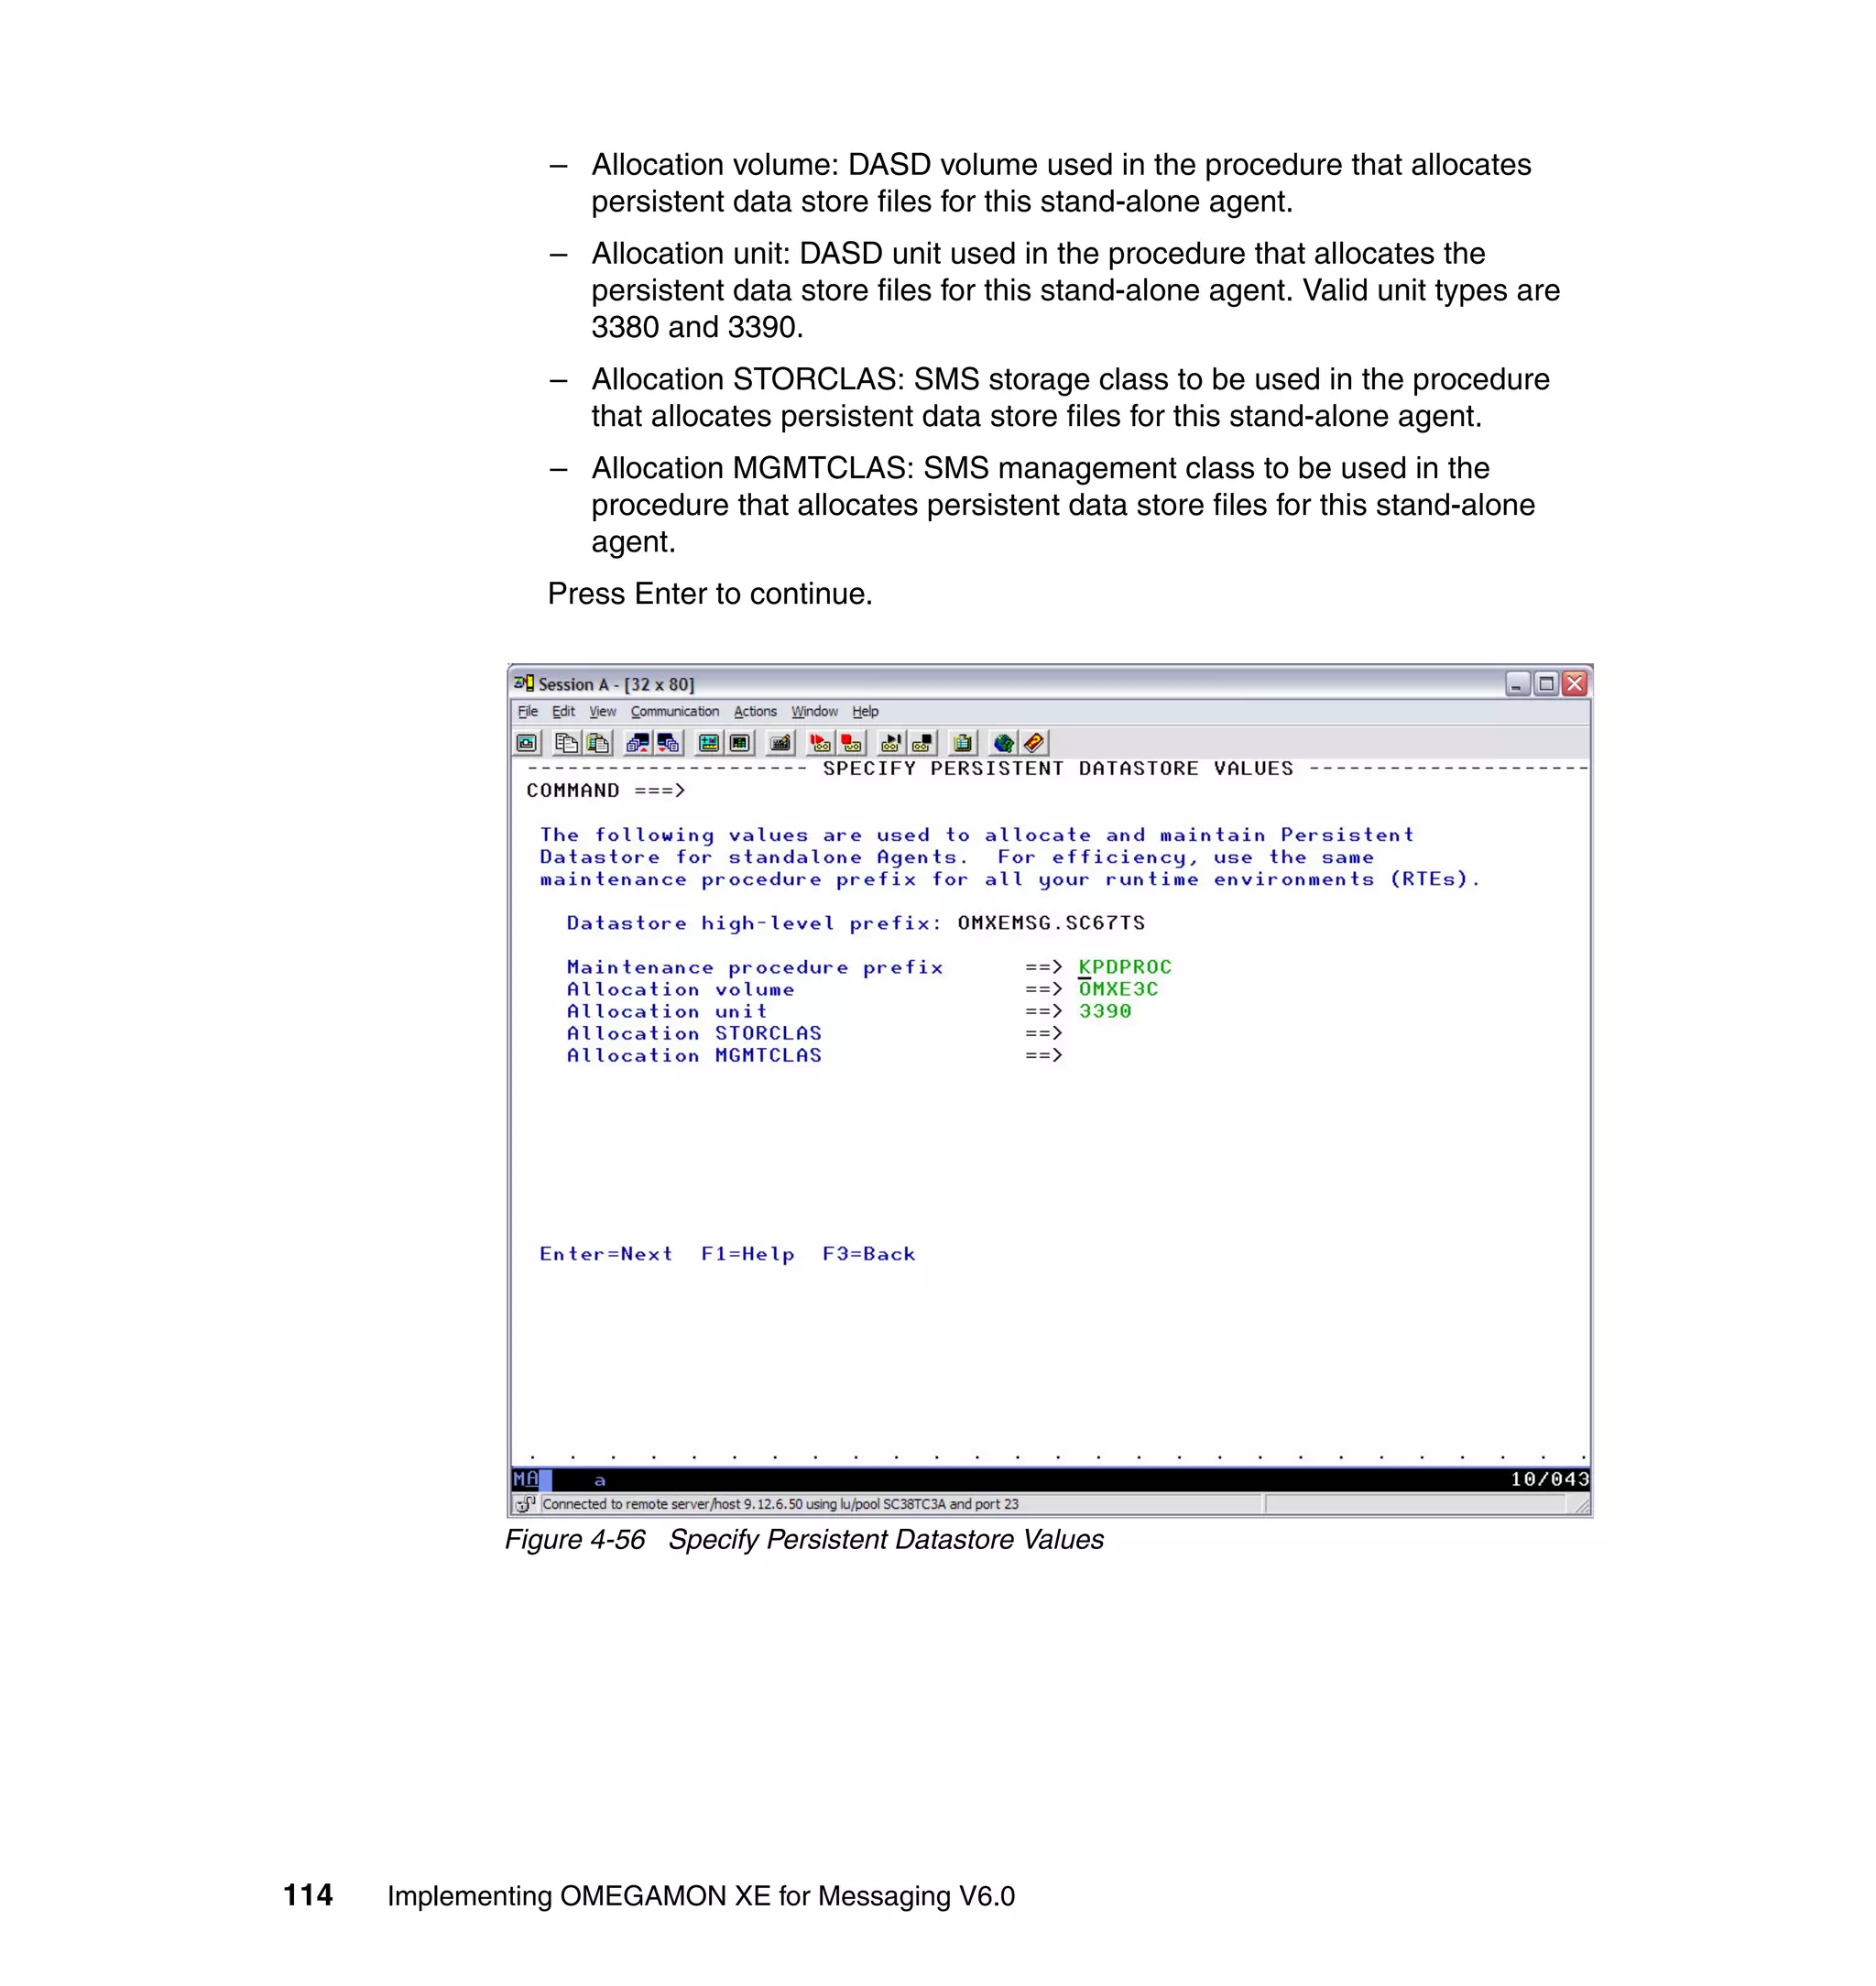
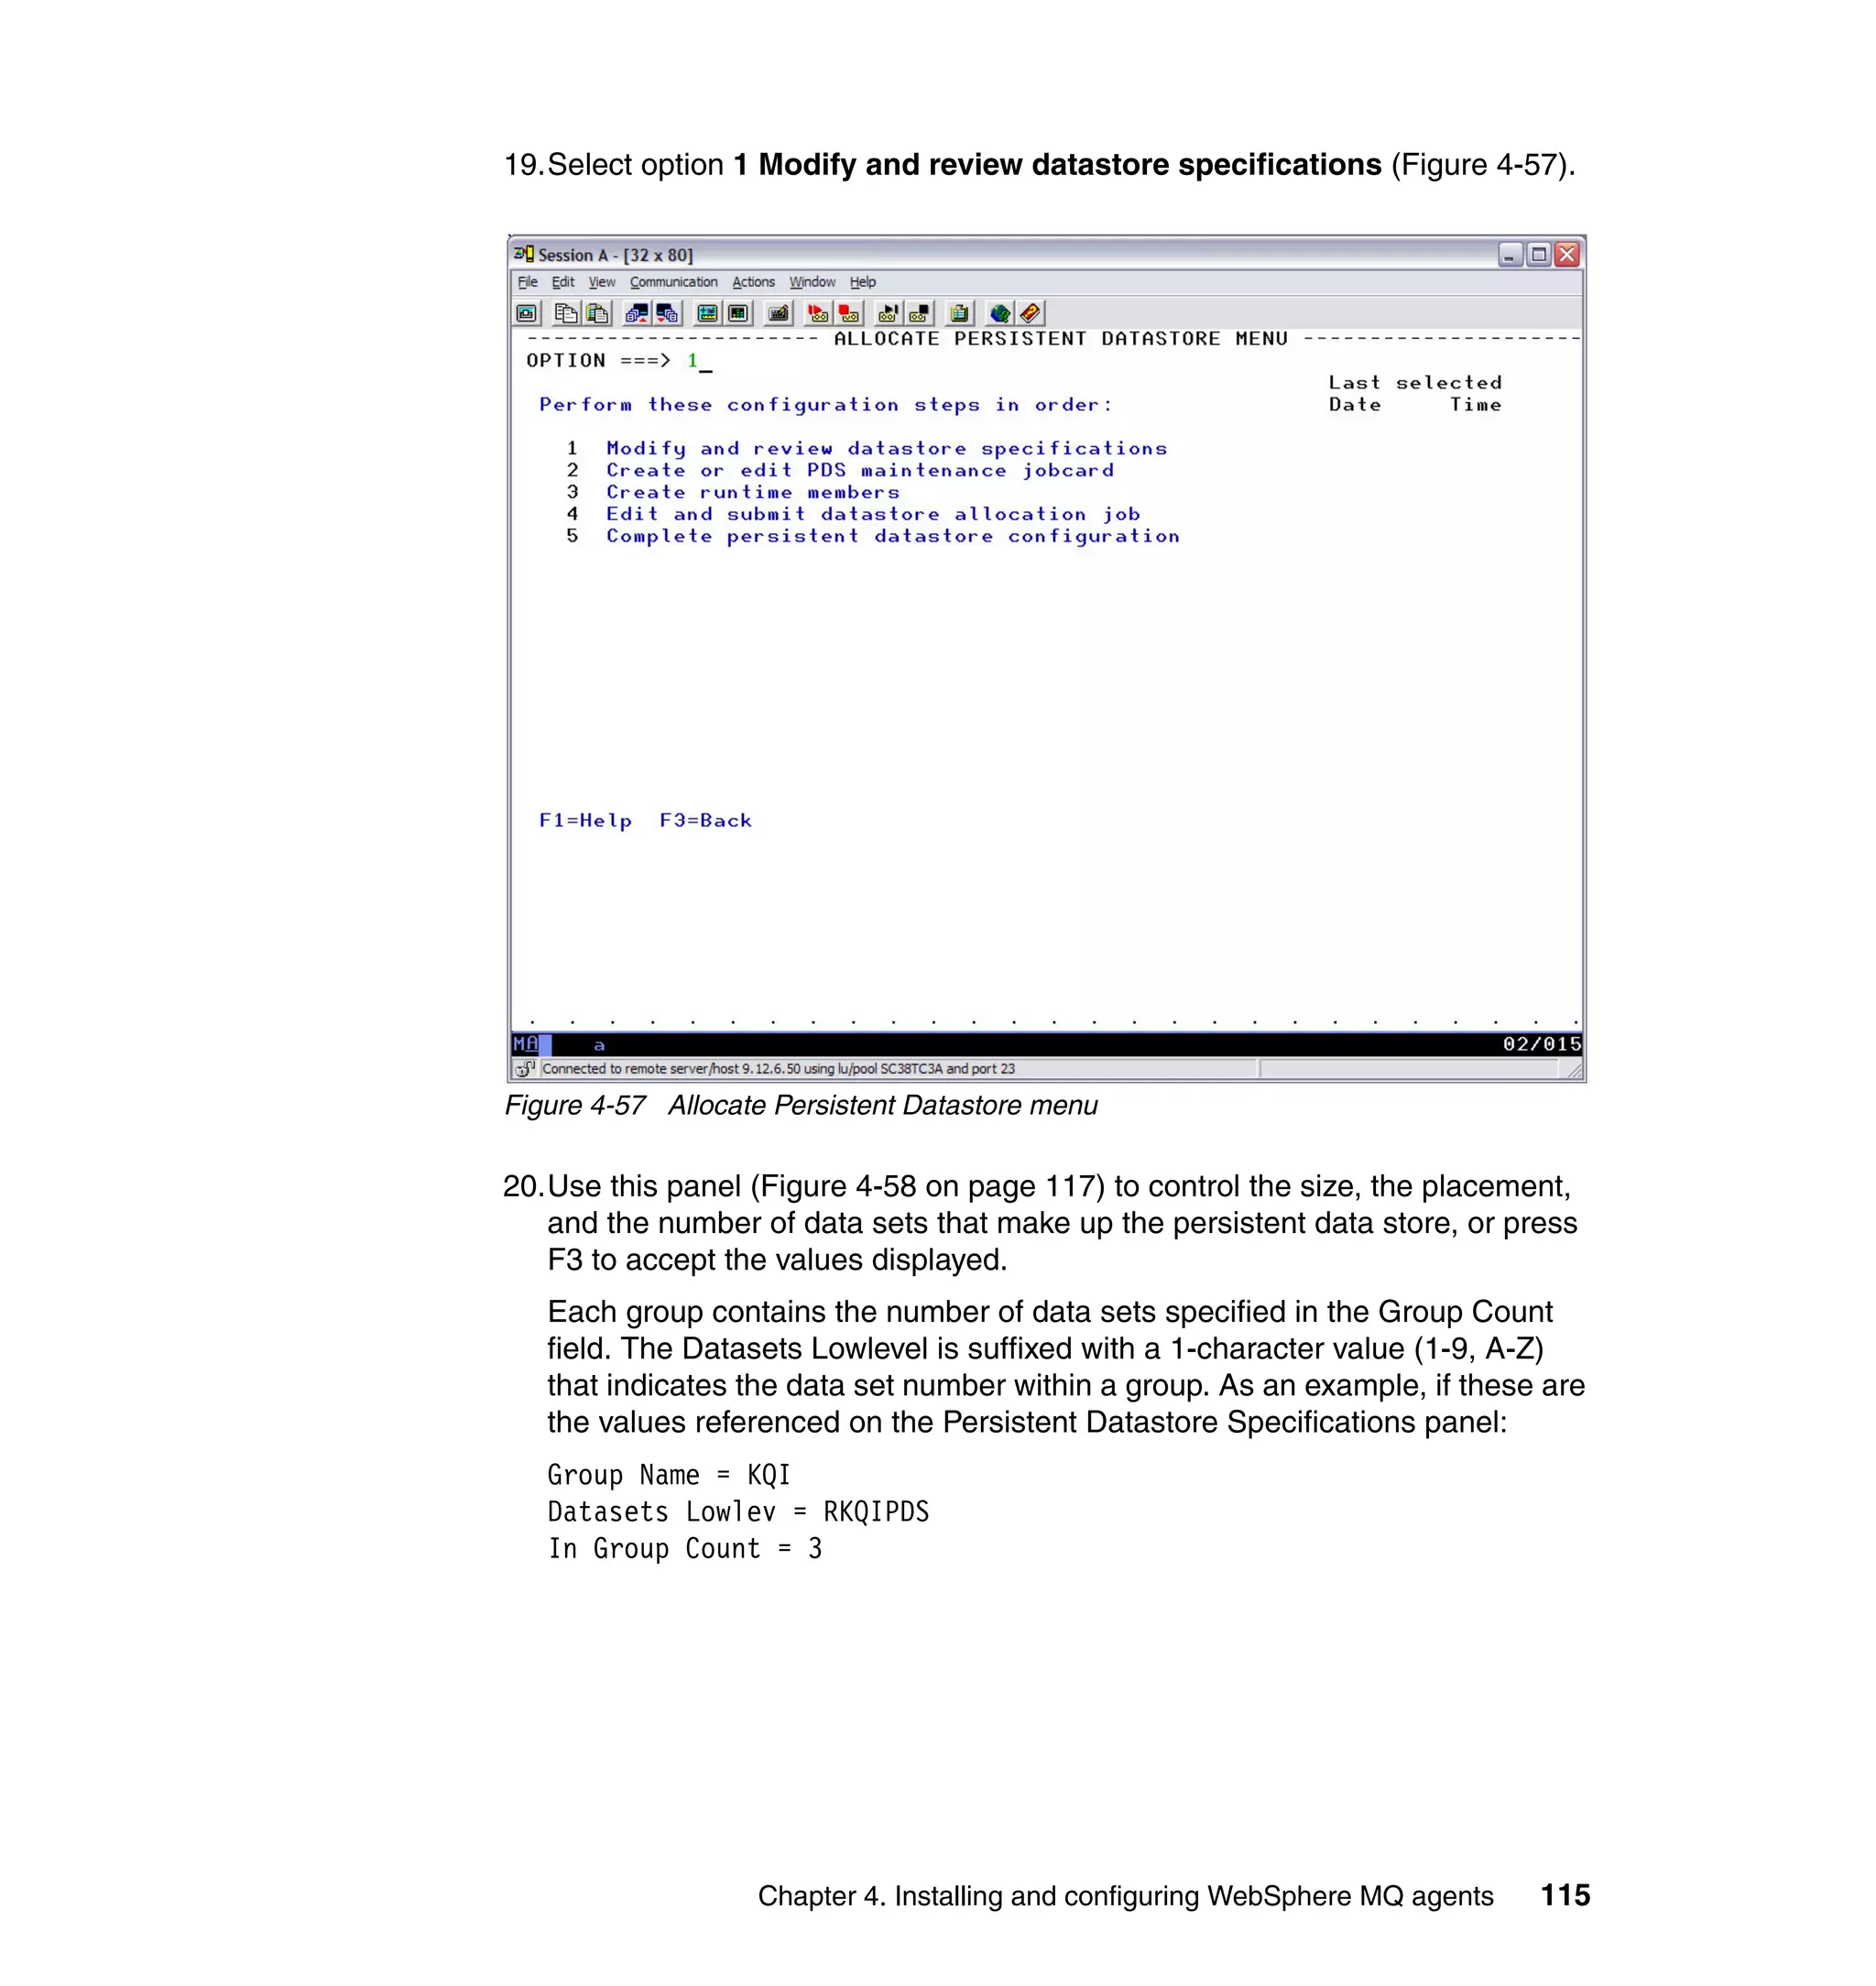
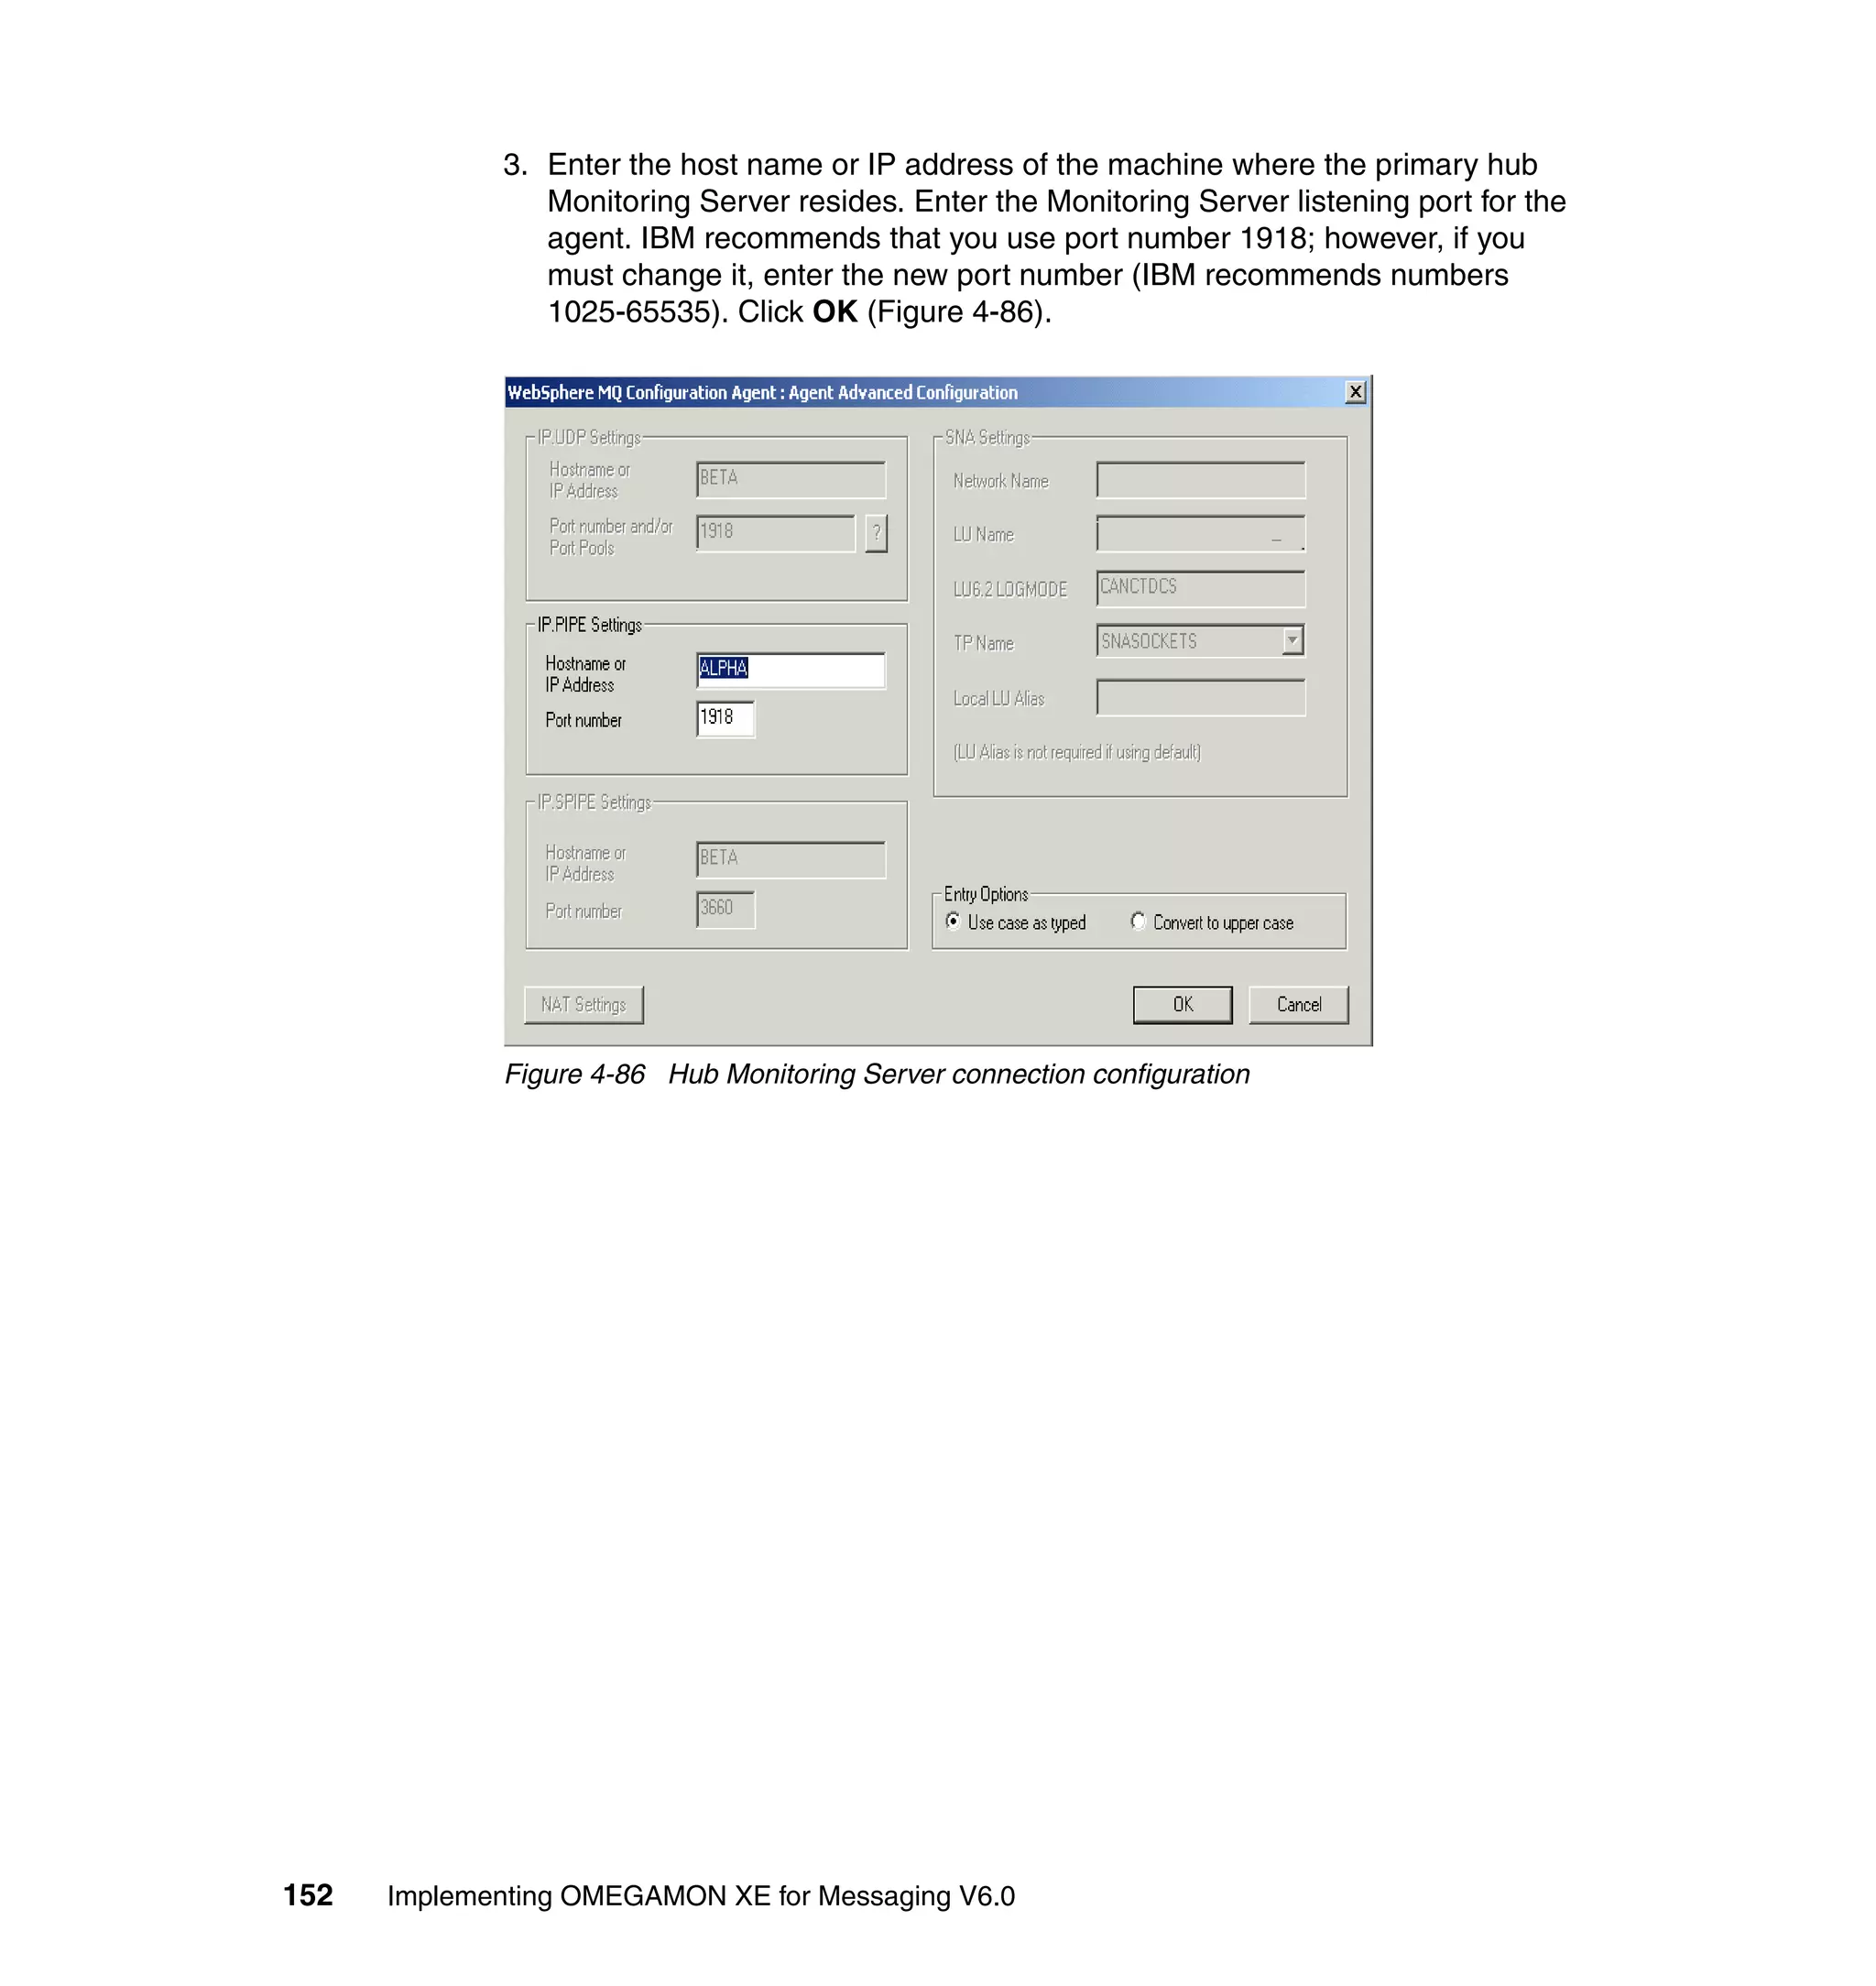
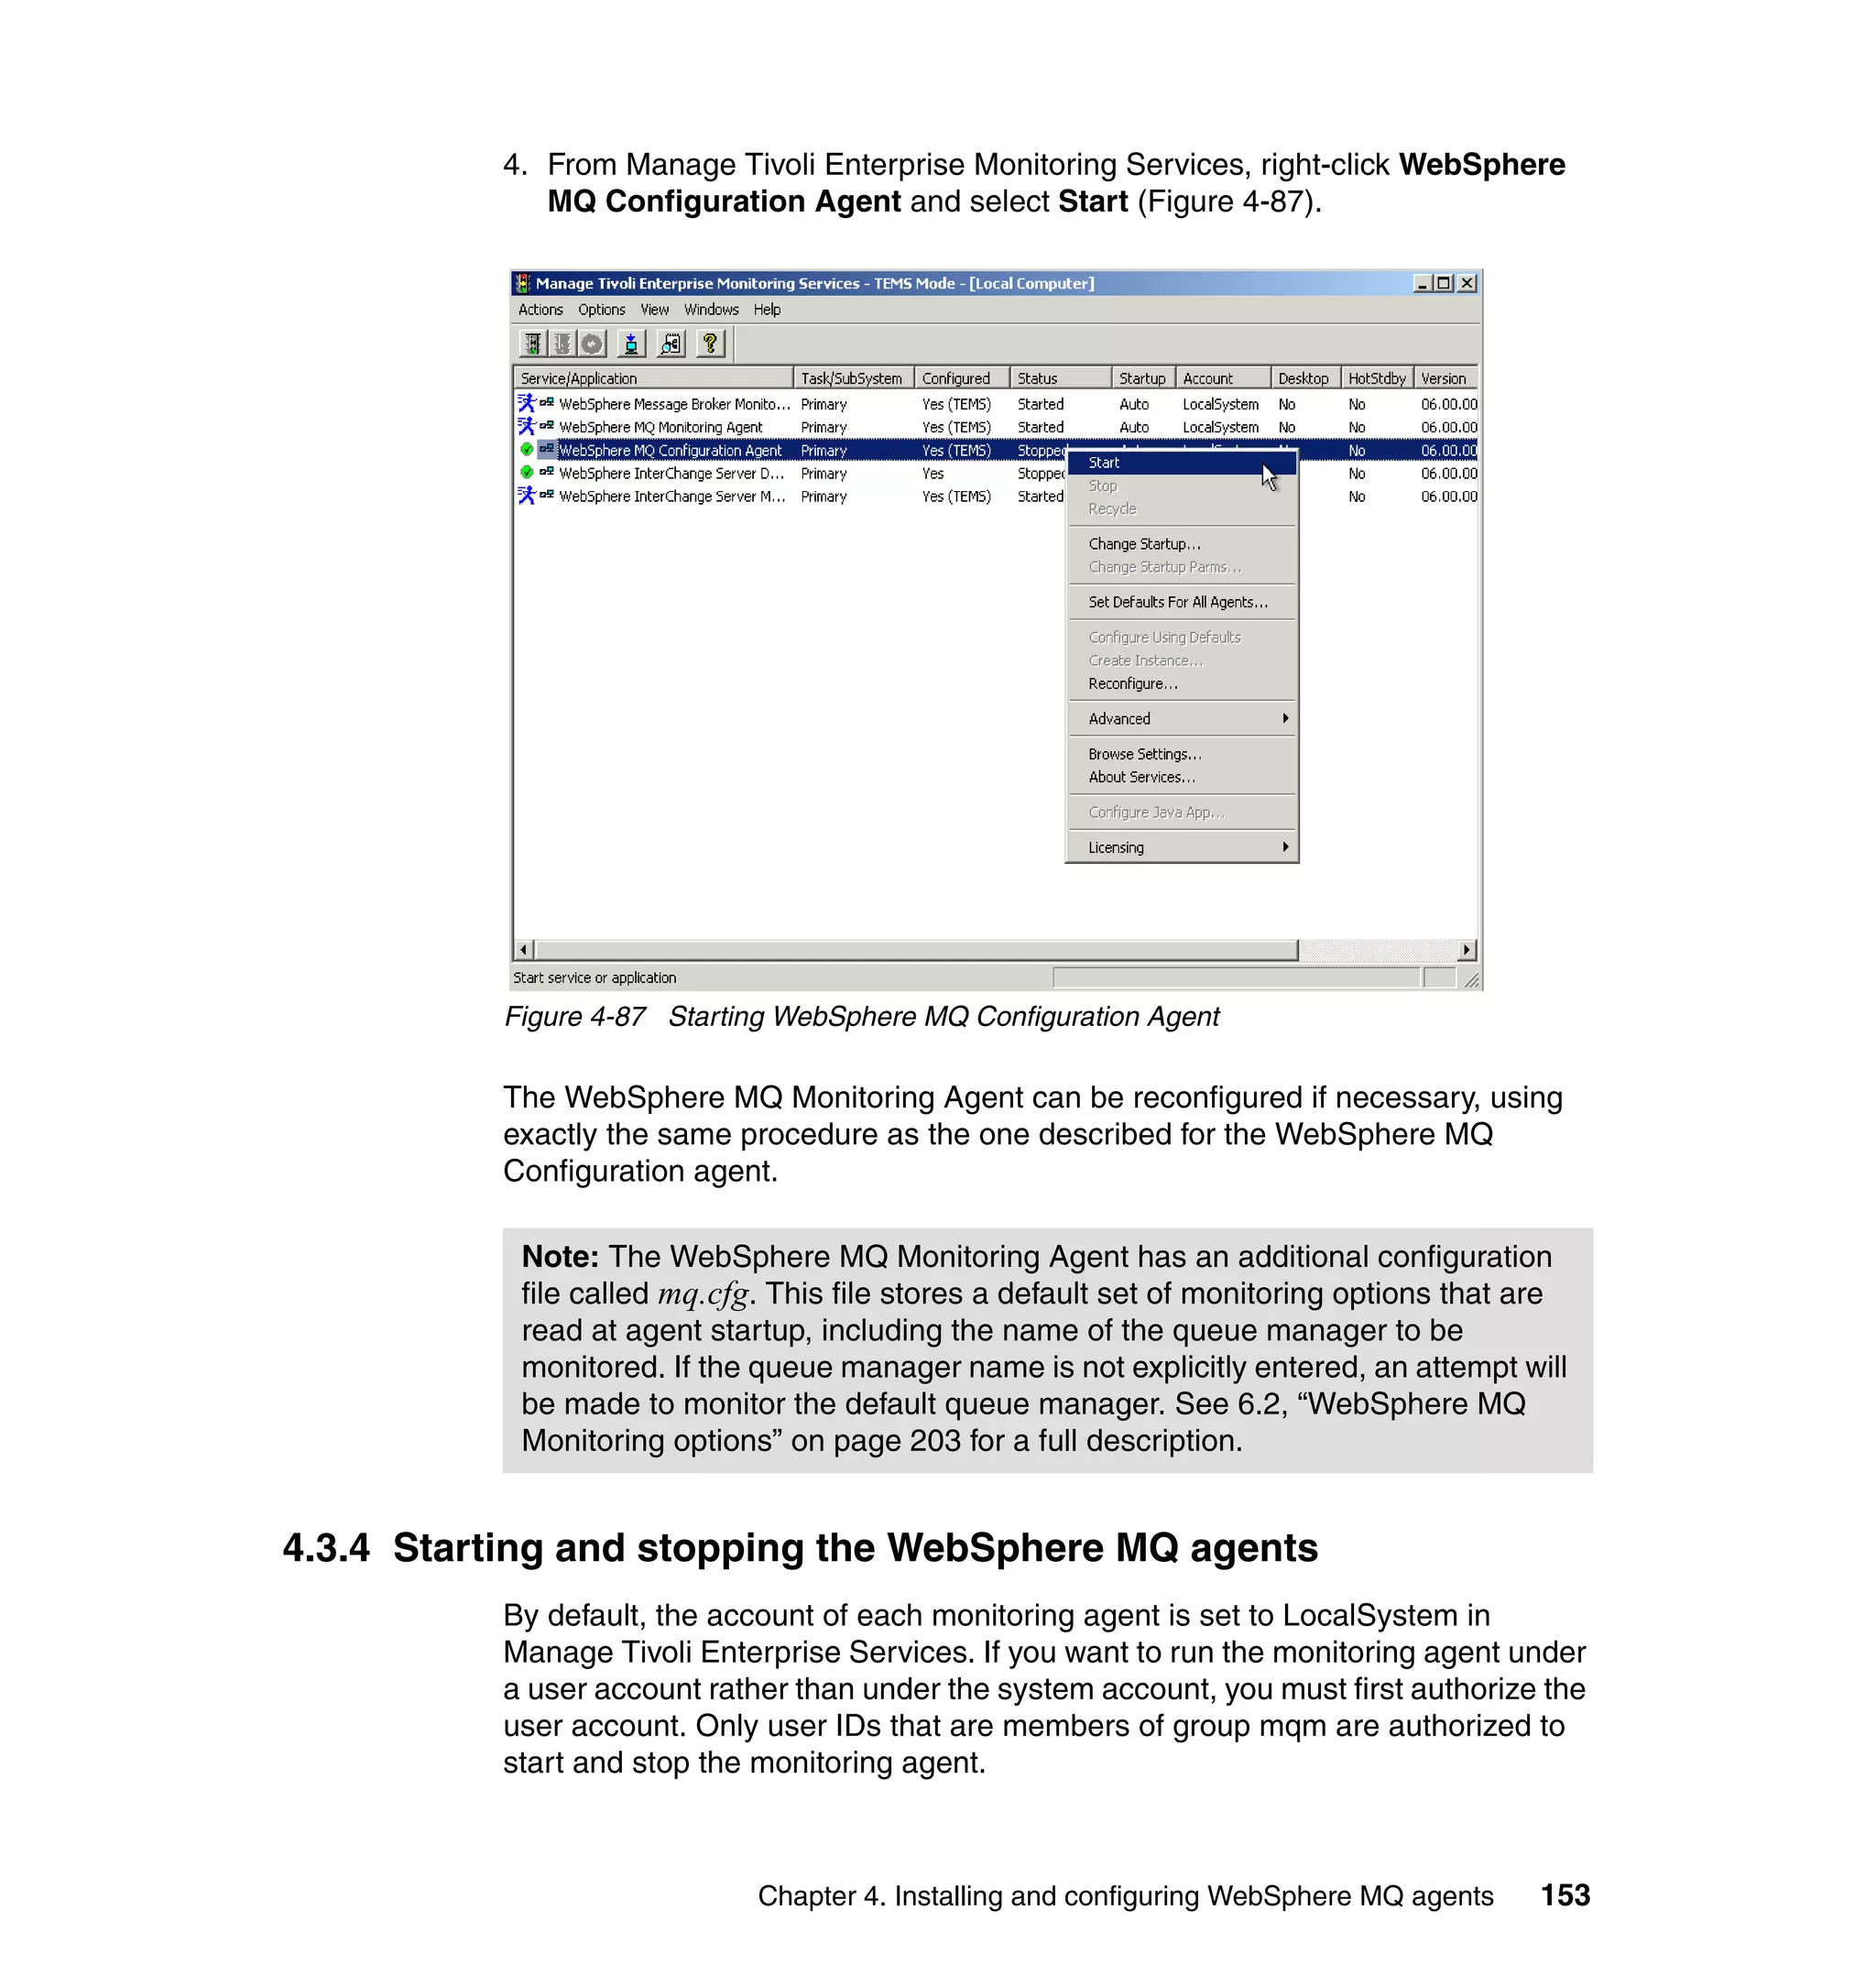
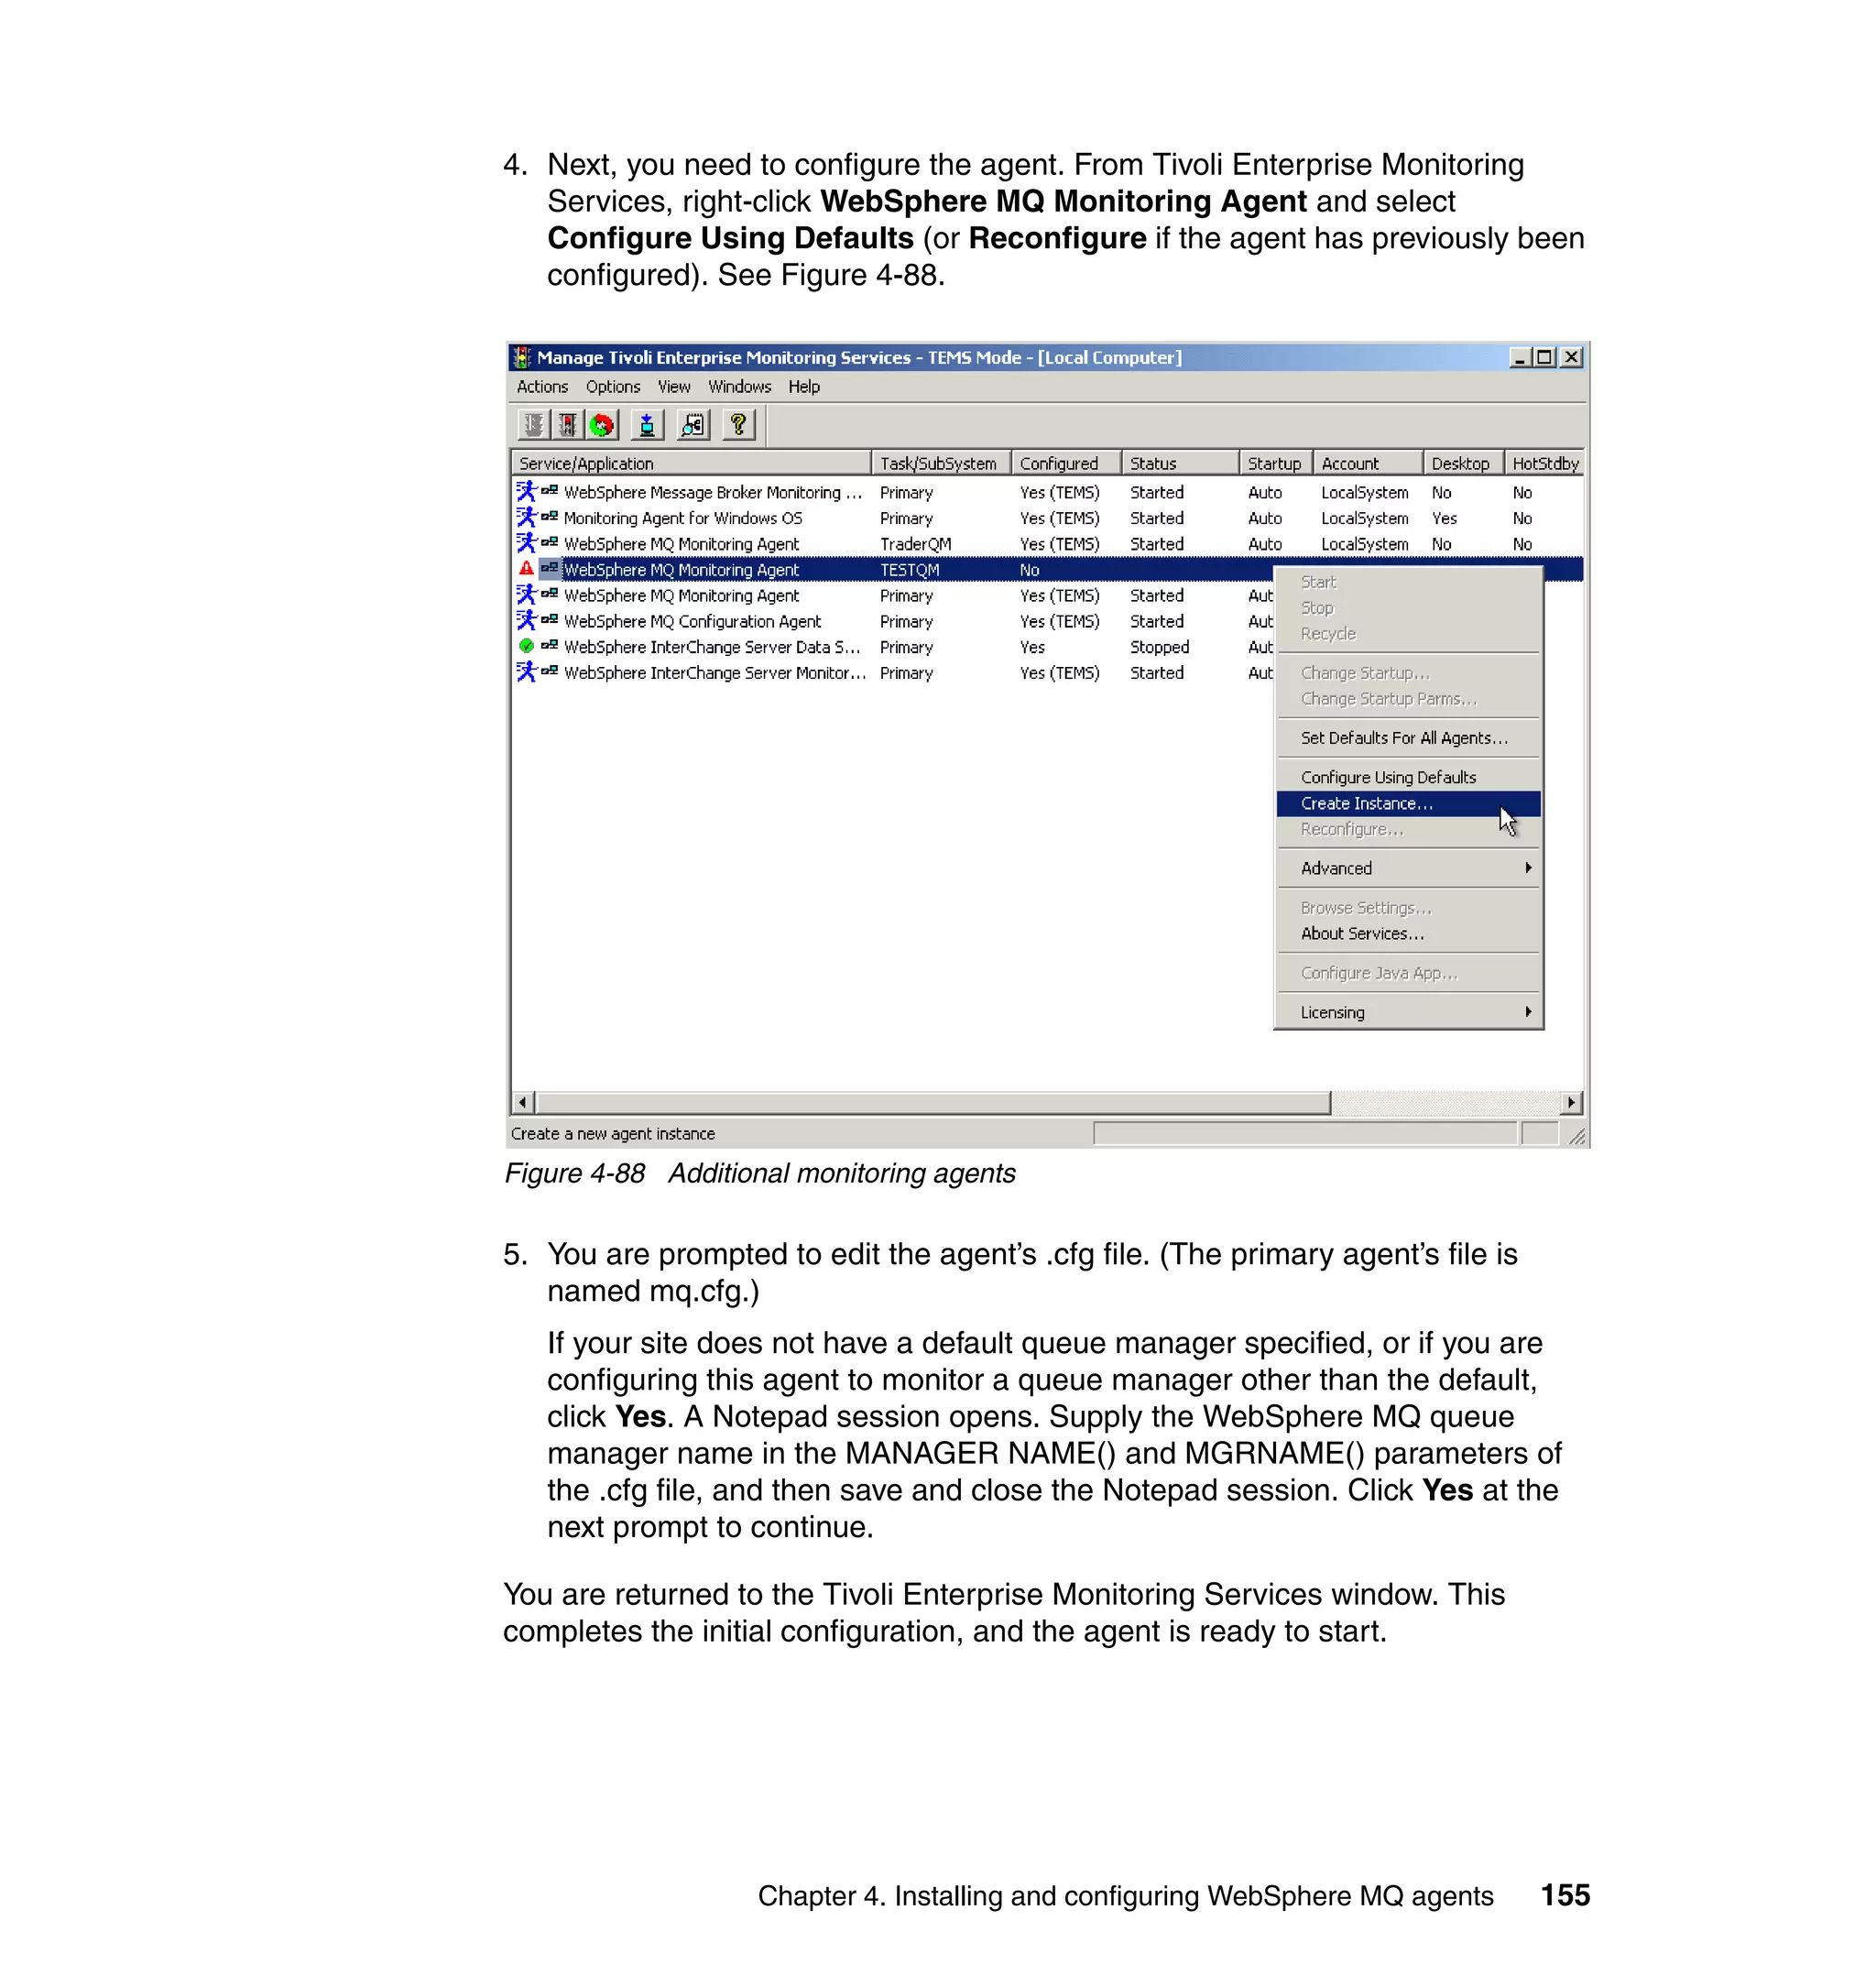
Download to read offline

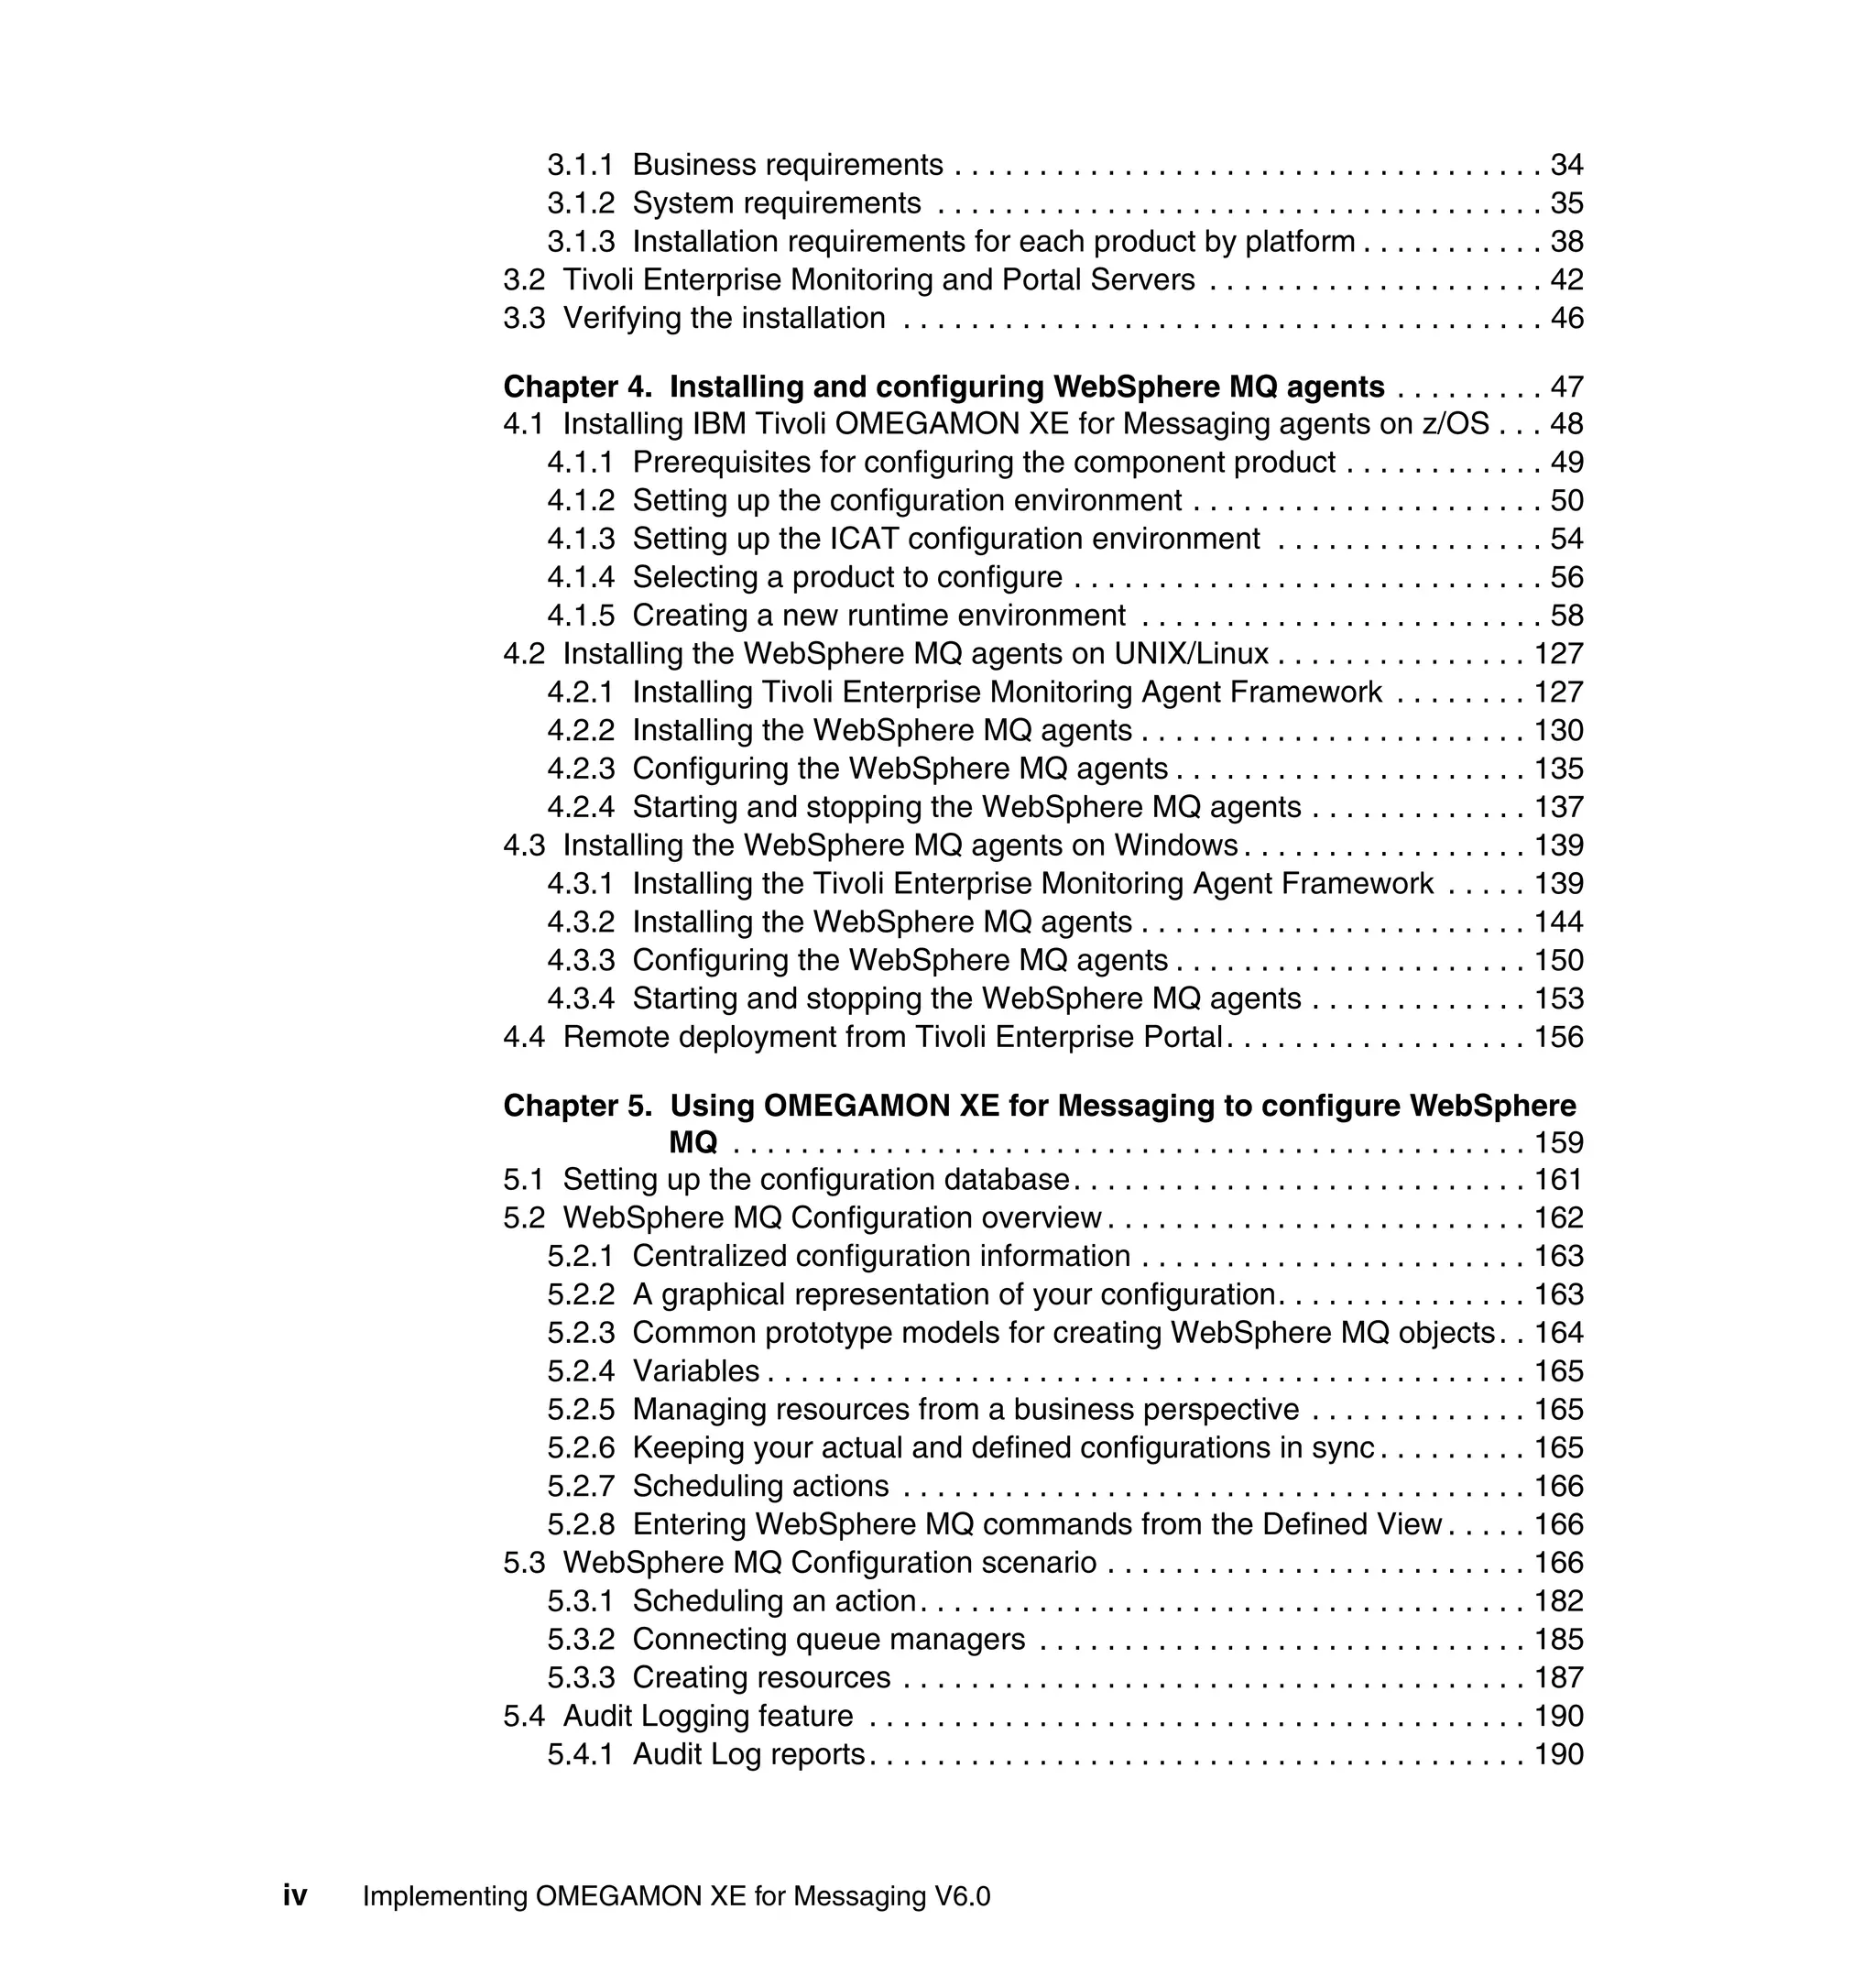


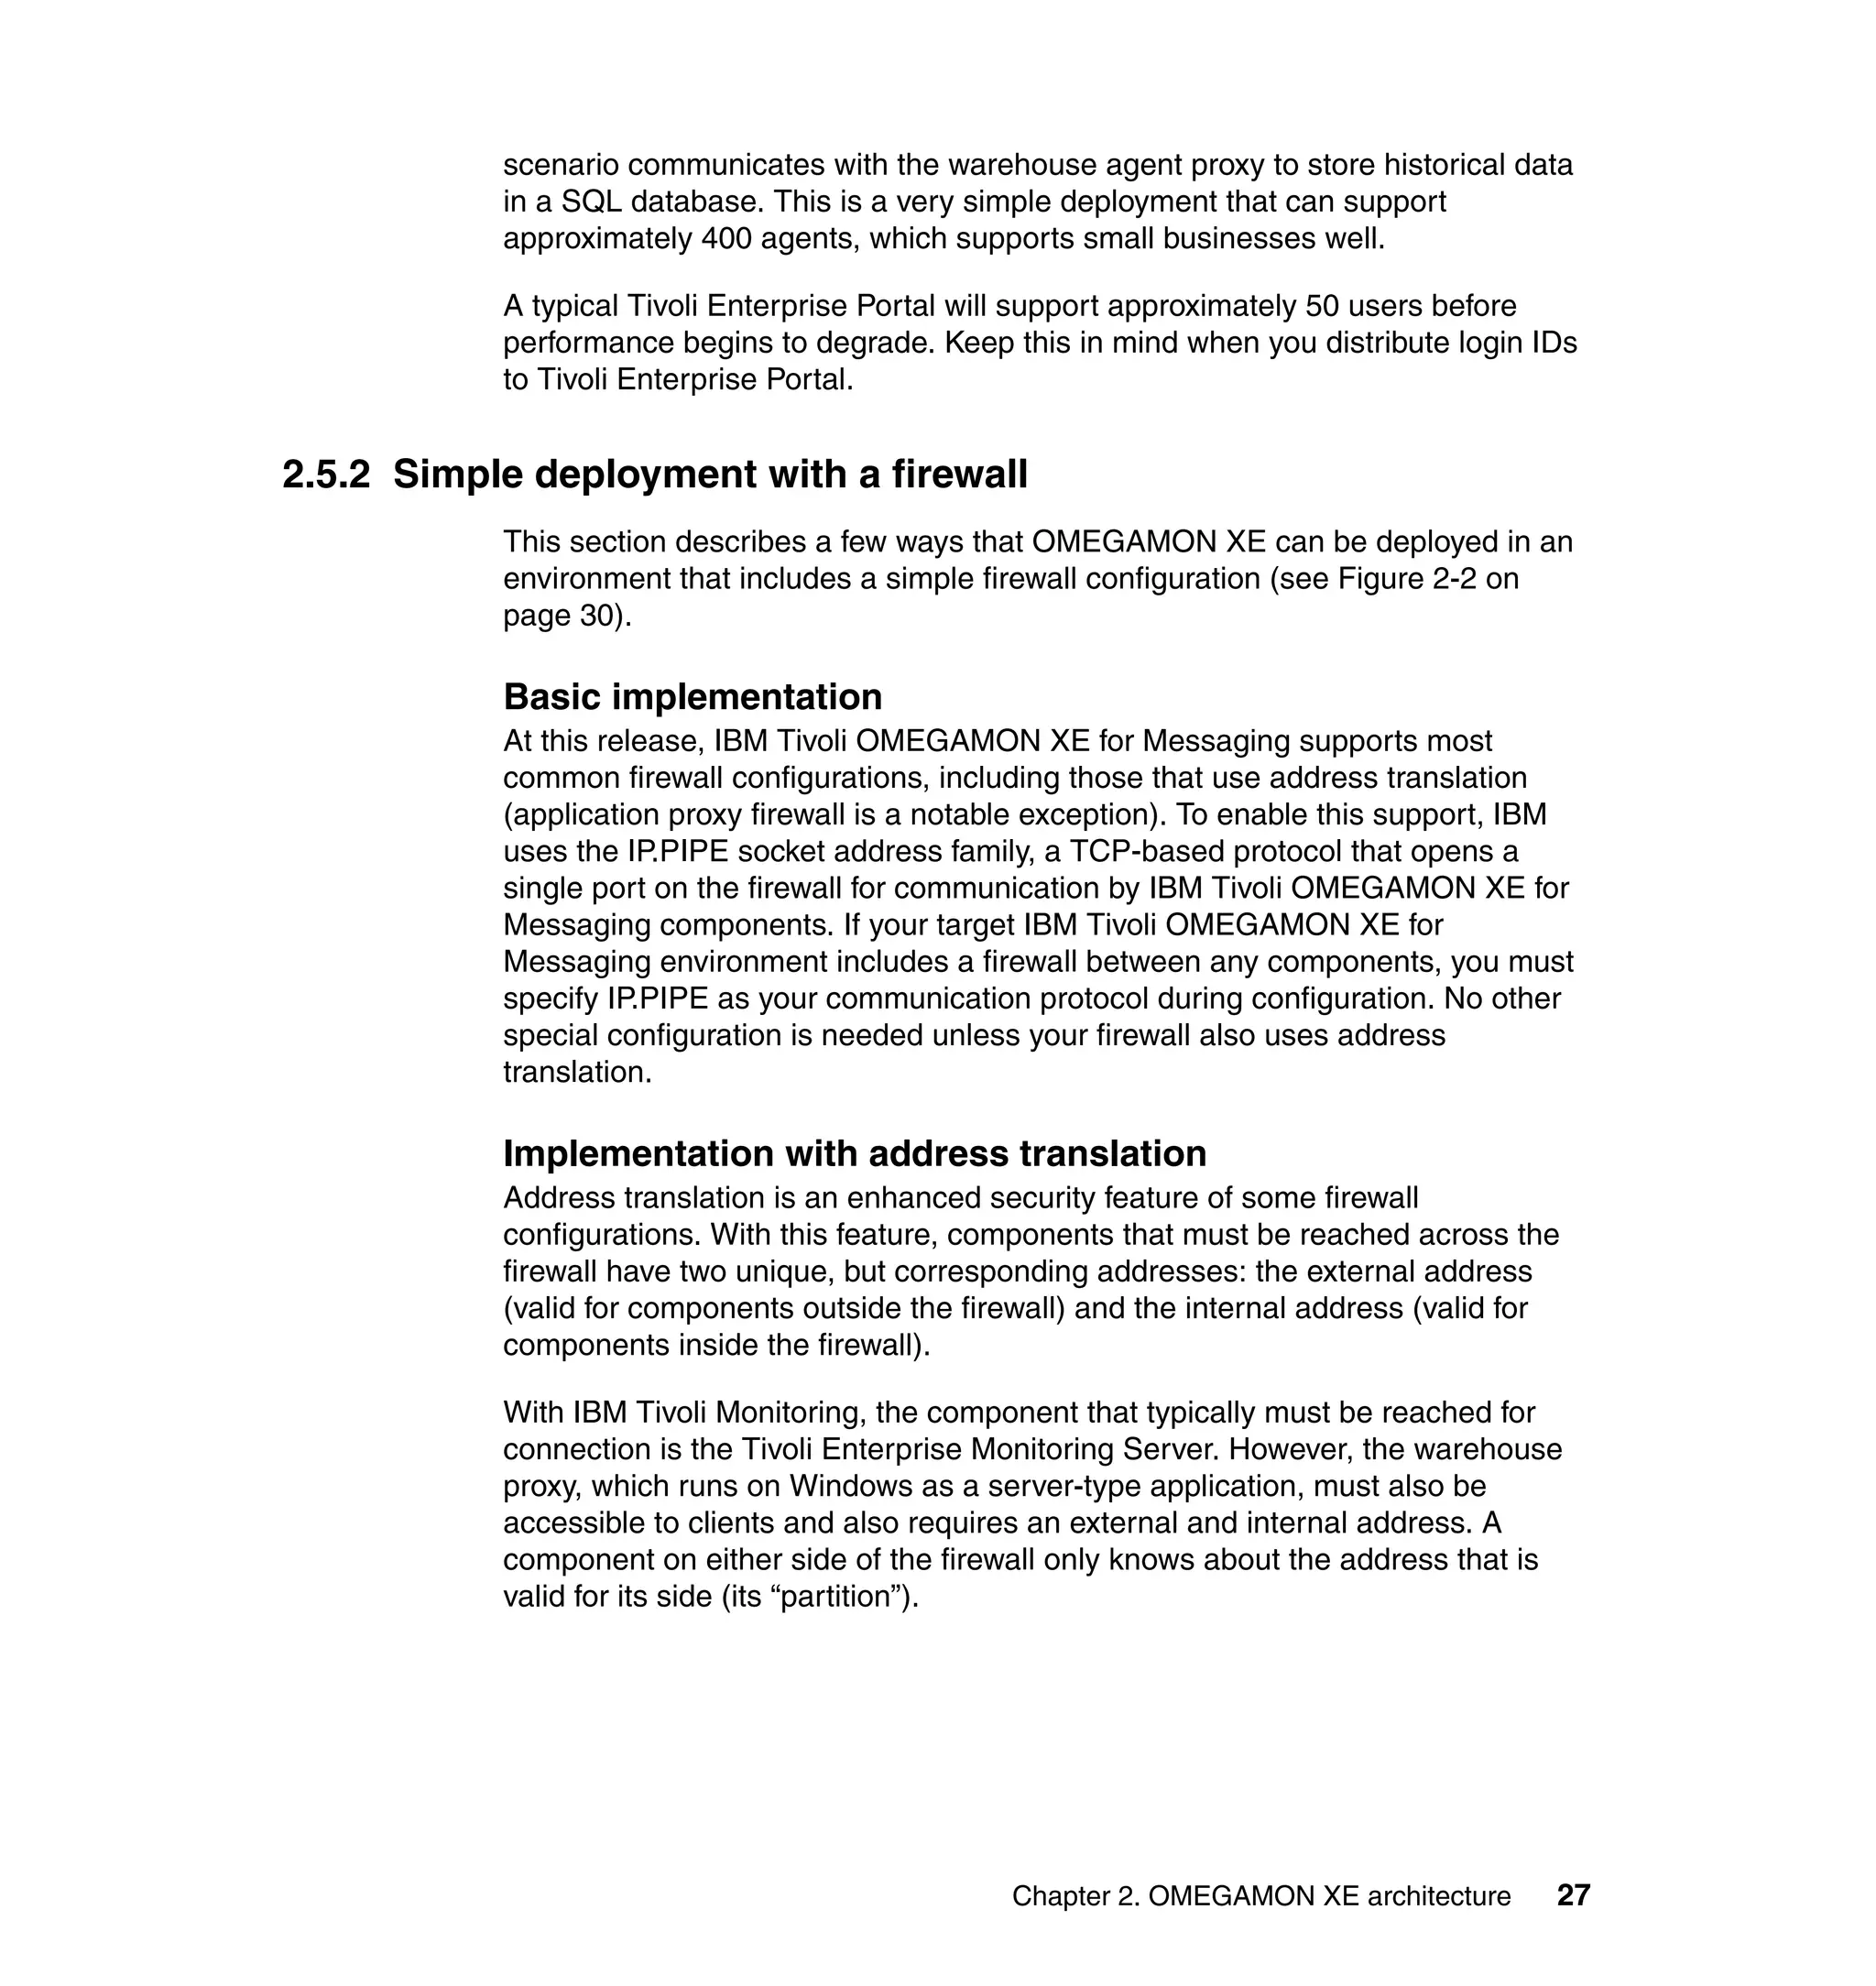

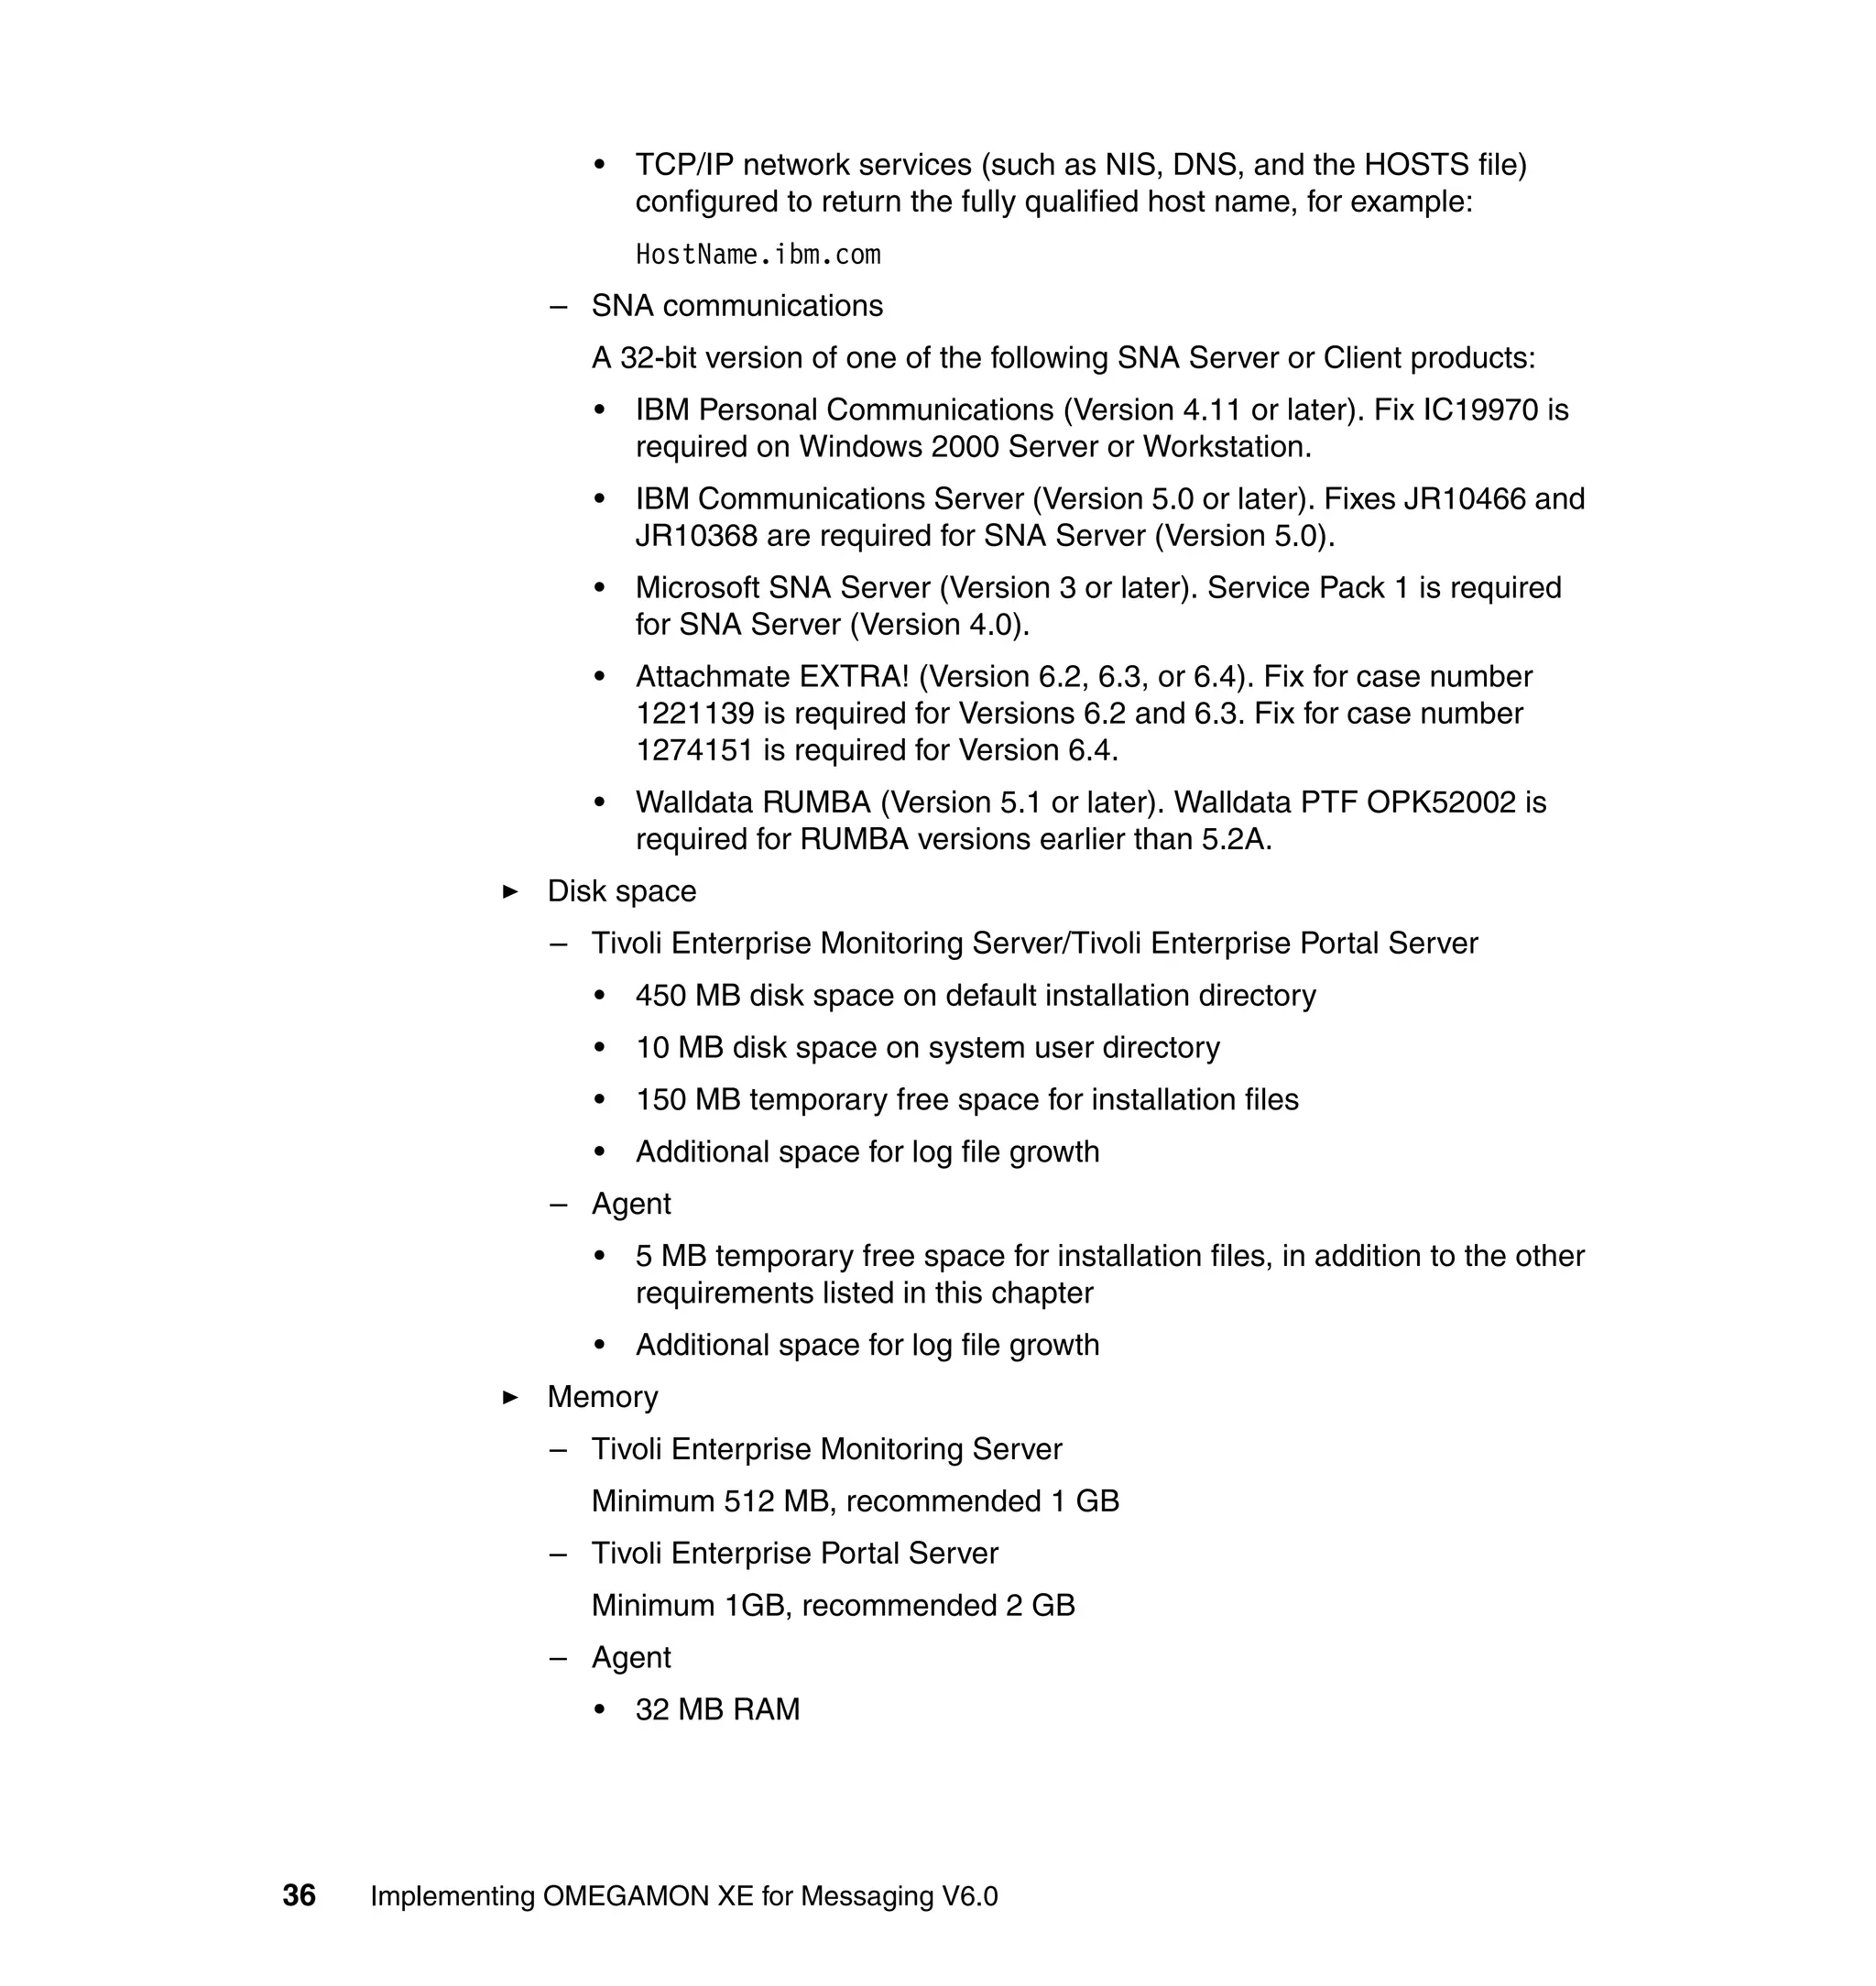

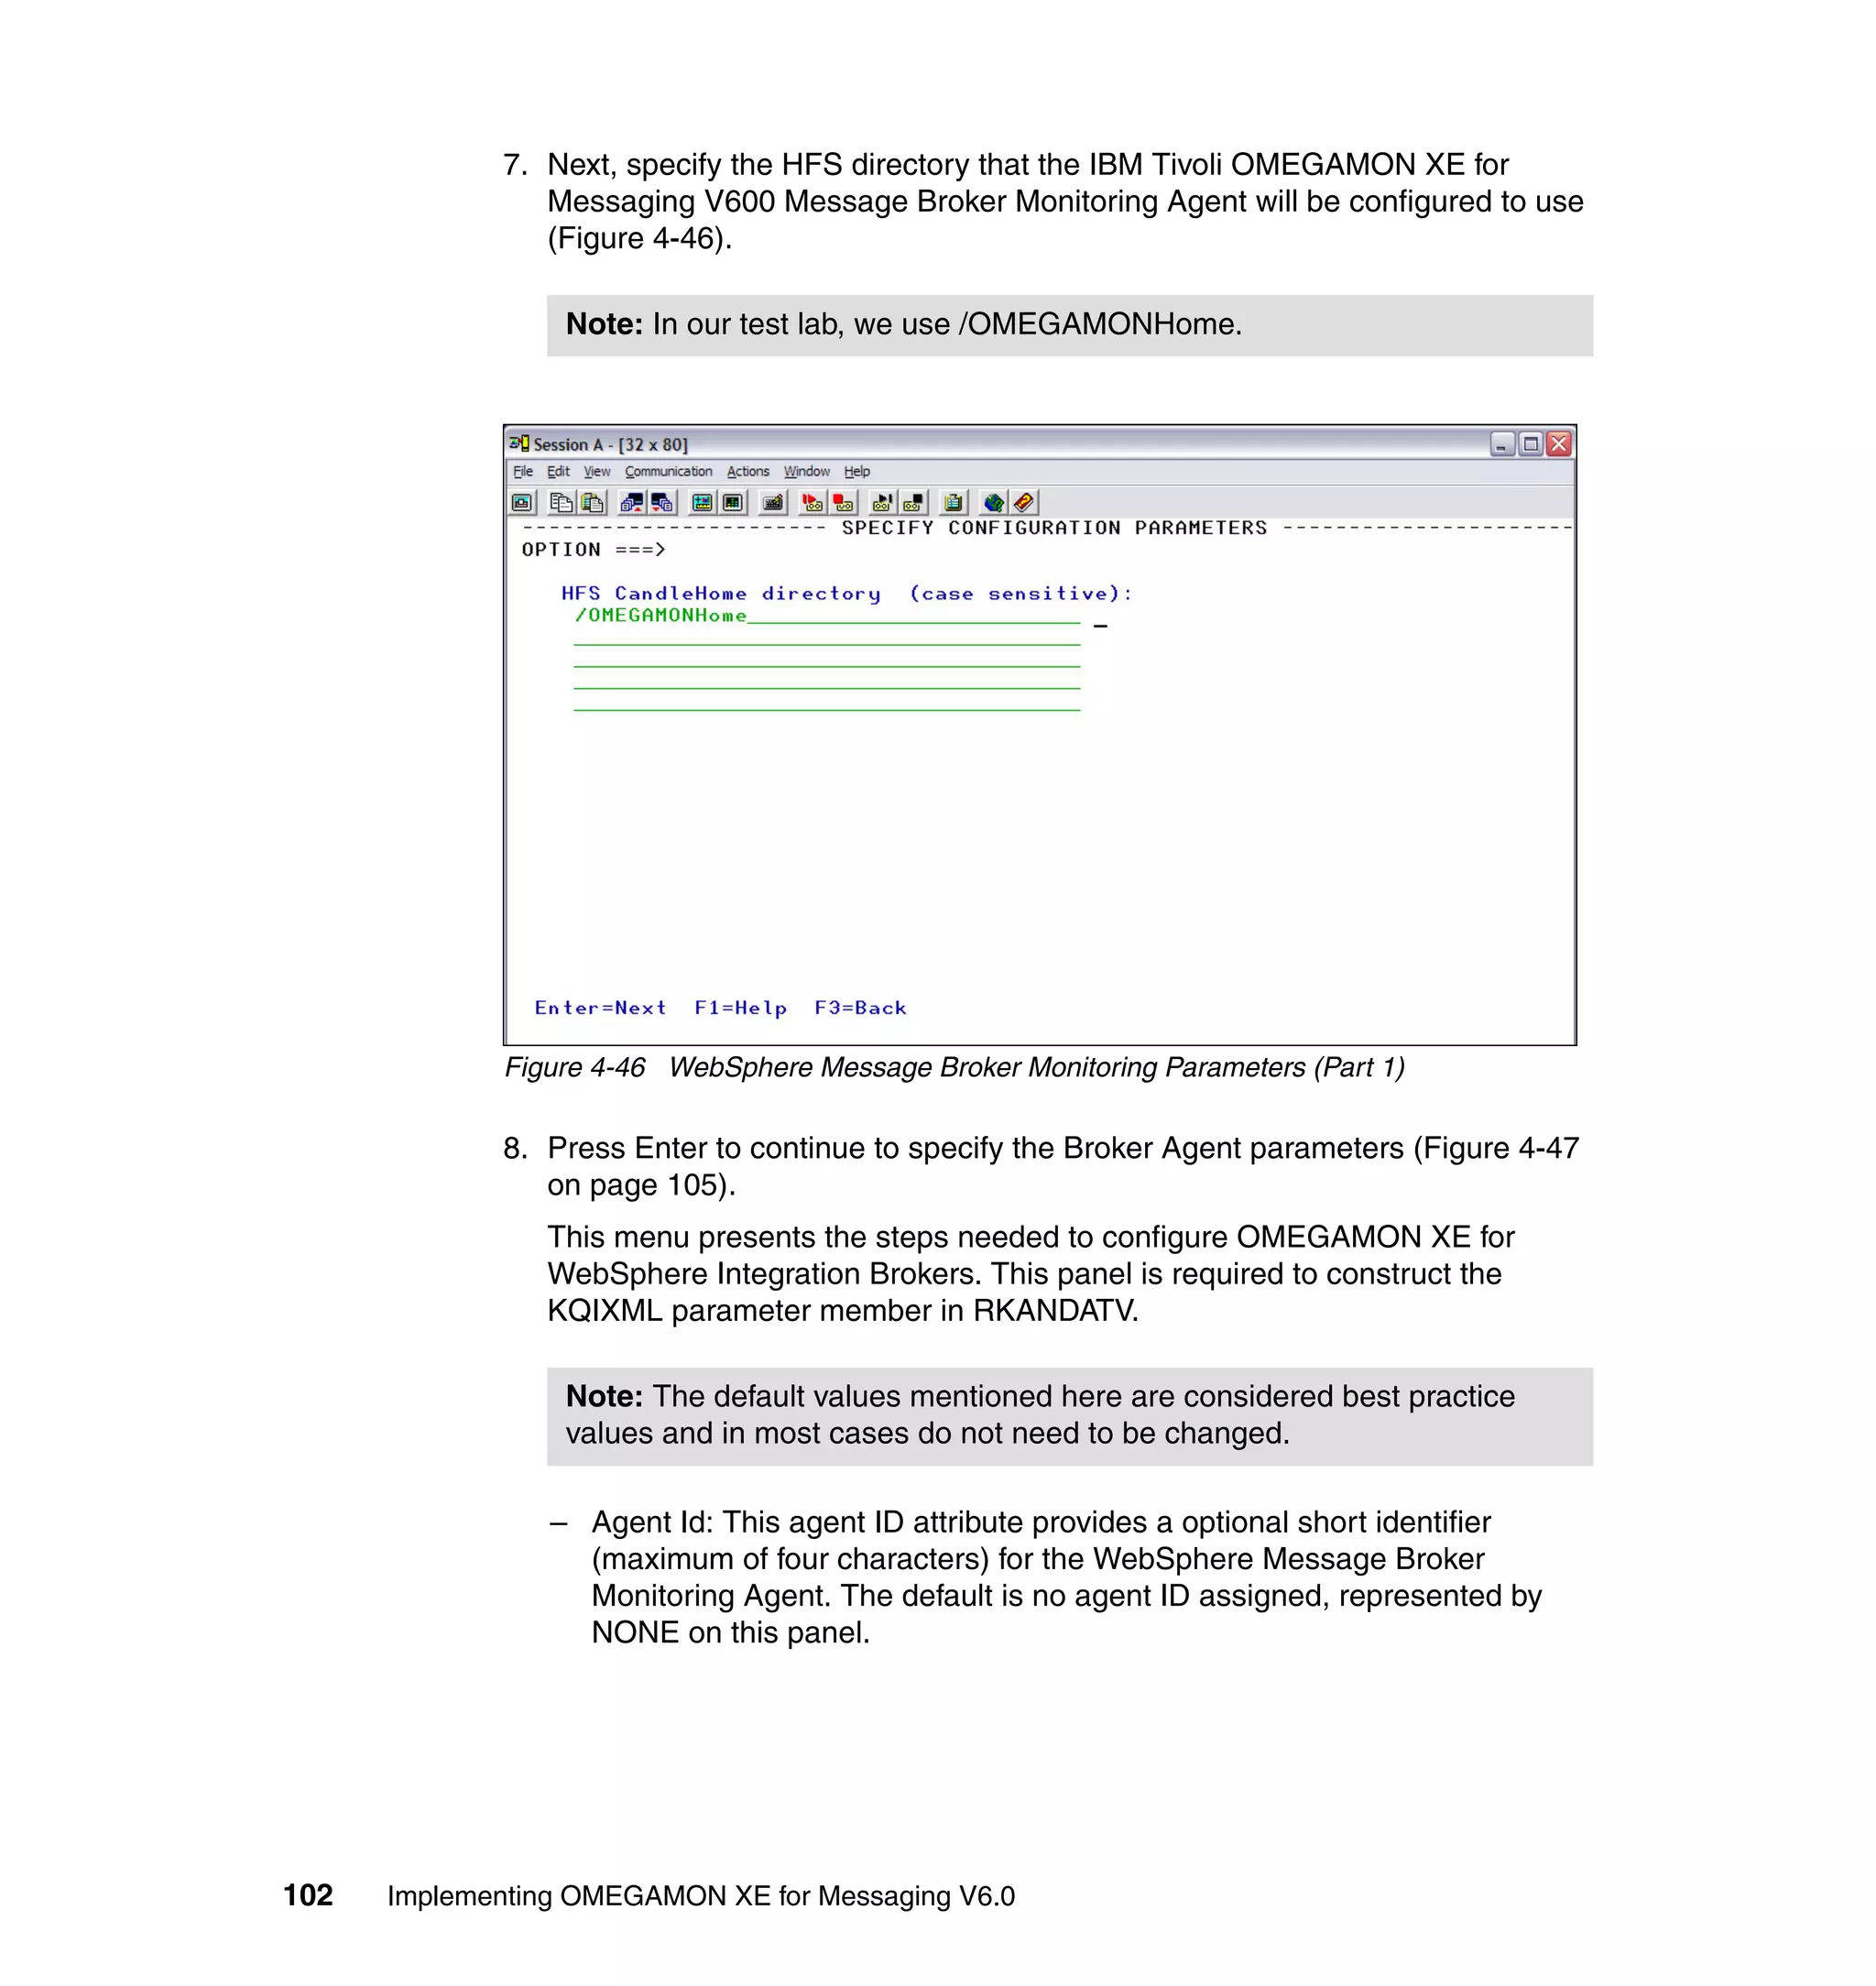
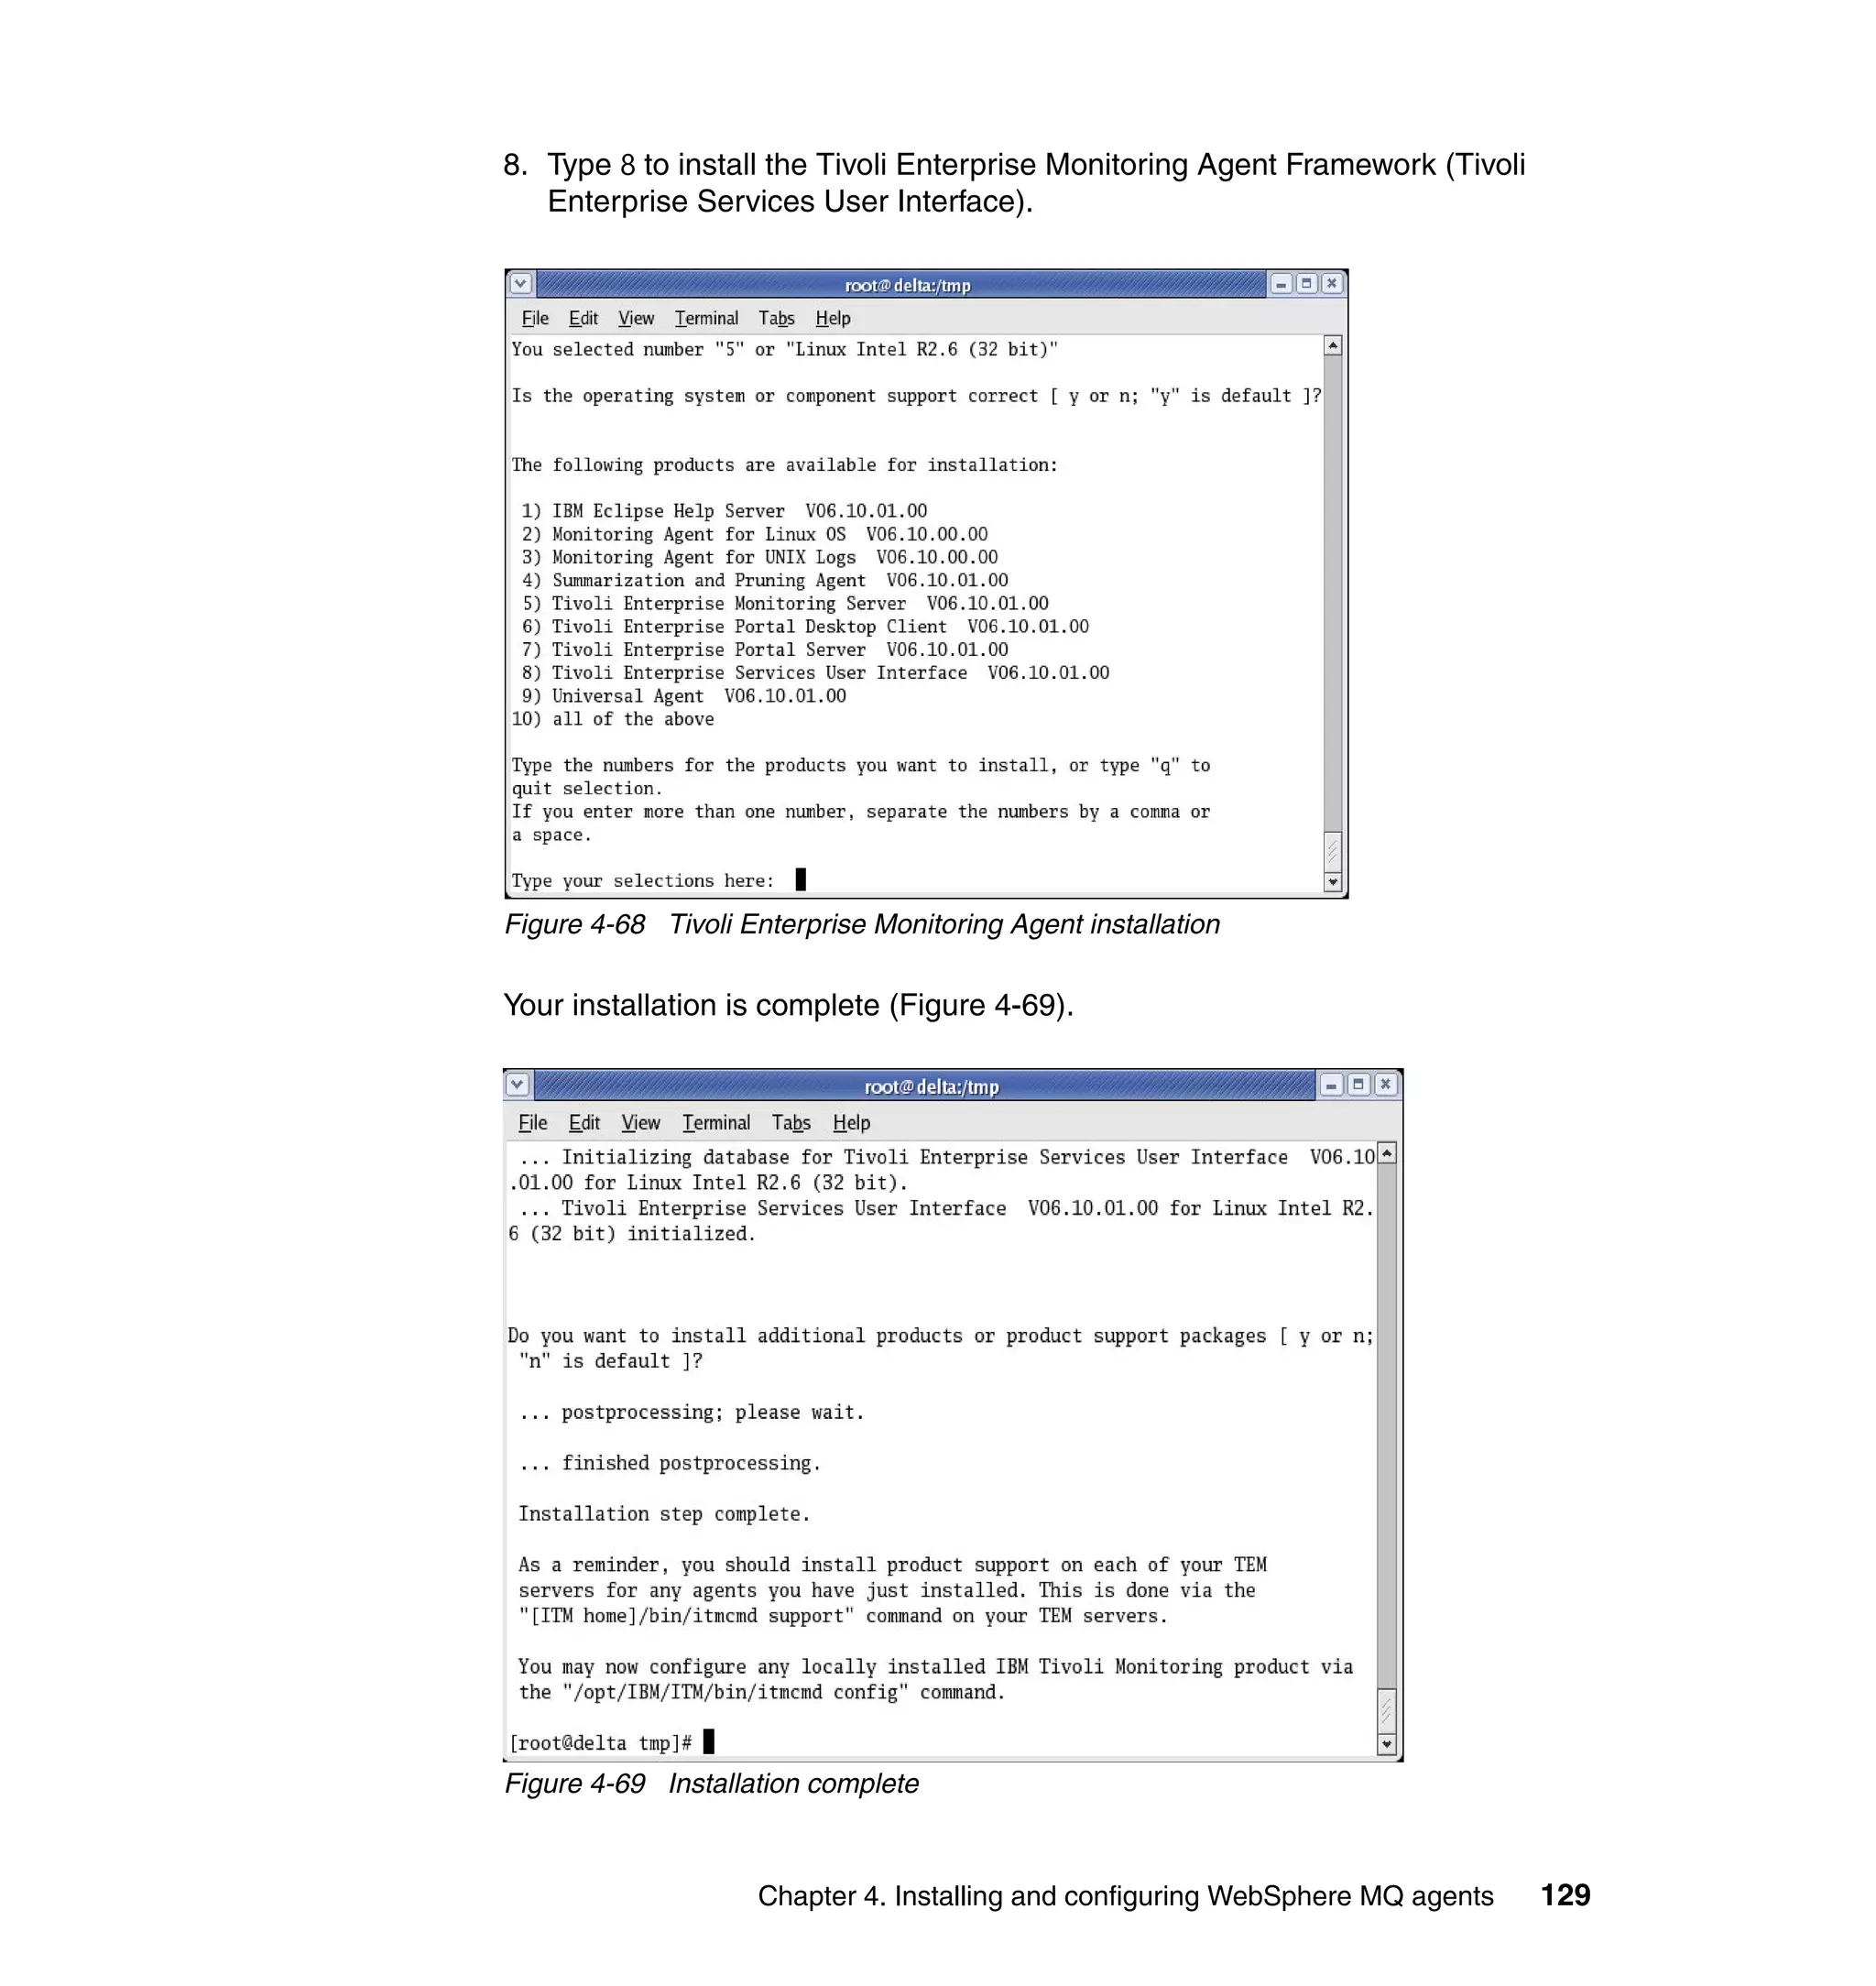
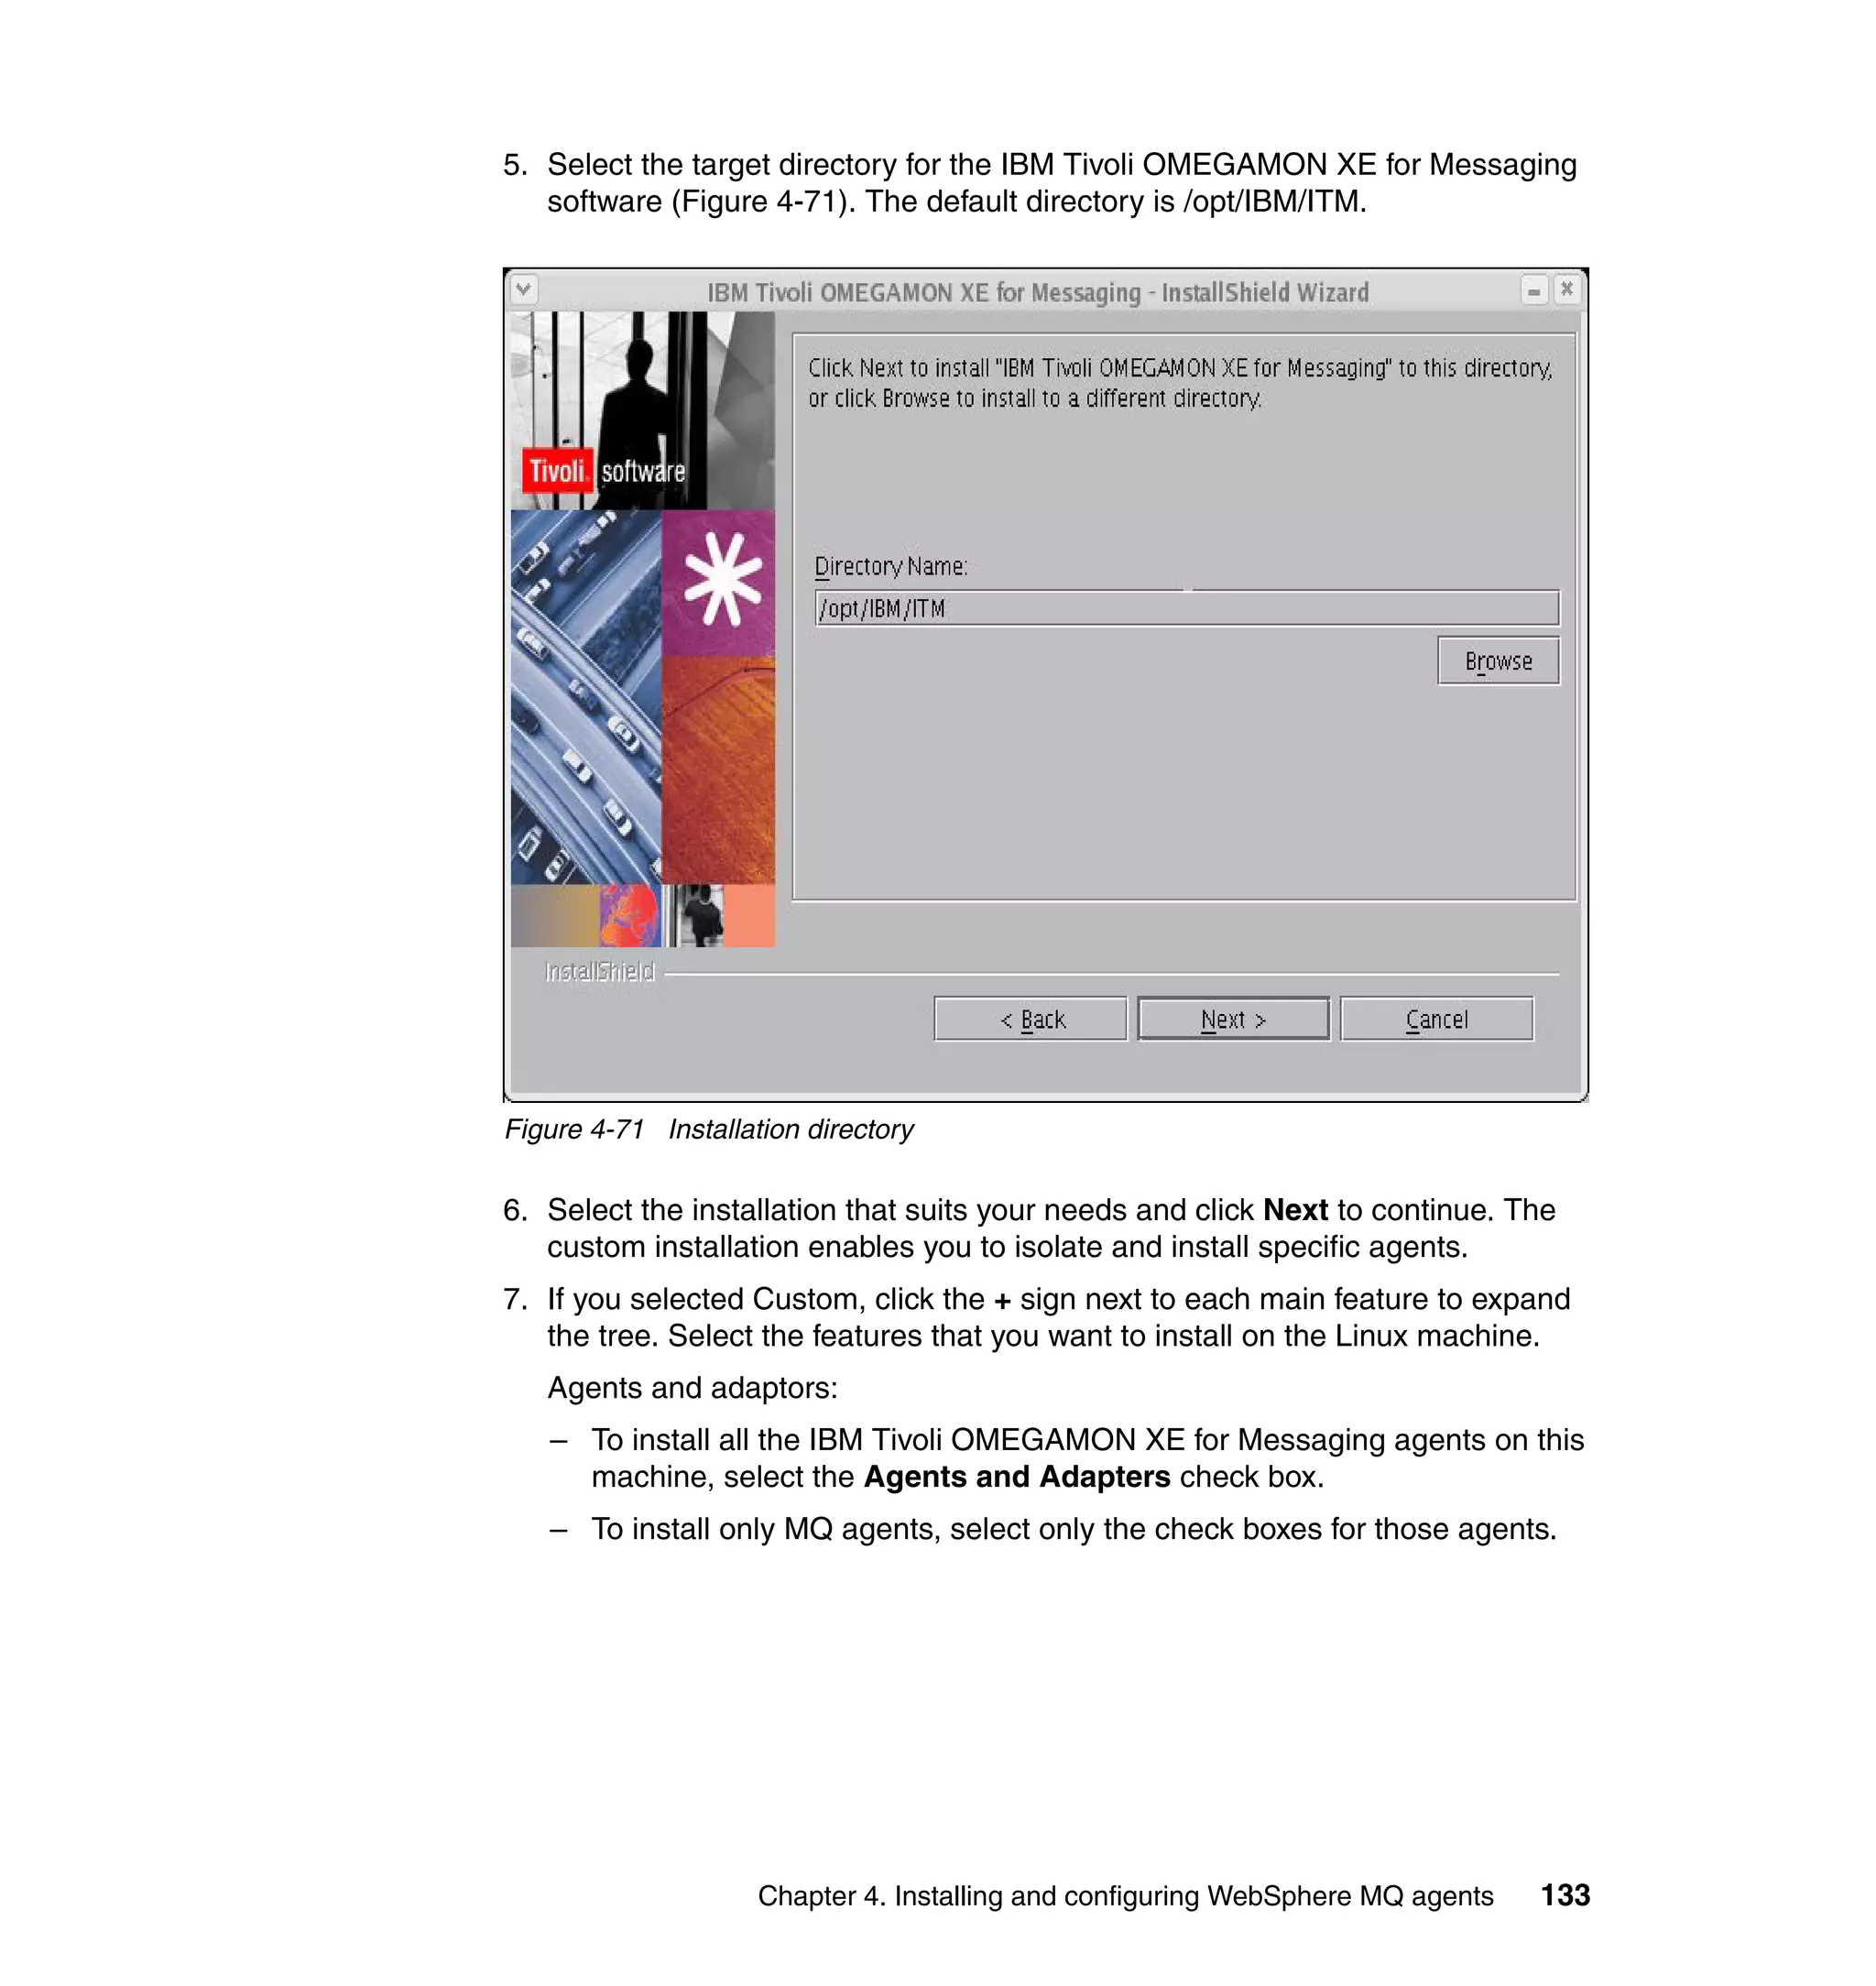
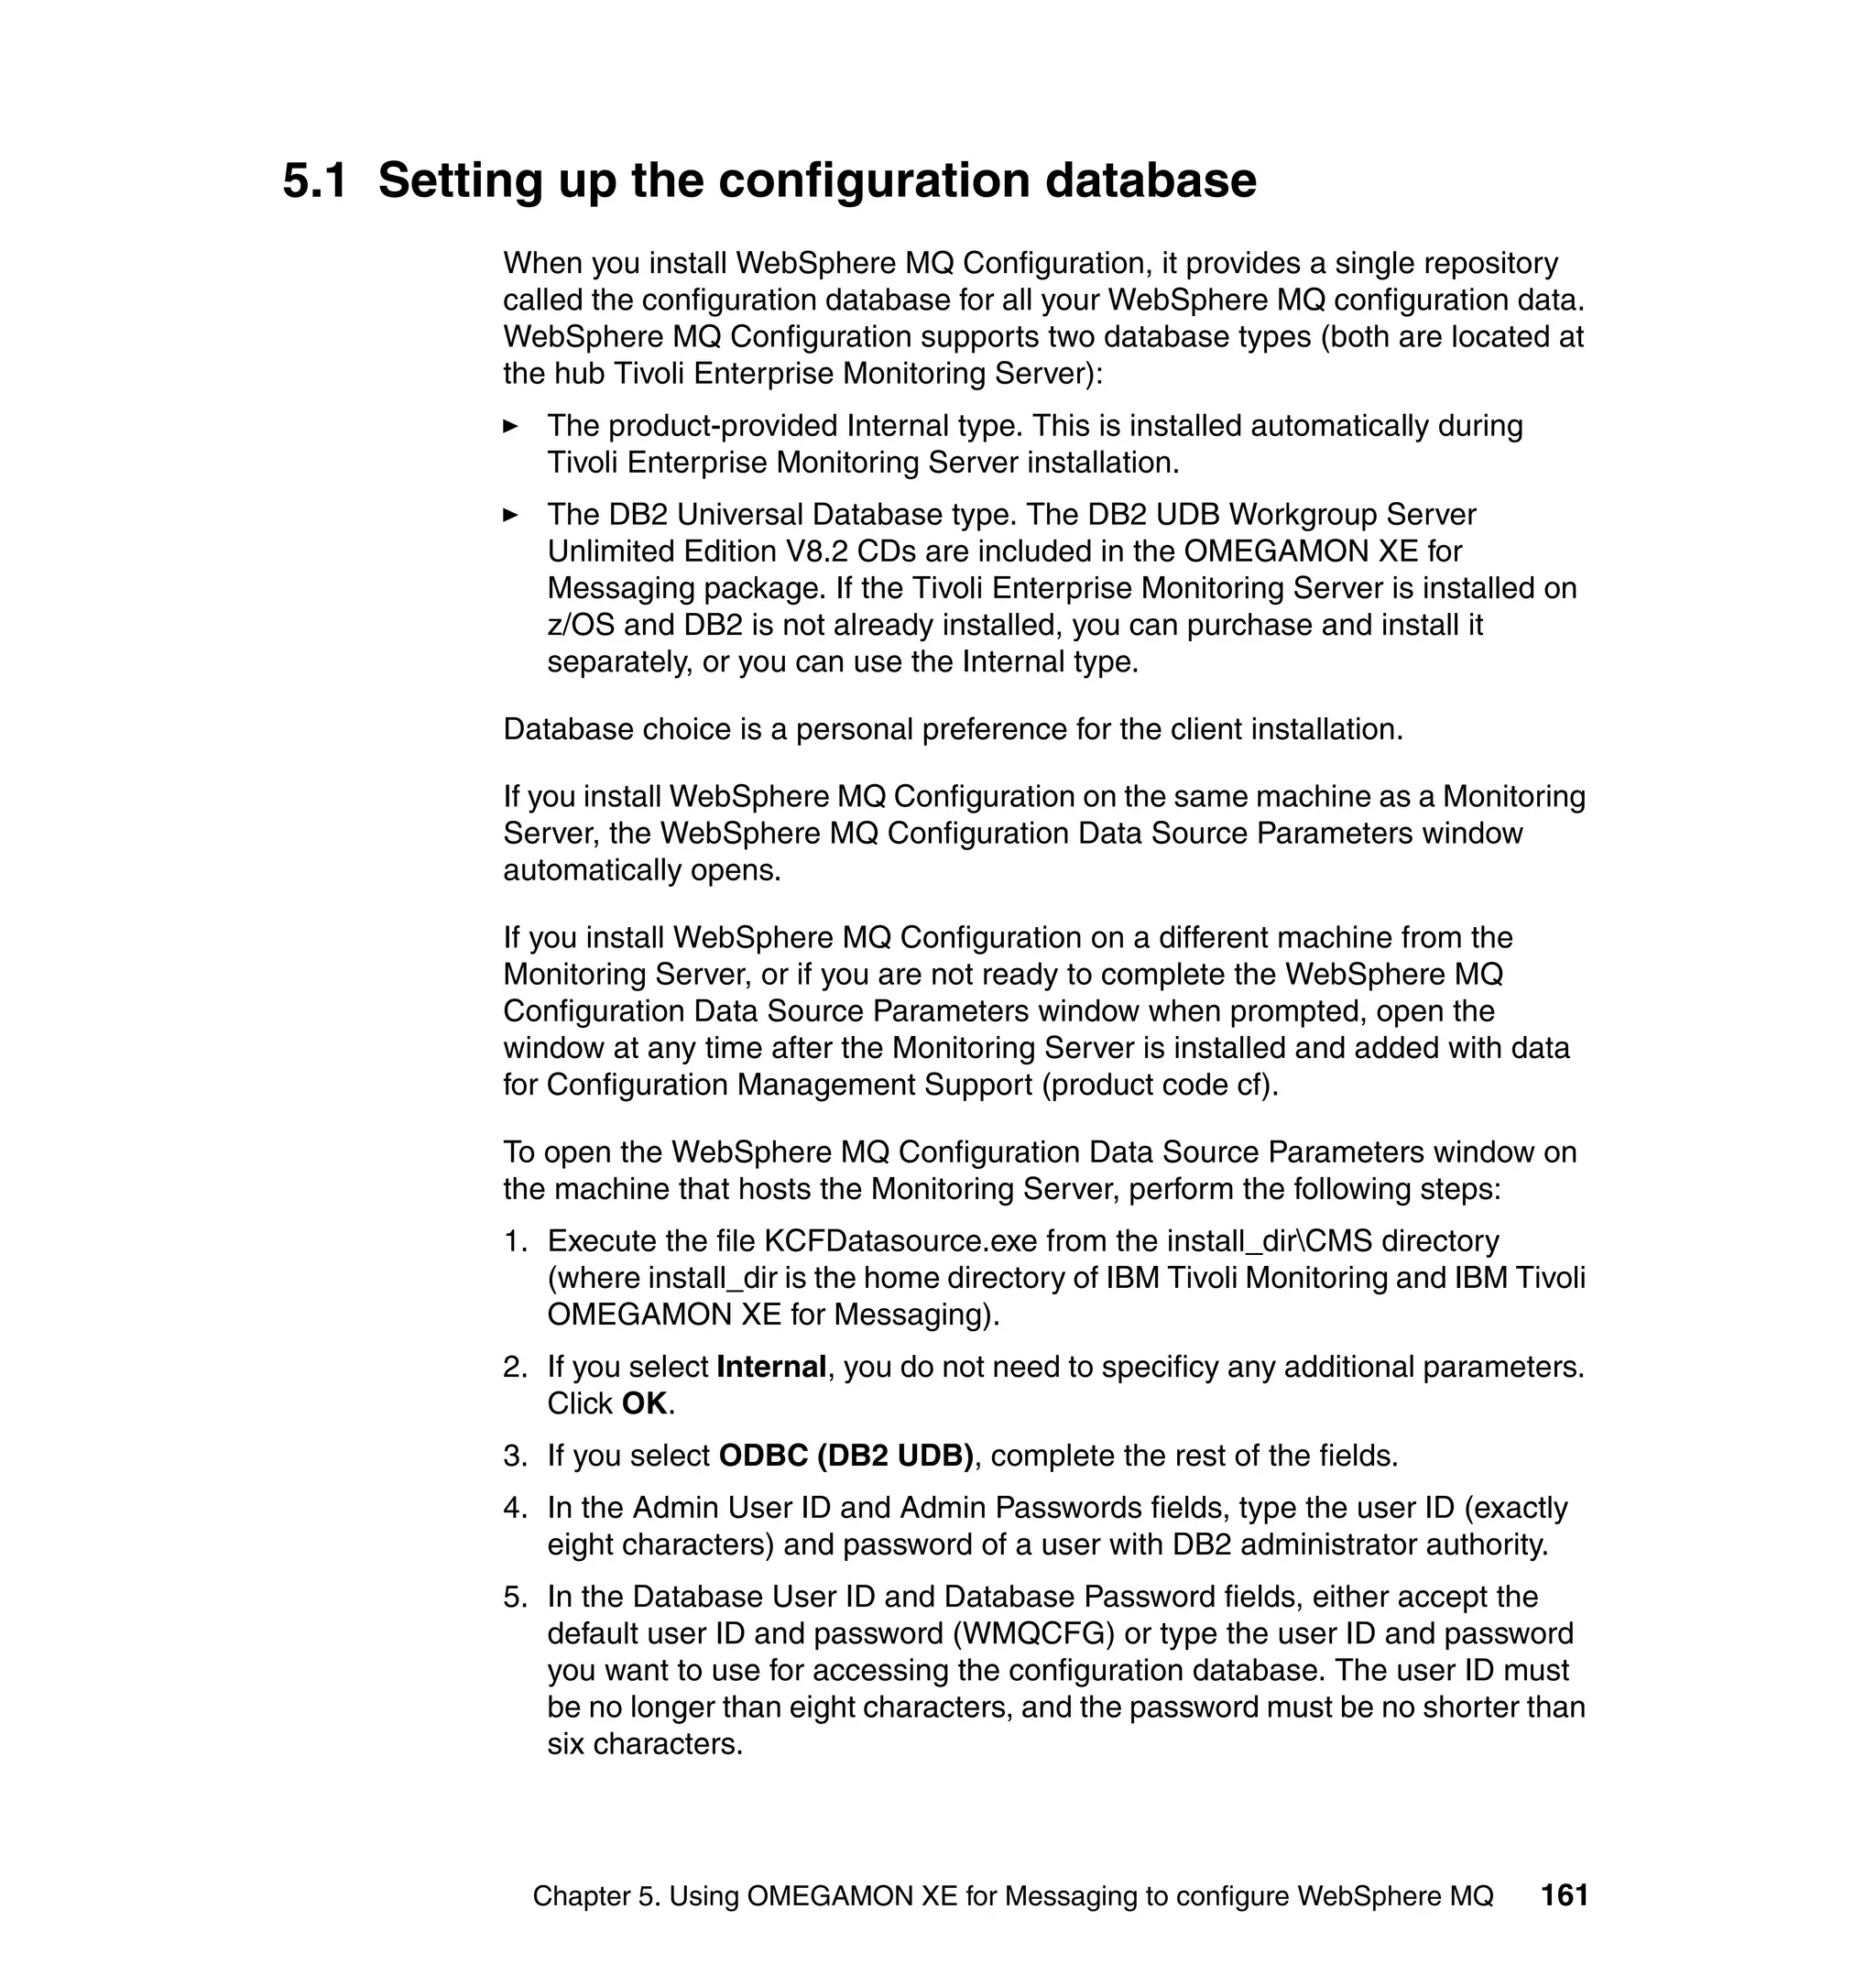
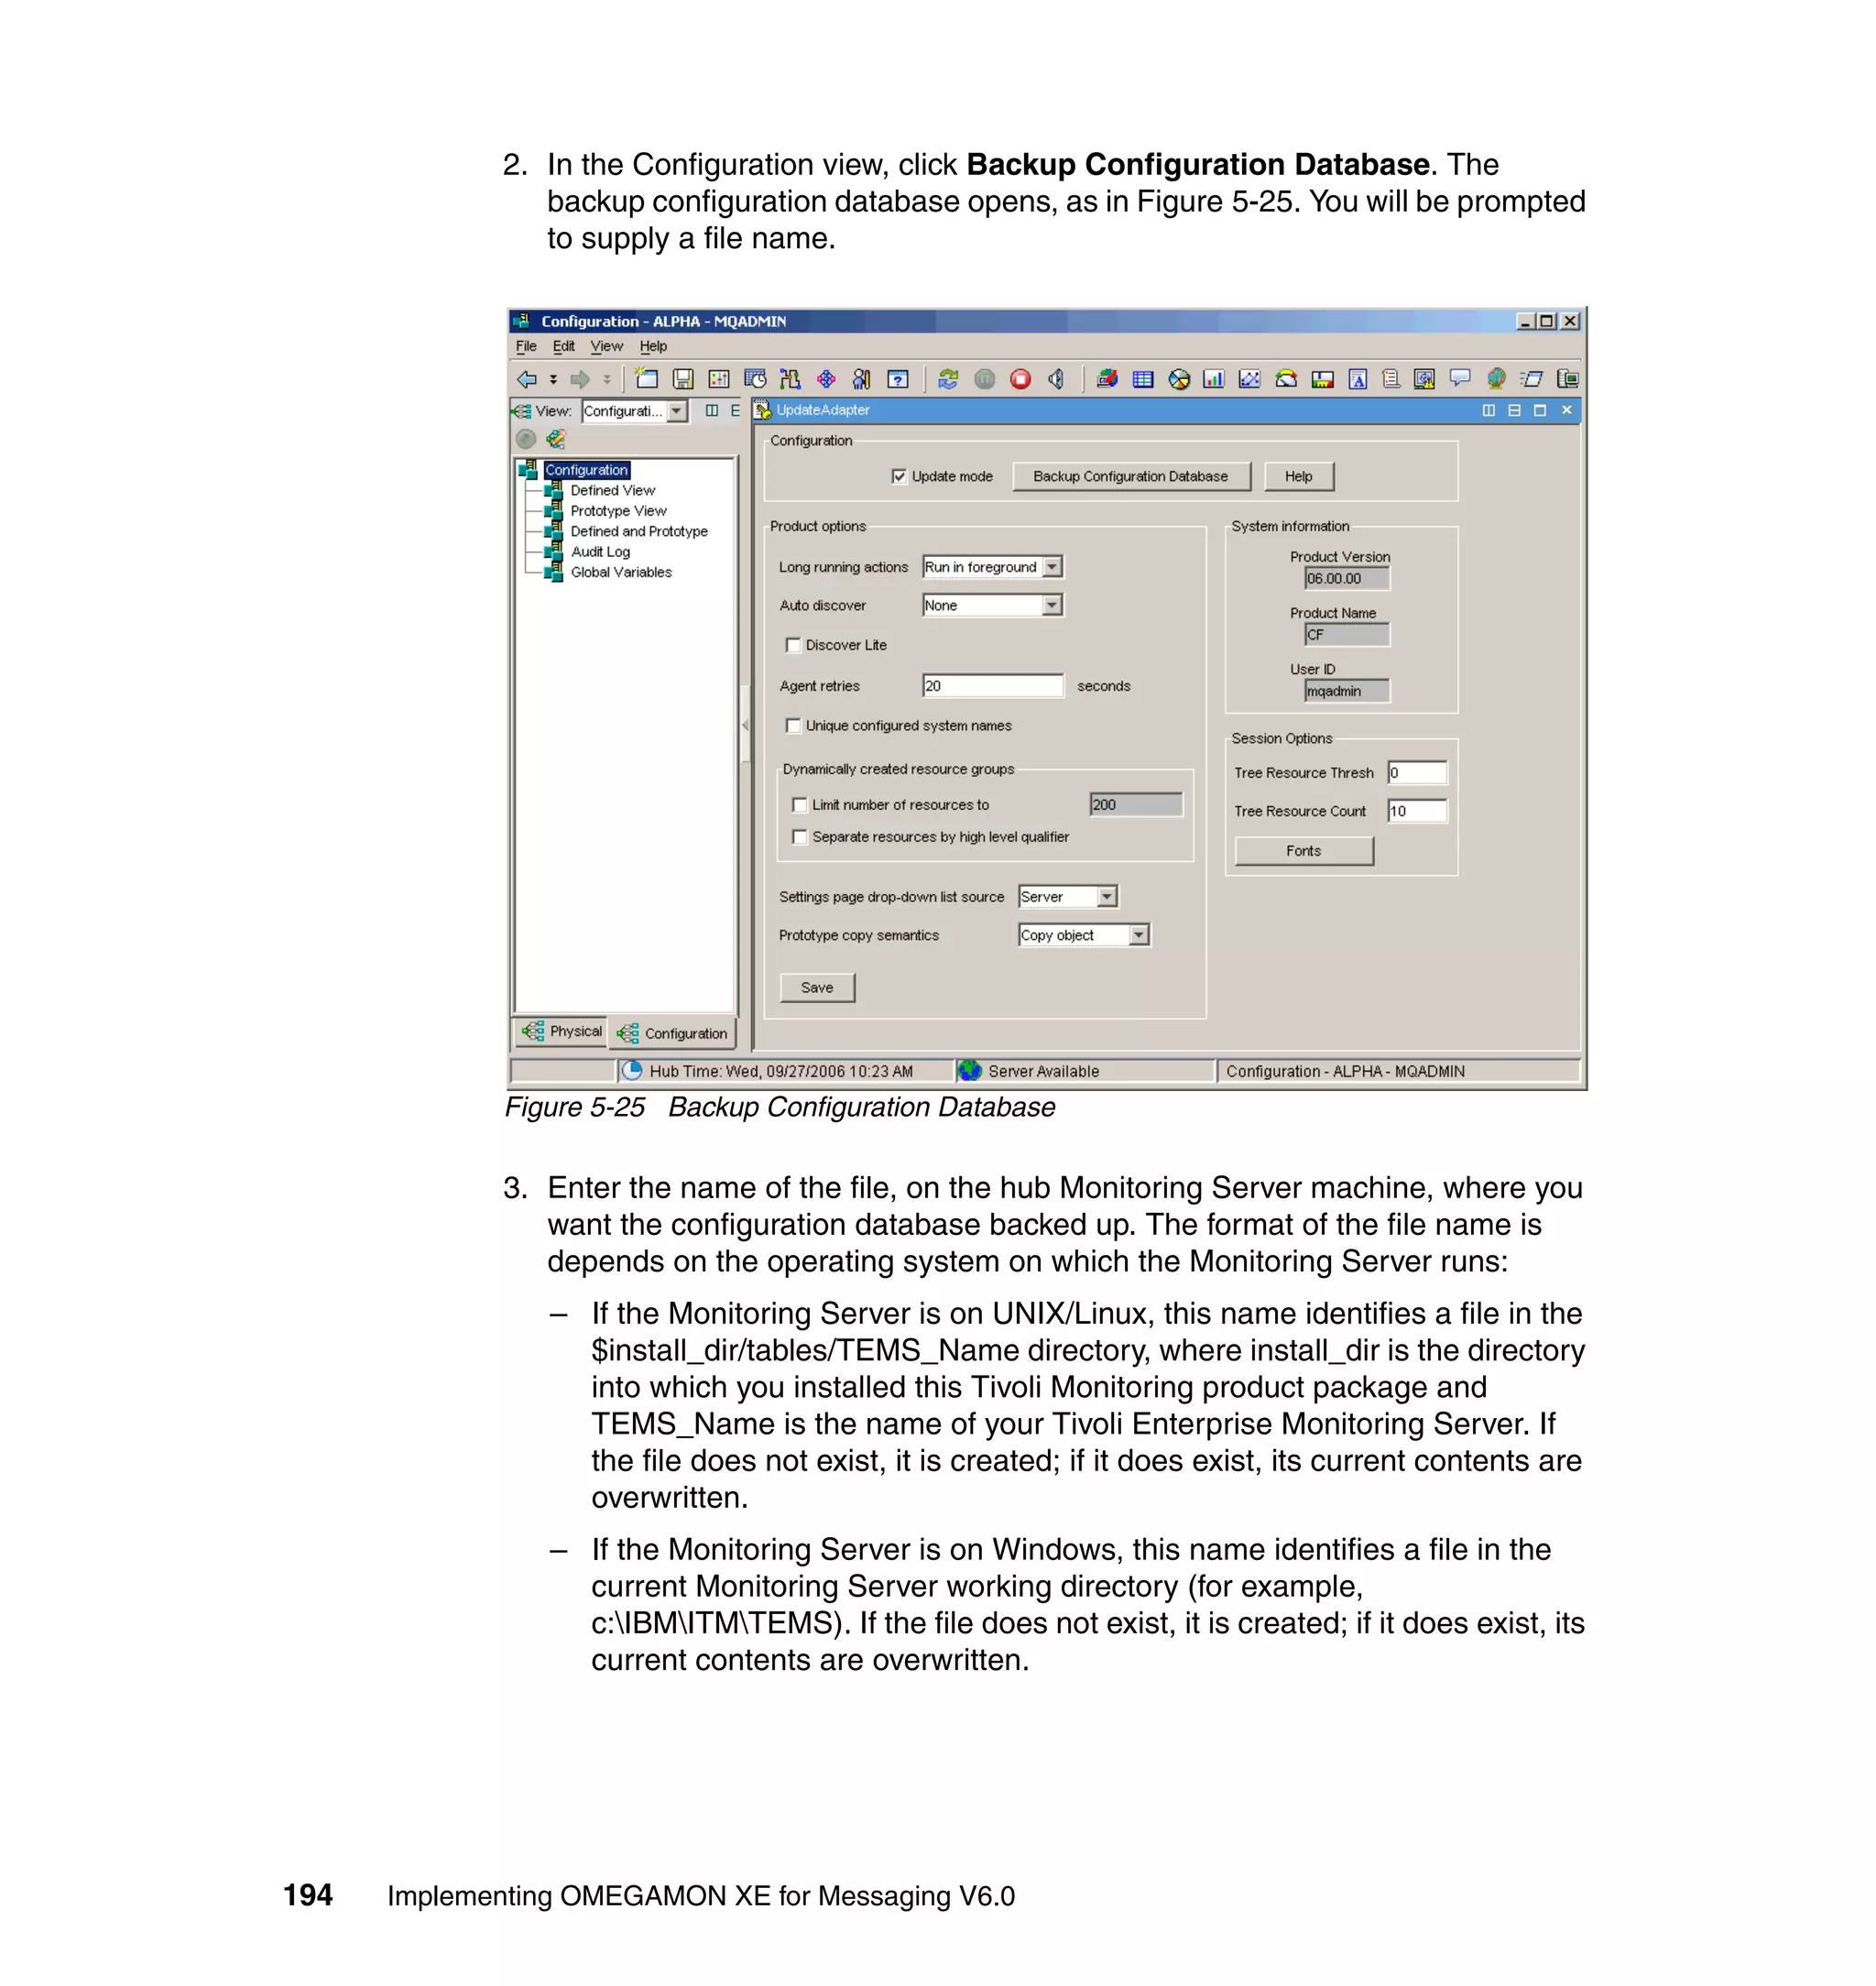
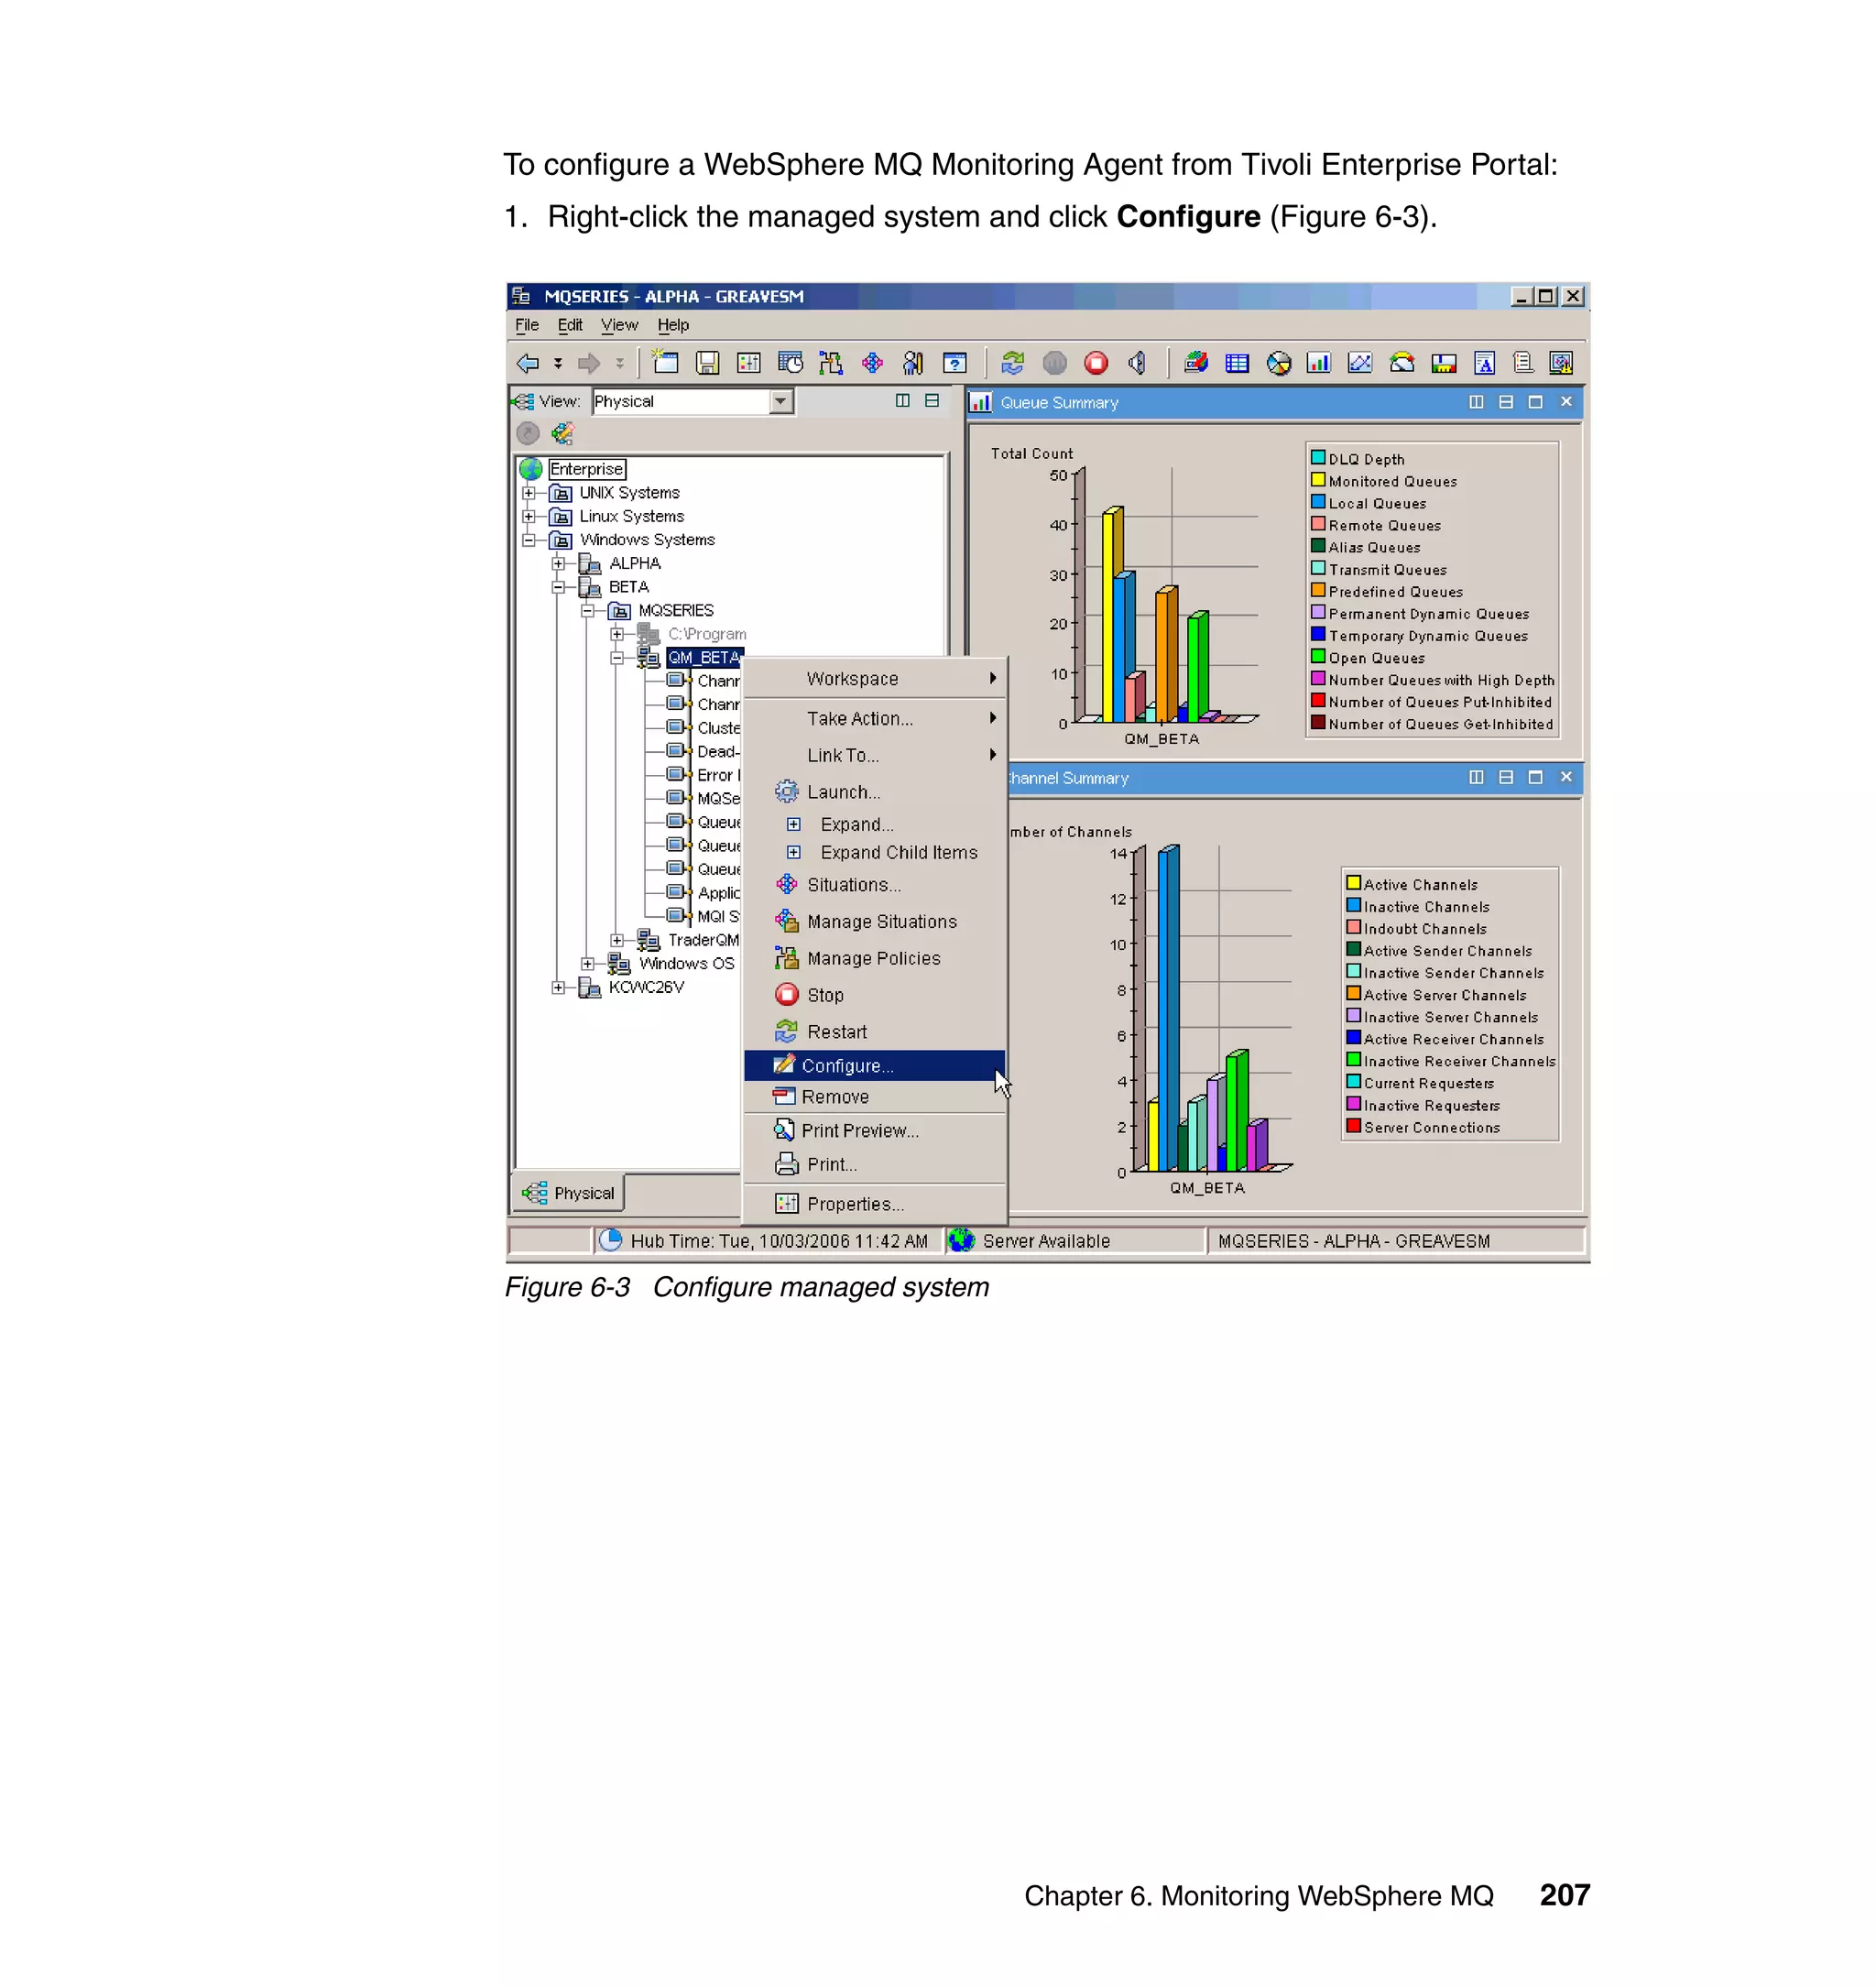
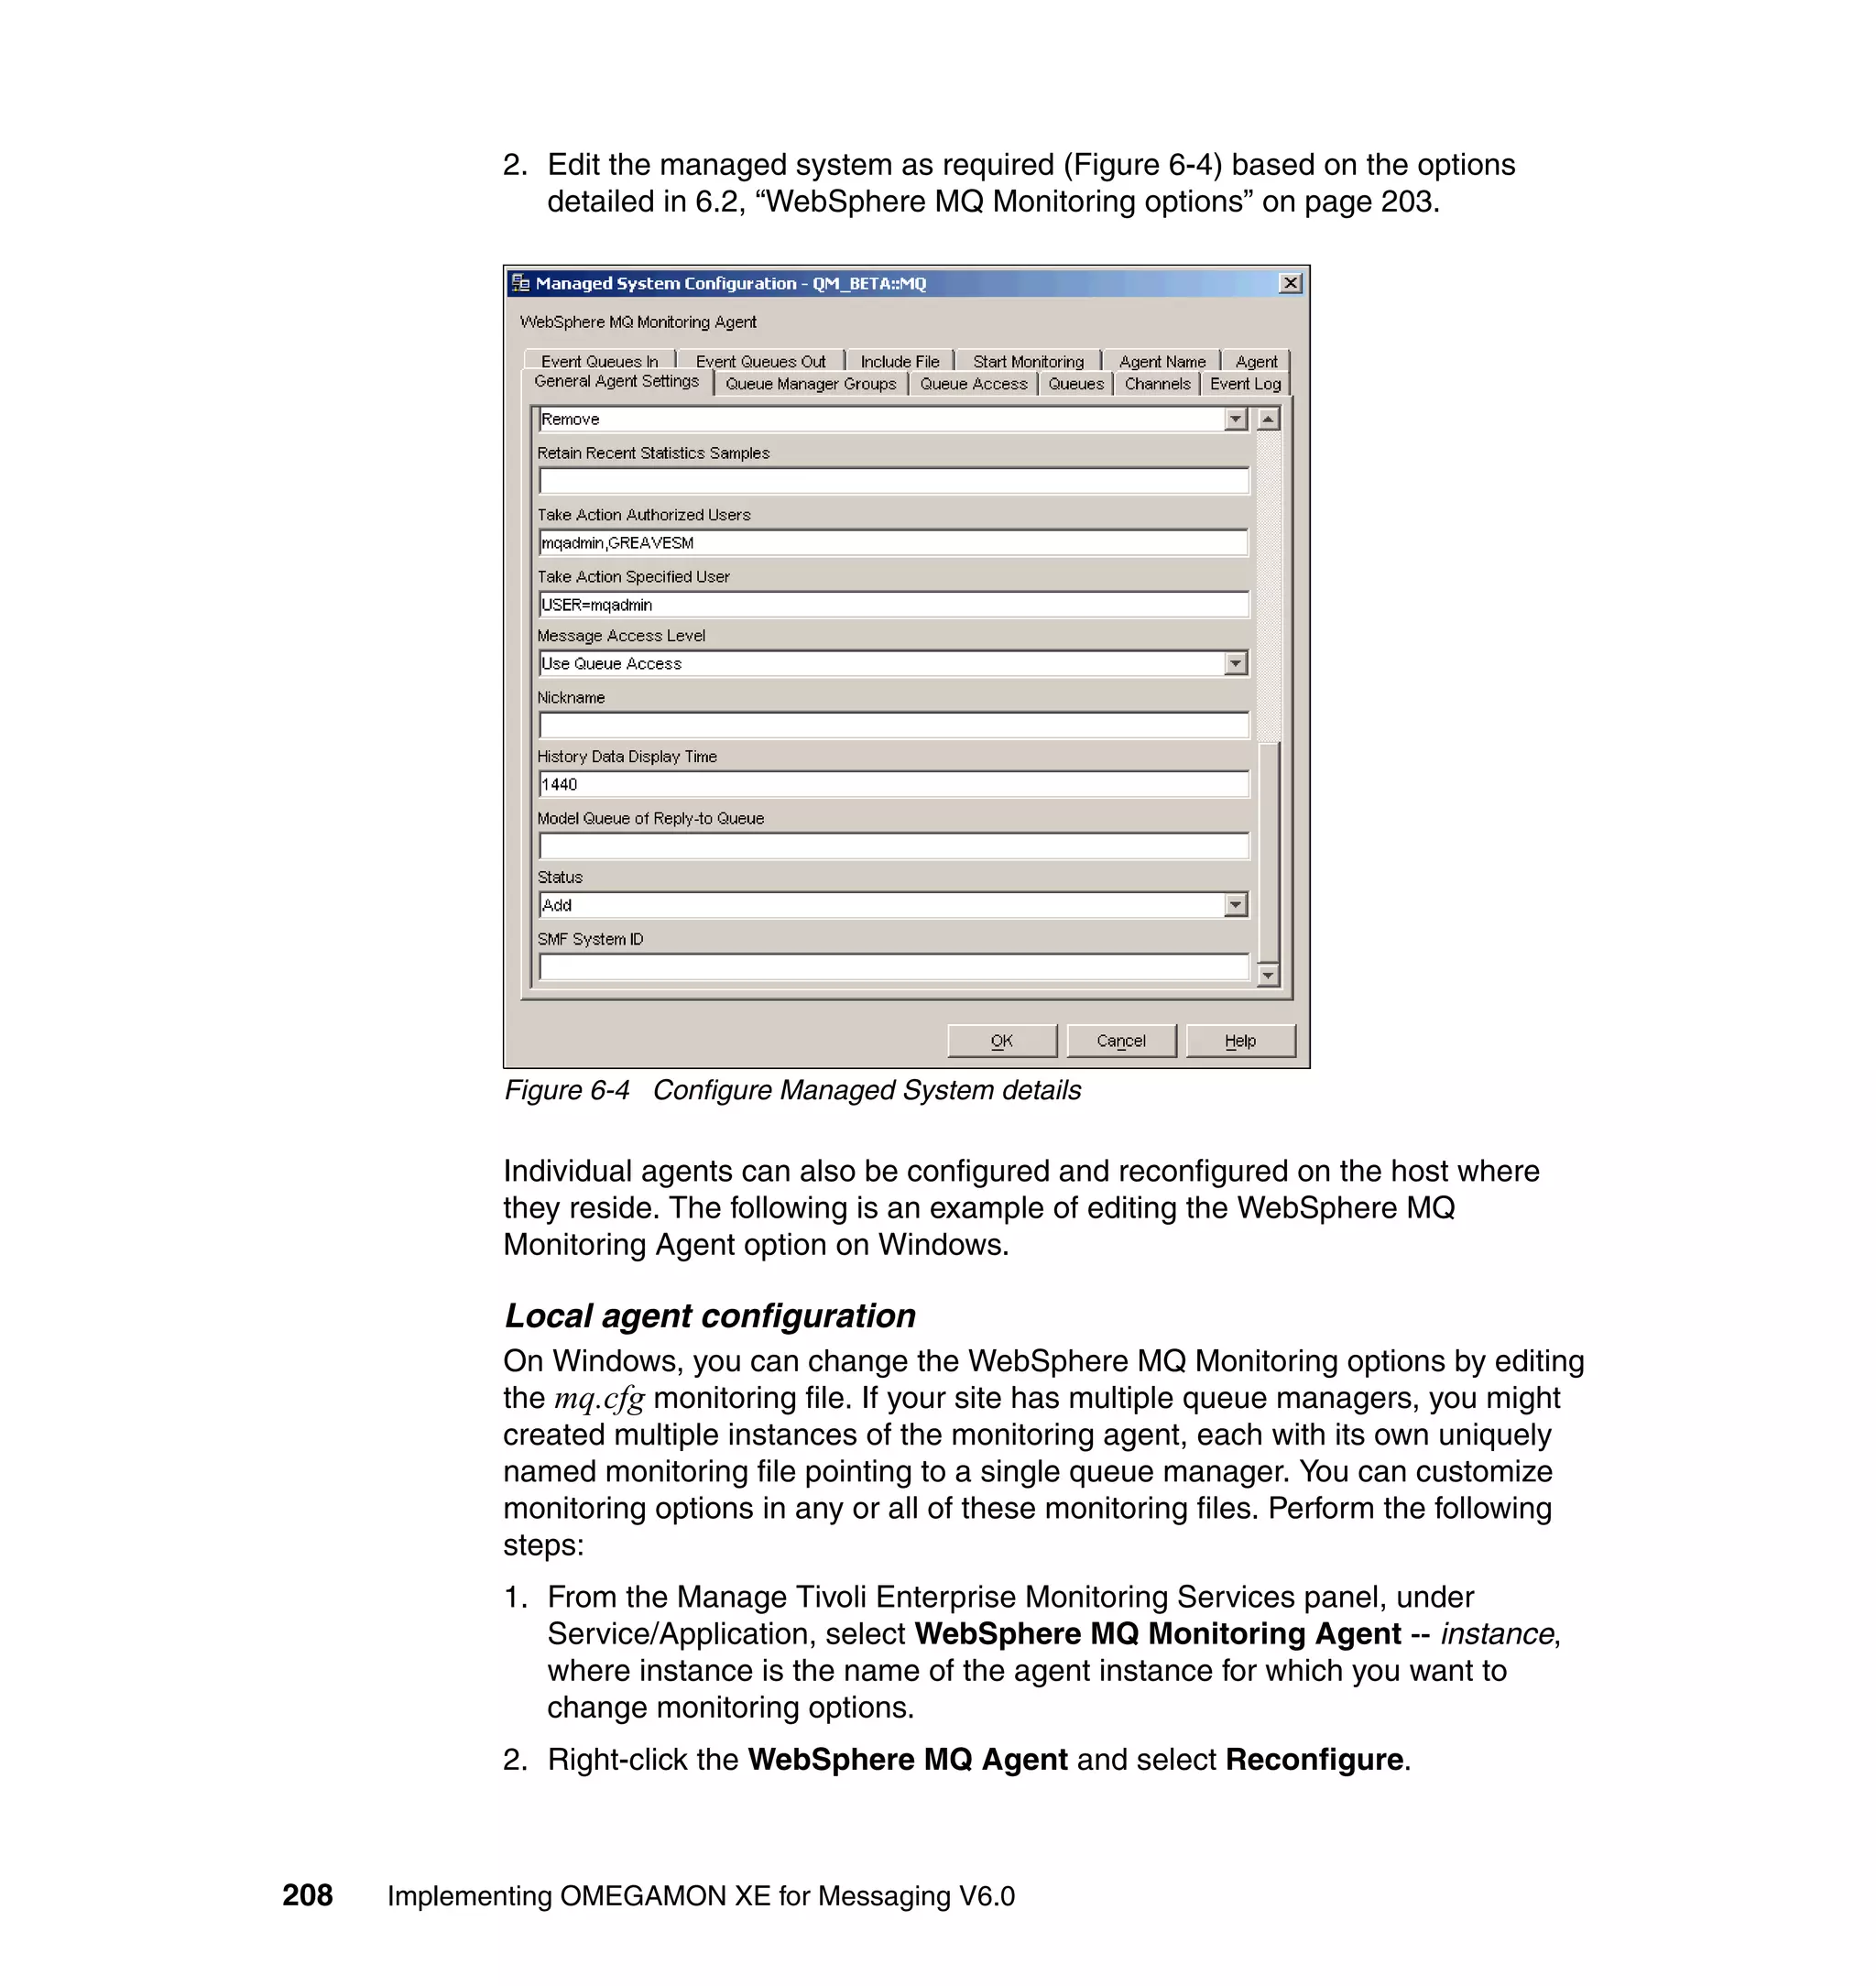
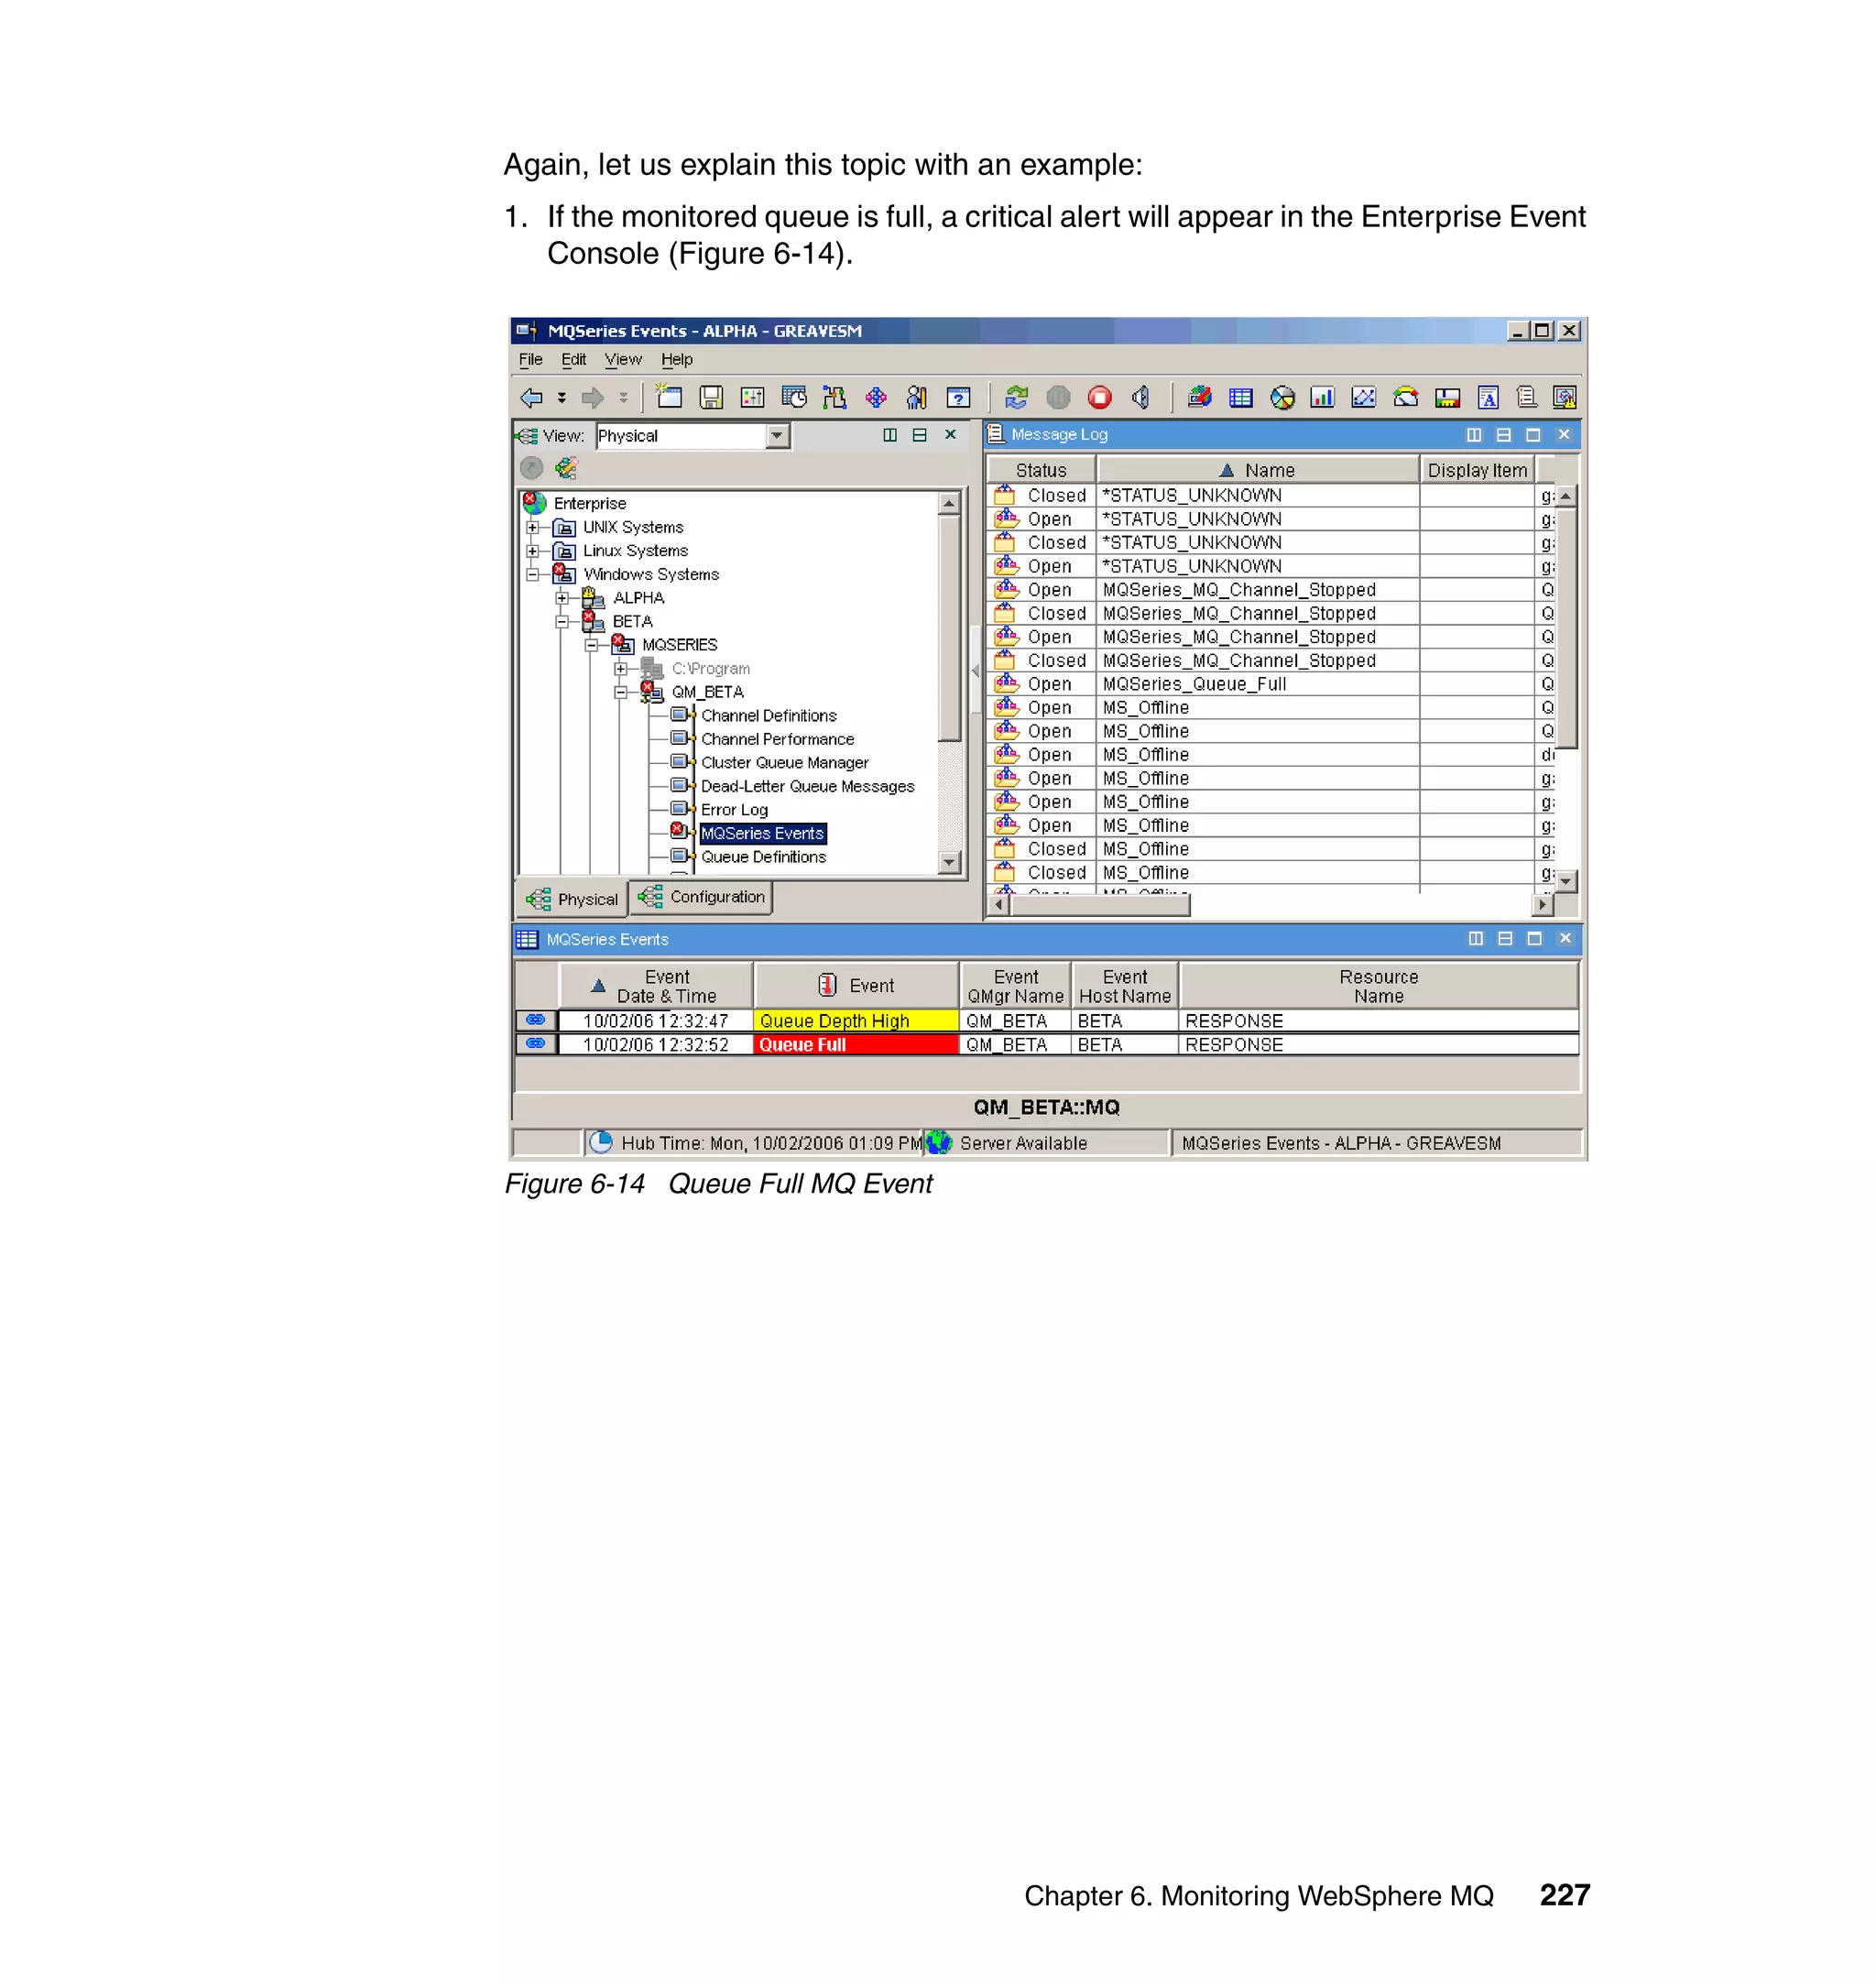
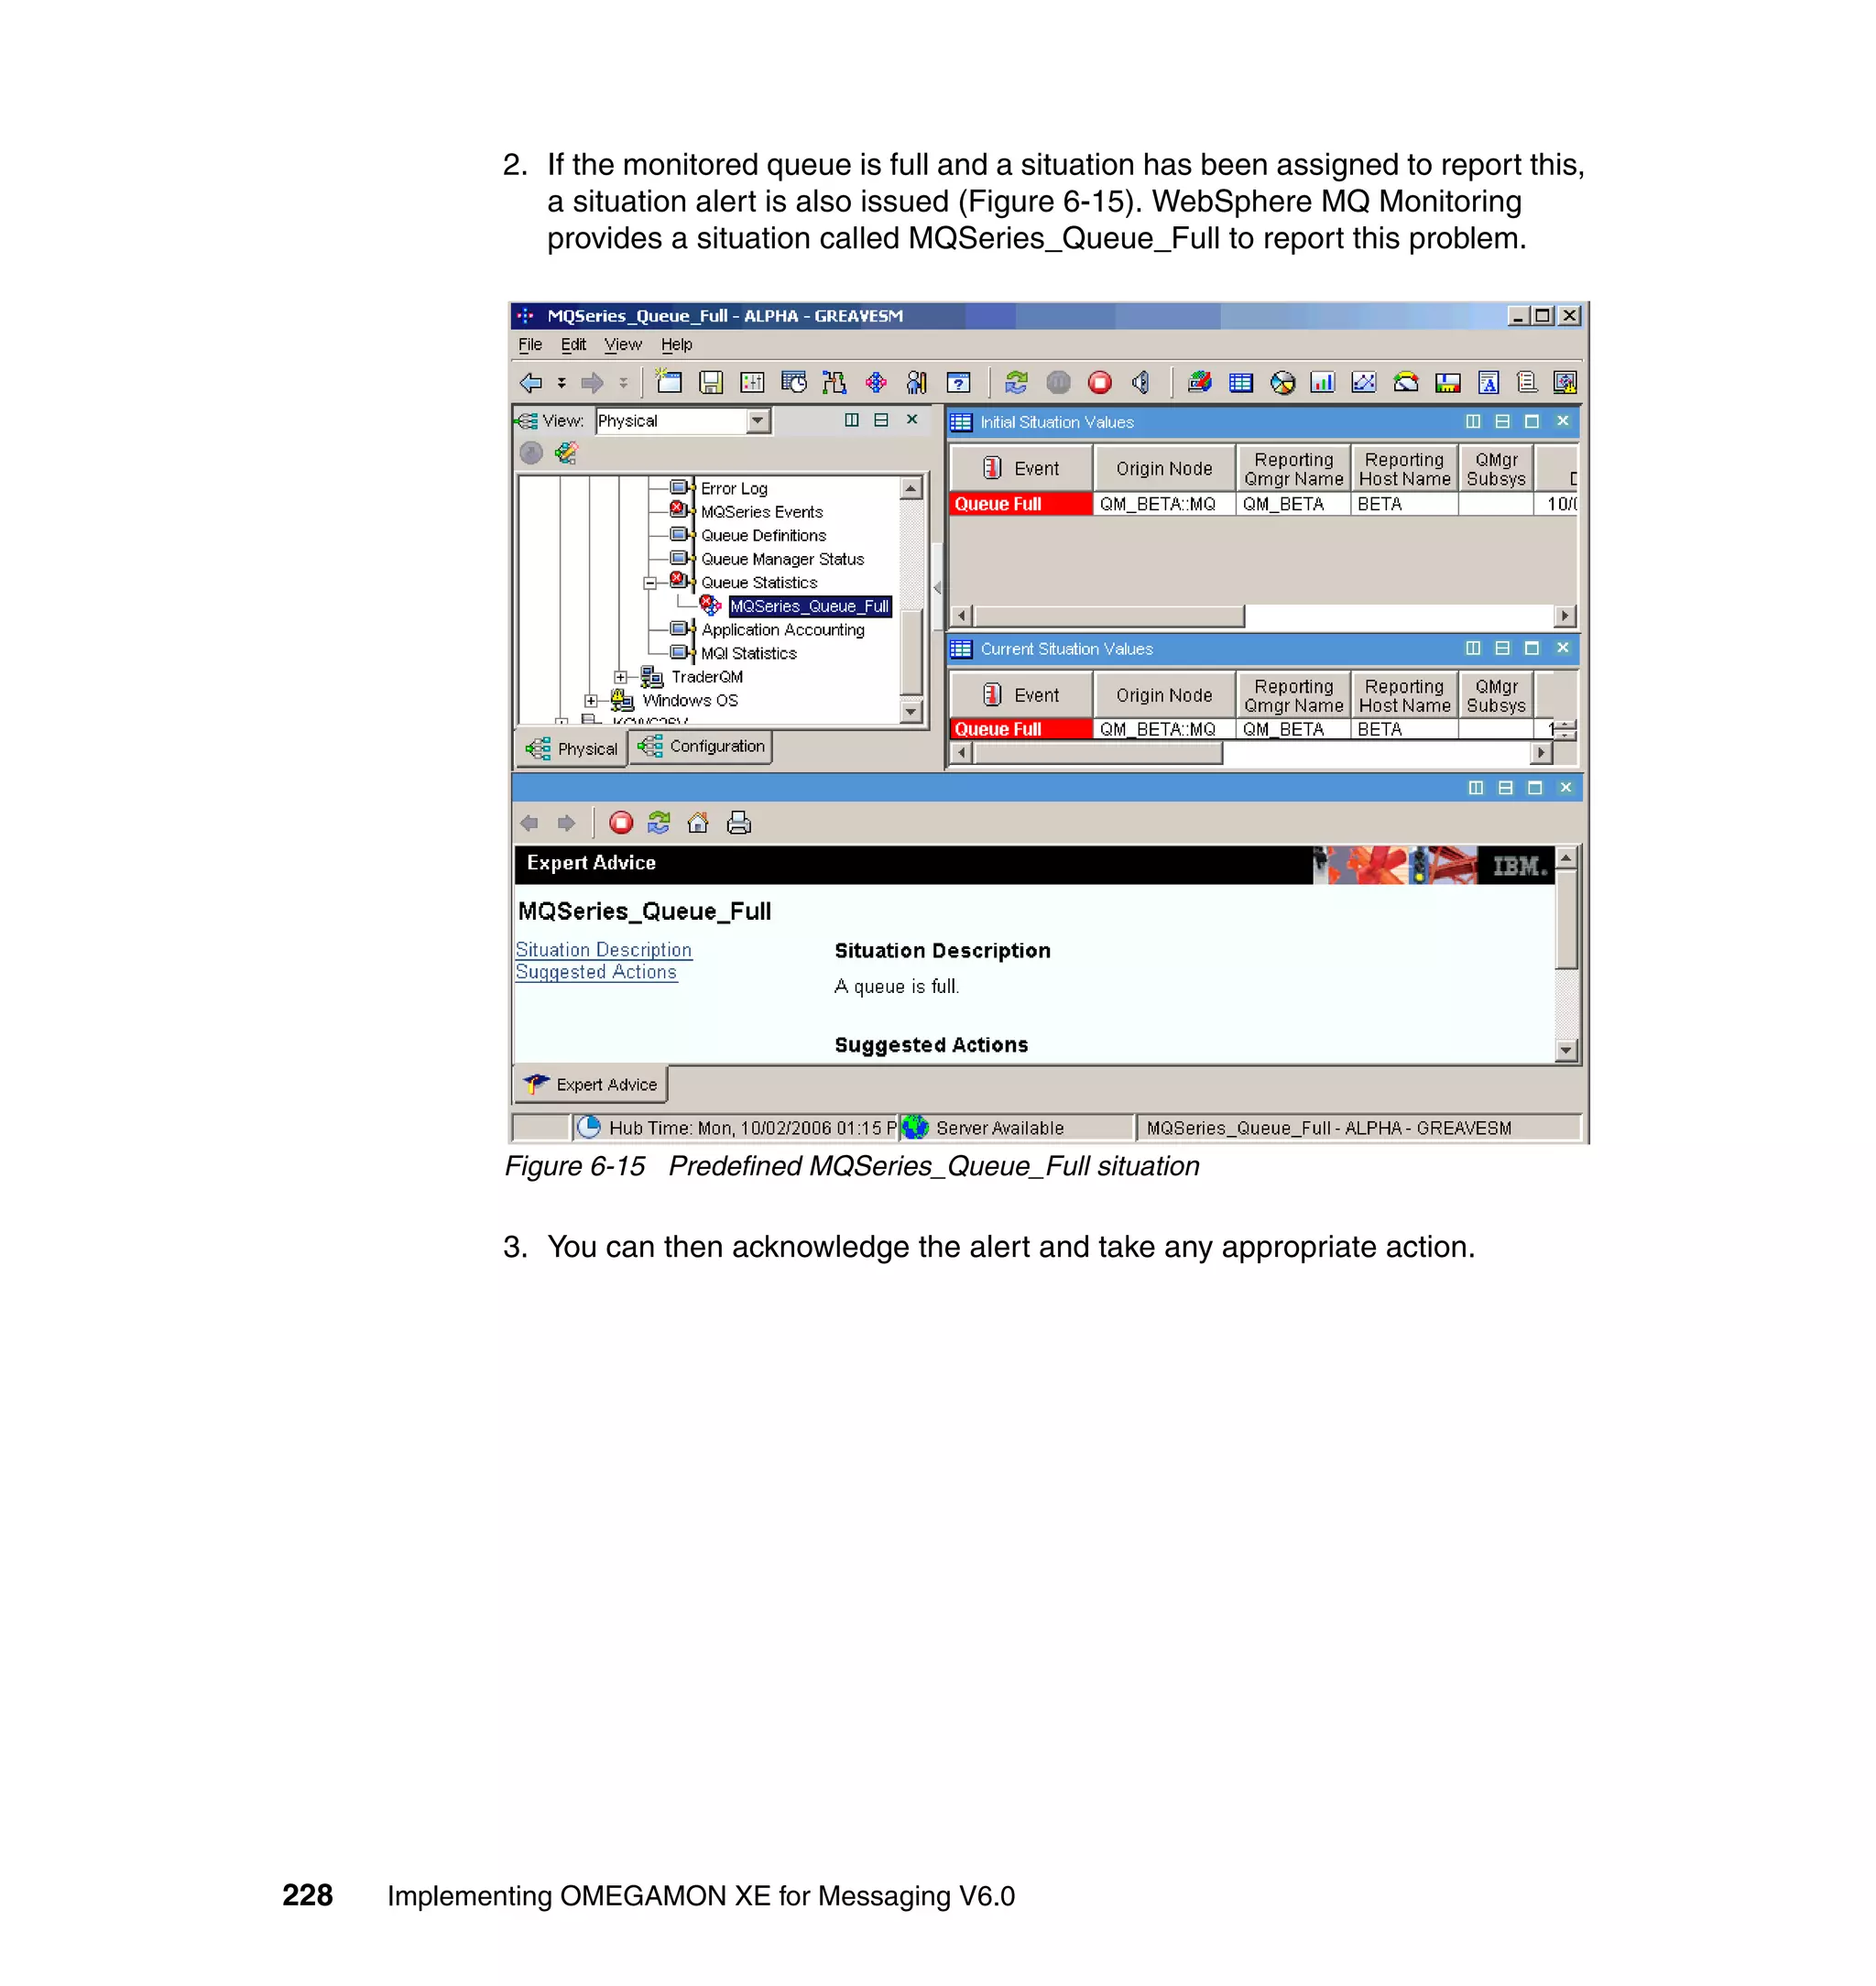
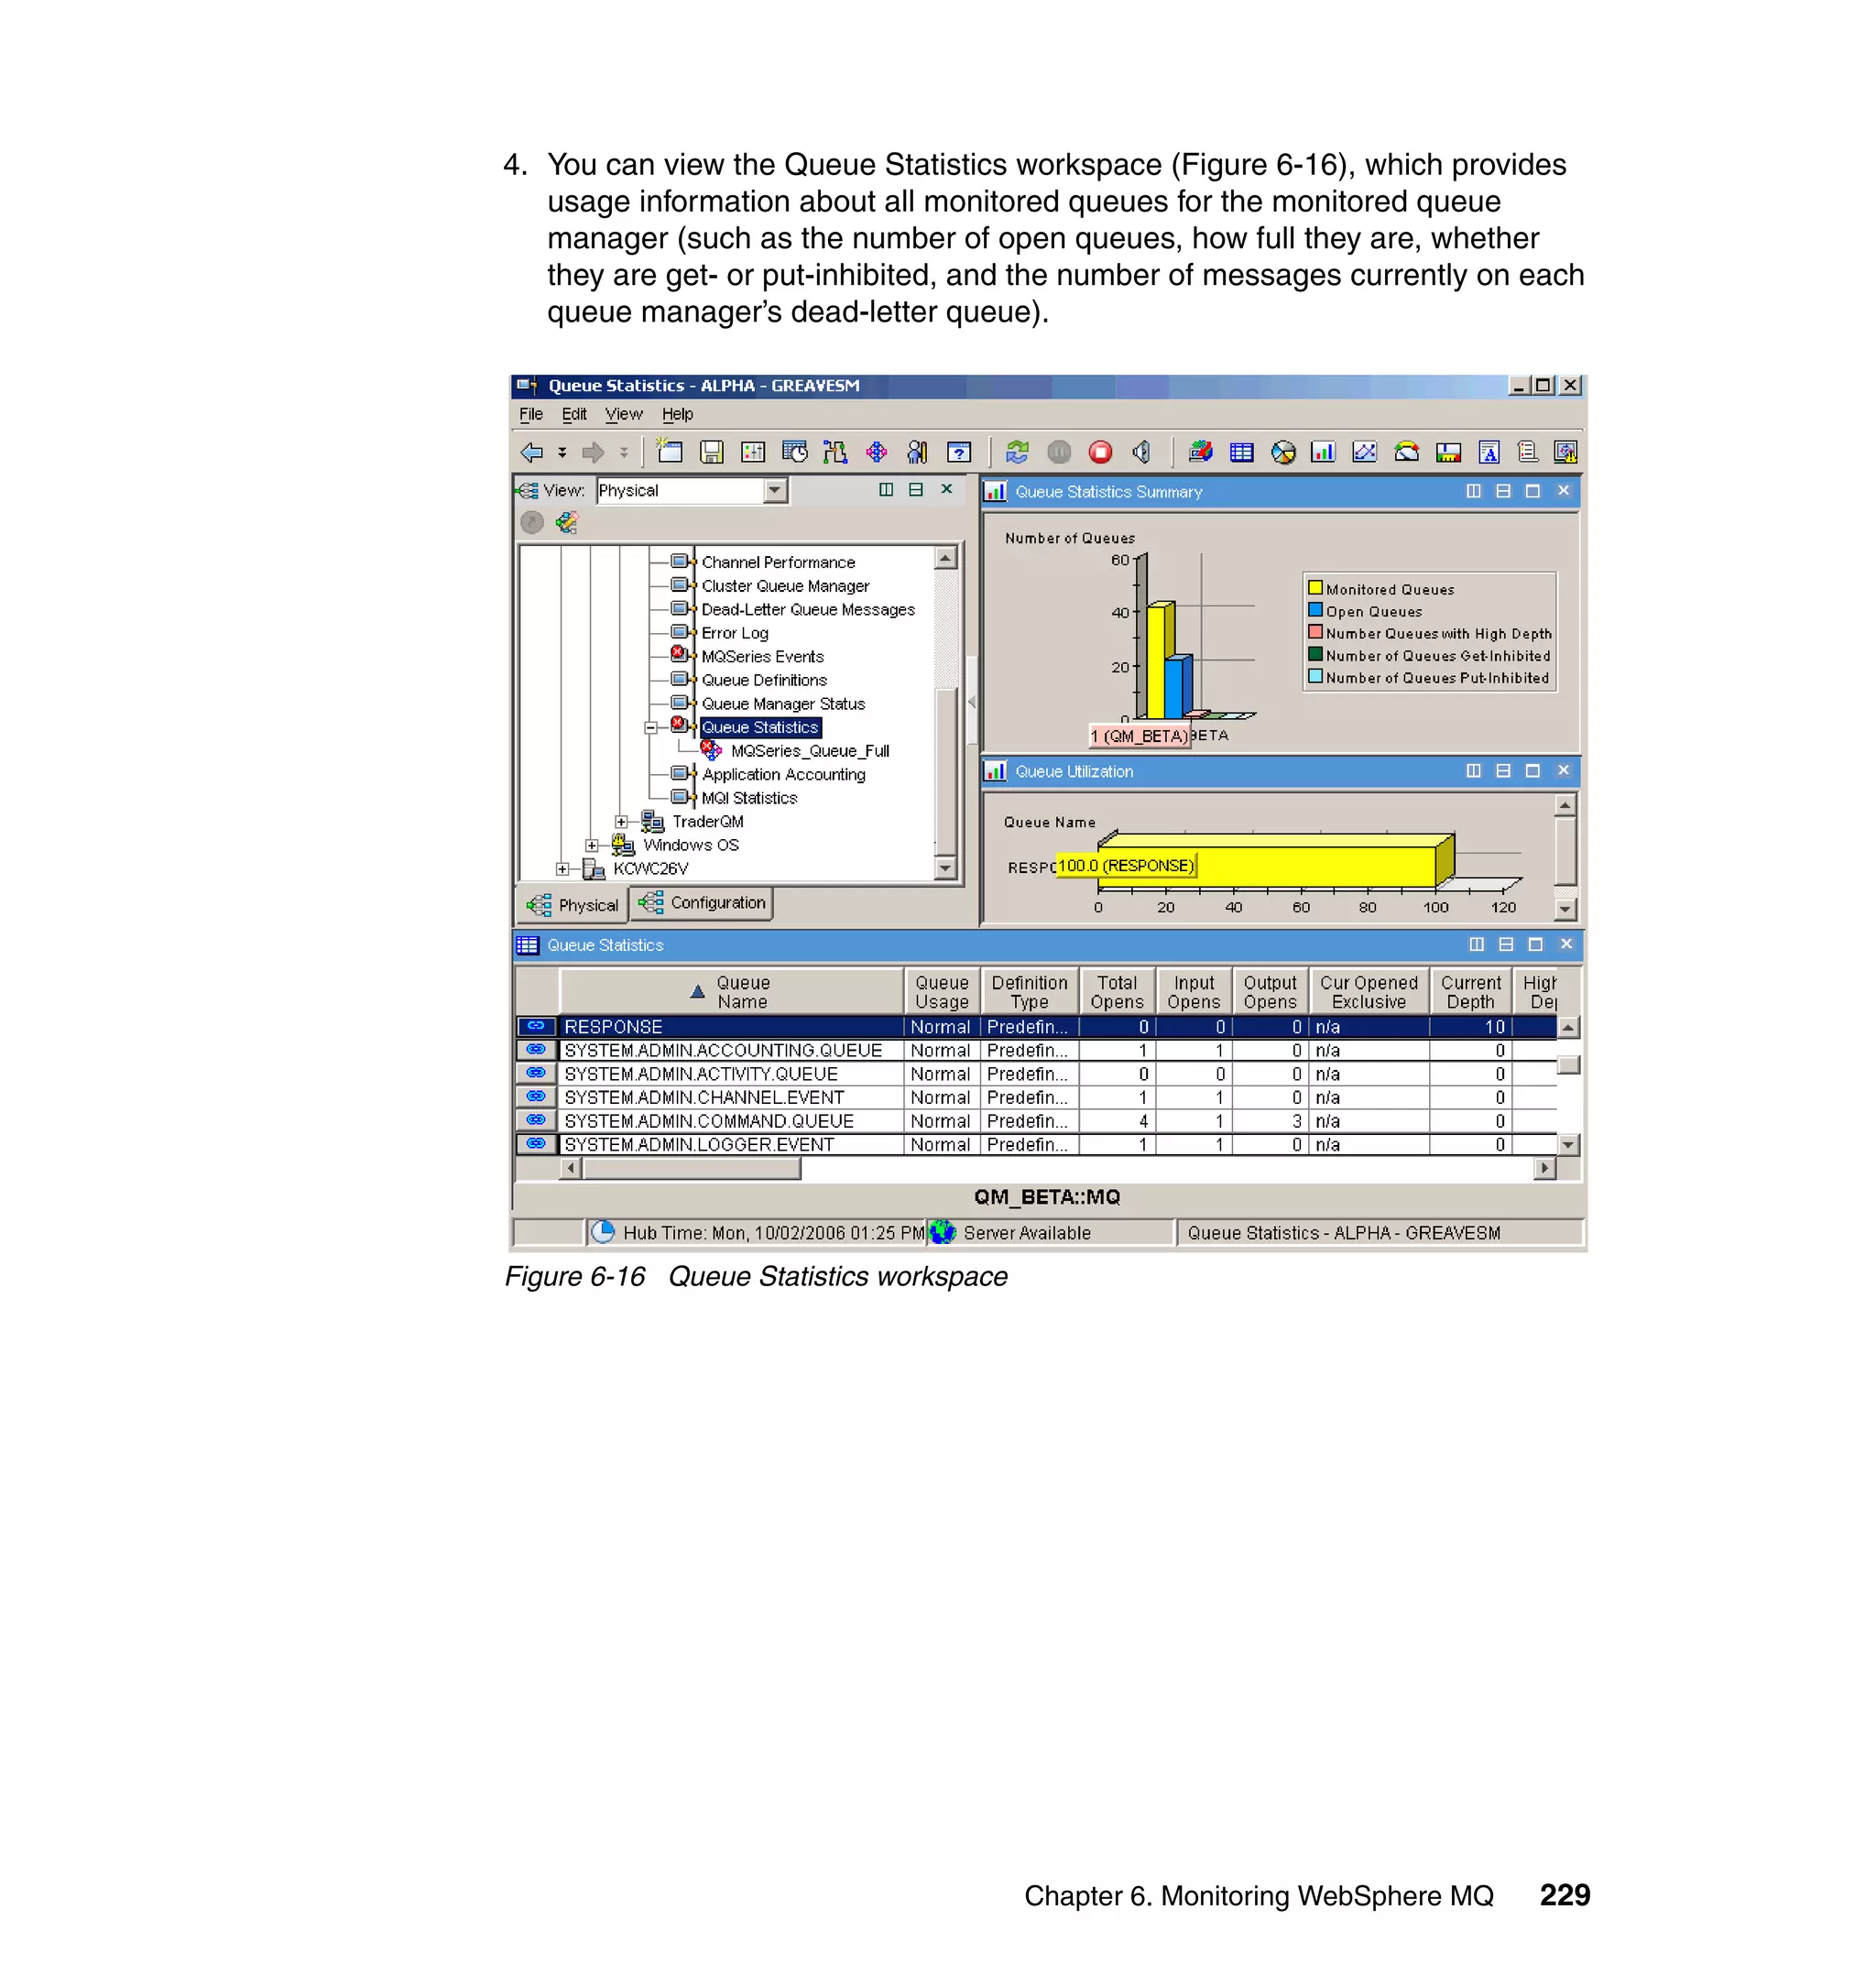
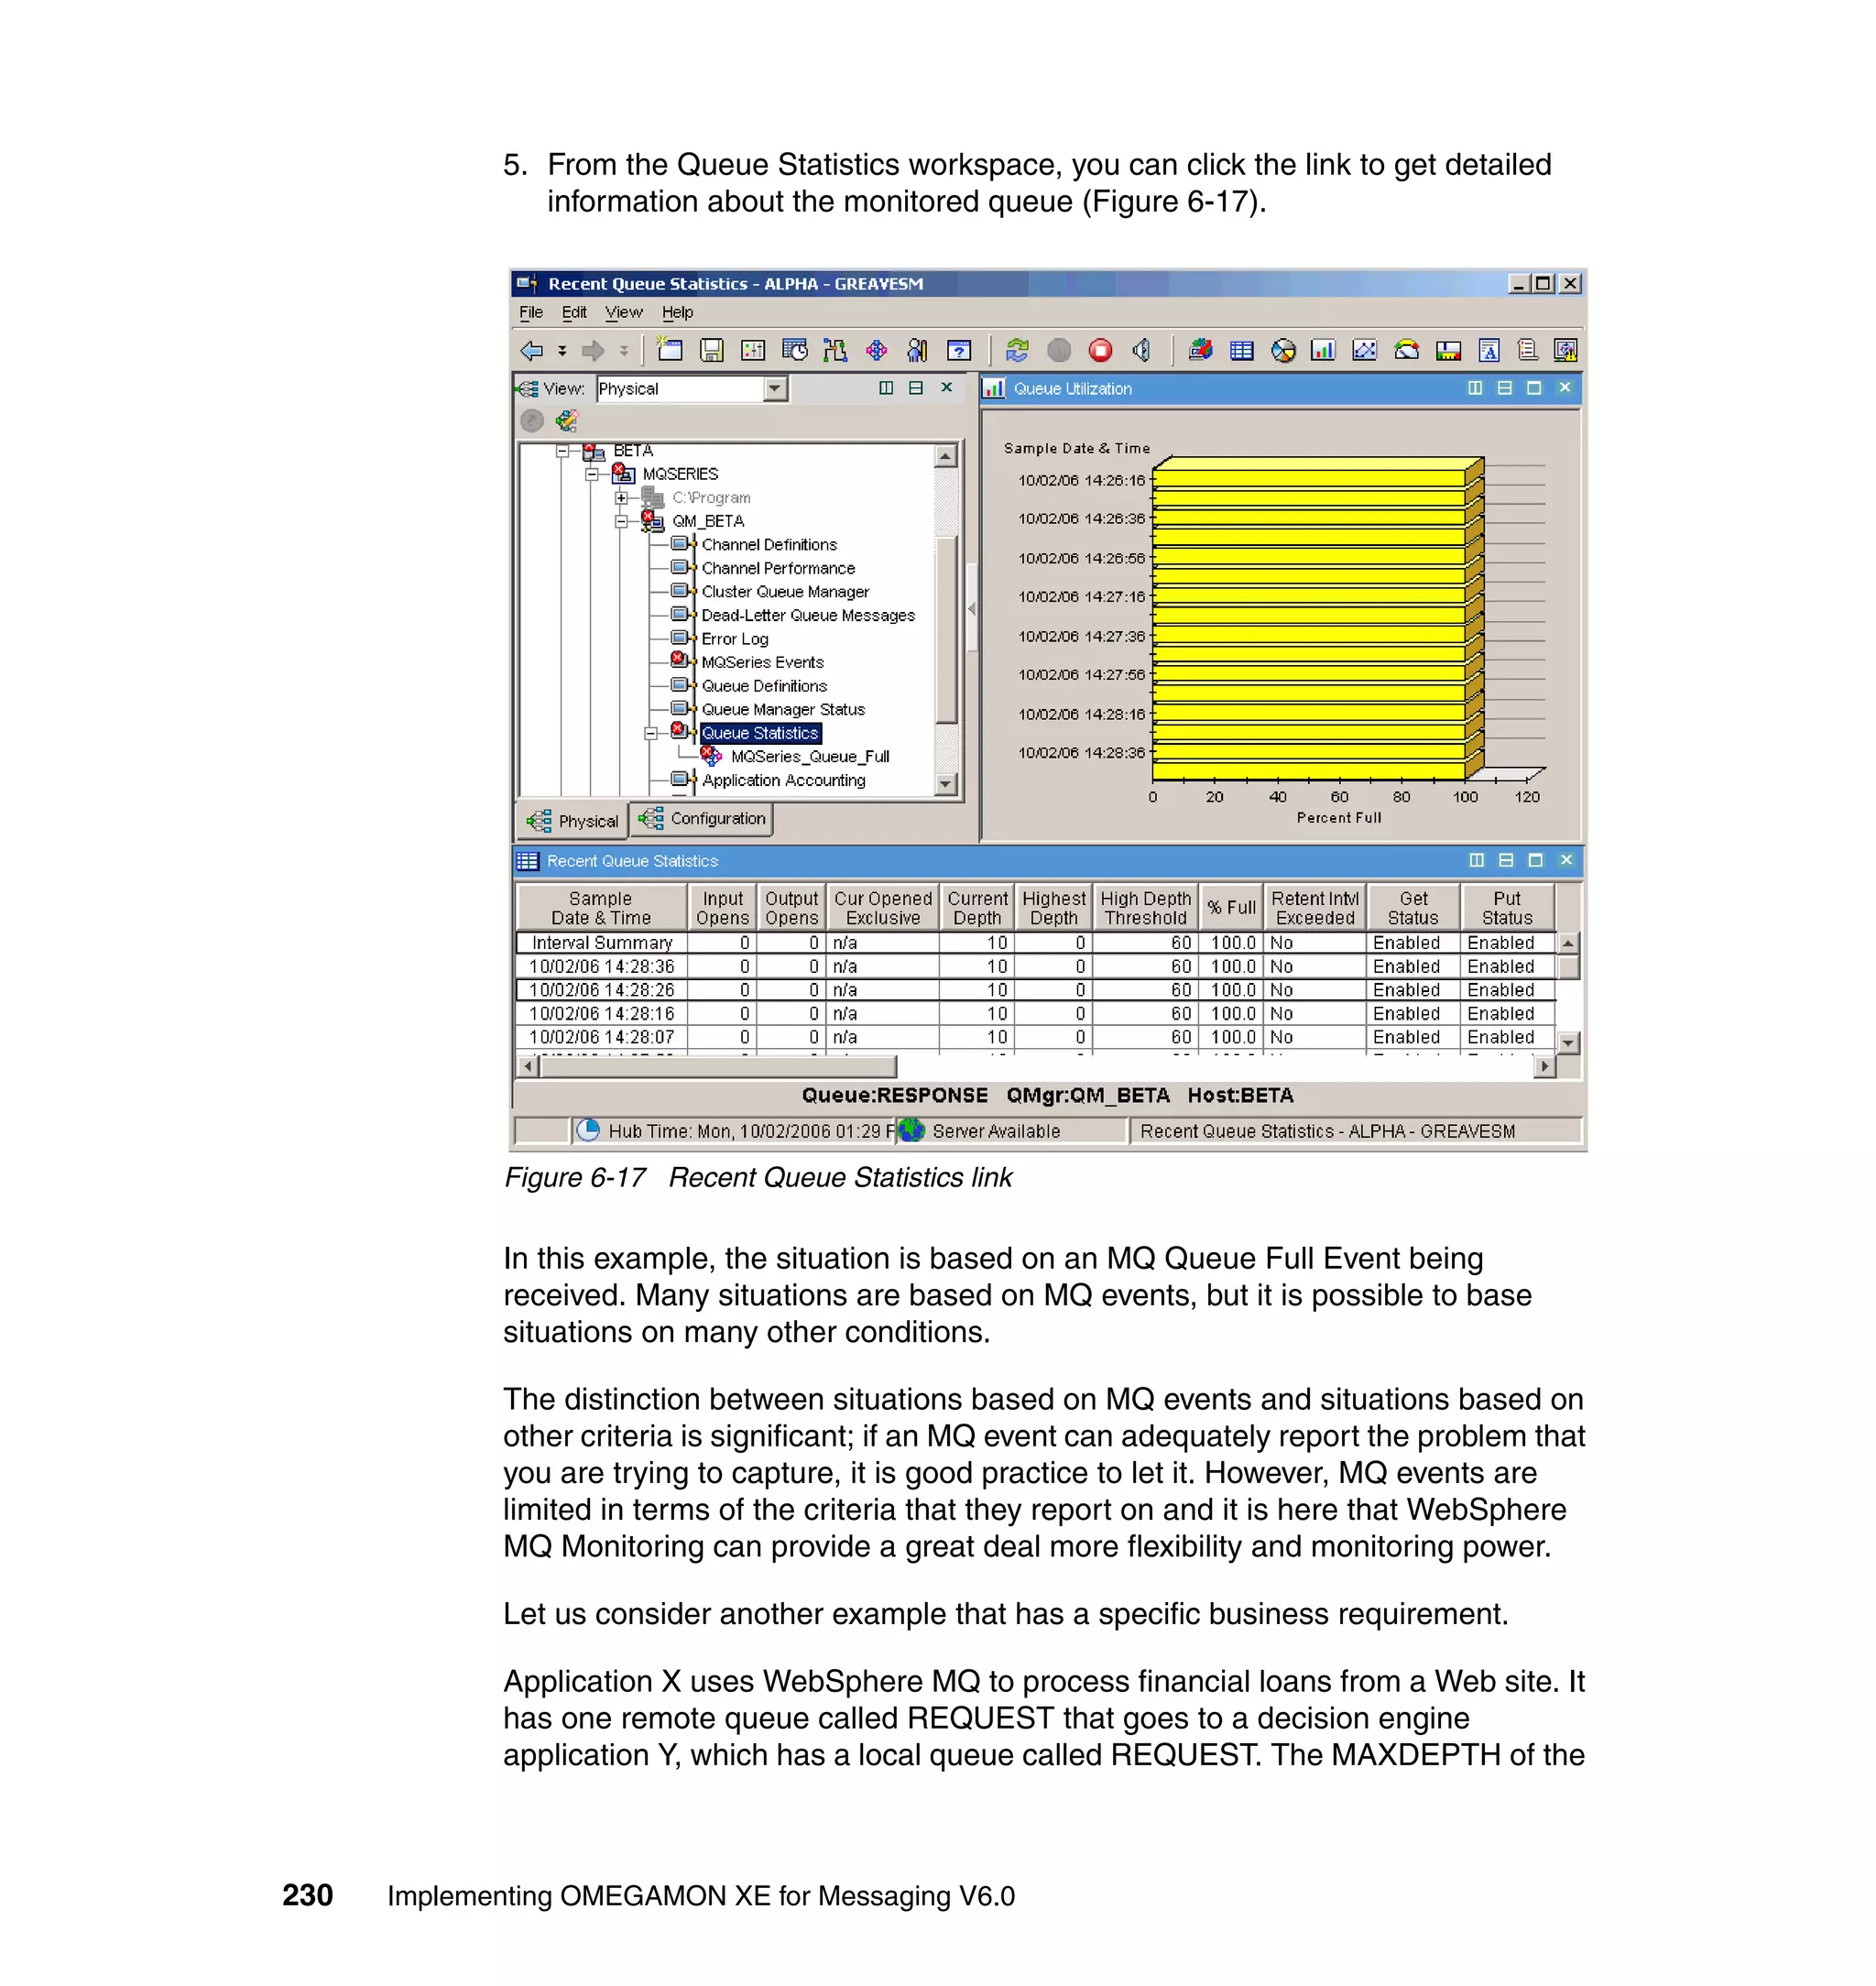
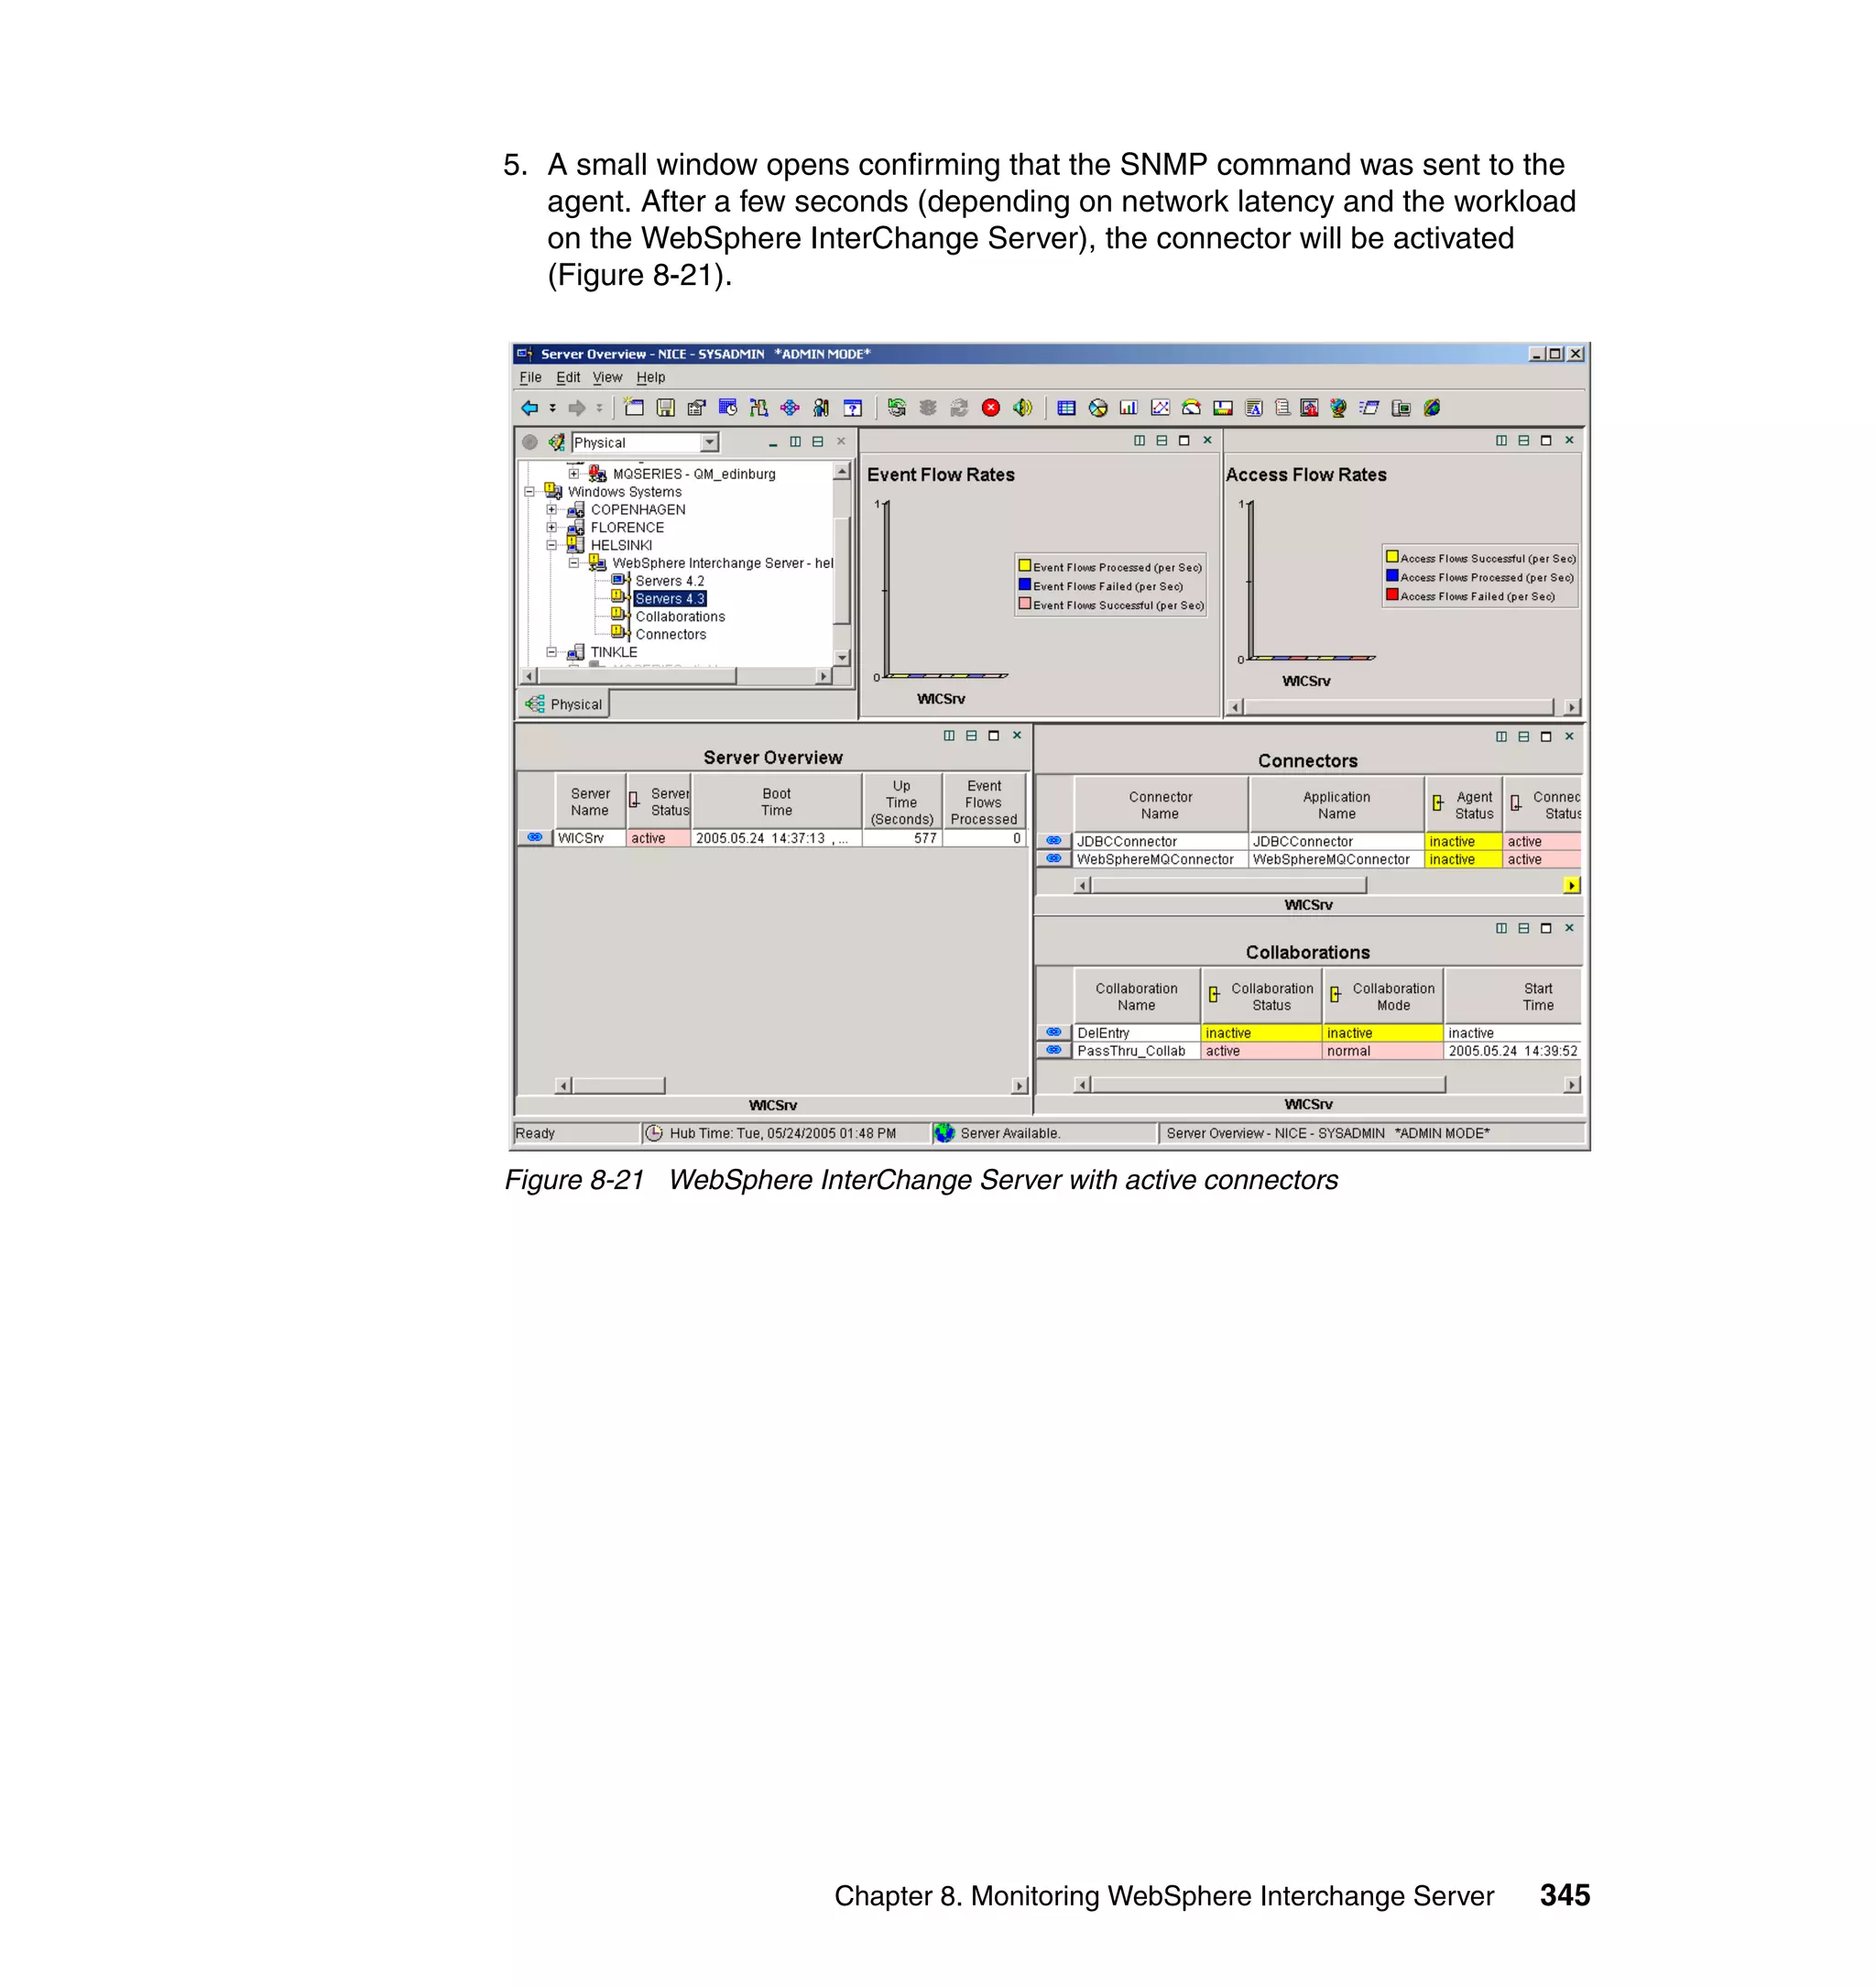
![Using the command line
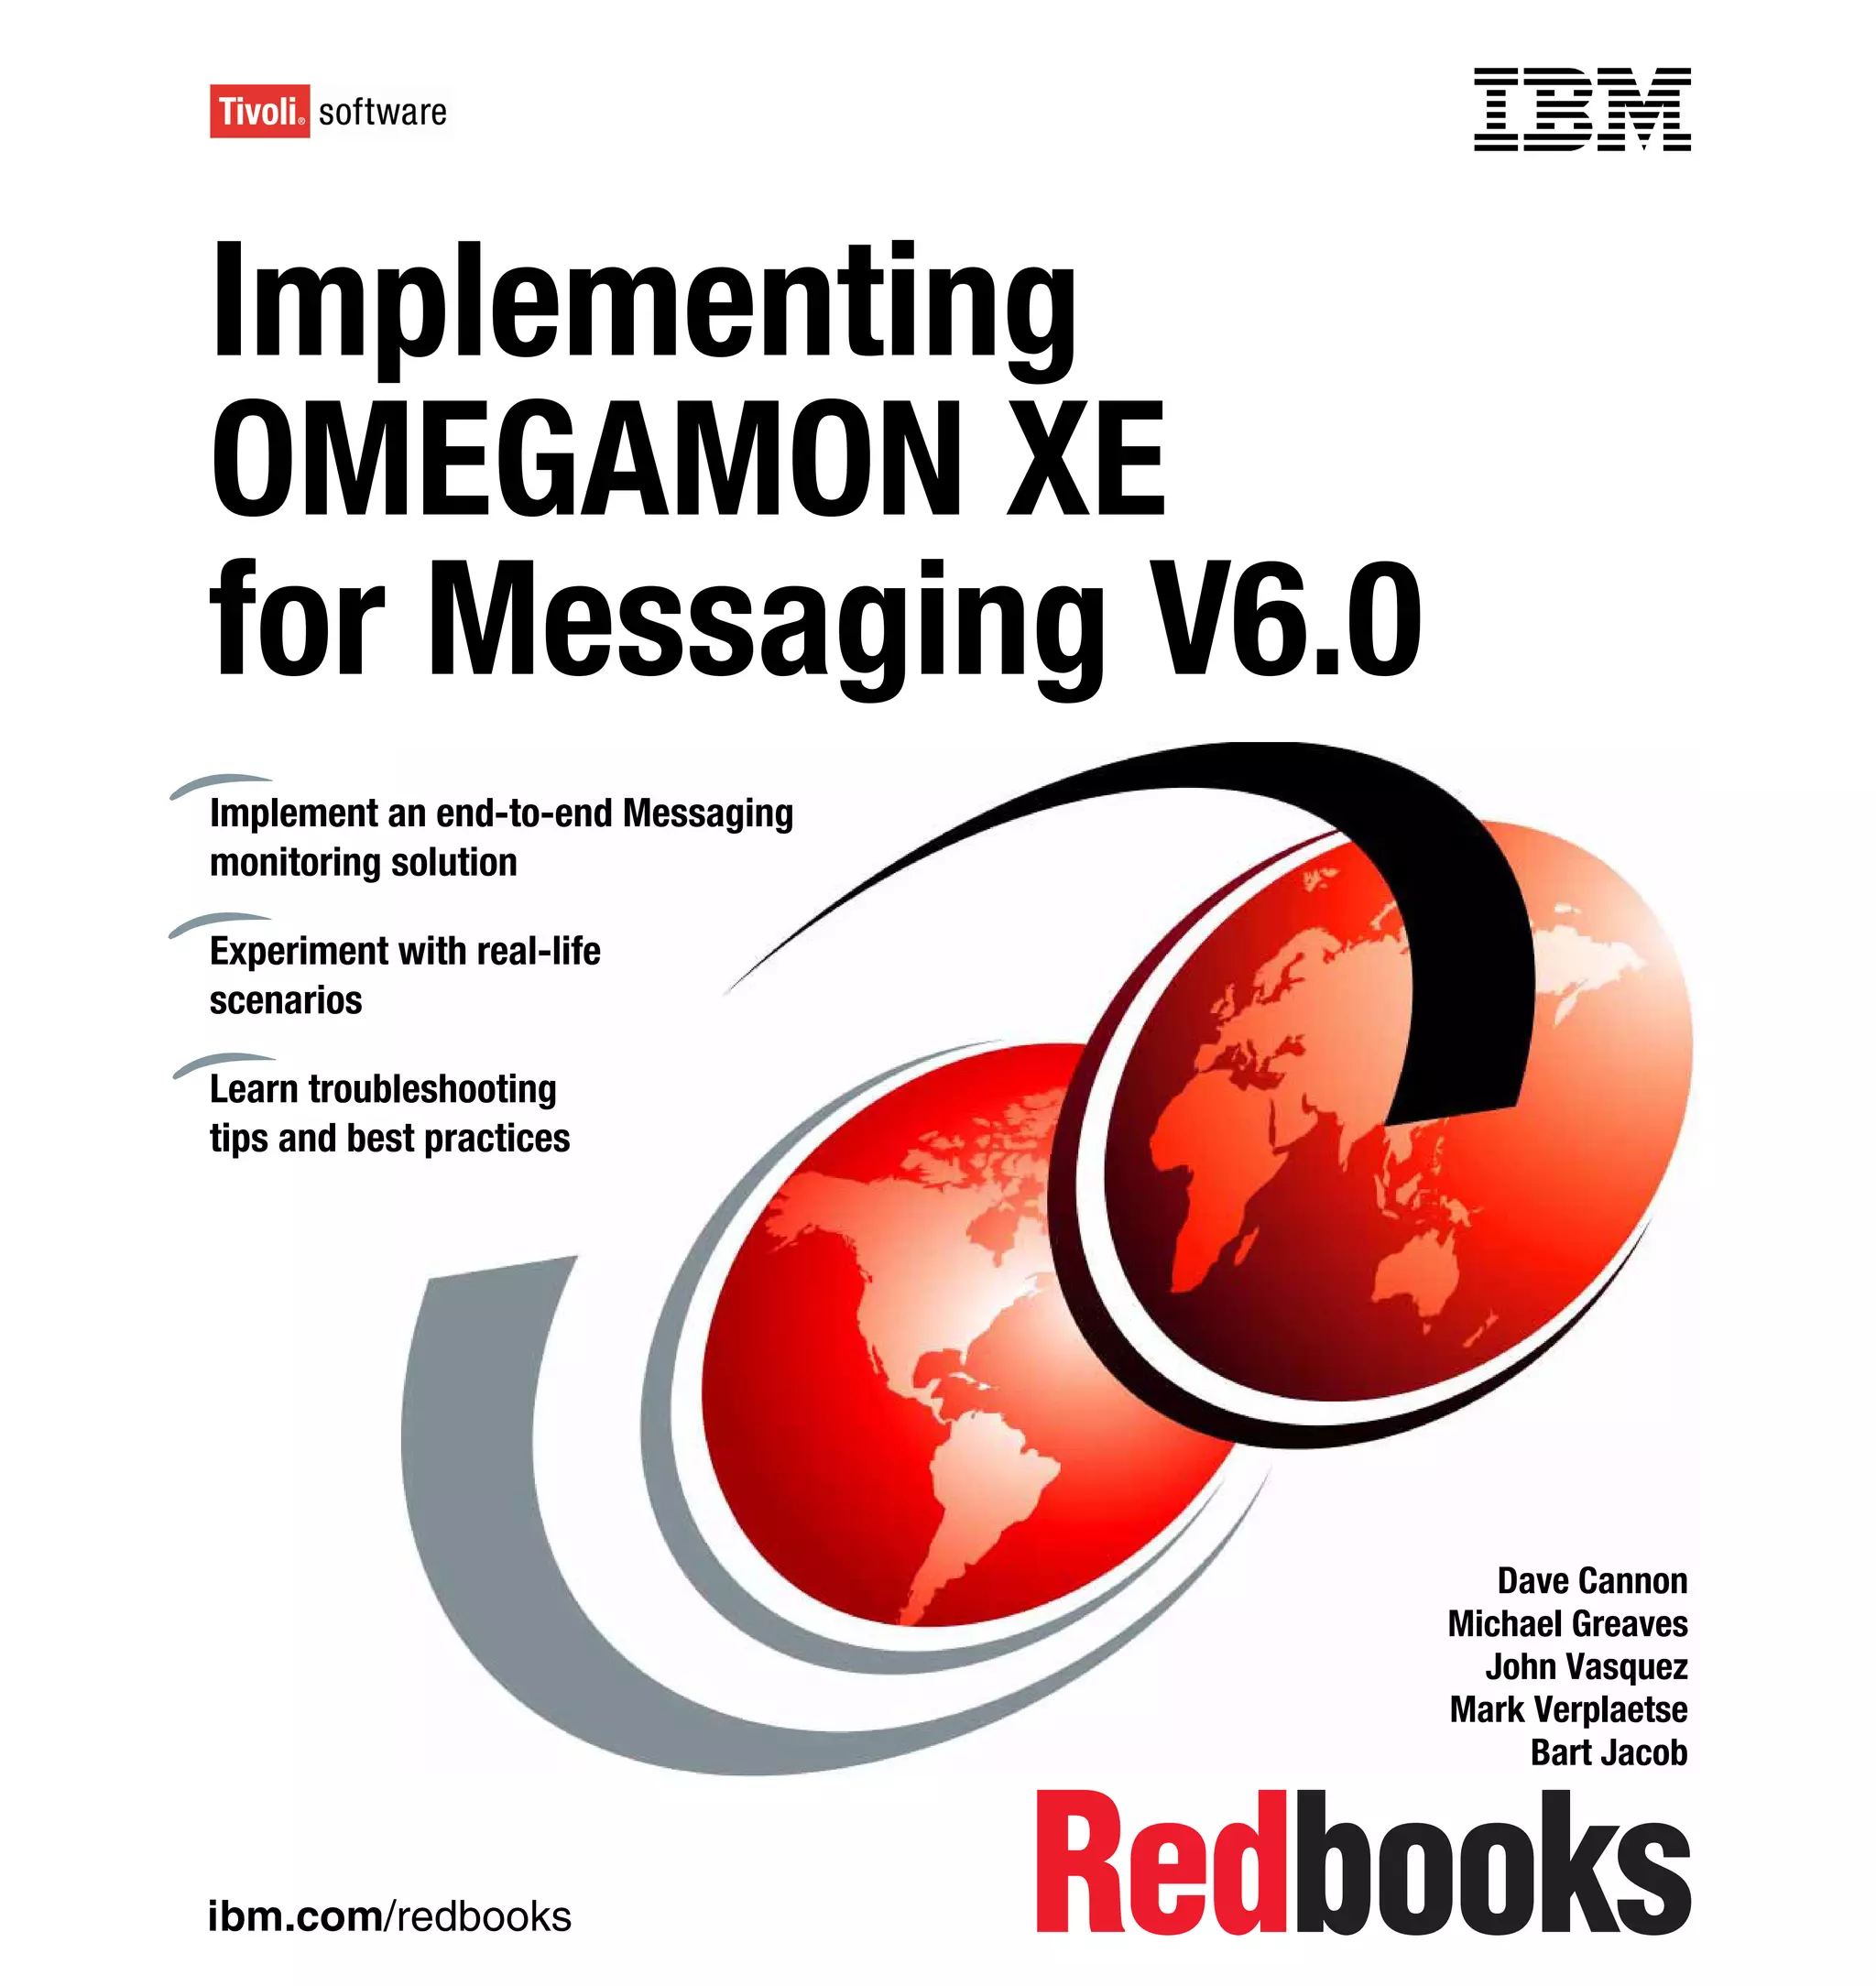
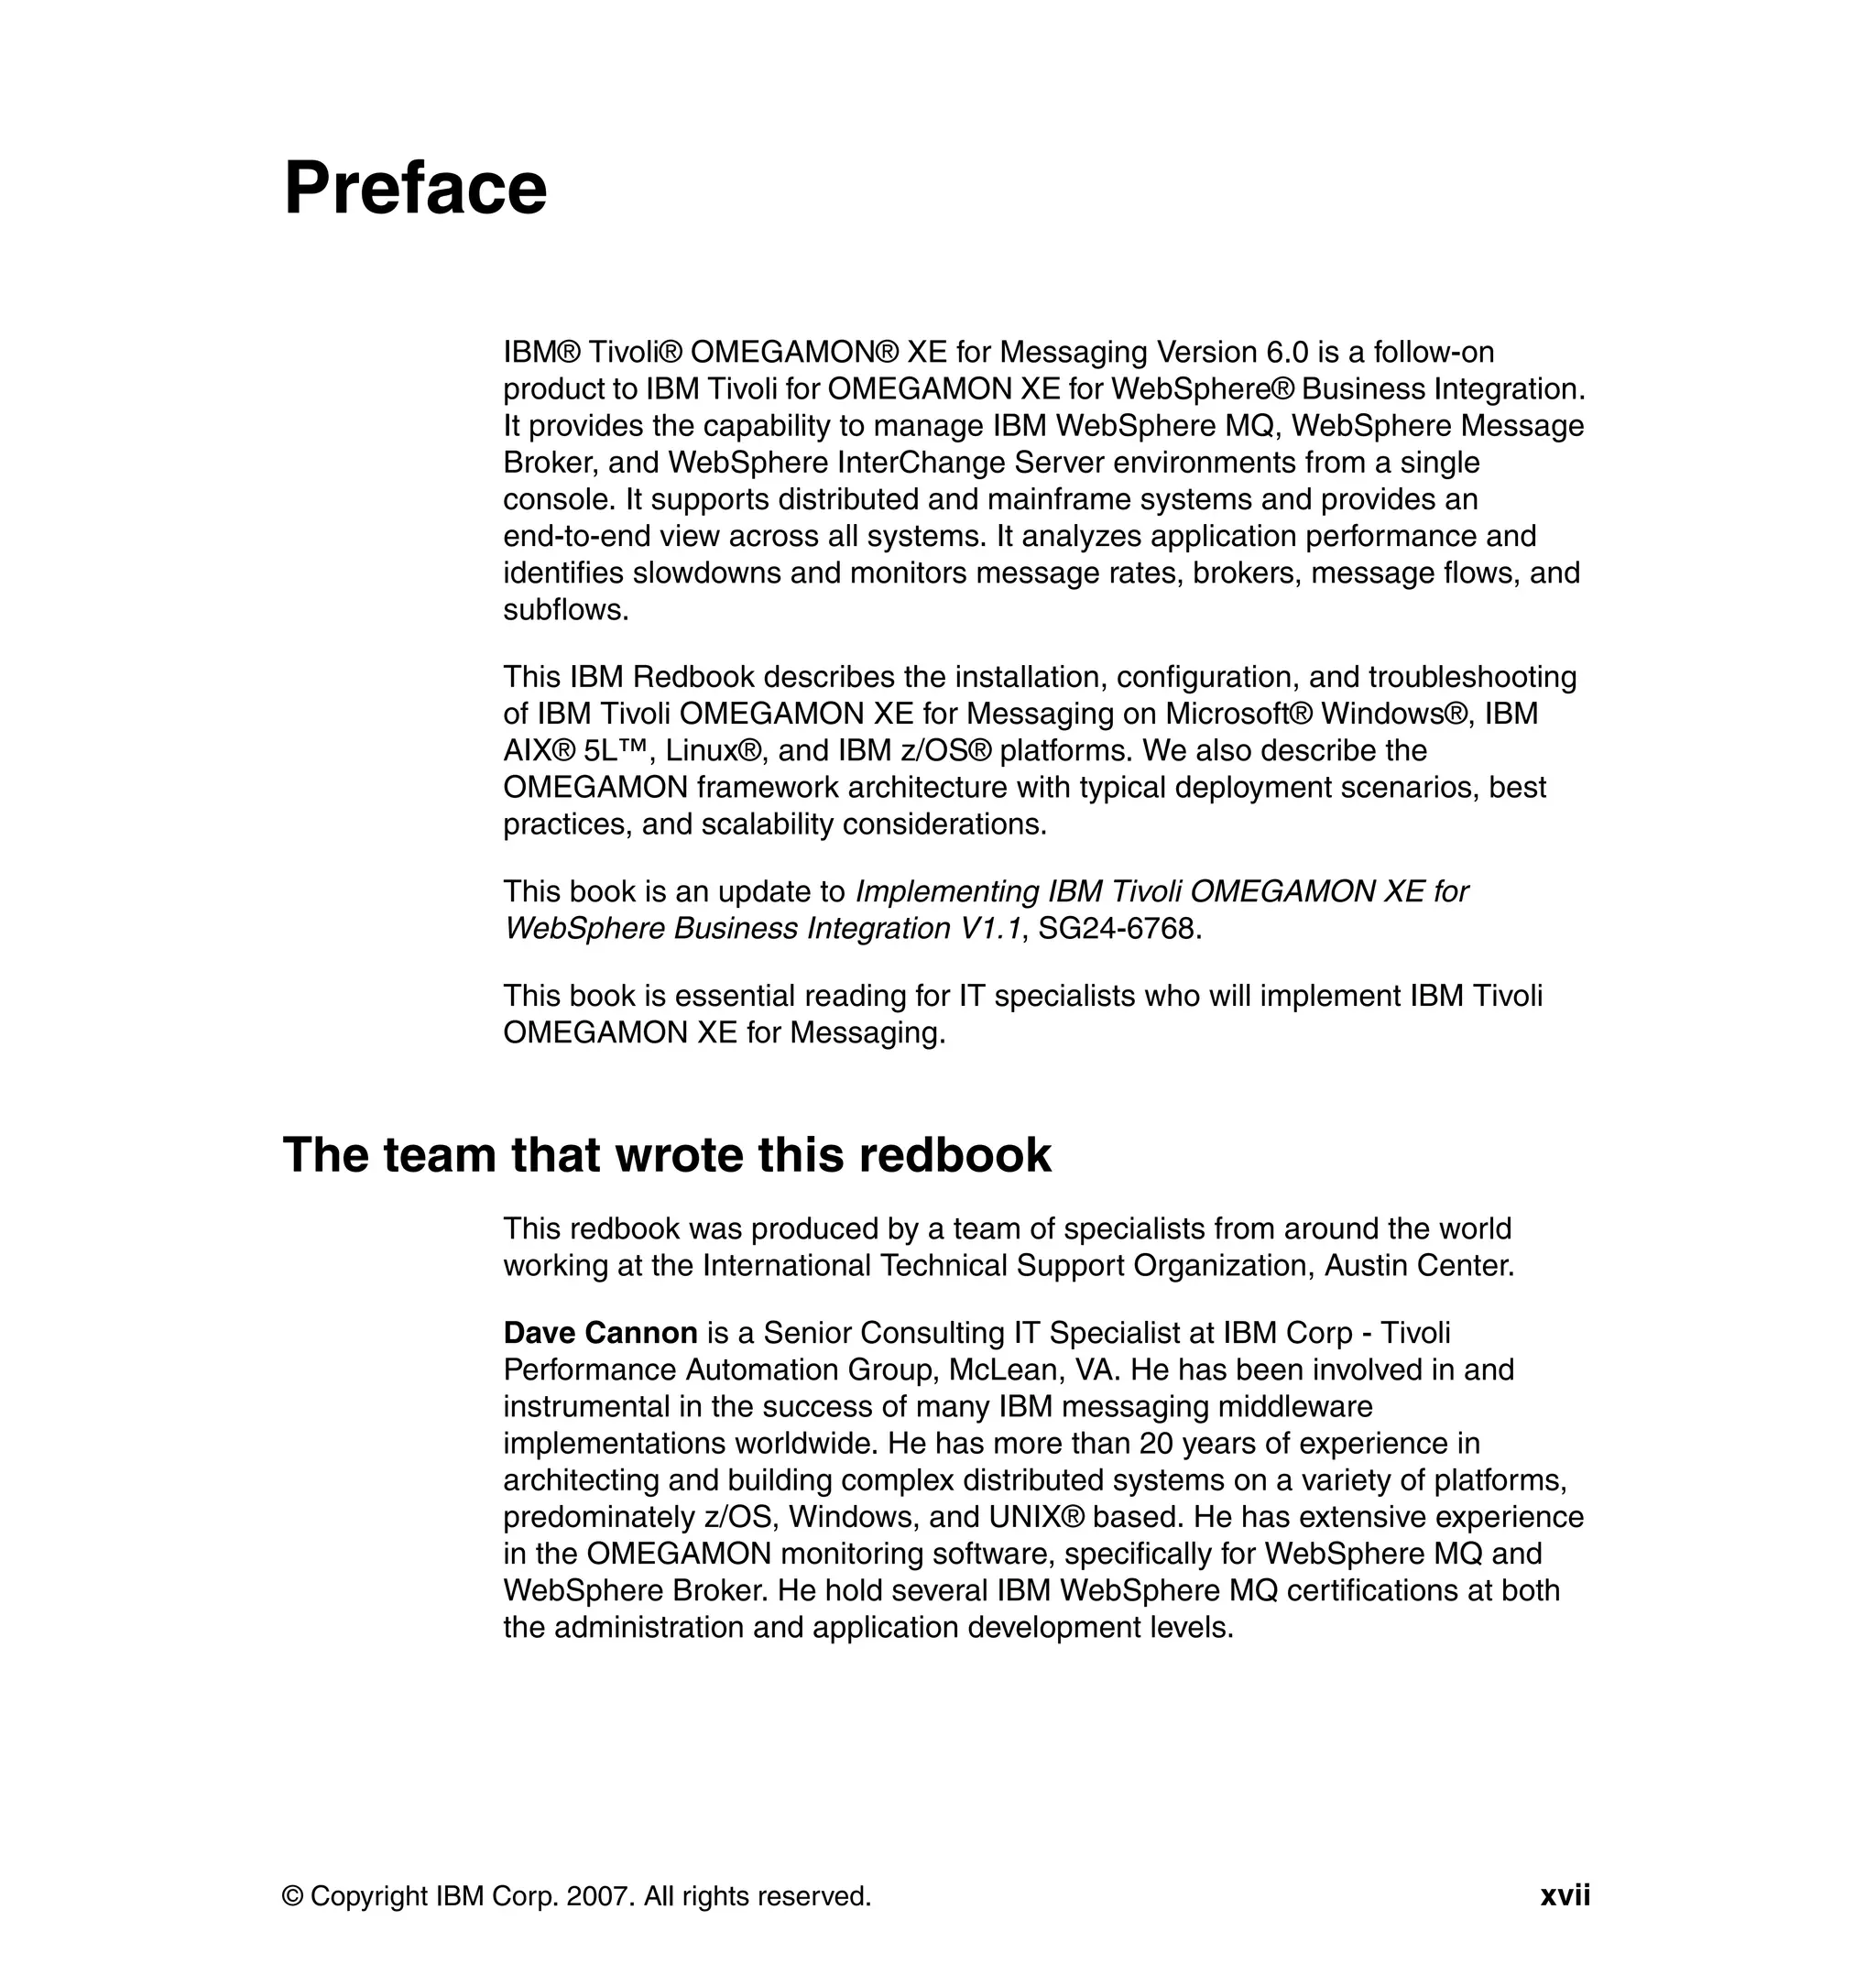
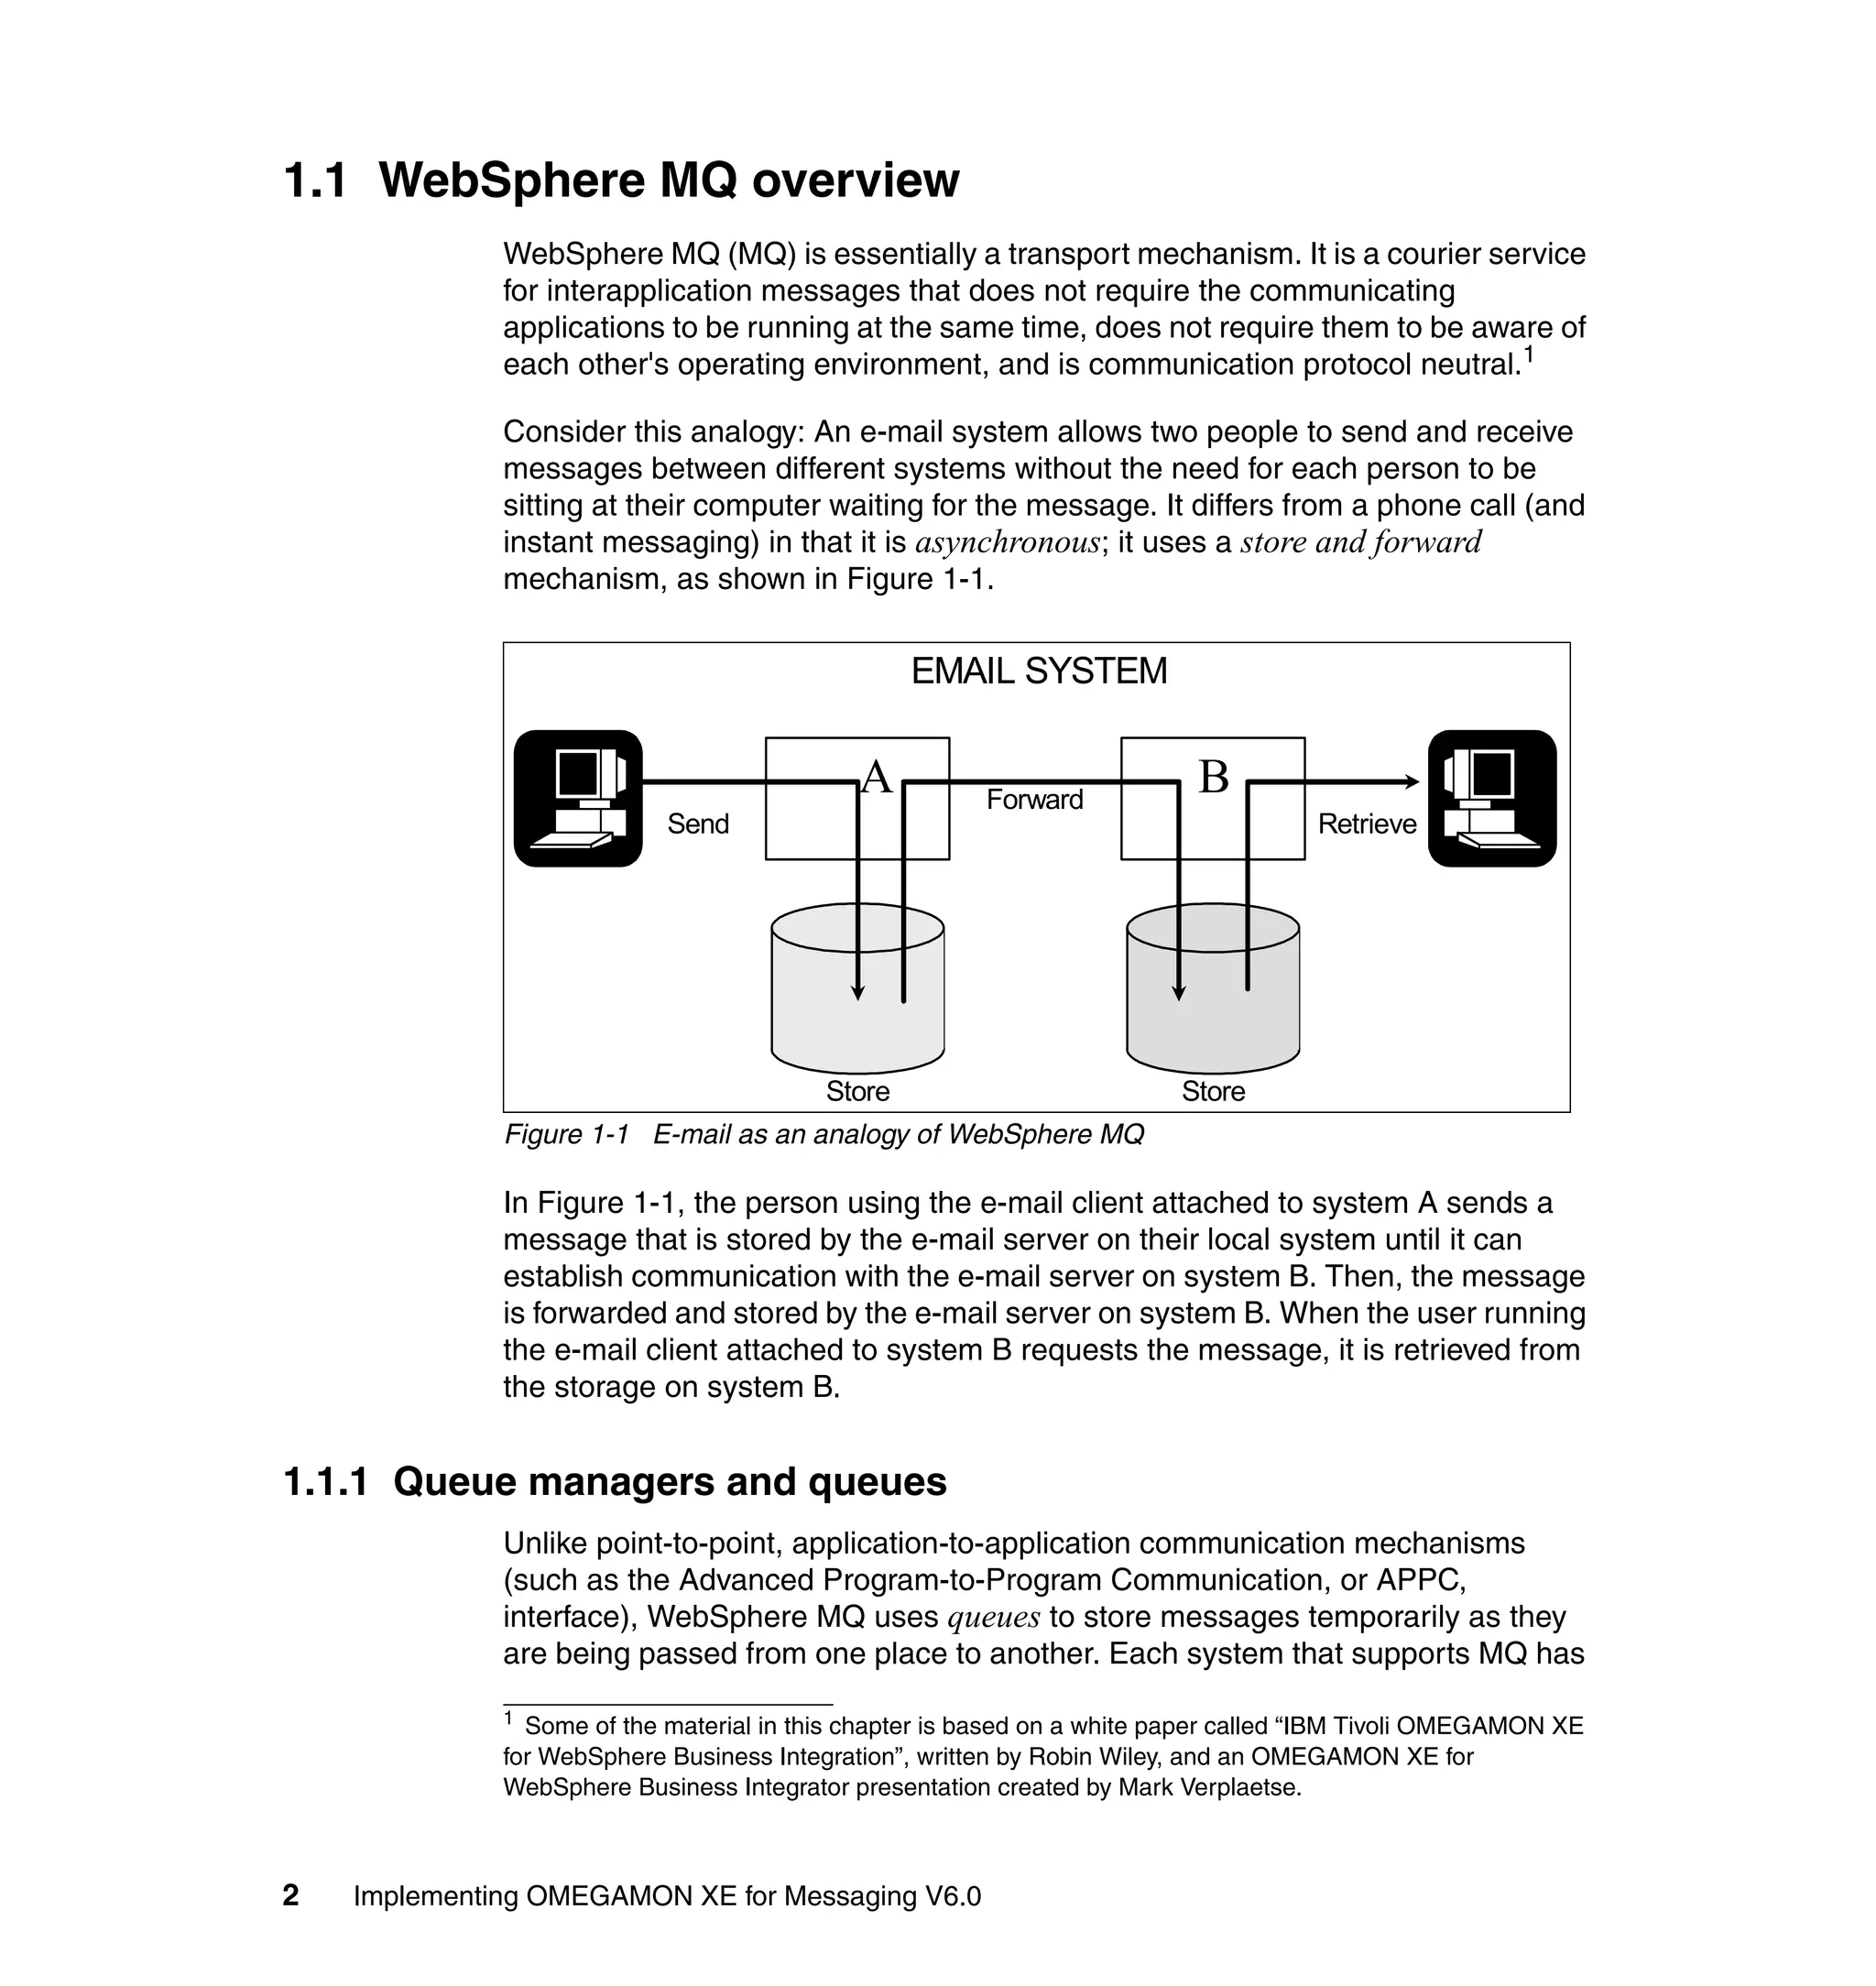
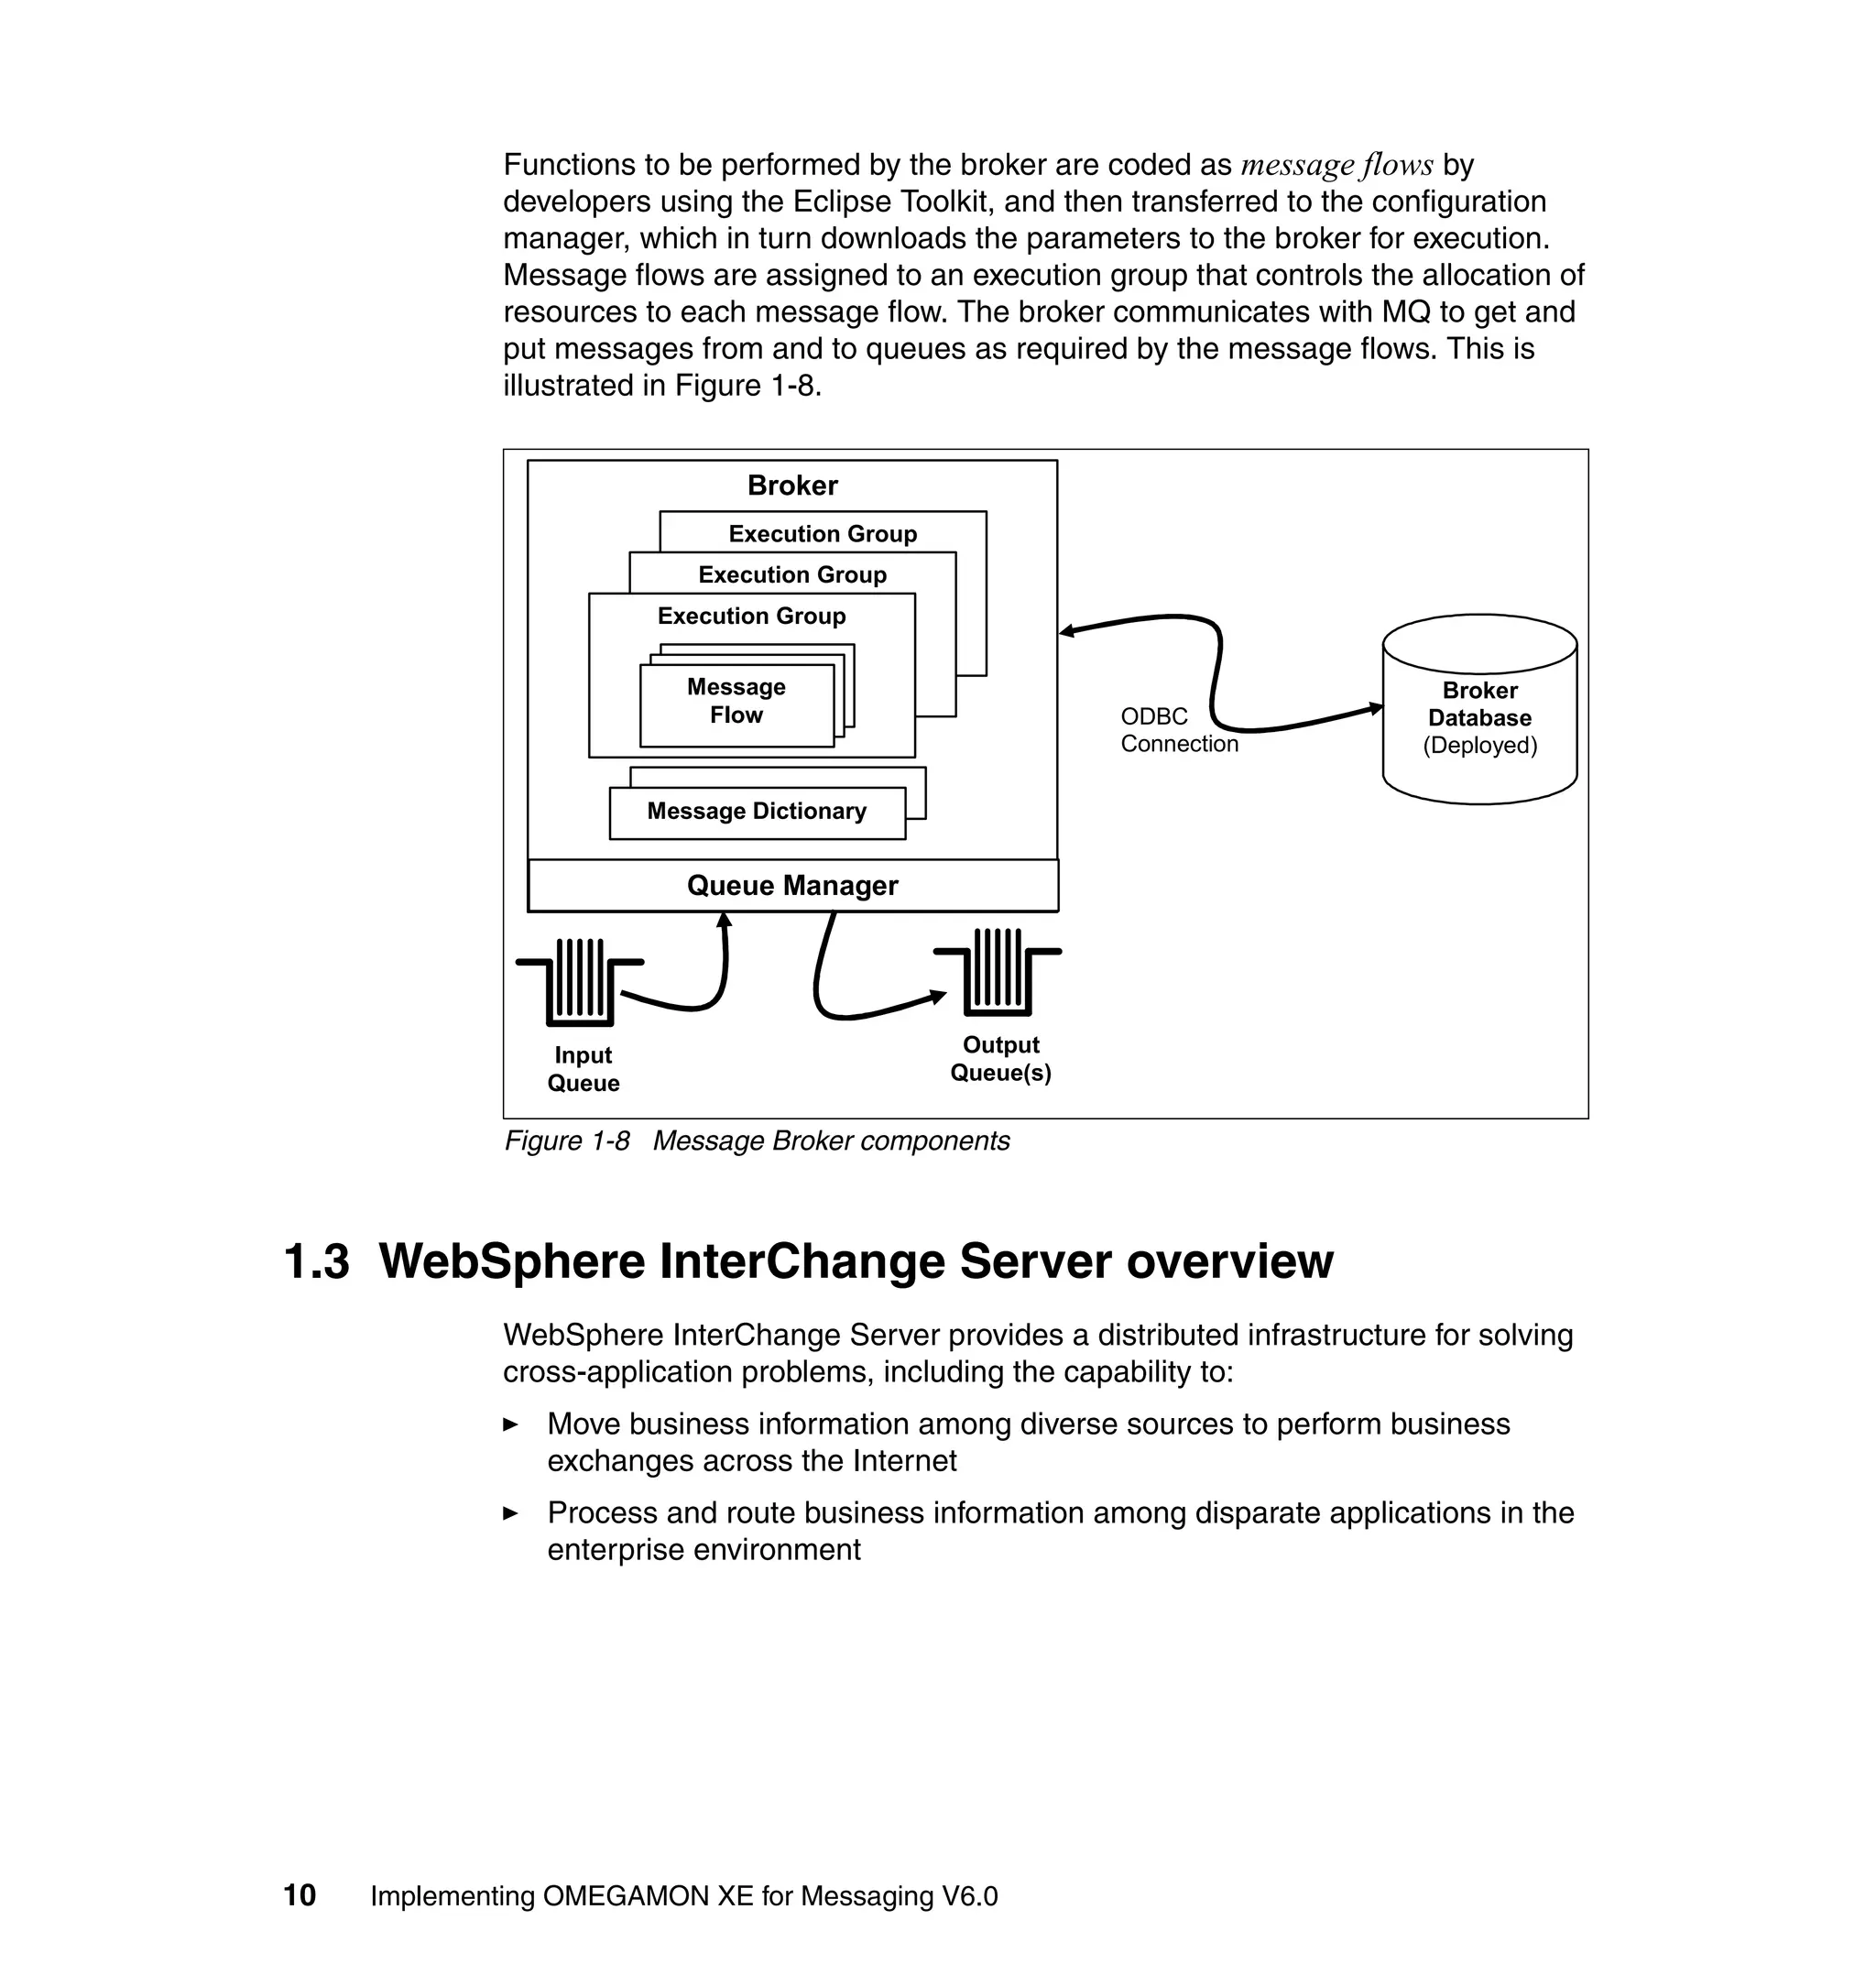
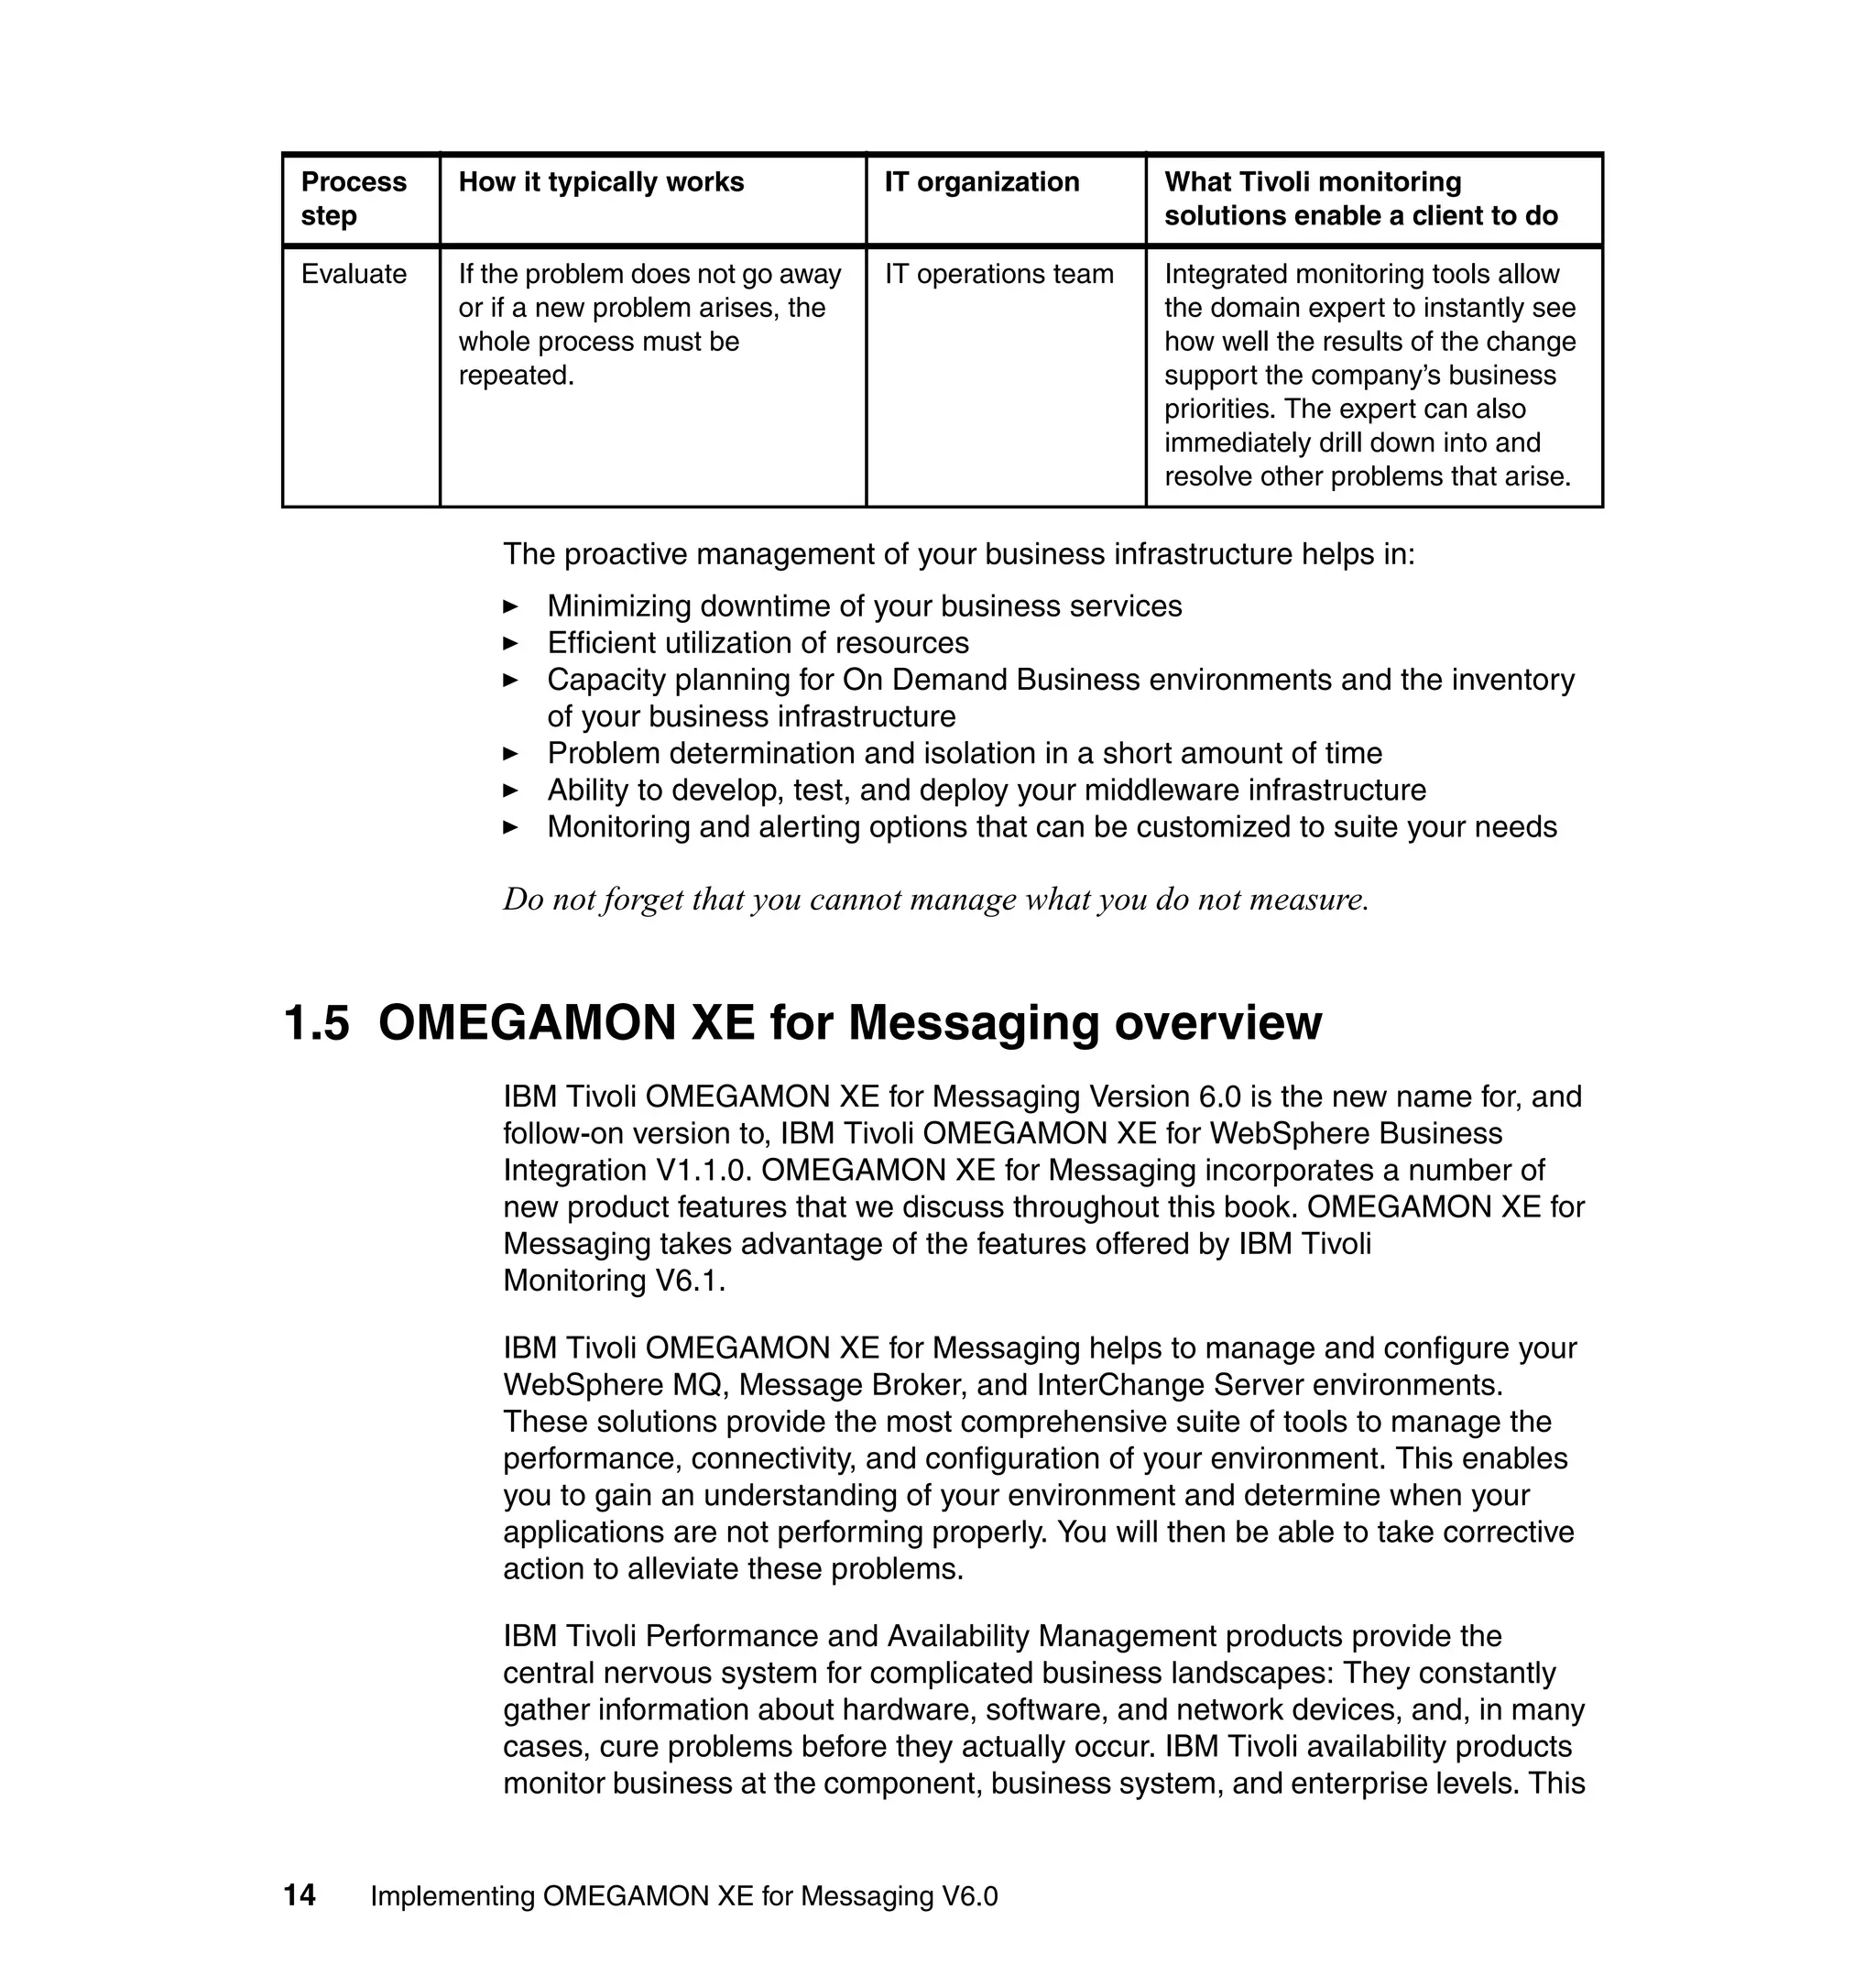
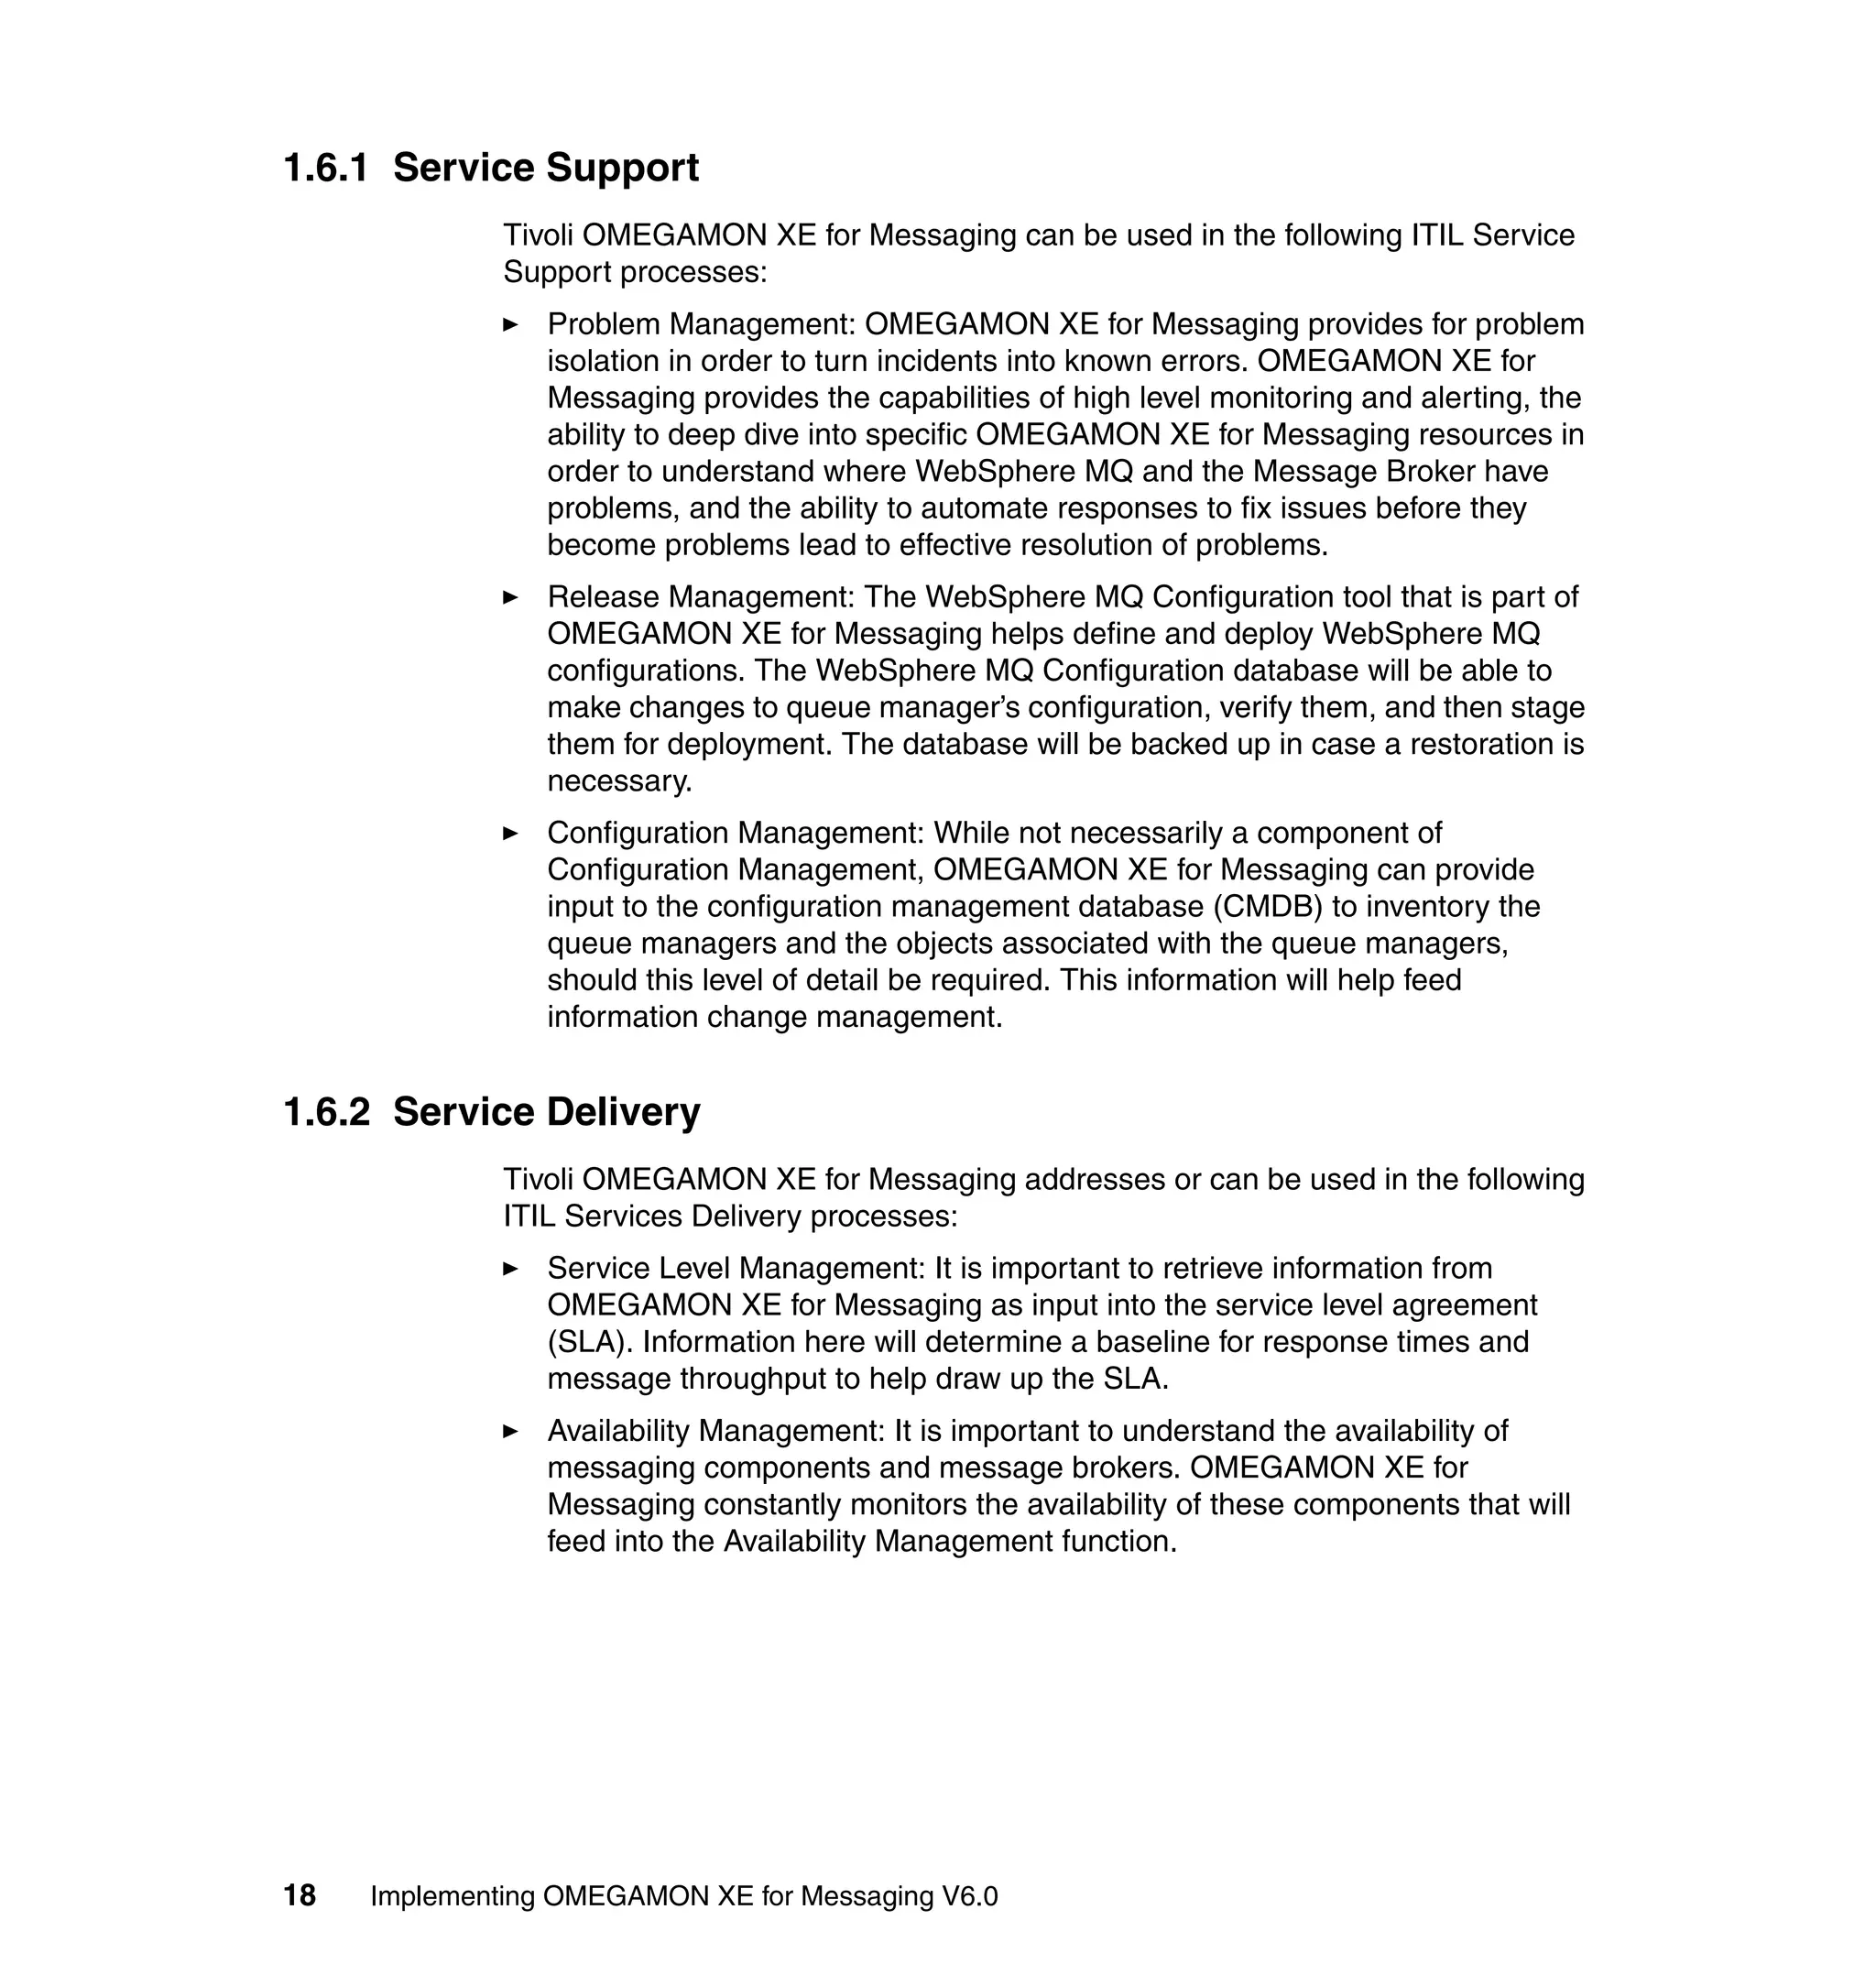
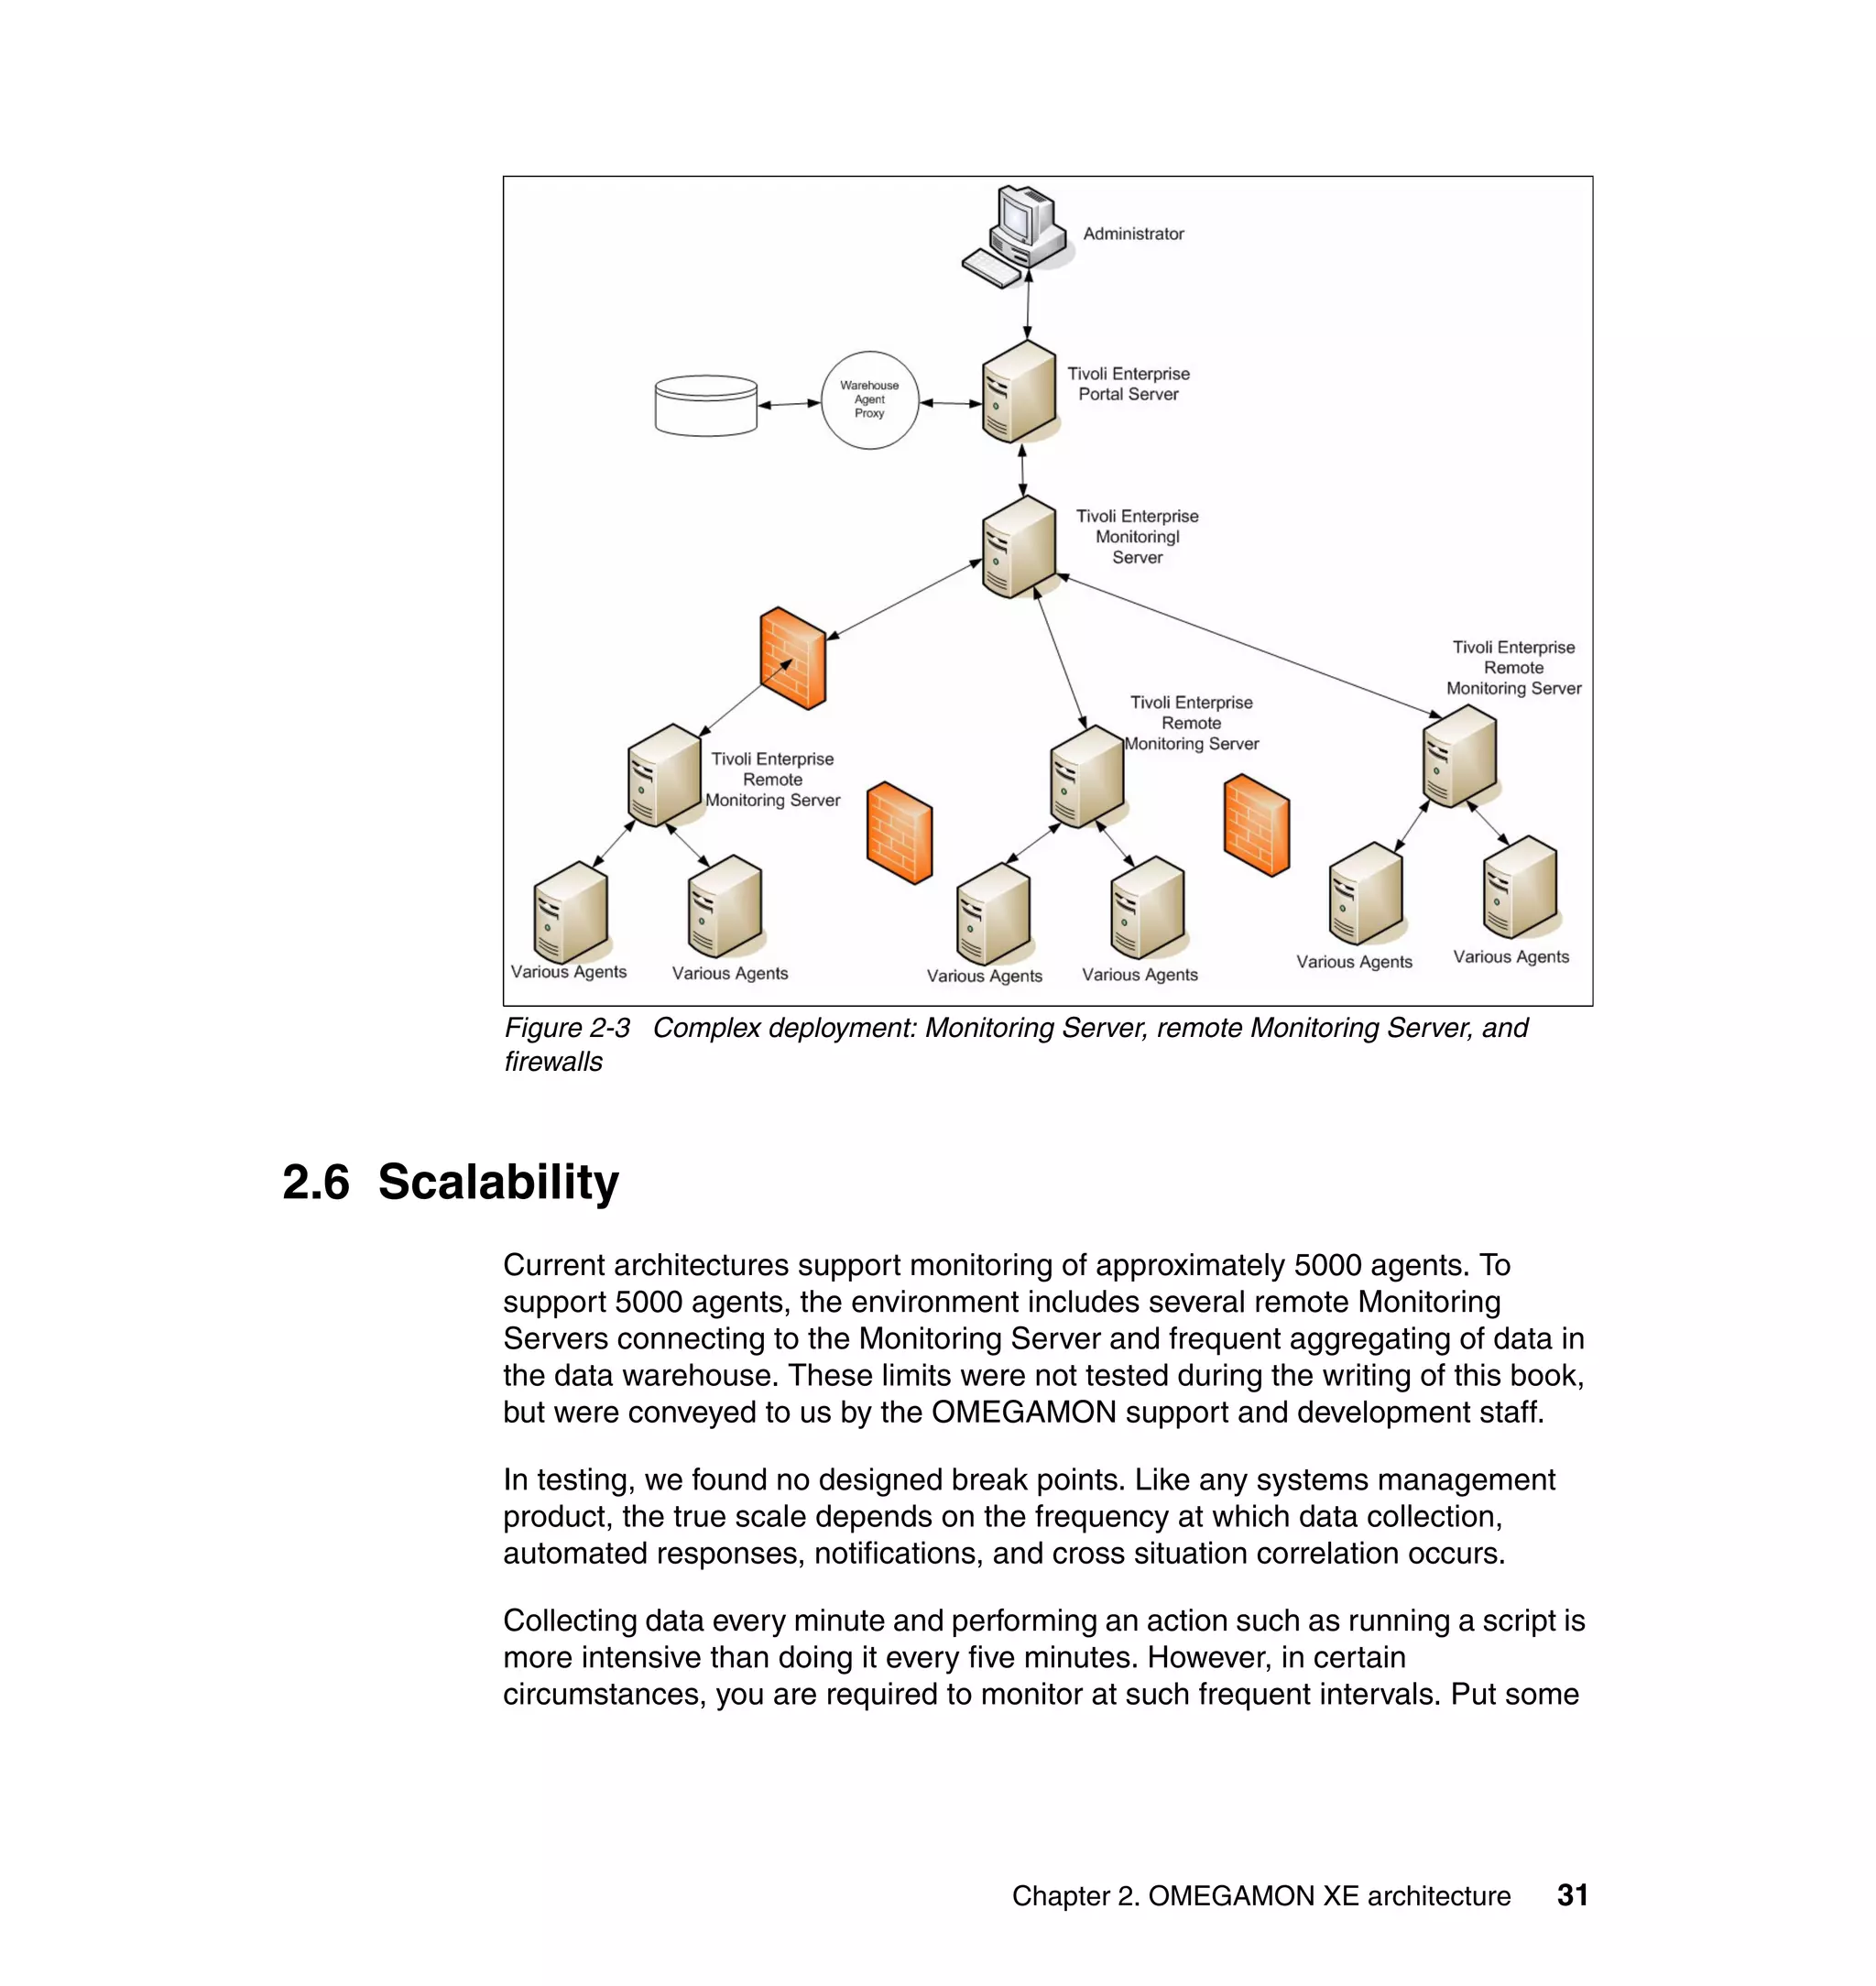
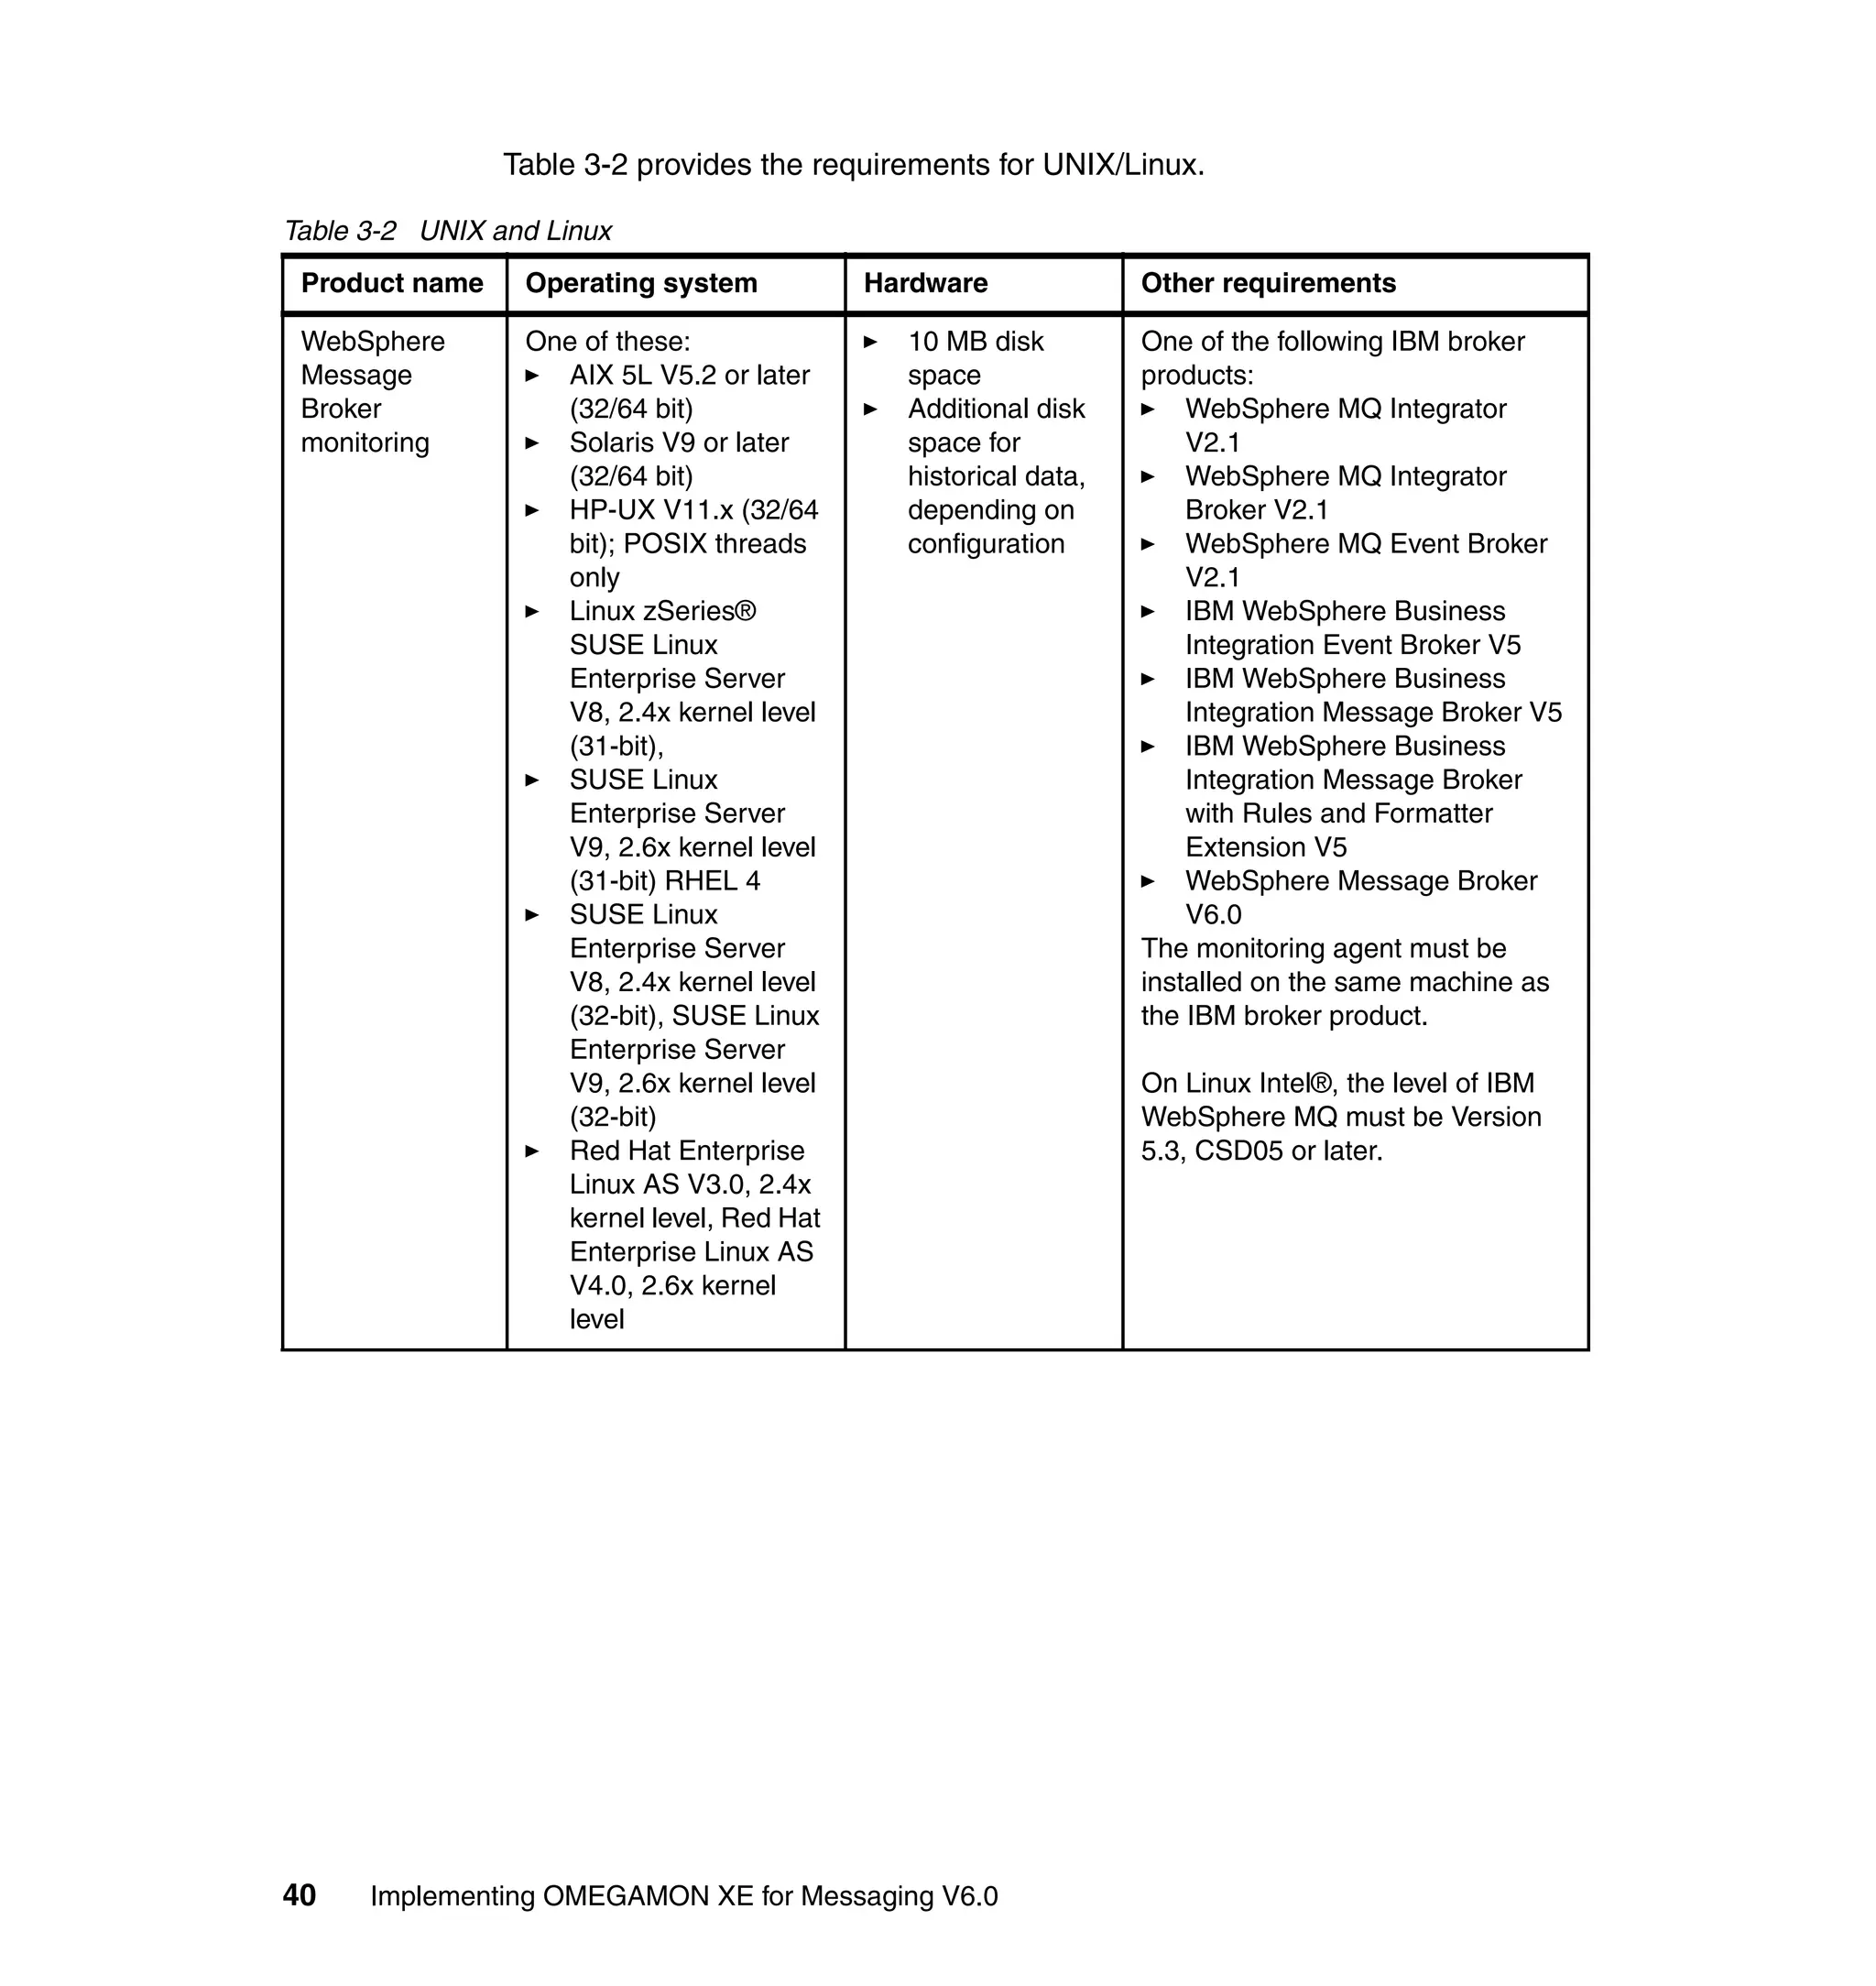
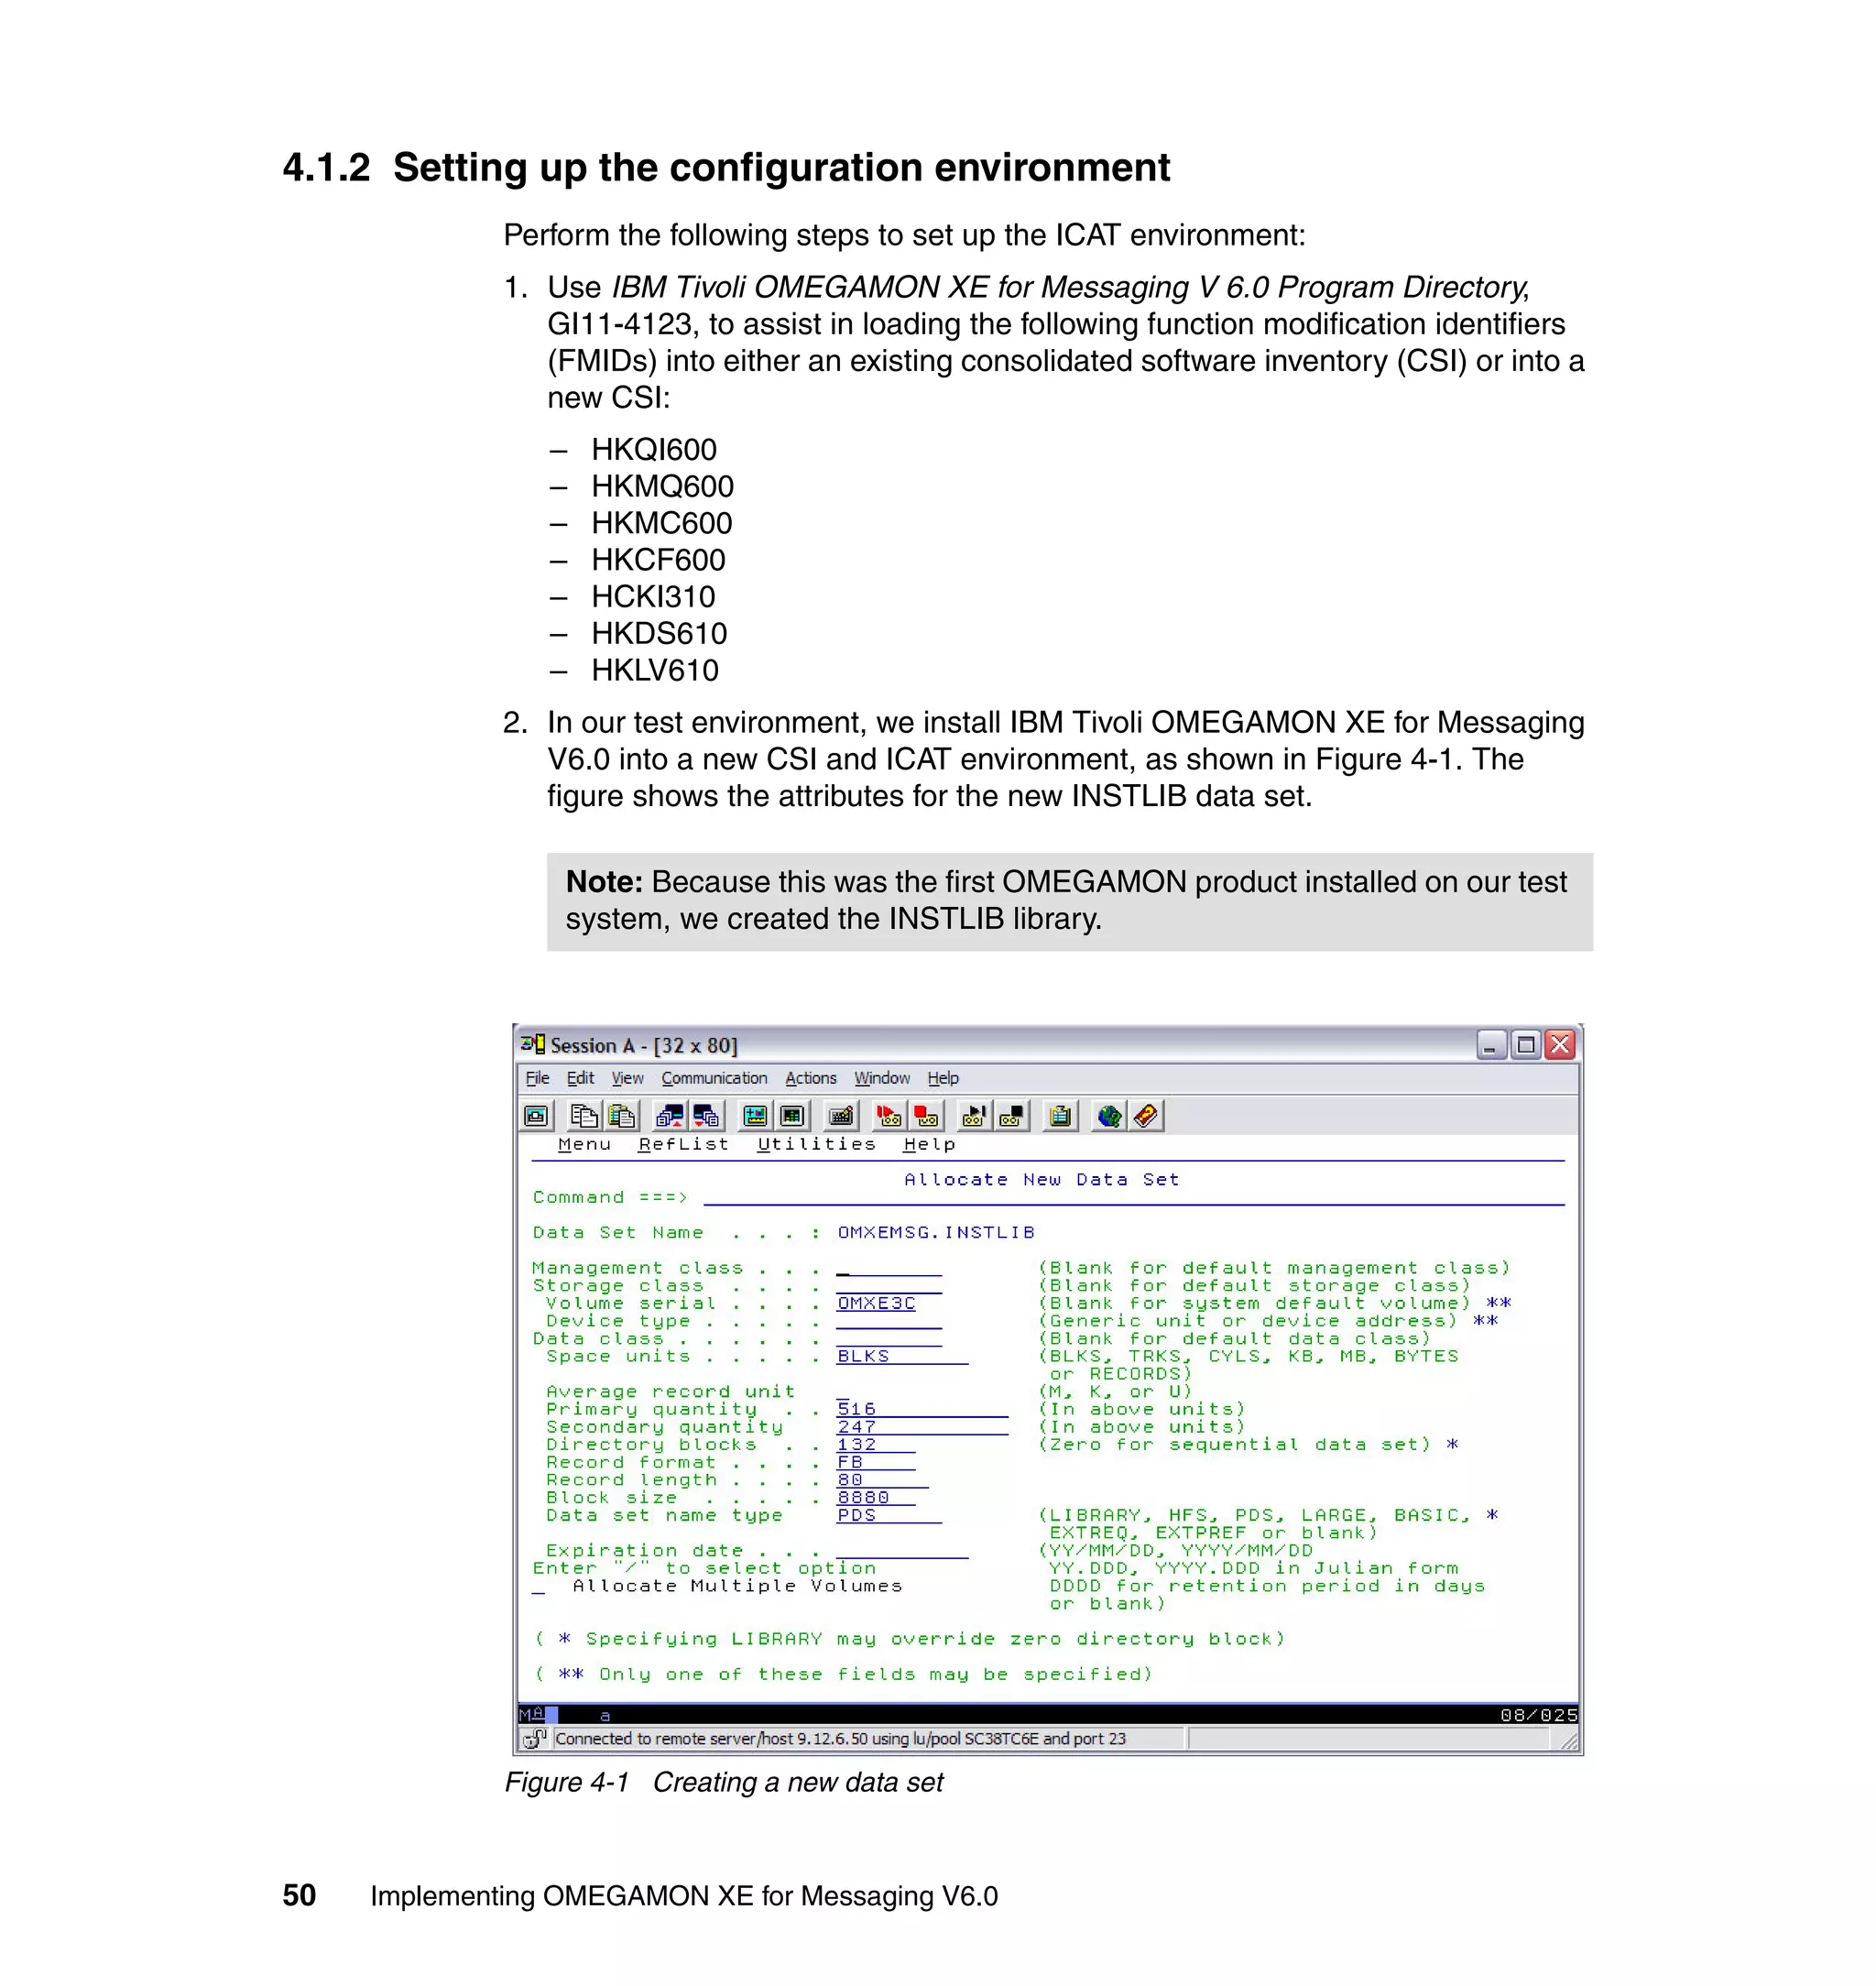
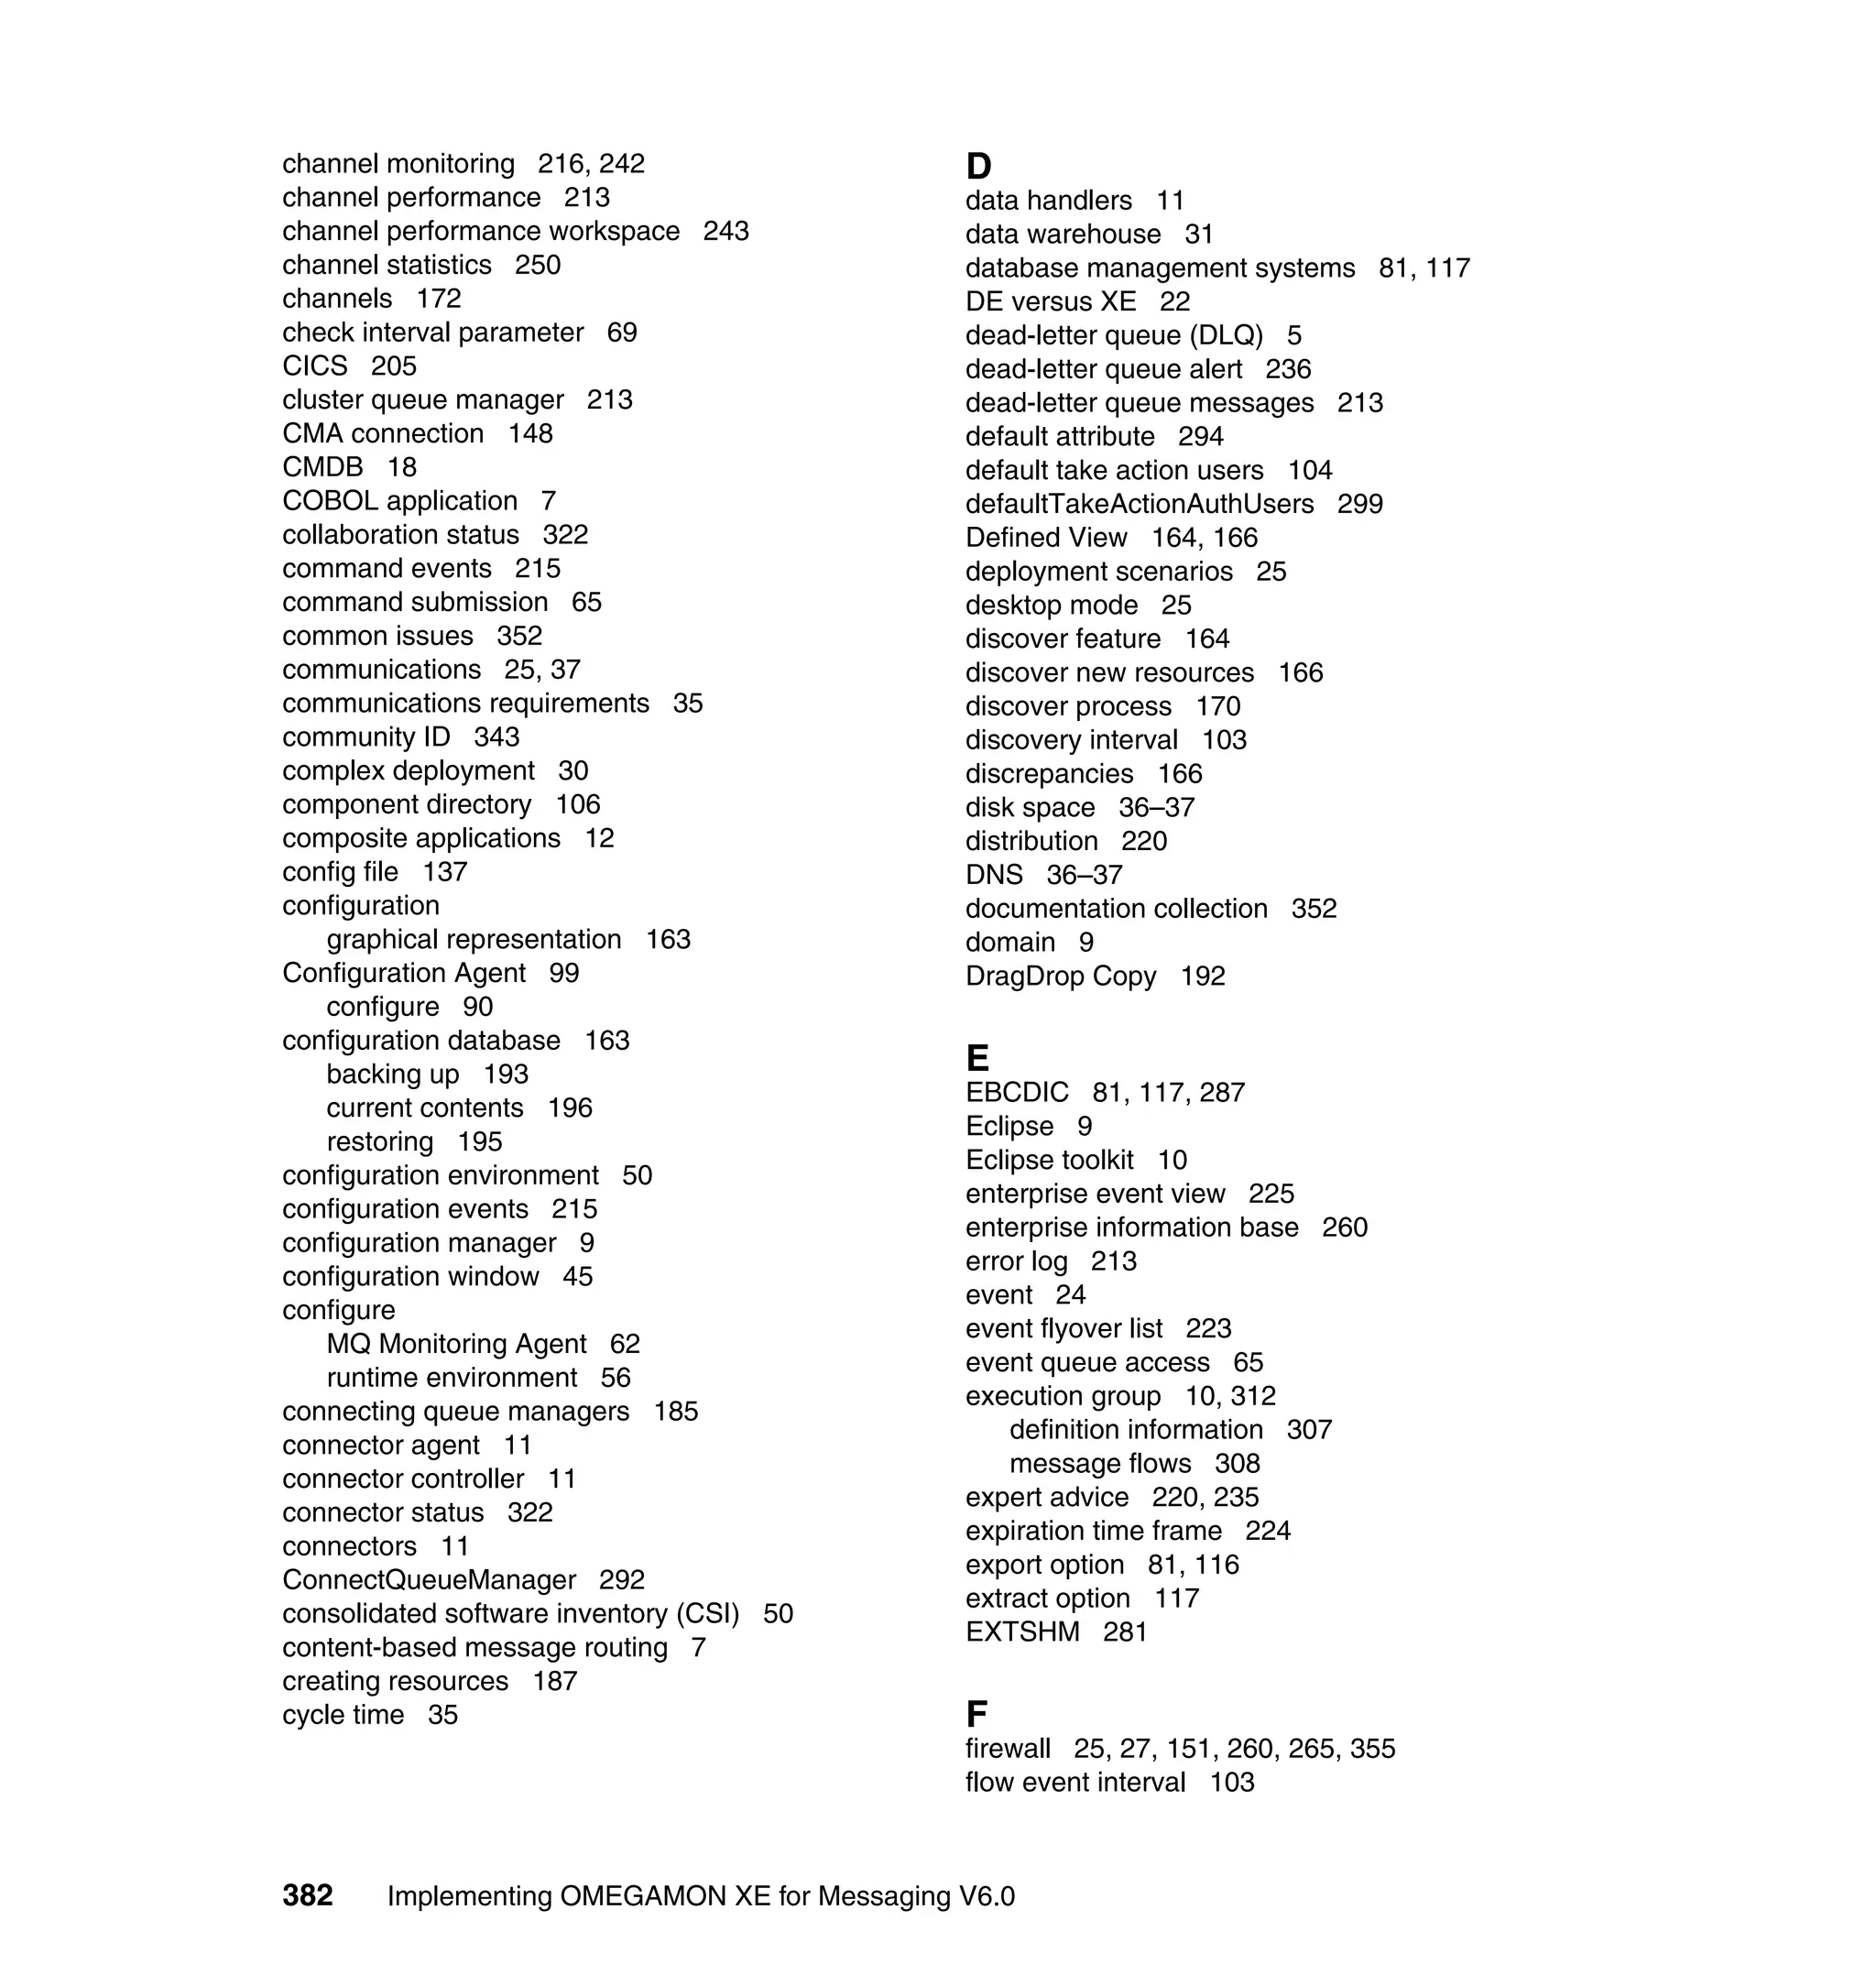
Execute the following command:
./itmcmd config –A [-h install_dir] [-a arch] [-t agent_host_name] pc
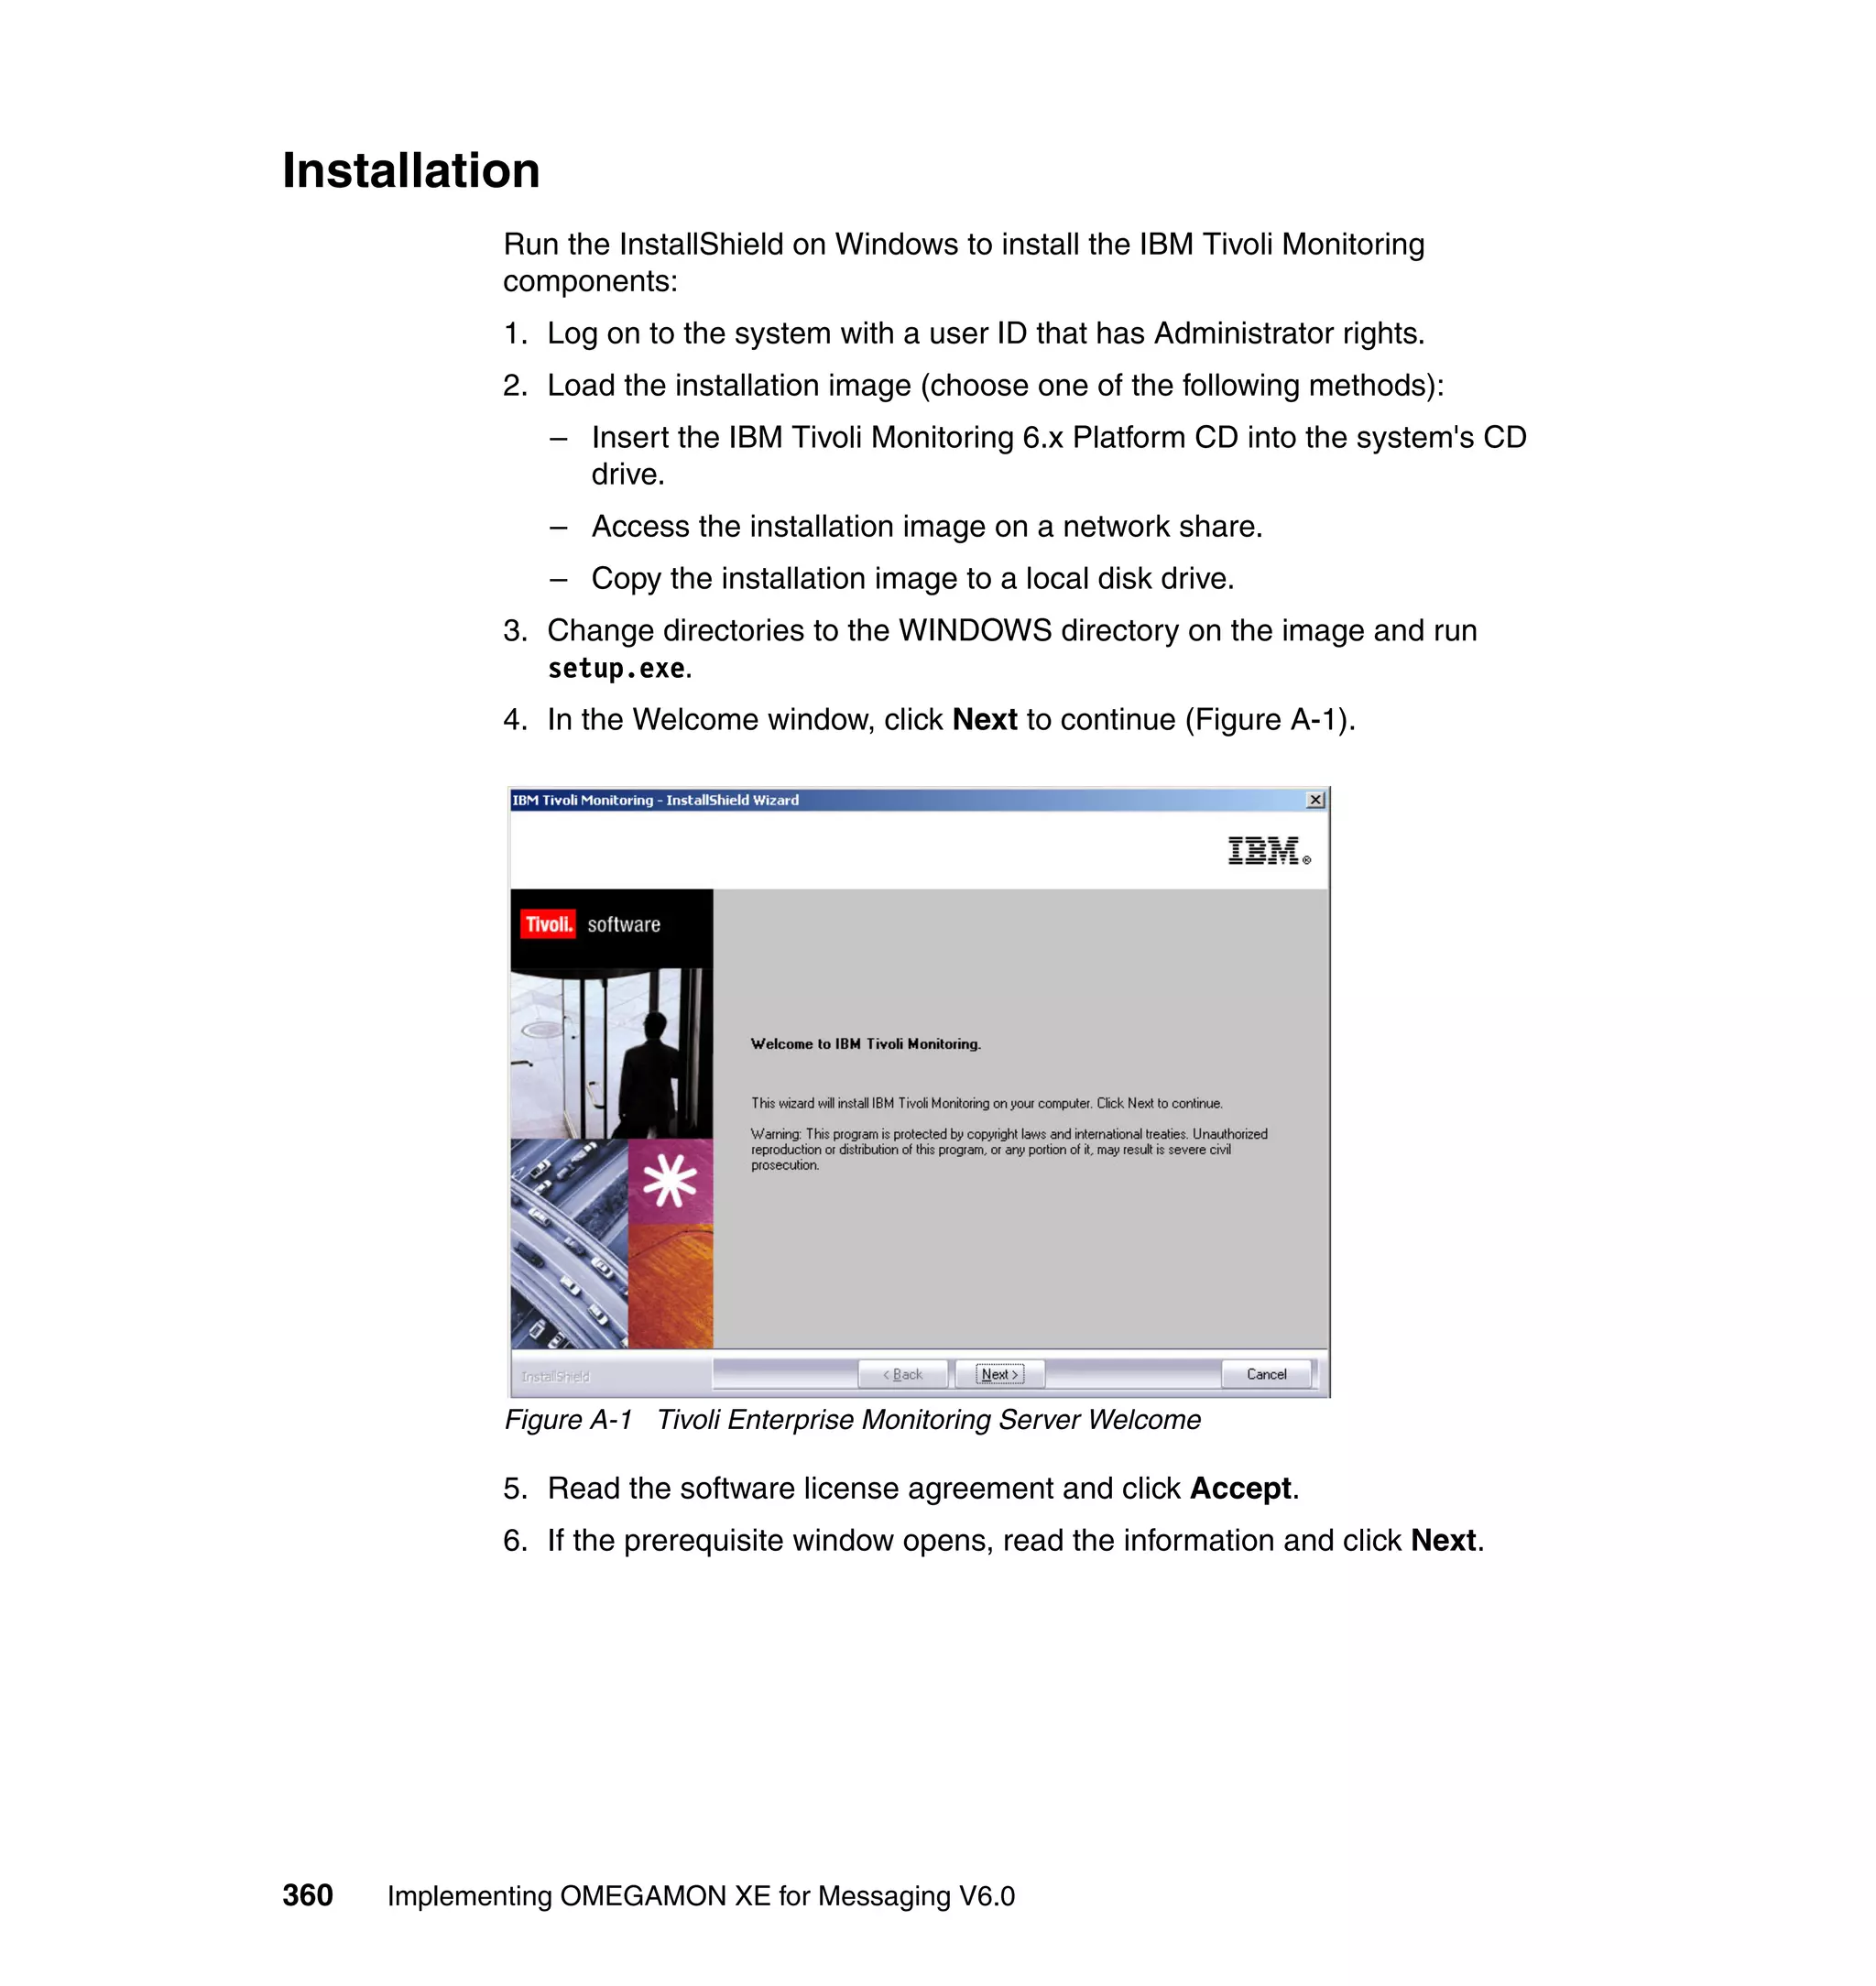
Table 4-1 explains the functions of the parameters in the previous command.
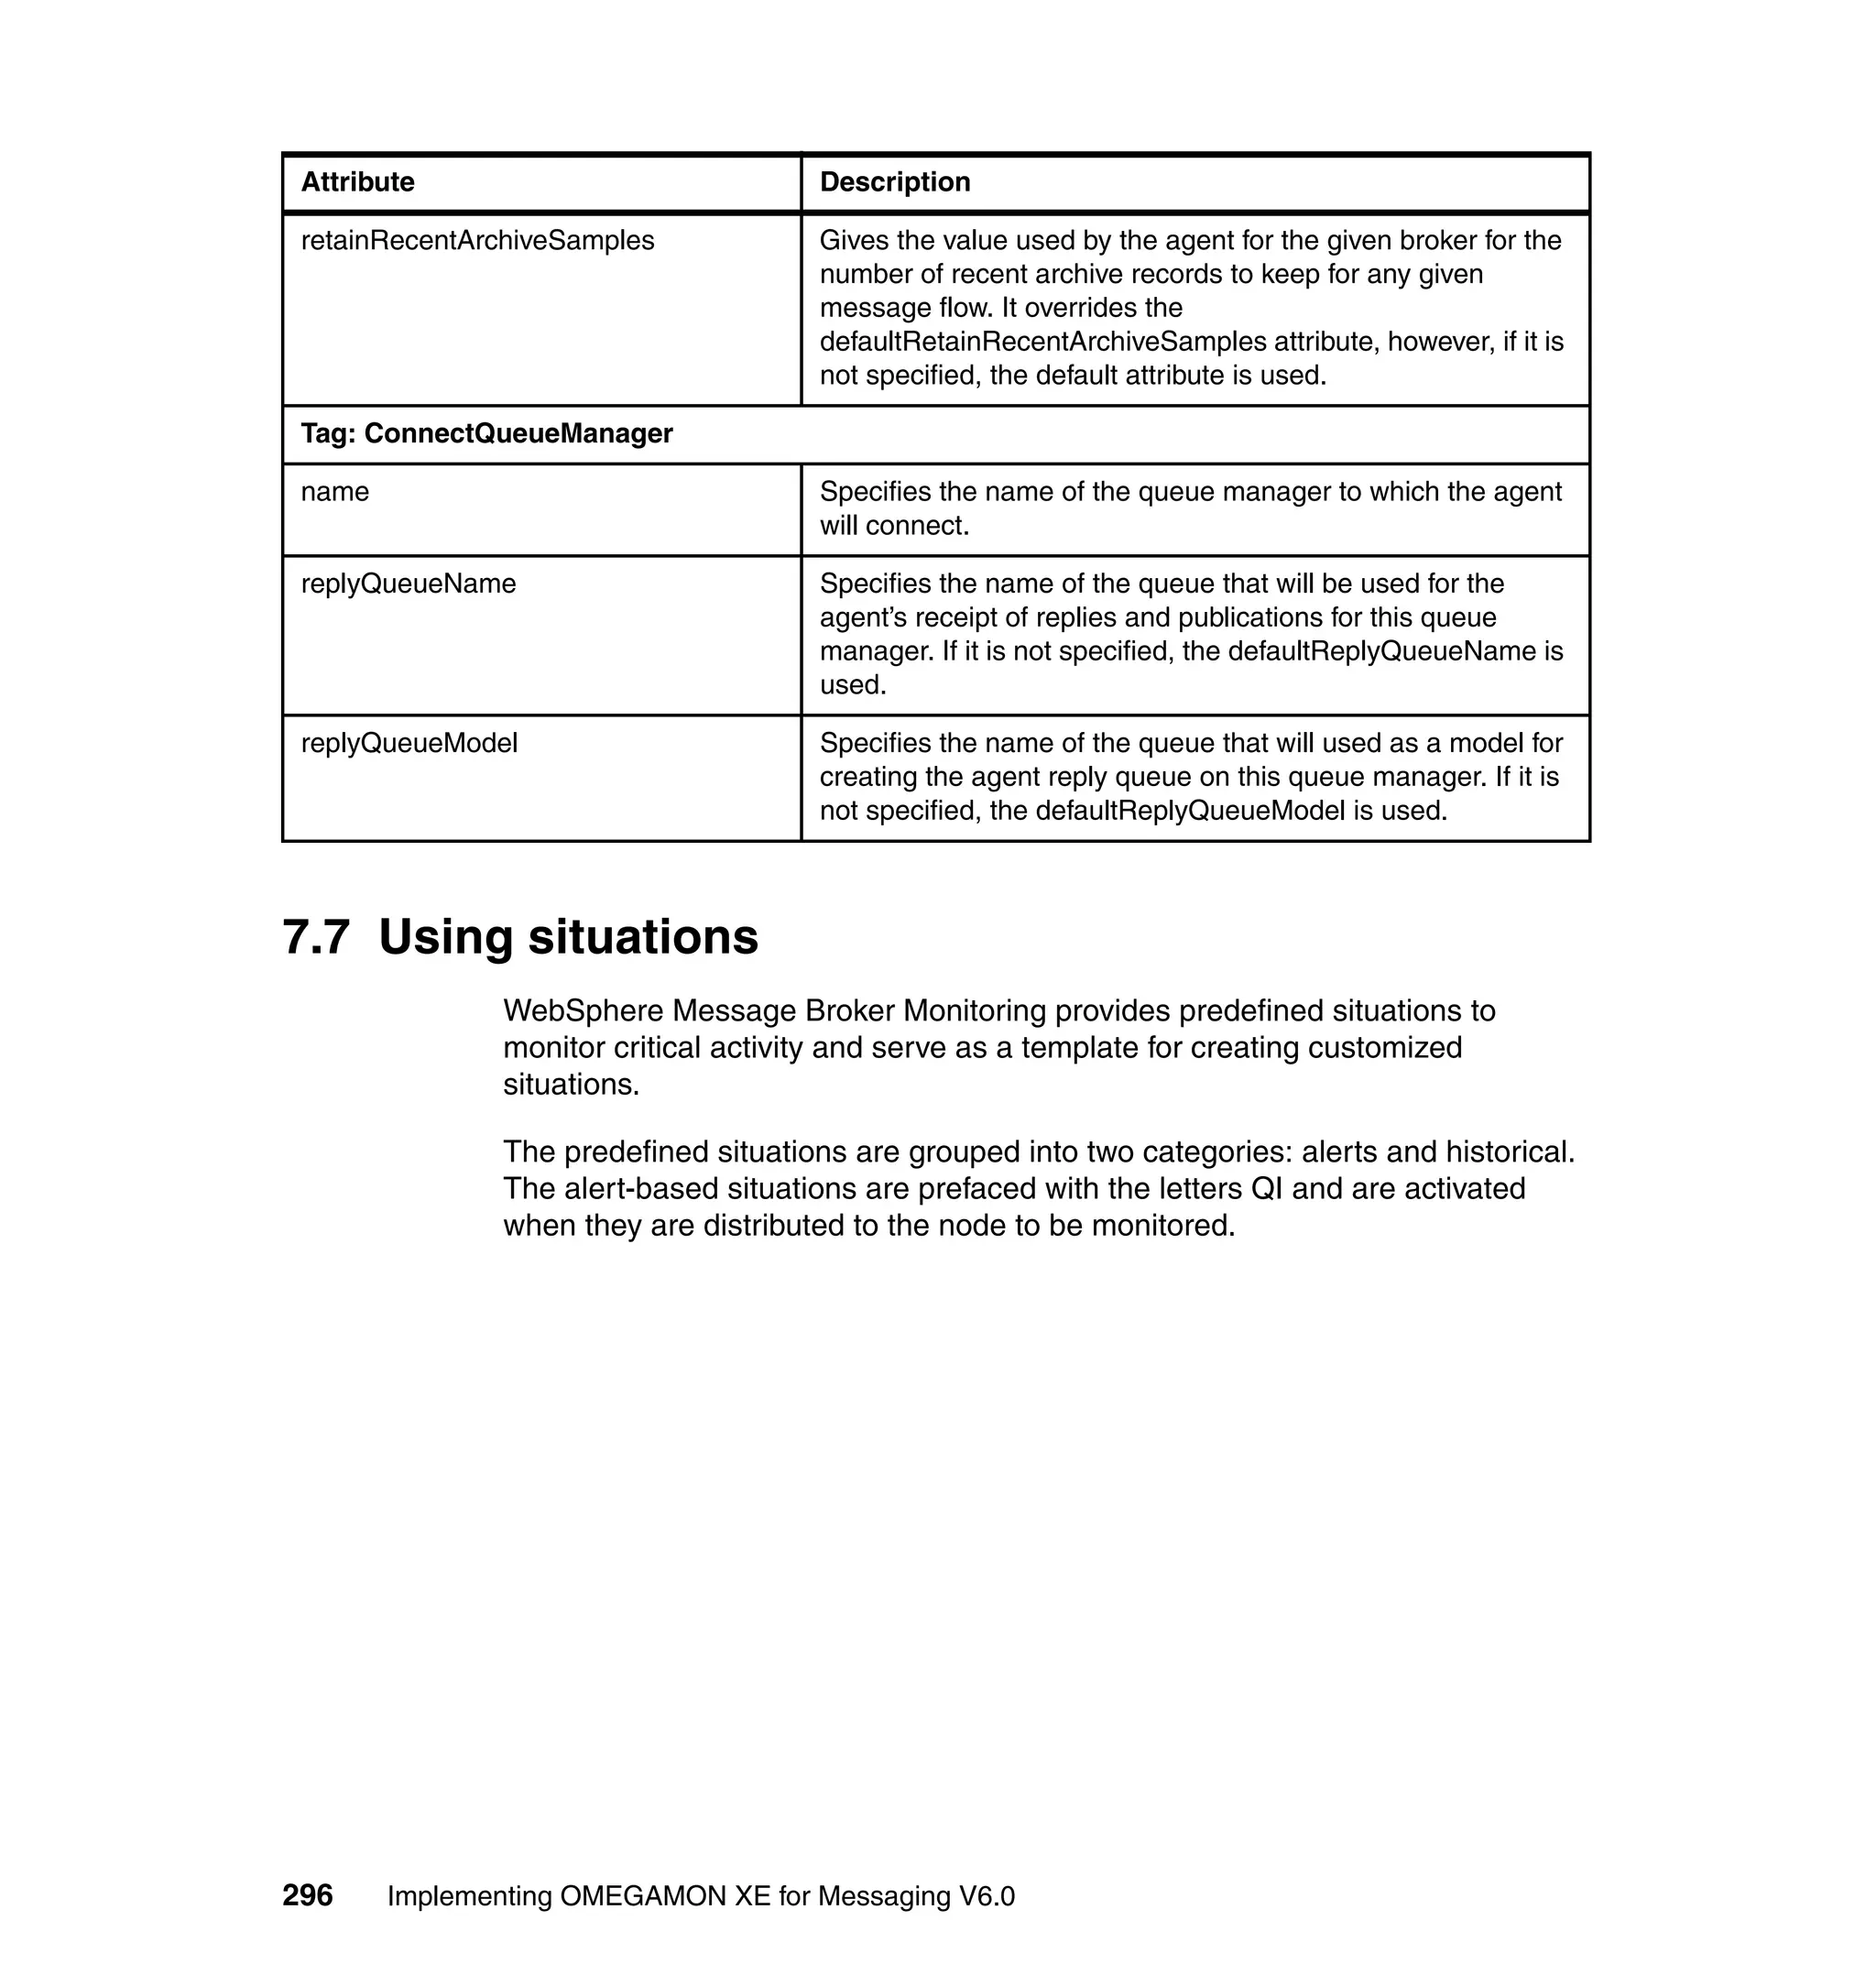
Table 4-1 ./itmcmd parameters
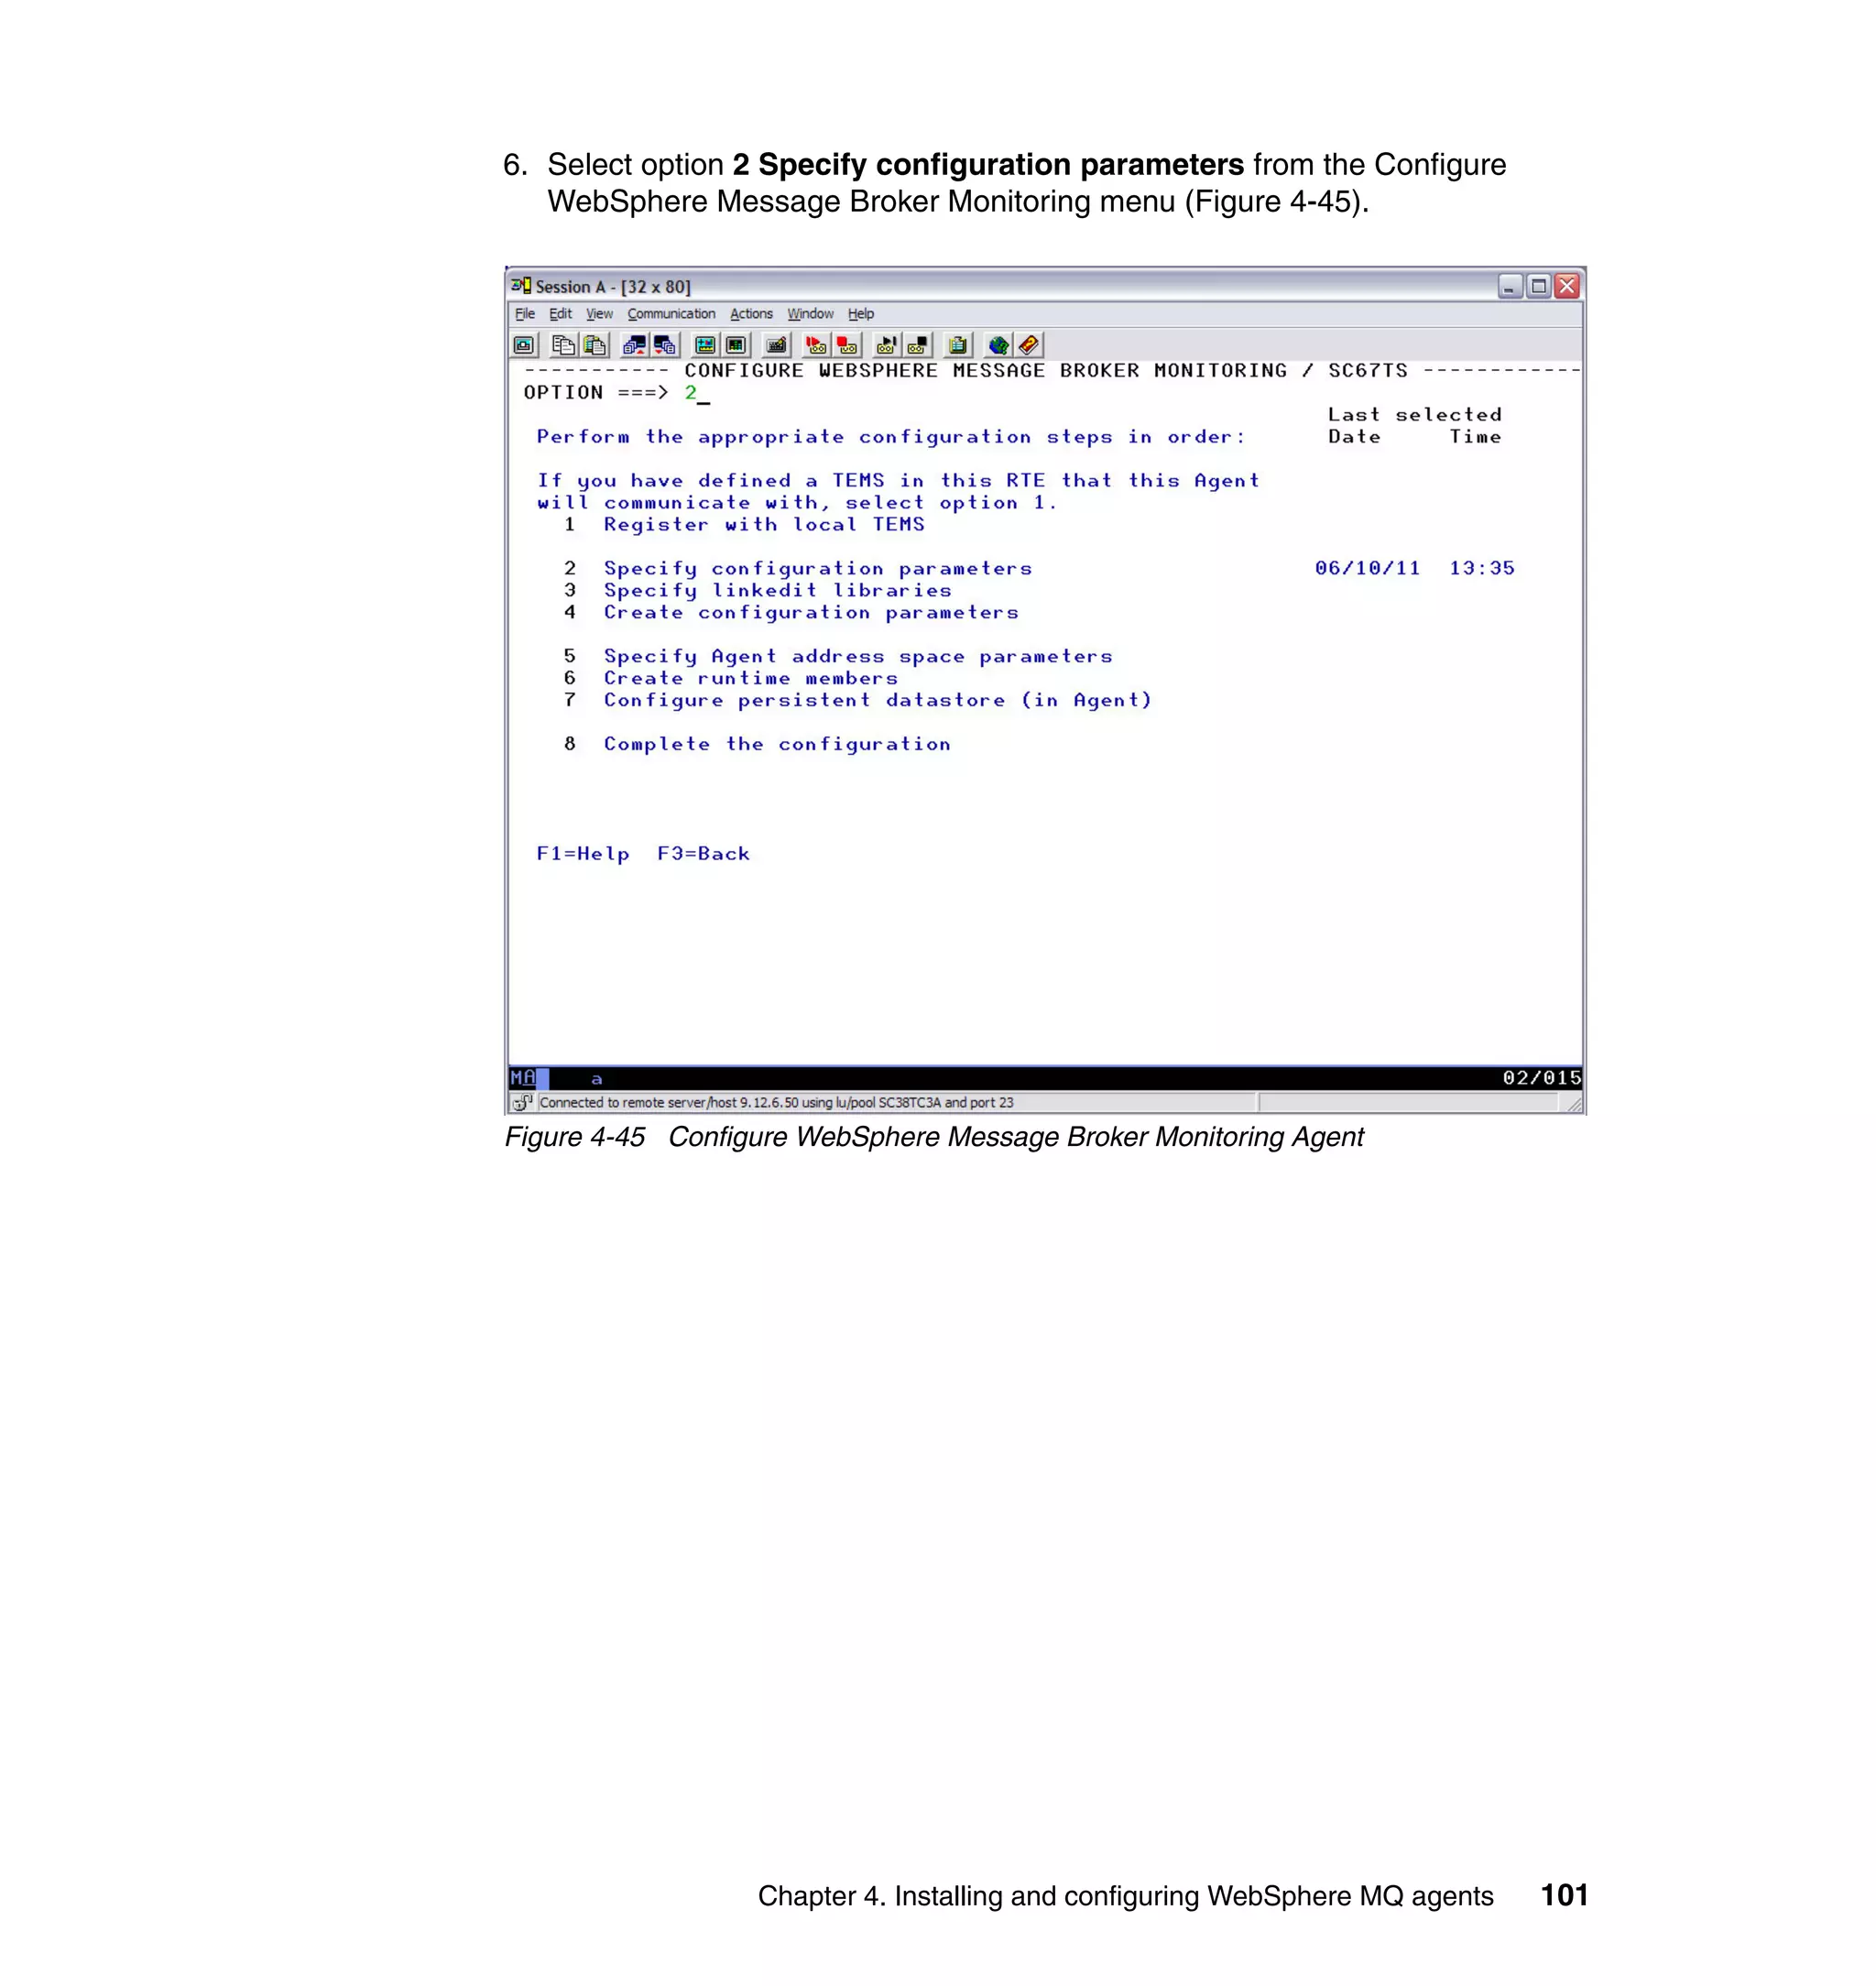
Variable Description
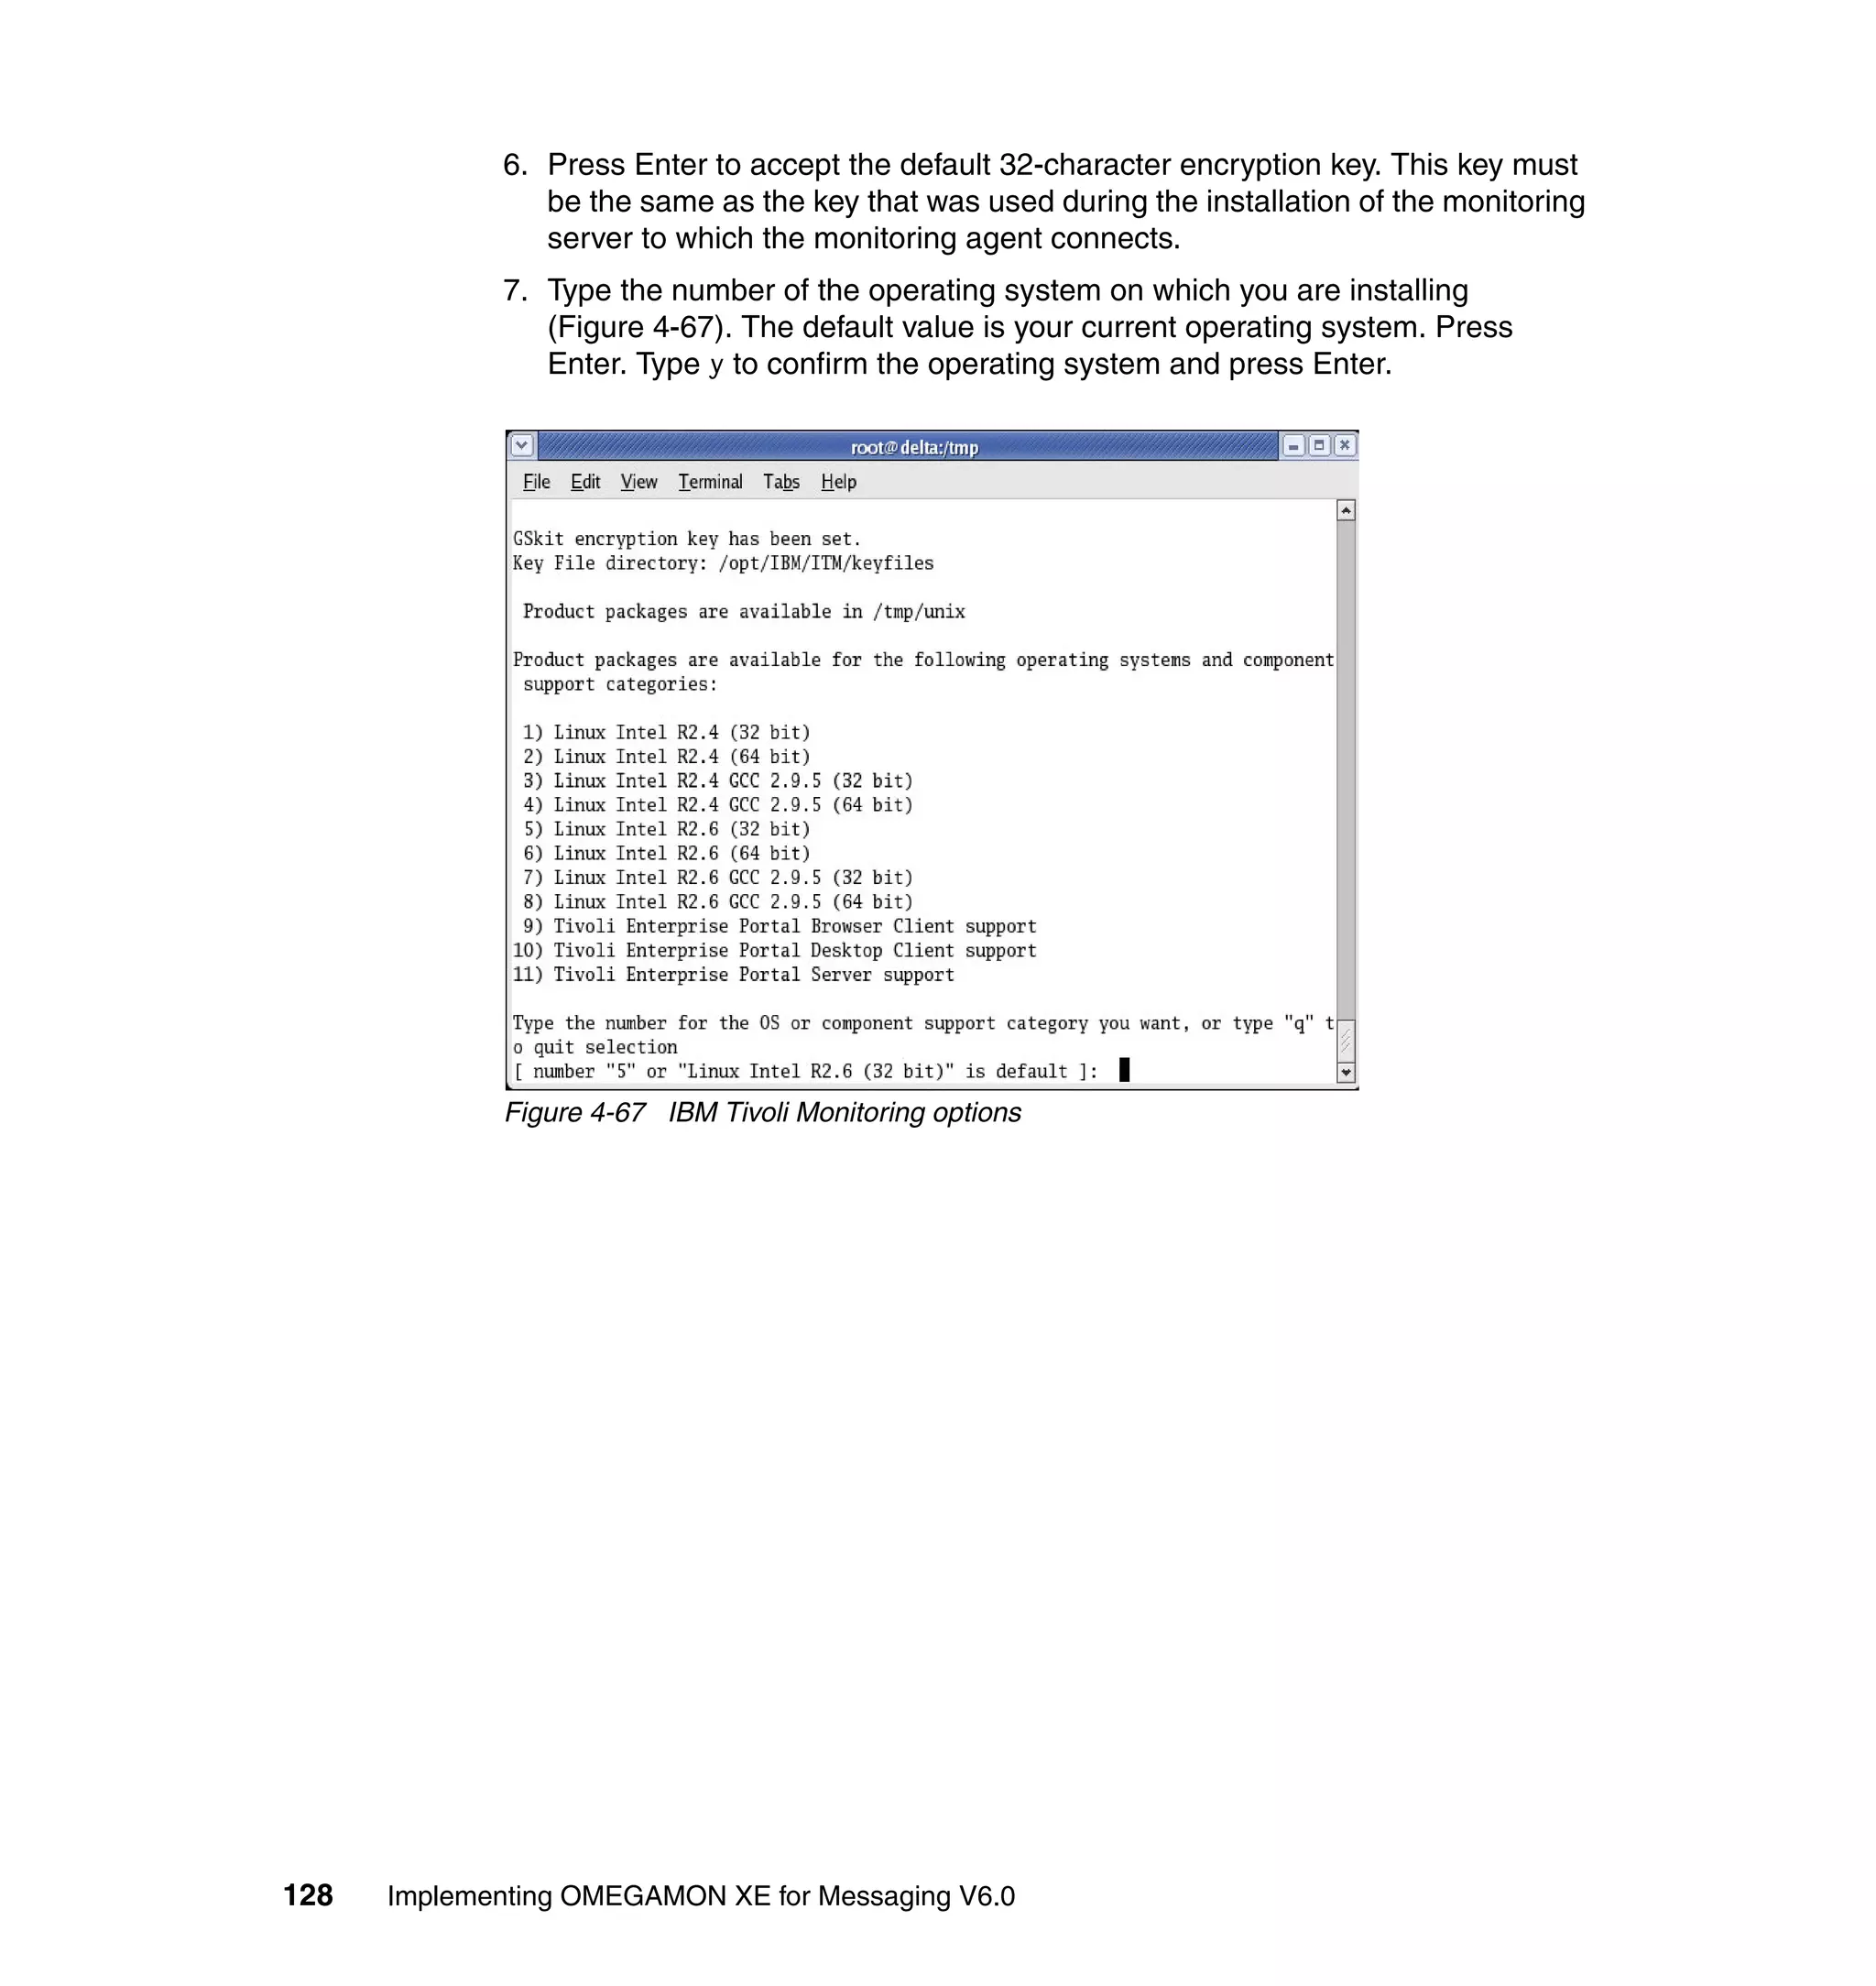
-A Used to configure an agent.
-a (Optional) Specifies the architecture. This parameter enables
you to configure an agent and a Monitoring Server for an
architecture other than the one that you are on. For example, if
you are on AIX 5L and want to configure for a Solaris computer,
this option is required. Otherwise, the default is the computer
you are on.
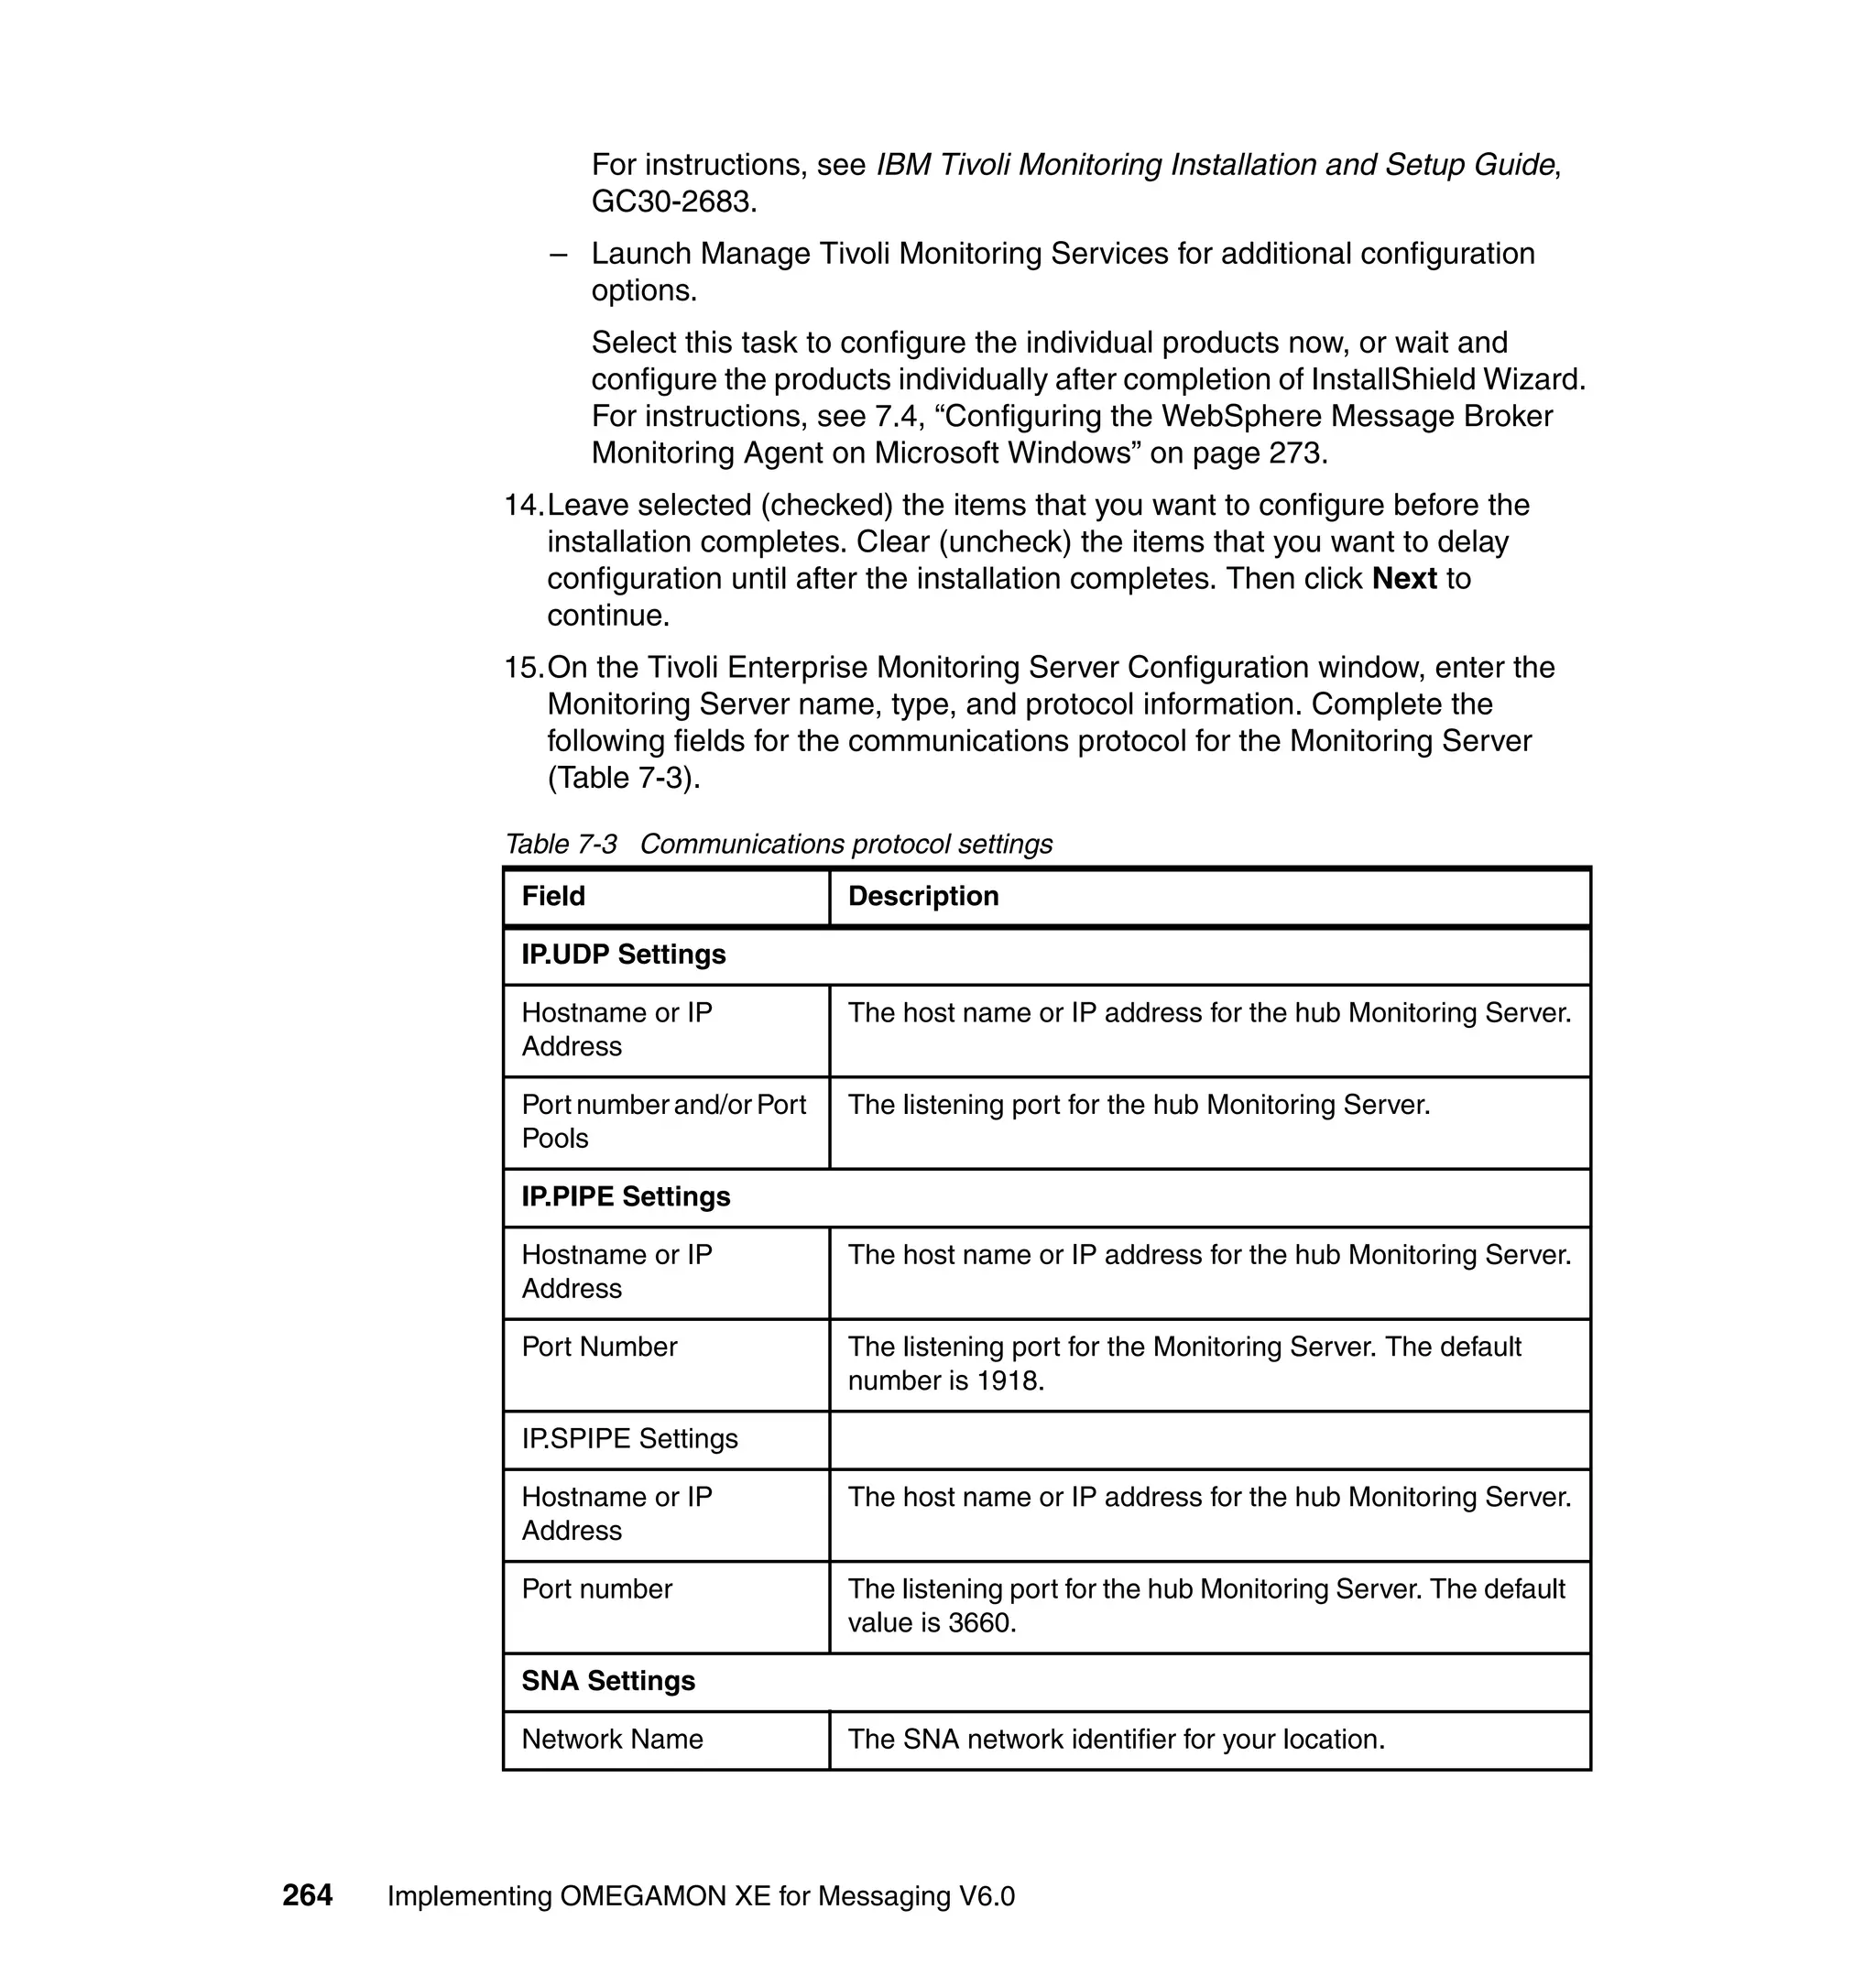
arch One of the abbreviations used by IBM Tivoli for the architecture.
-h (Optional) Identifies the installation directory if it is not the one in
which the script is located. Also use this option to take action on
an IBM Tivoli Monitoring installation directory other than the one
in the current system.
-t (when used (Optional) Used for specific agent-to-Monitoring Server
for agents) connectivity. Entering this flag creates a configuration file that is
specific for running on the specified host. This option overrides
the generic OS configuration file. Only use this option in those
instances where an agent configuration requires different
parameters for the host OS on which it will run.
Note: When reconfiguring an agent that has been configured
using this option, you must use this option again to update the
existing configuration.
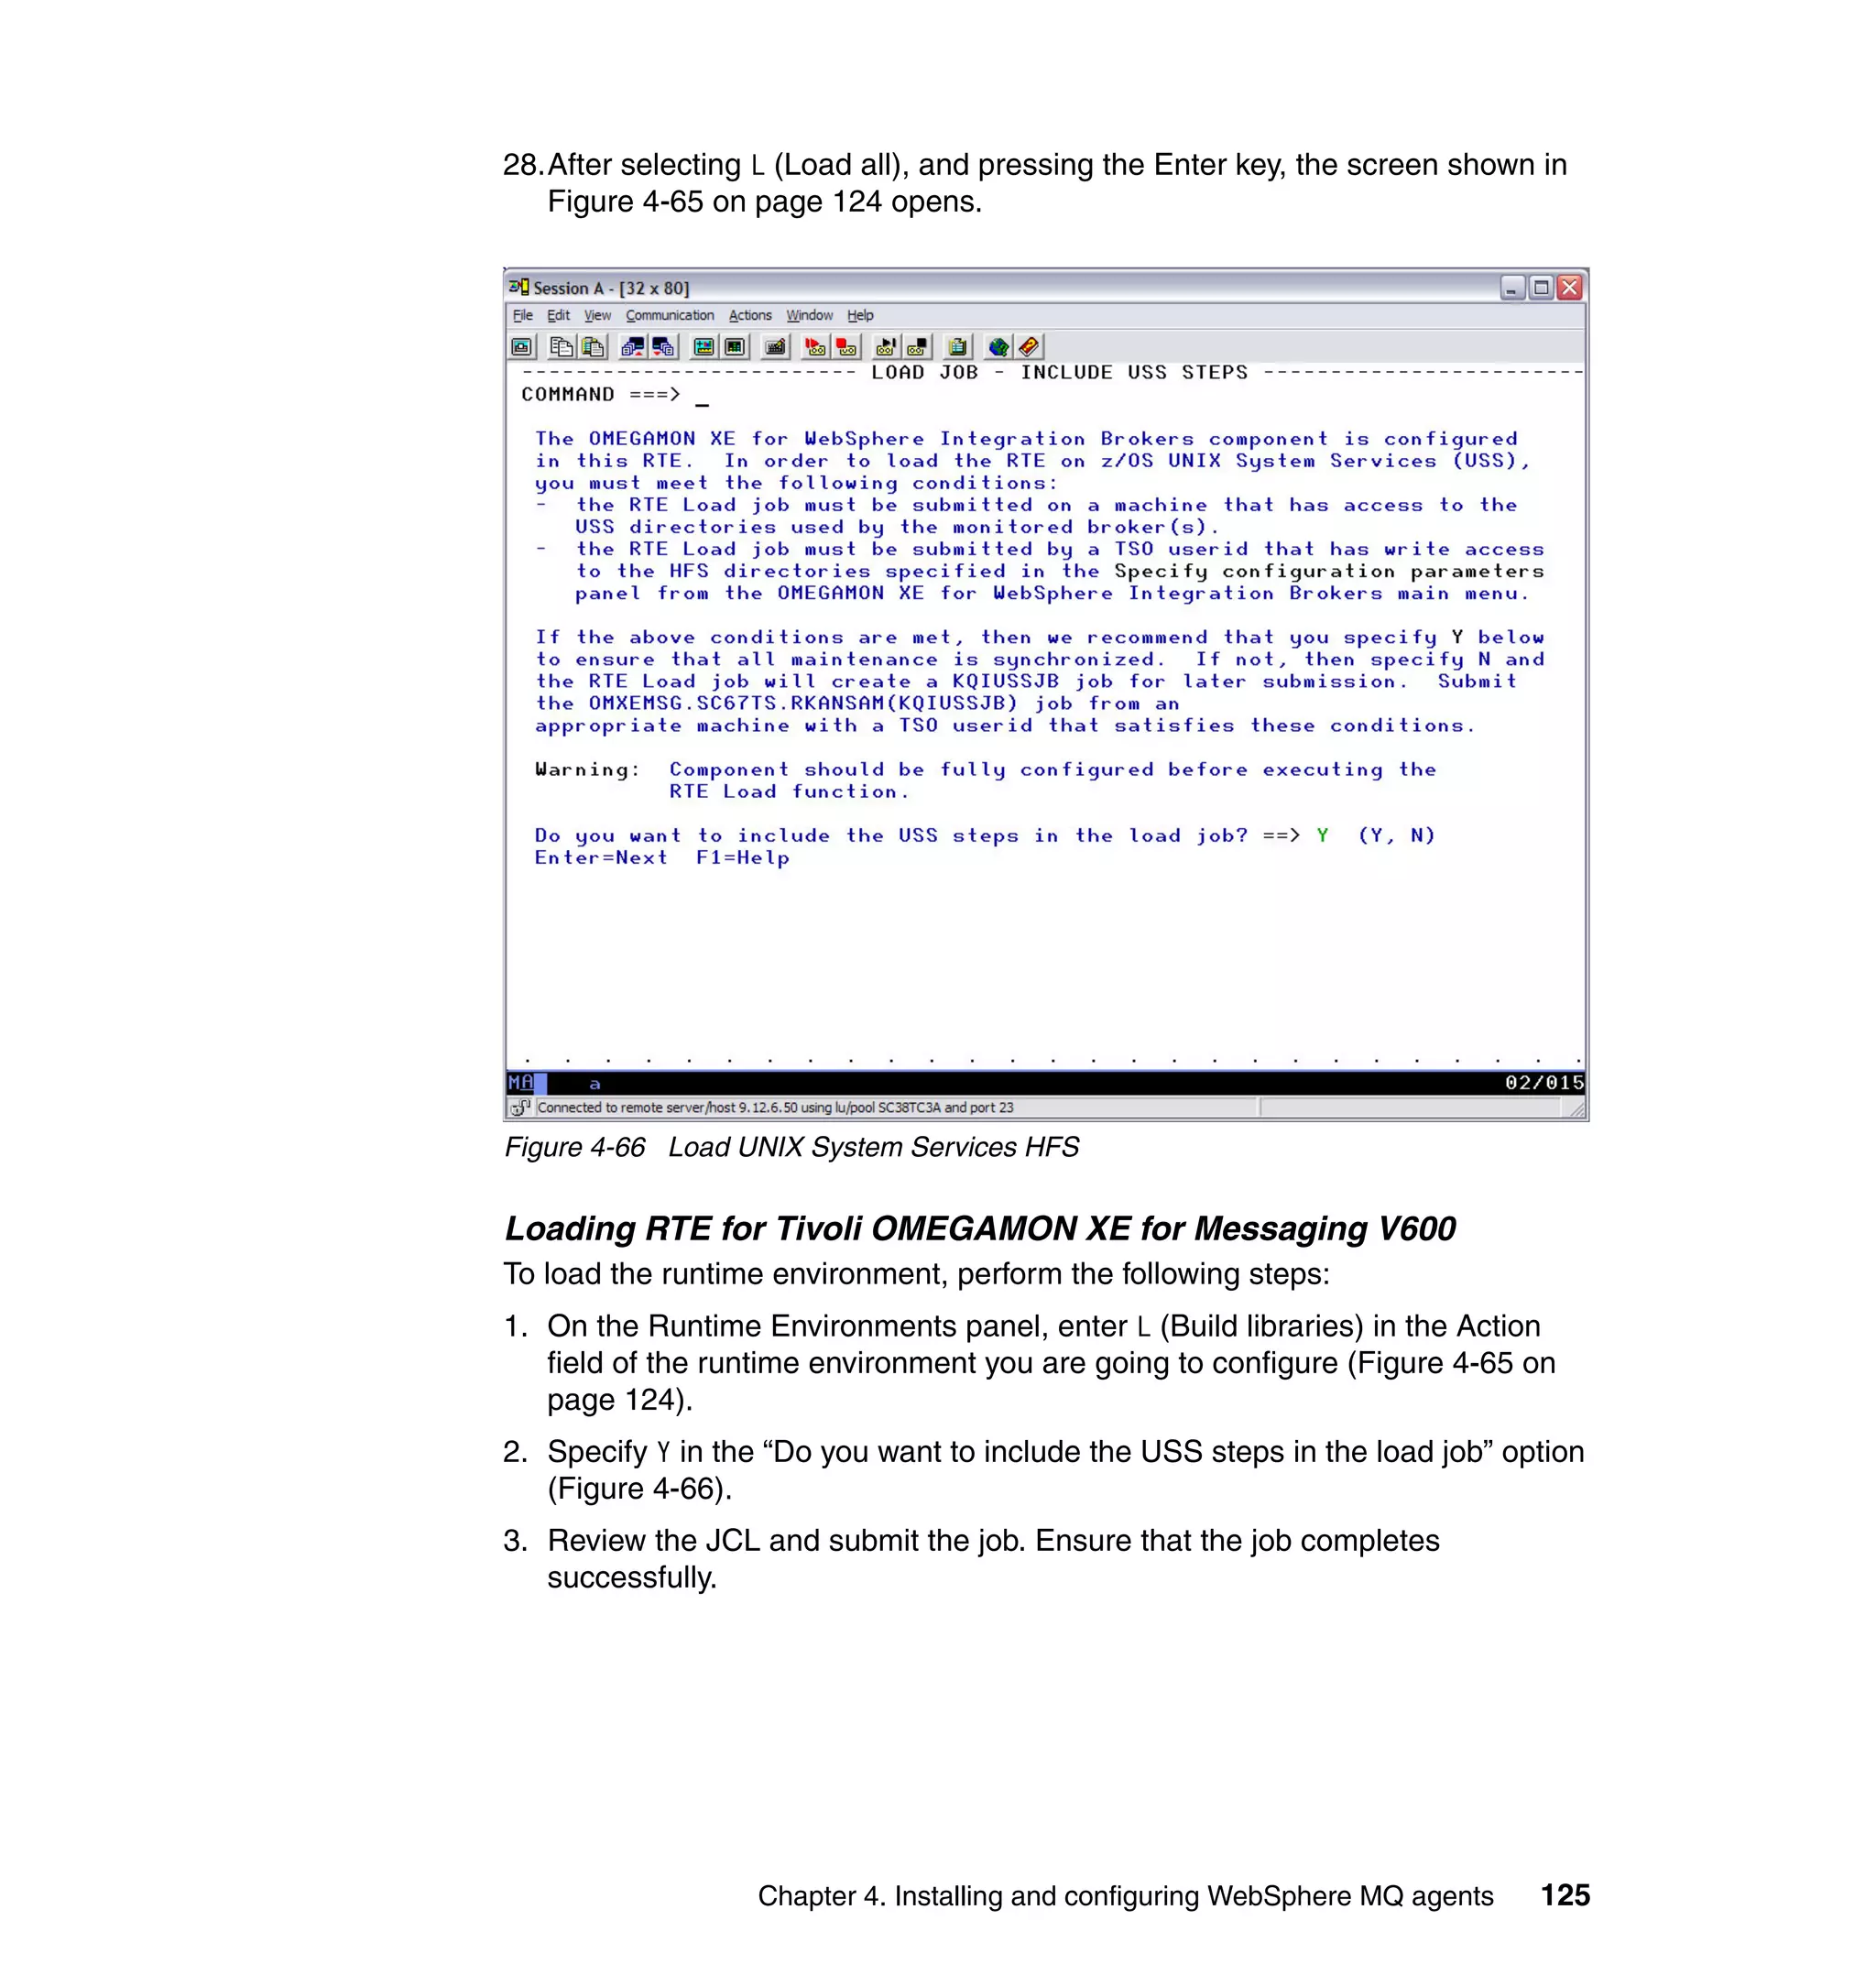
agent_host_name Host name for the agent.
pc Indicates the product code of the agent you are configuring. The
WebSphere MQ Configuration product code is mc; the
WebSphere MQ Monitoring product code is mq.
136 Implementing OMEGAMON XE for Messaging V6.0](https://image.slidesharecdn.com/implementingomegamonxeformessagingv6-0sg247357-120524195829-phpapp02/75/Implementing-omegamon-xe-for-messaging-v6-0-sg247357-158-2048.jpg)
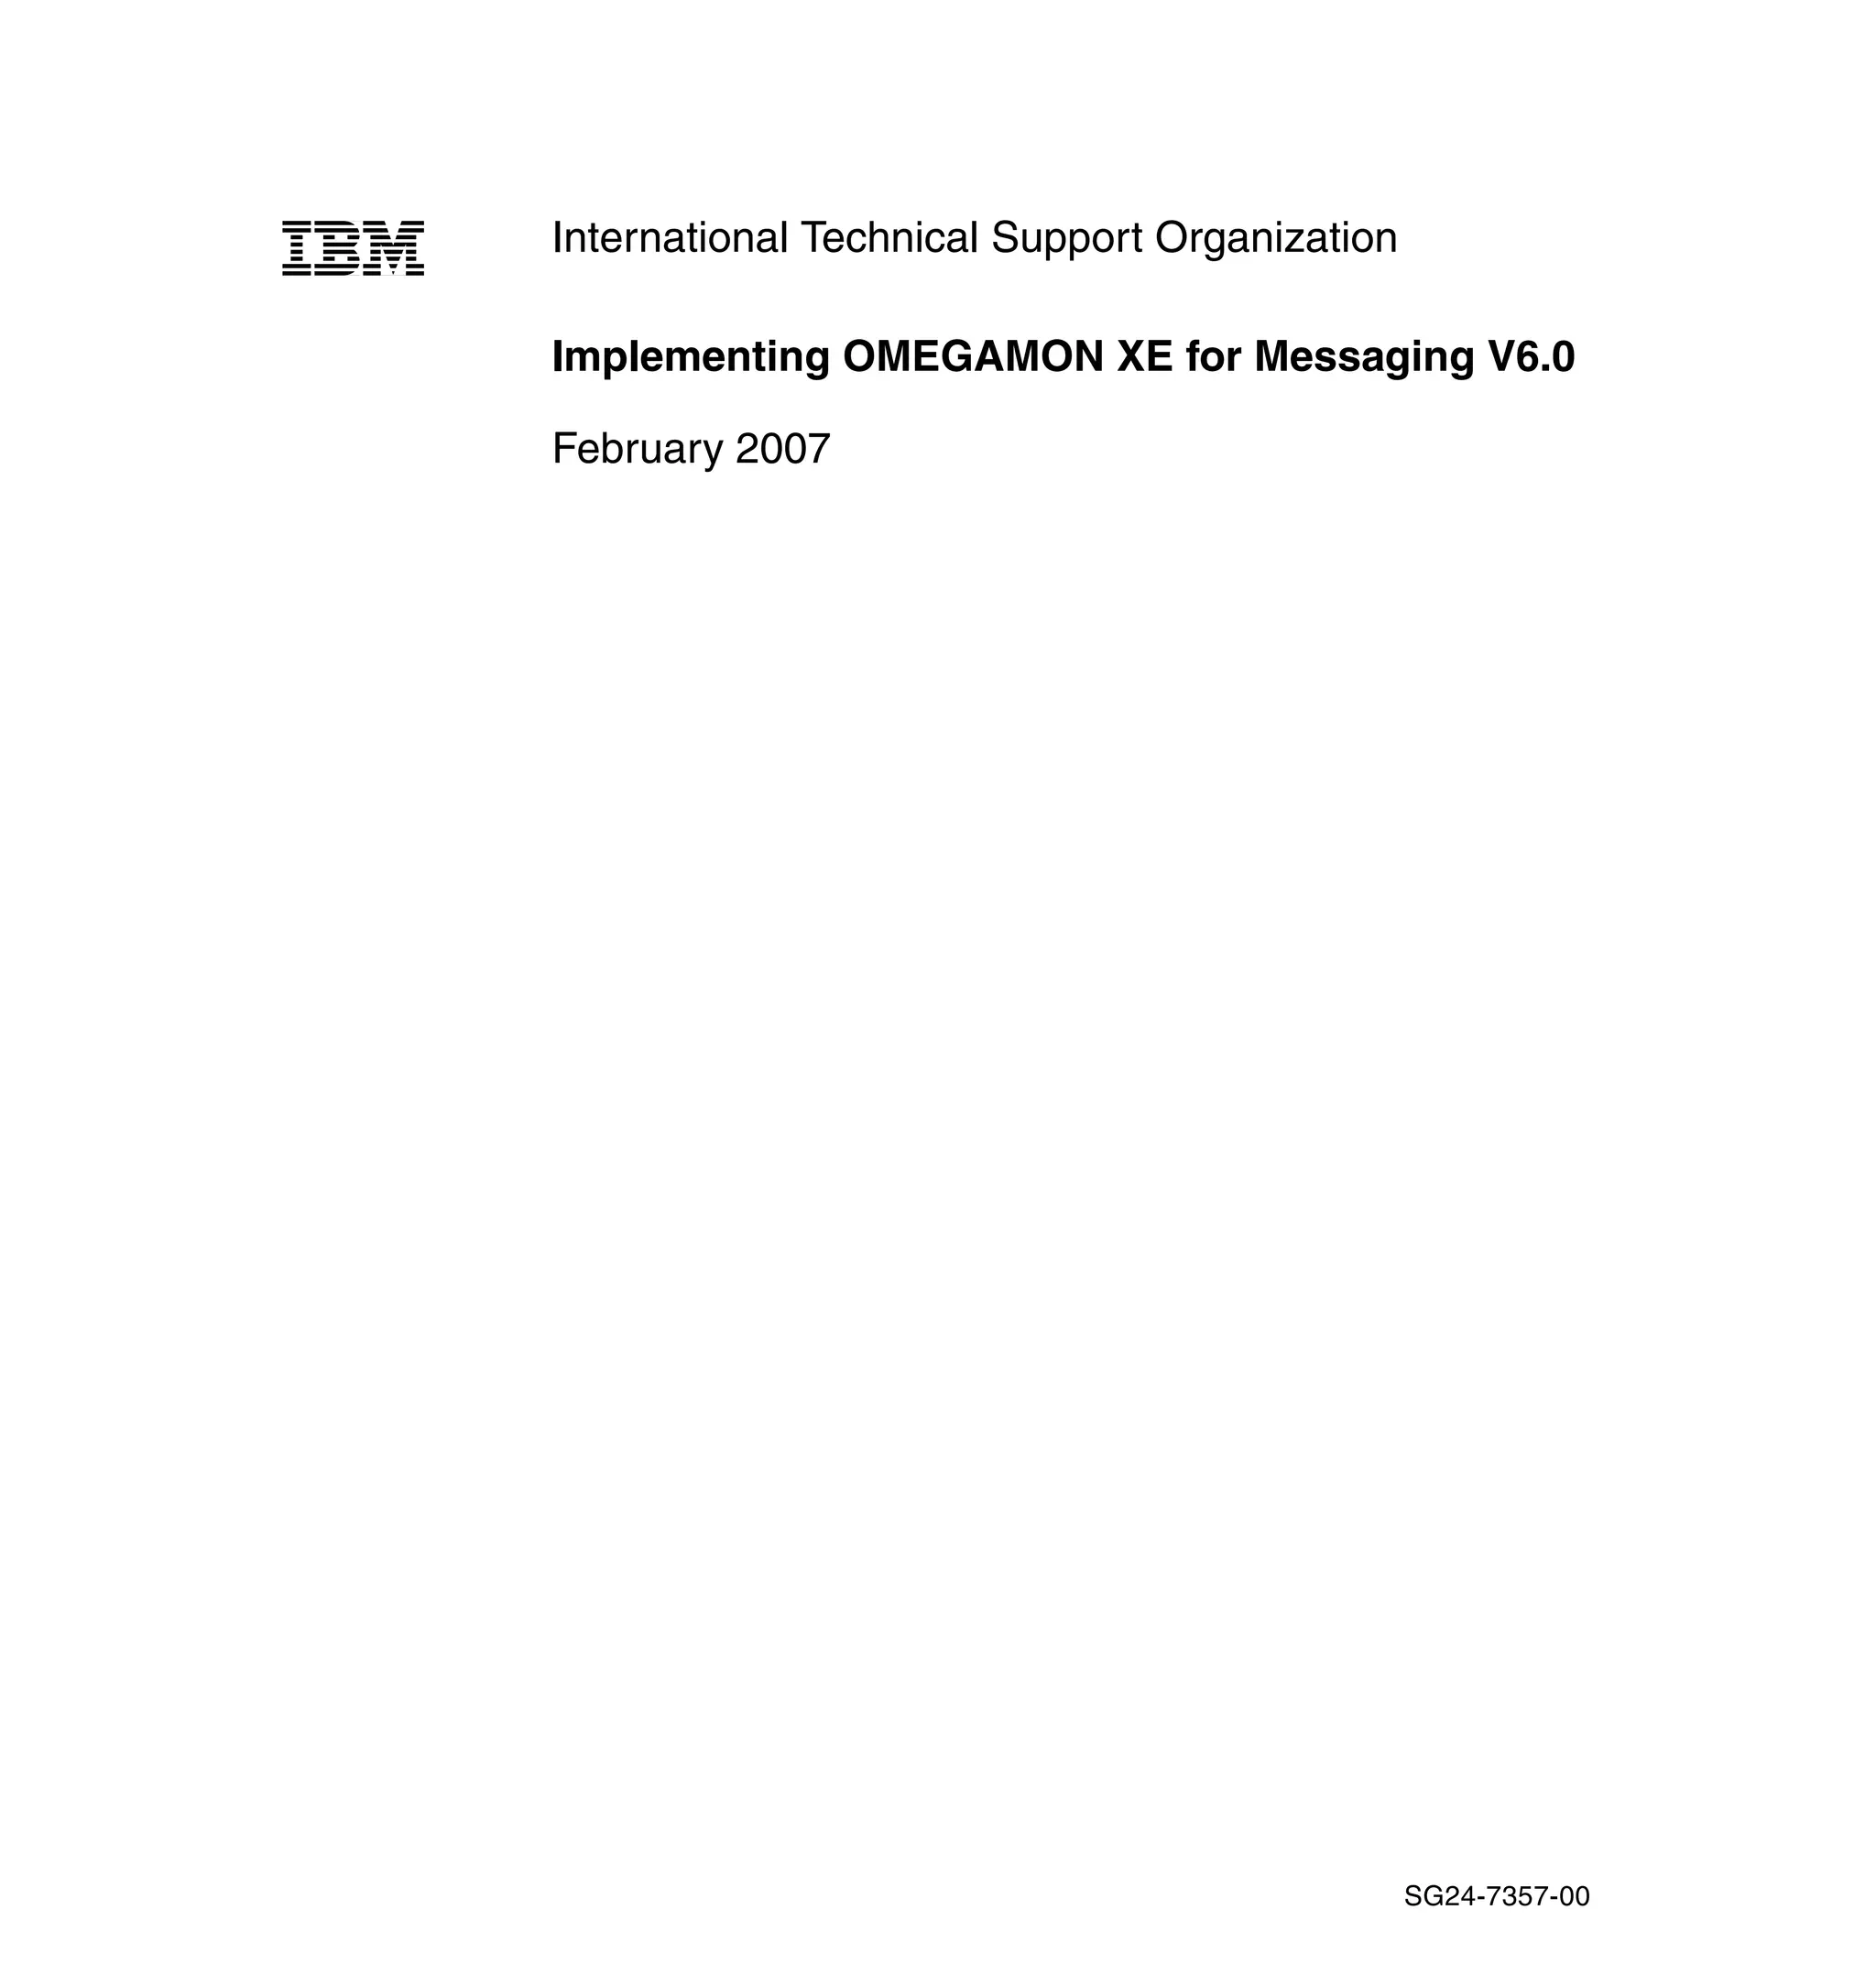
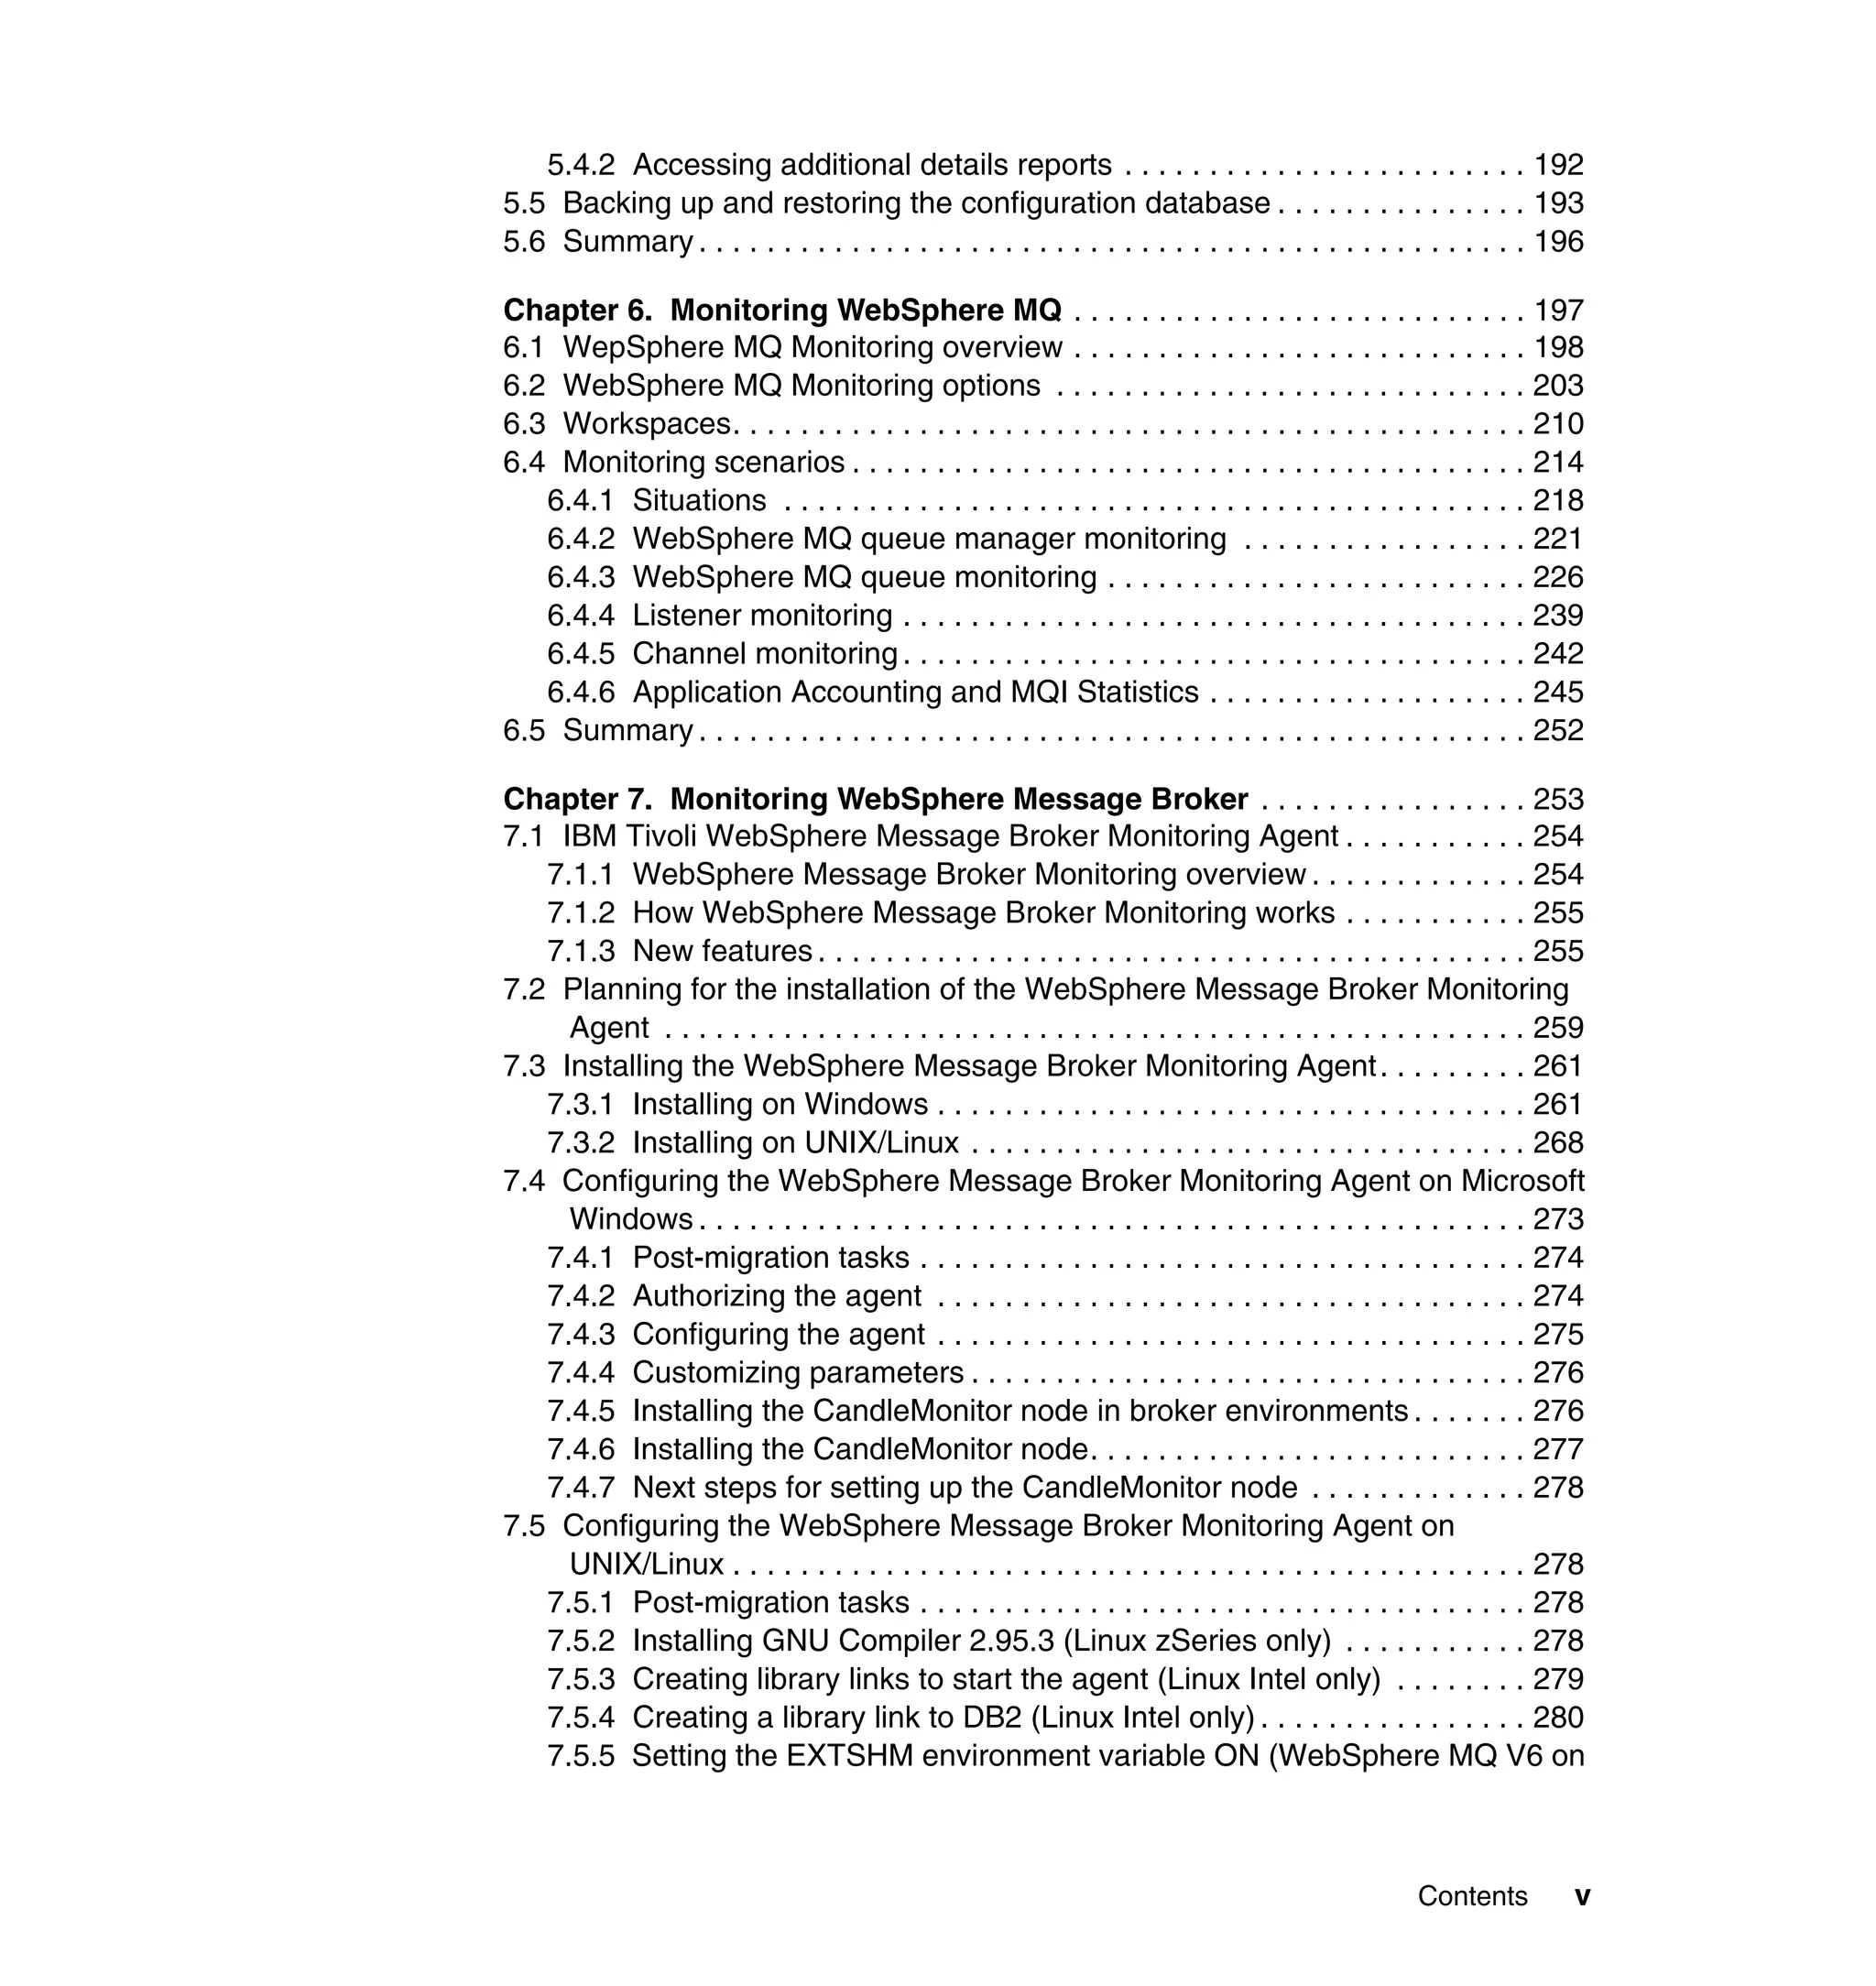
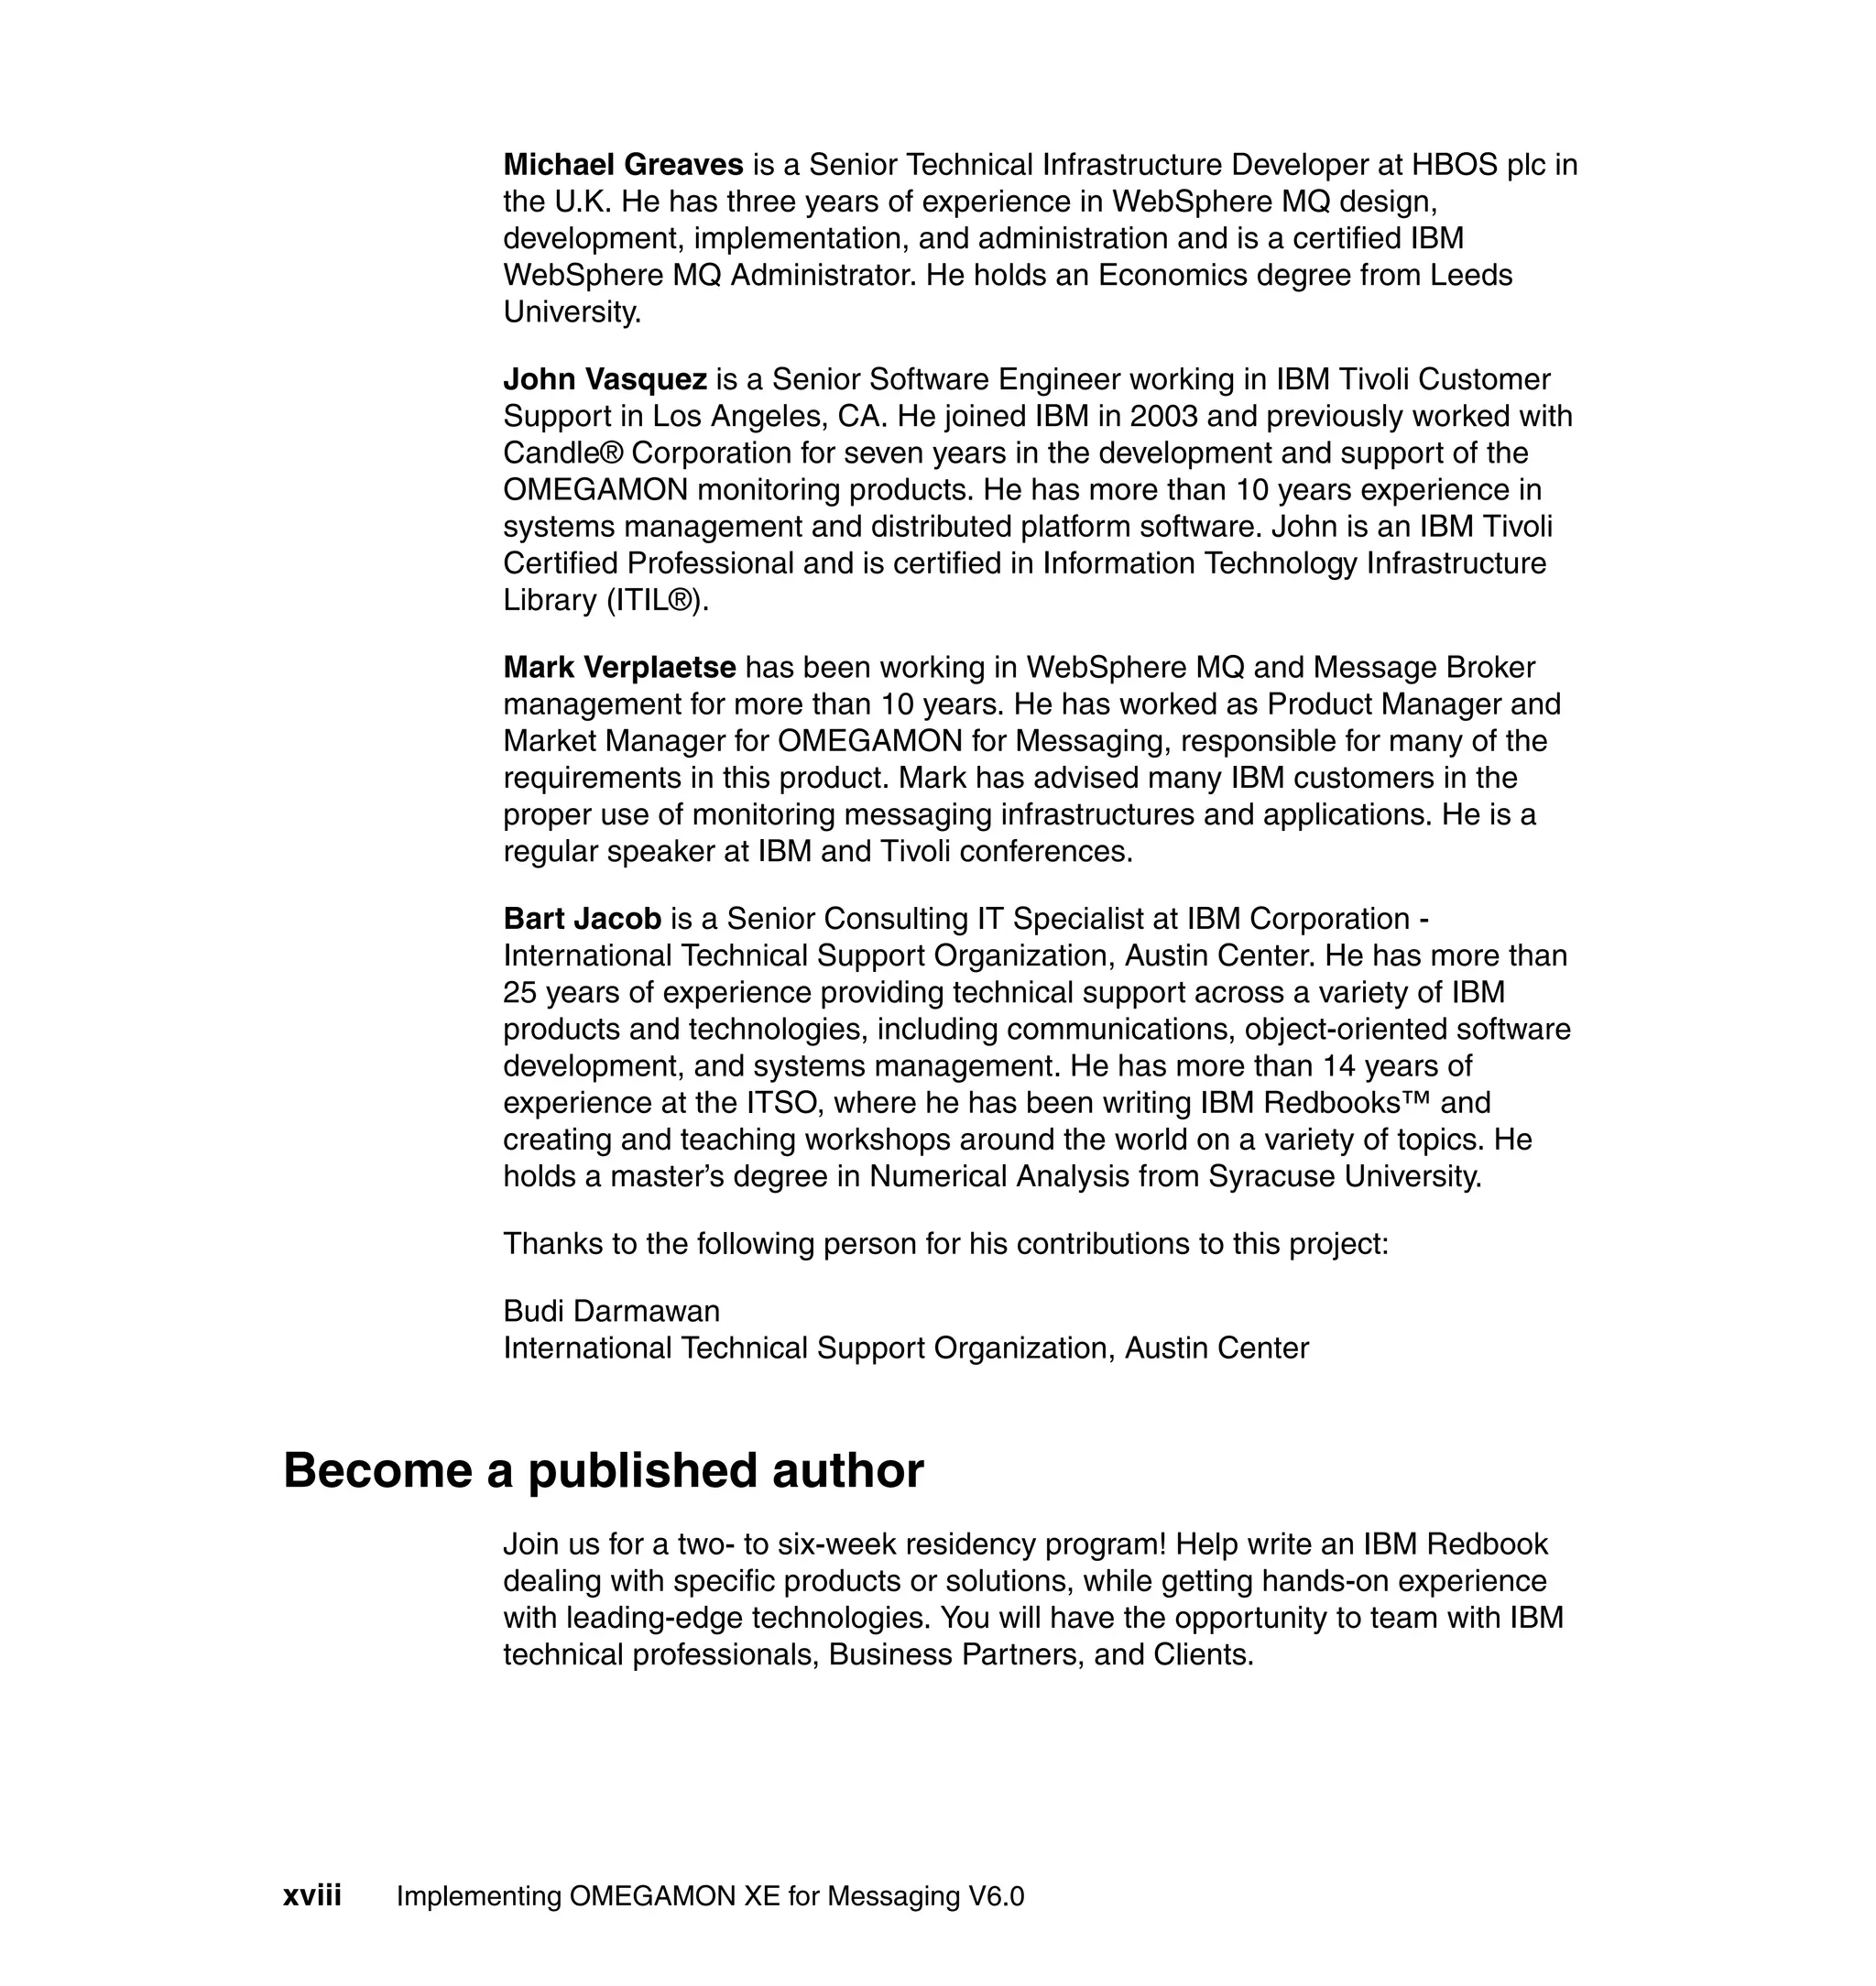
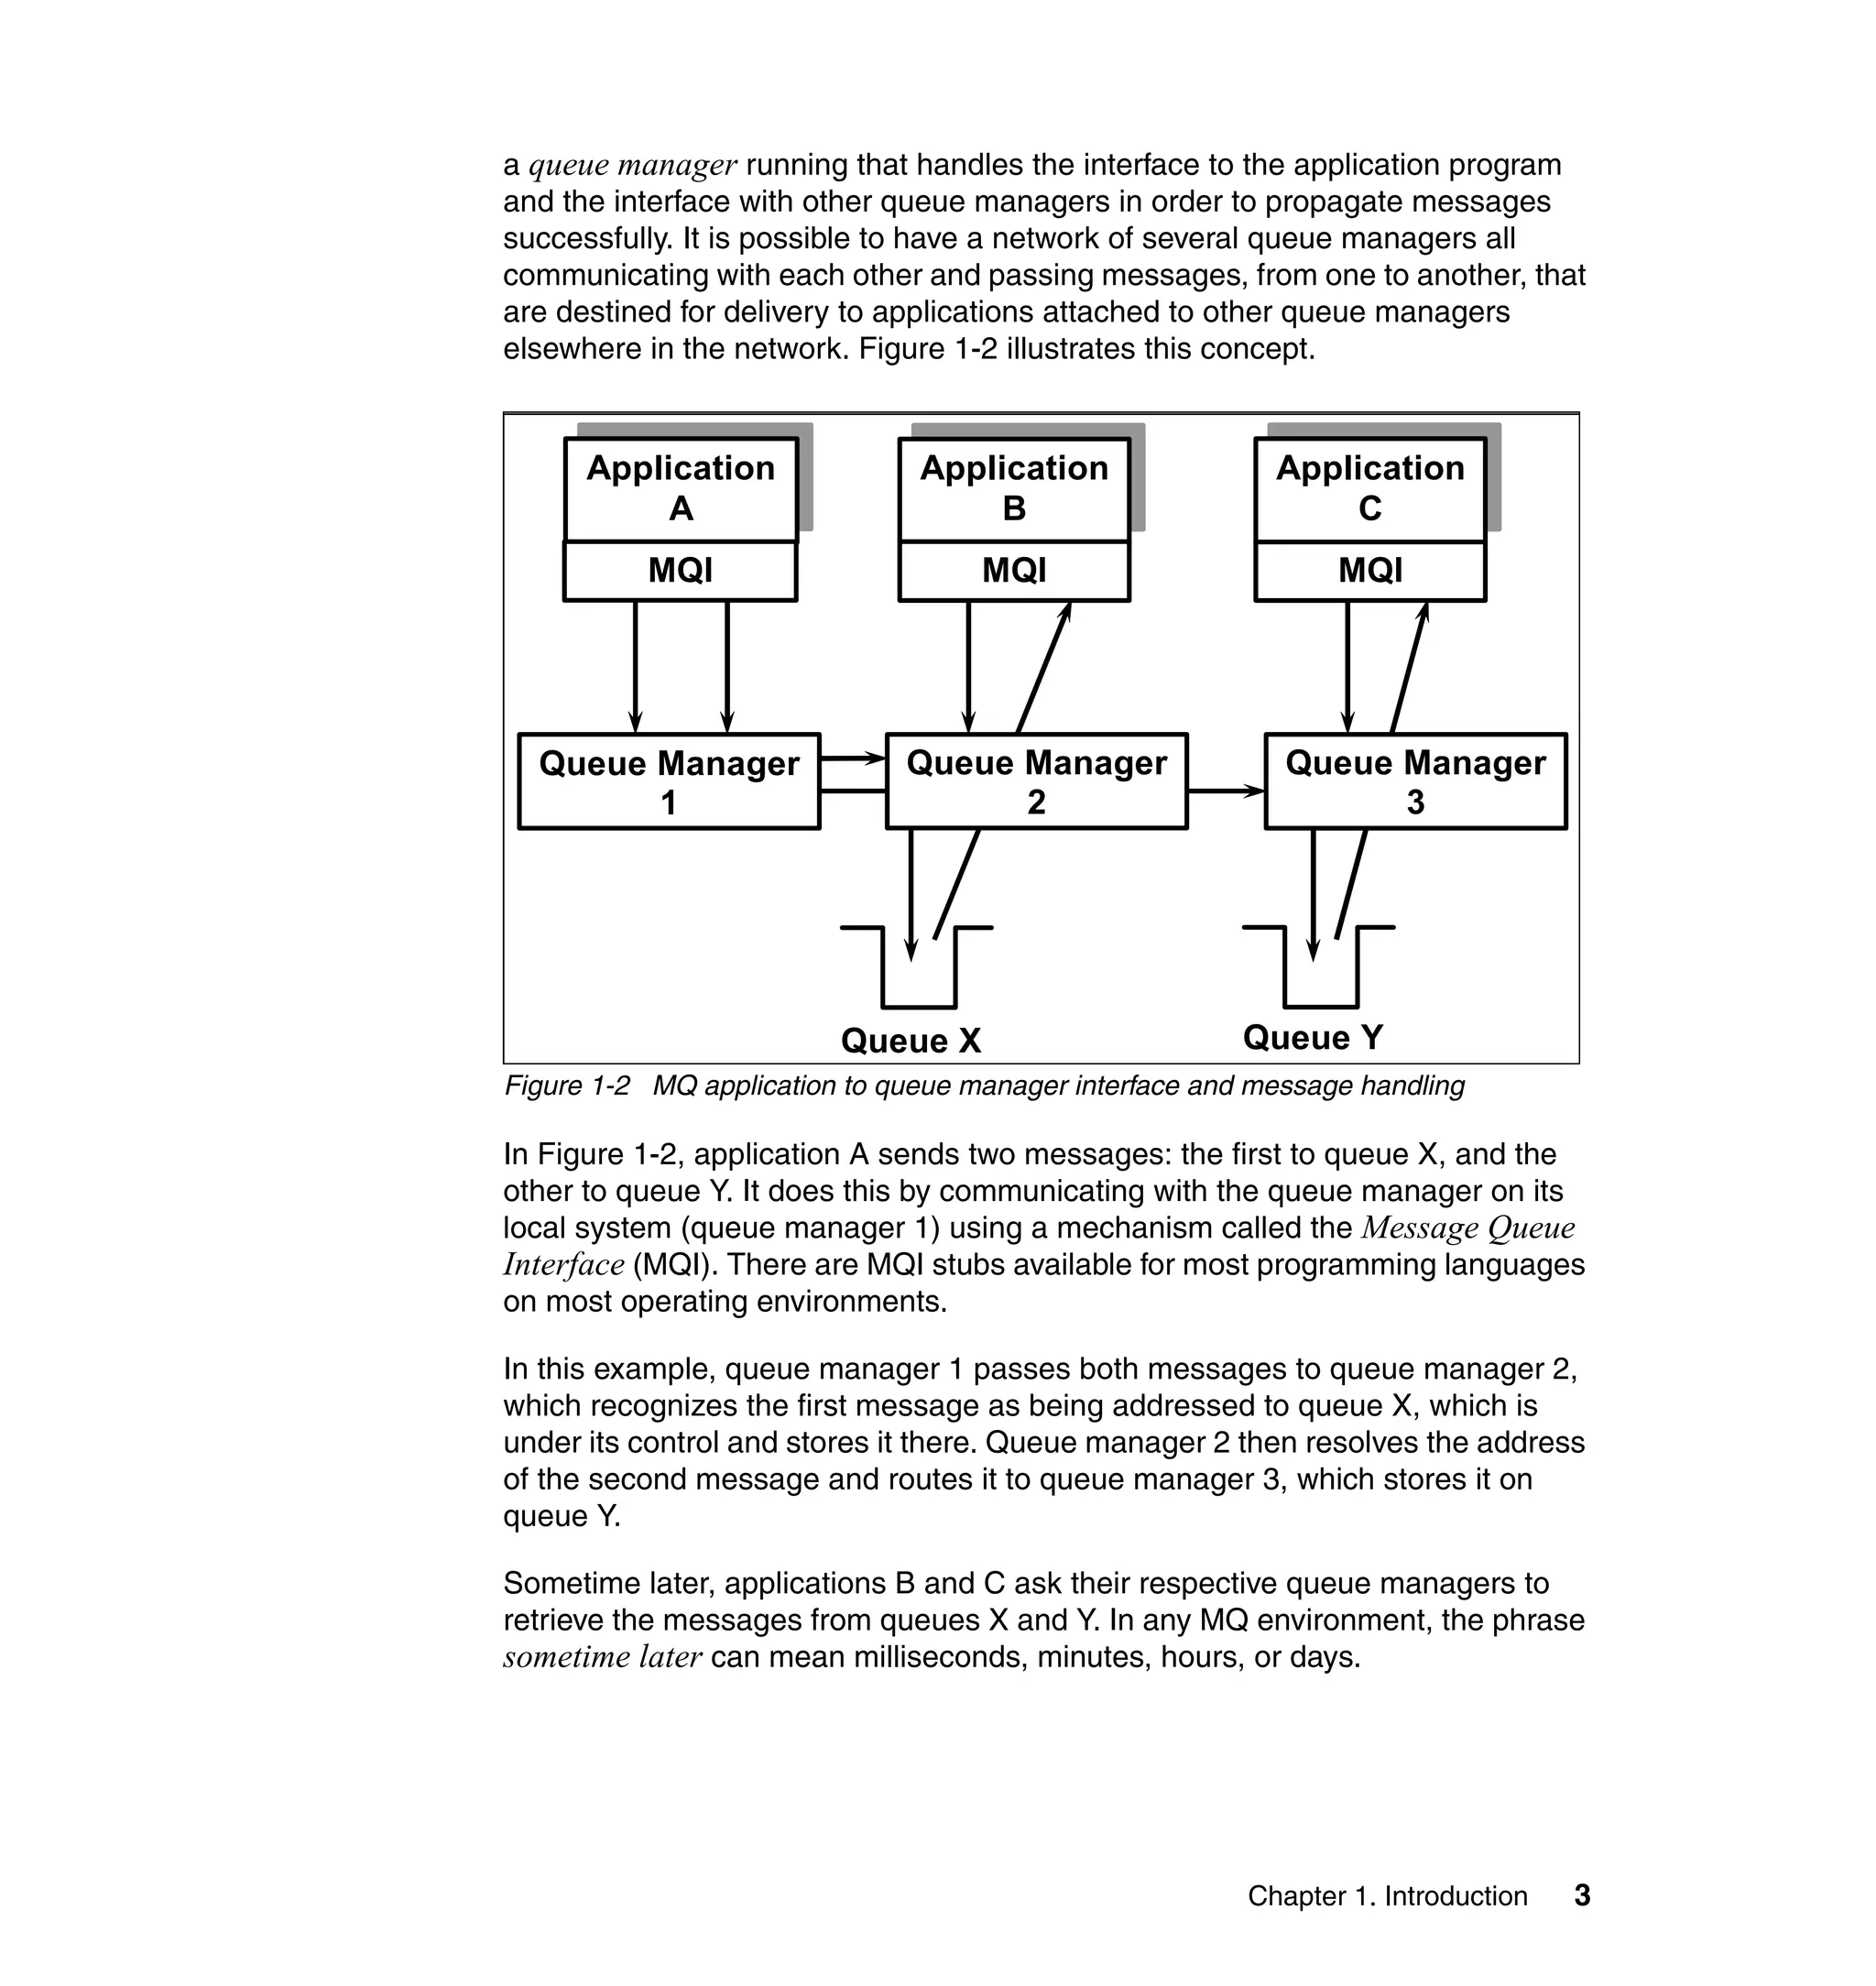
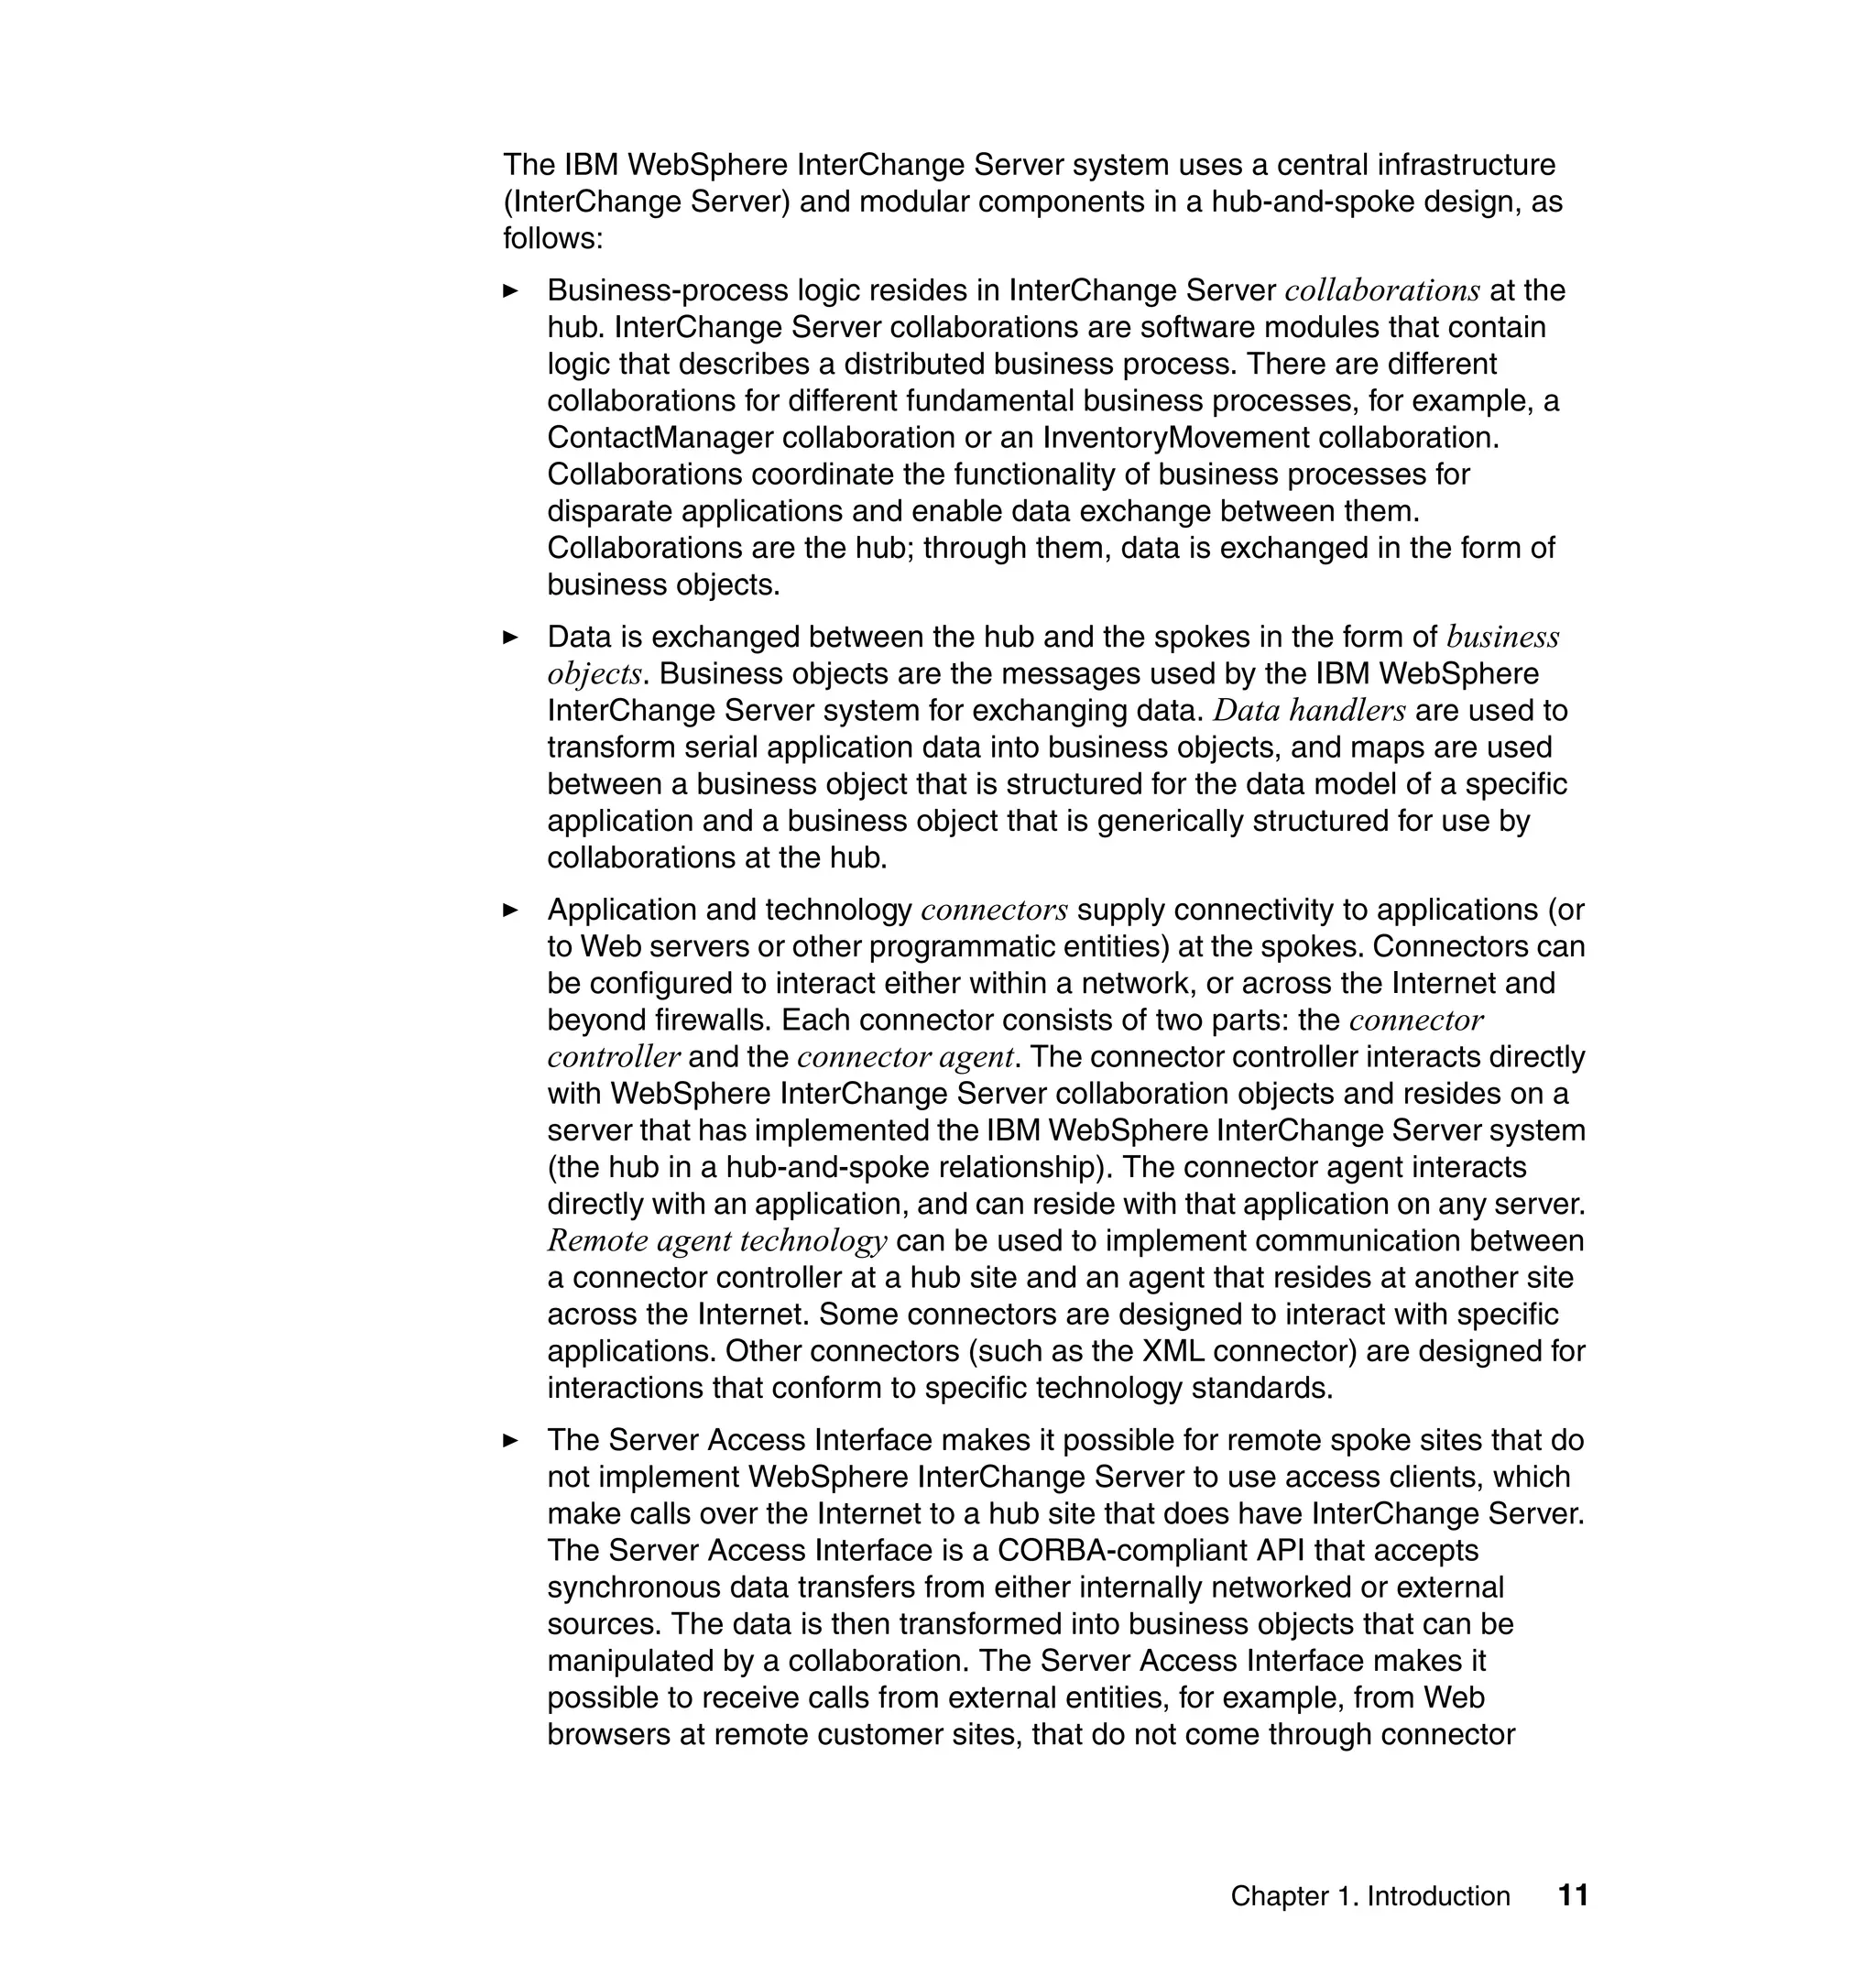
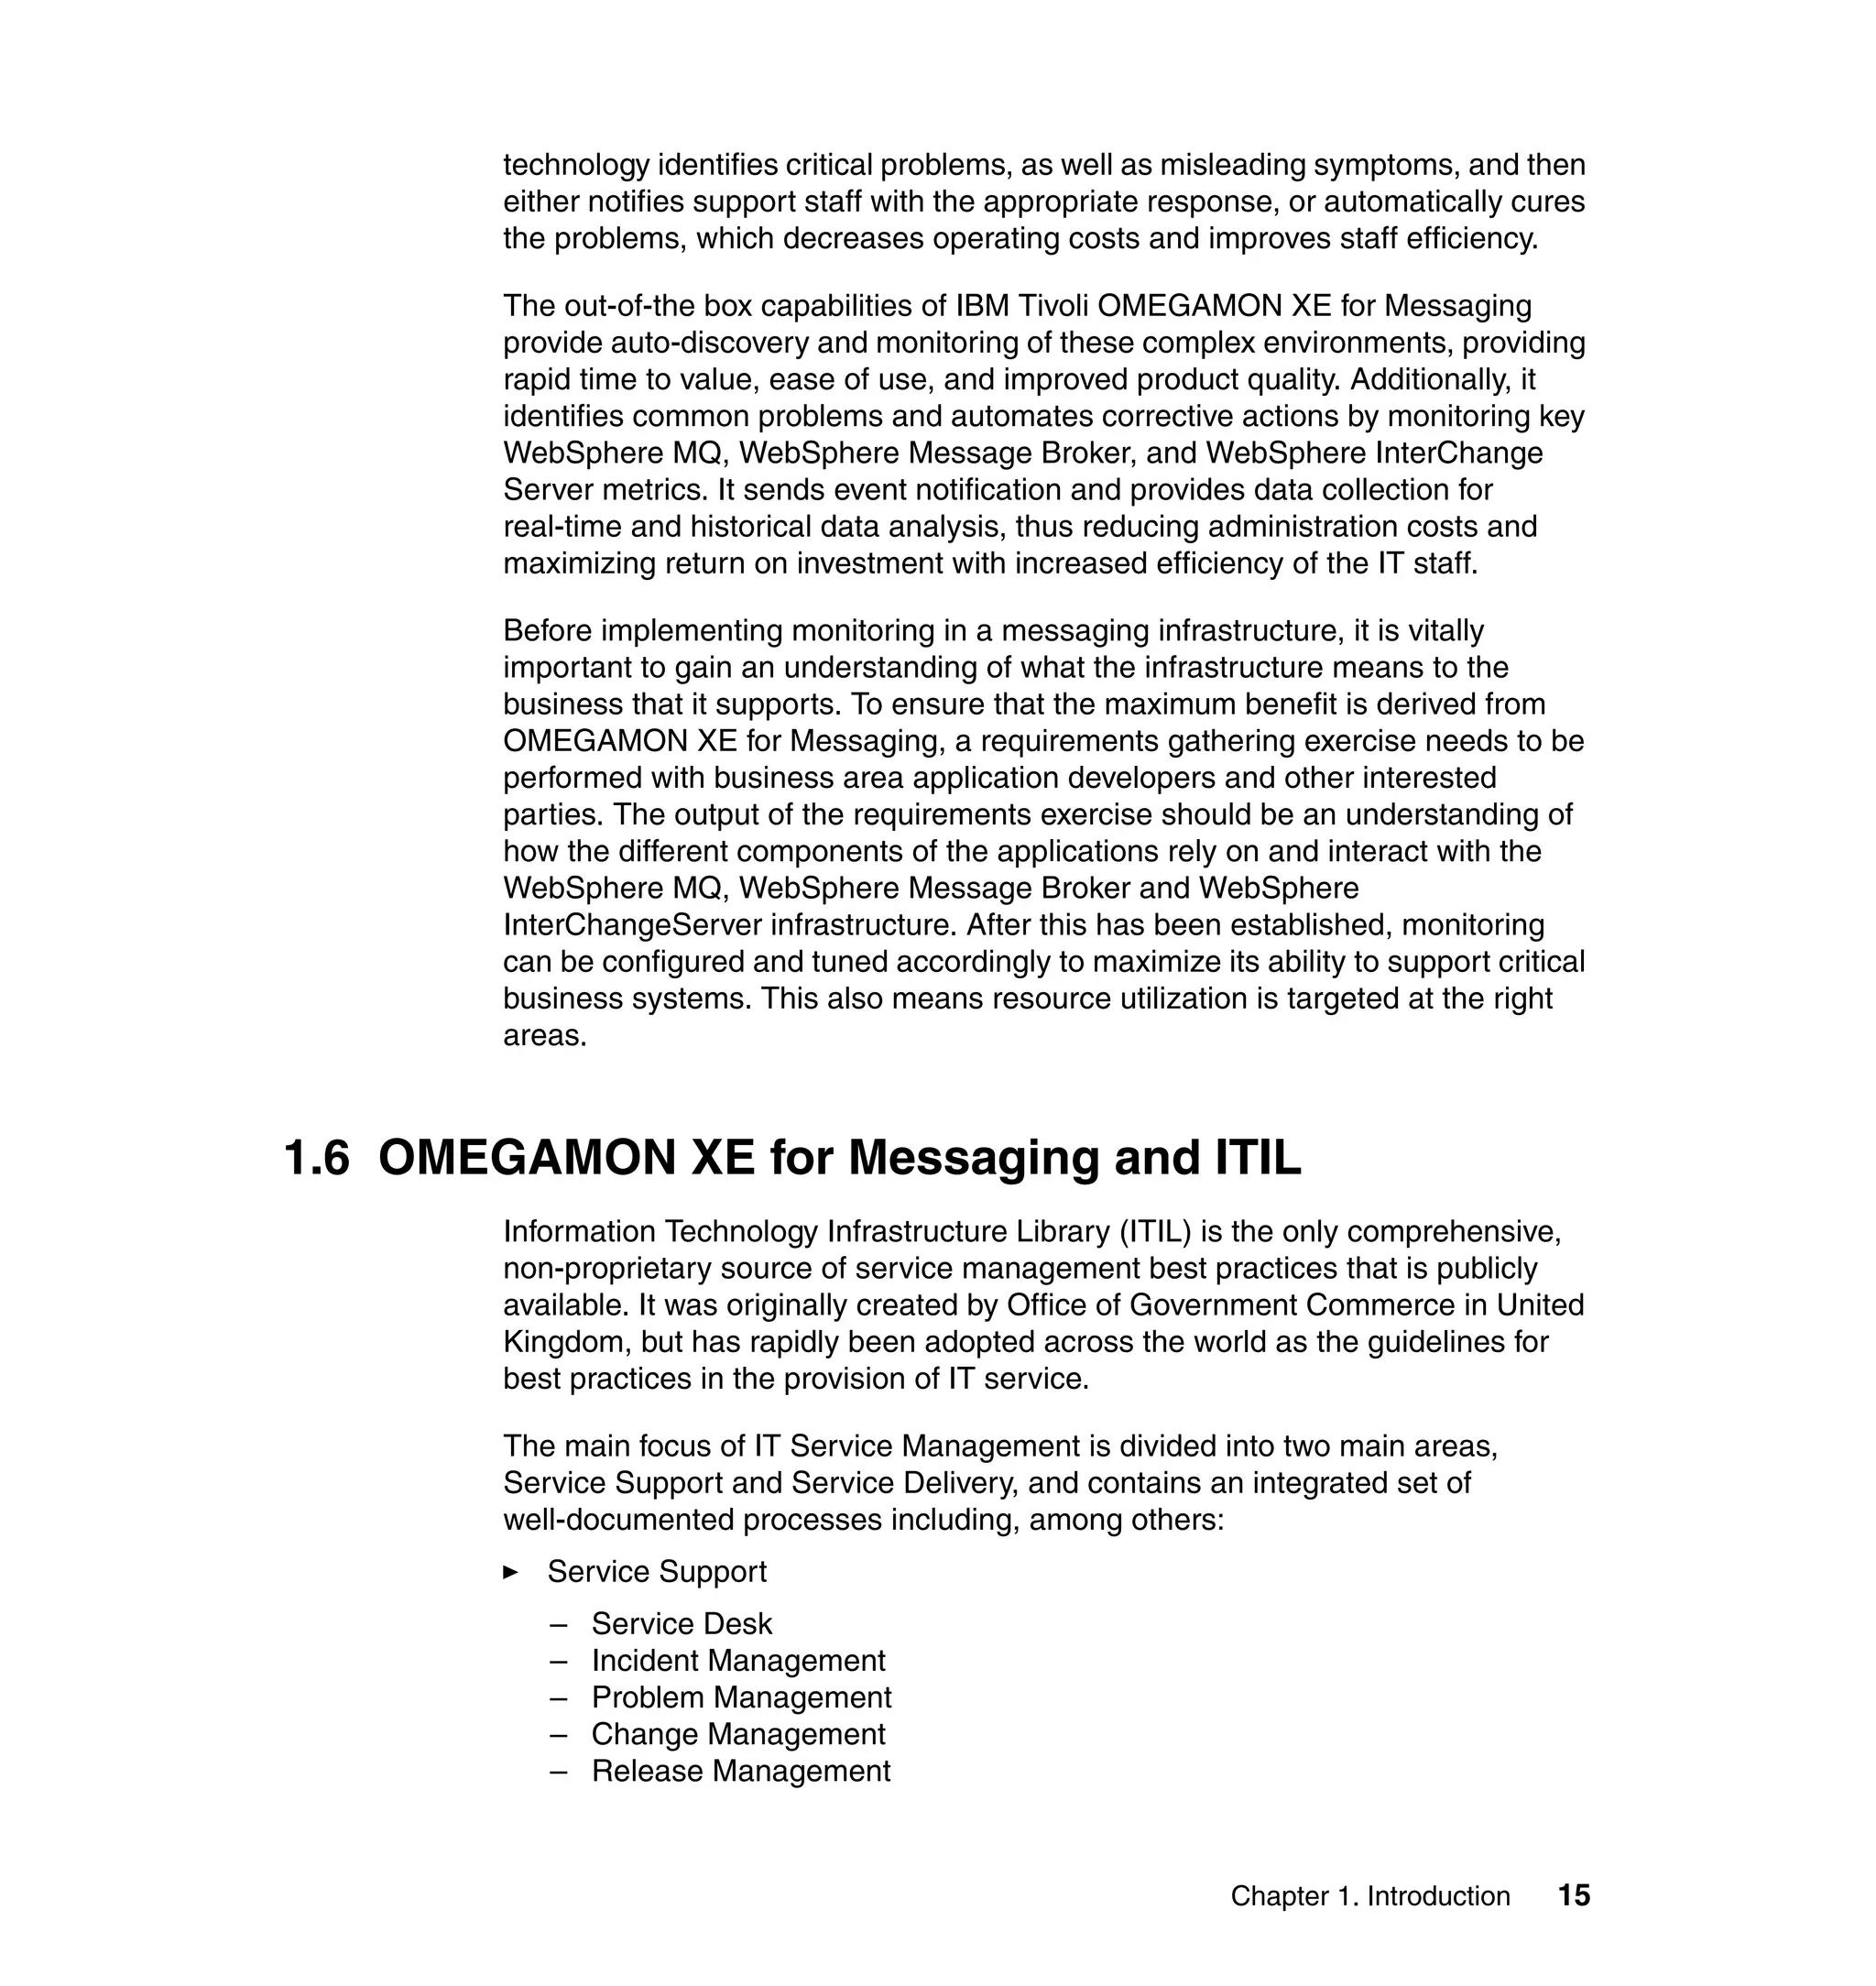
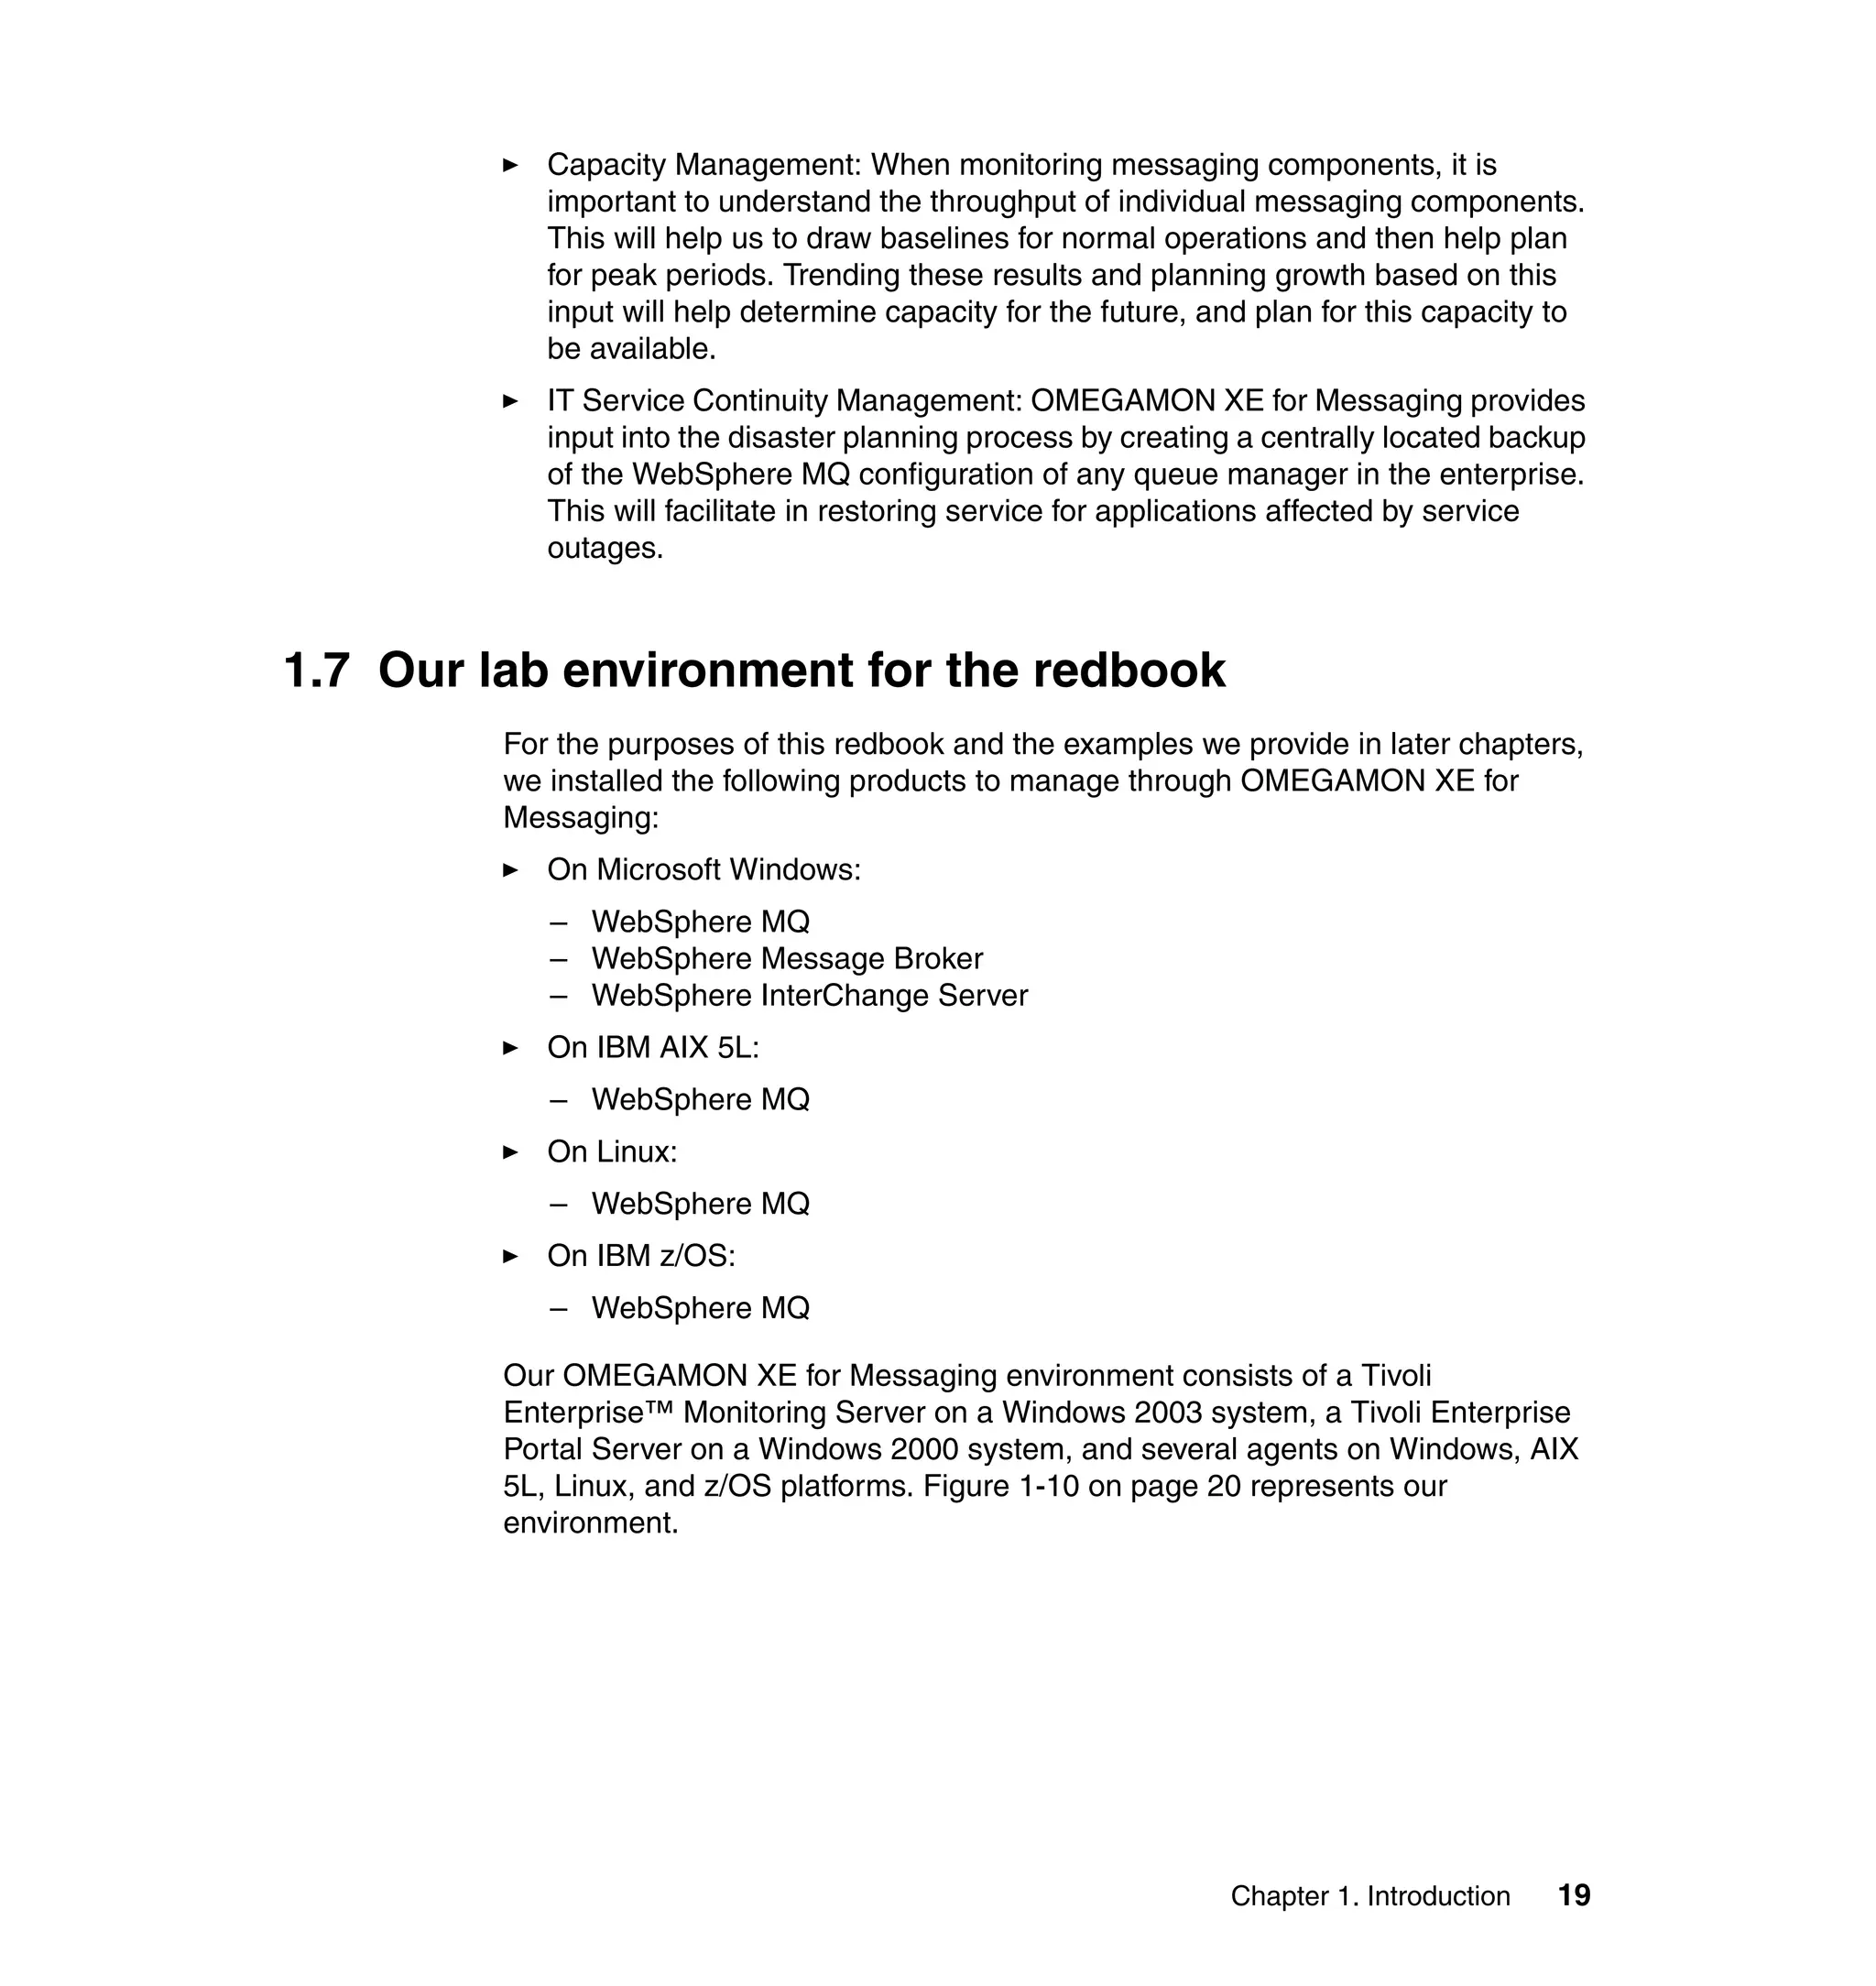
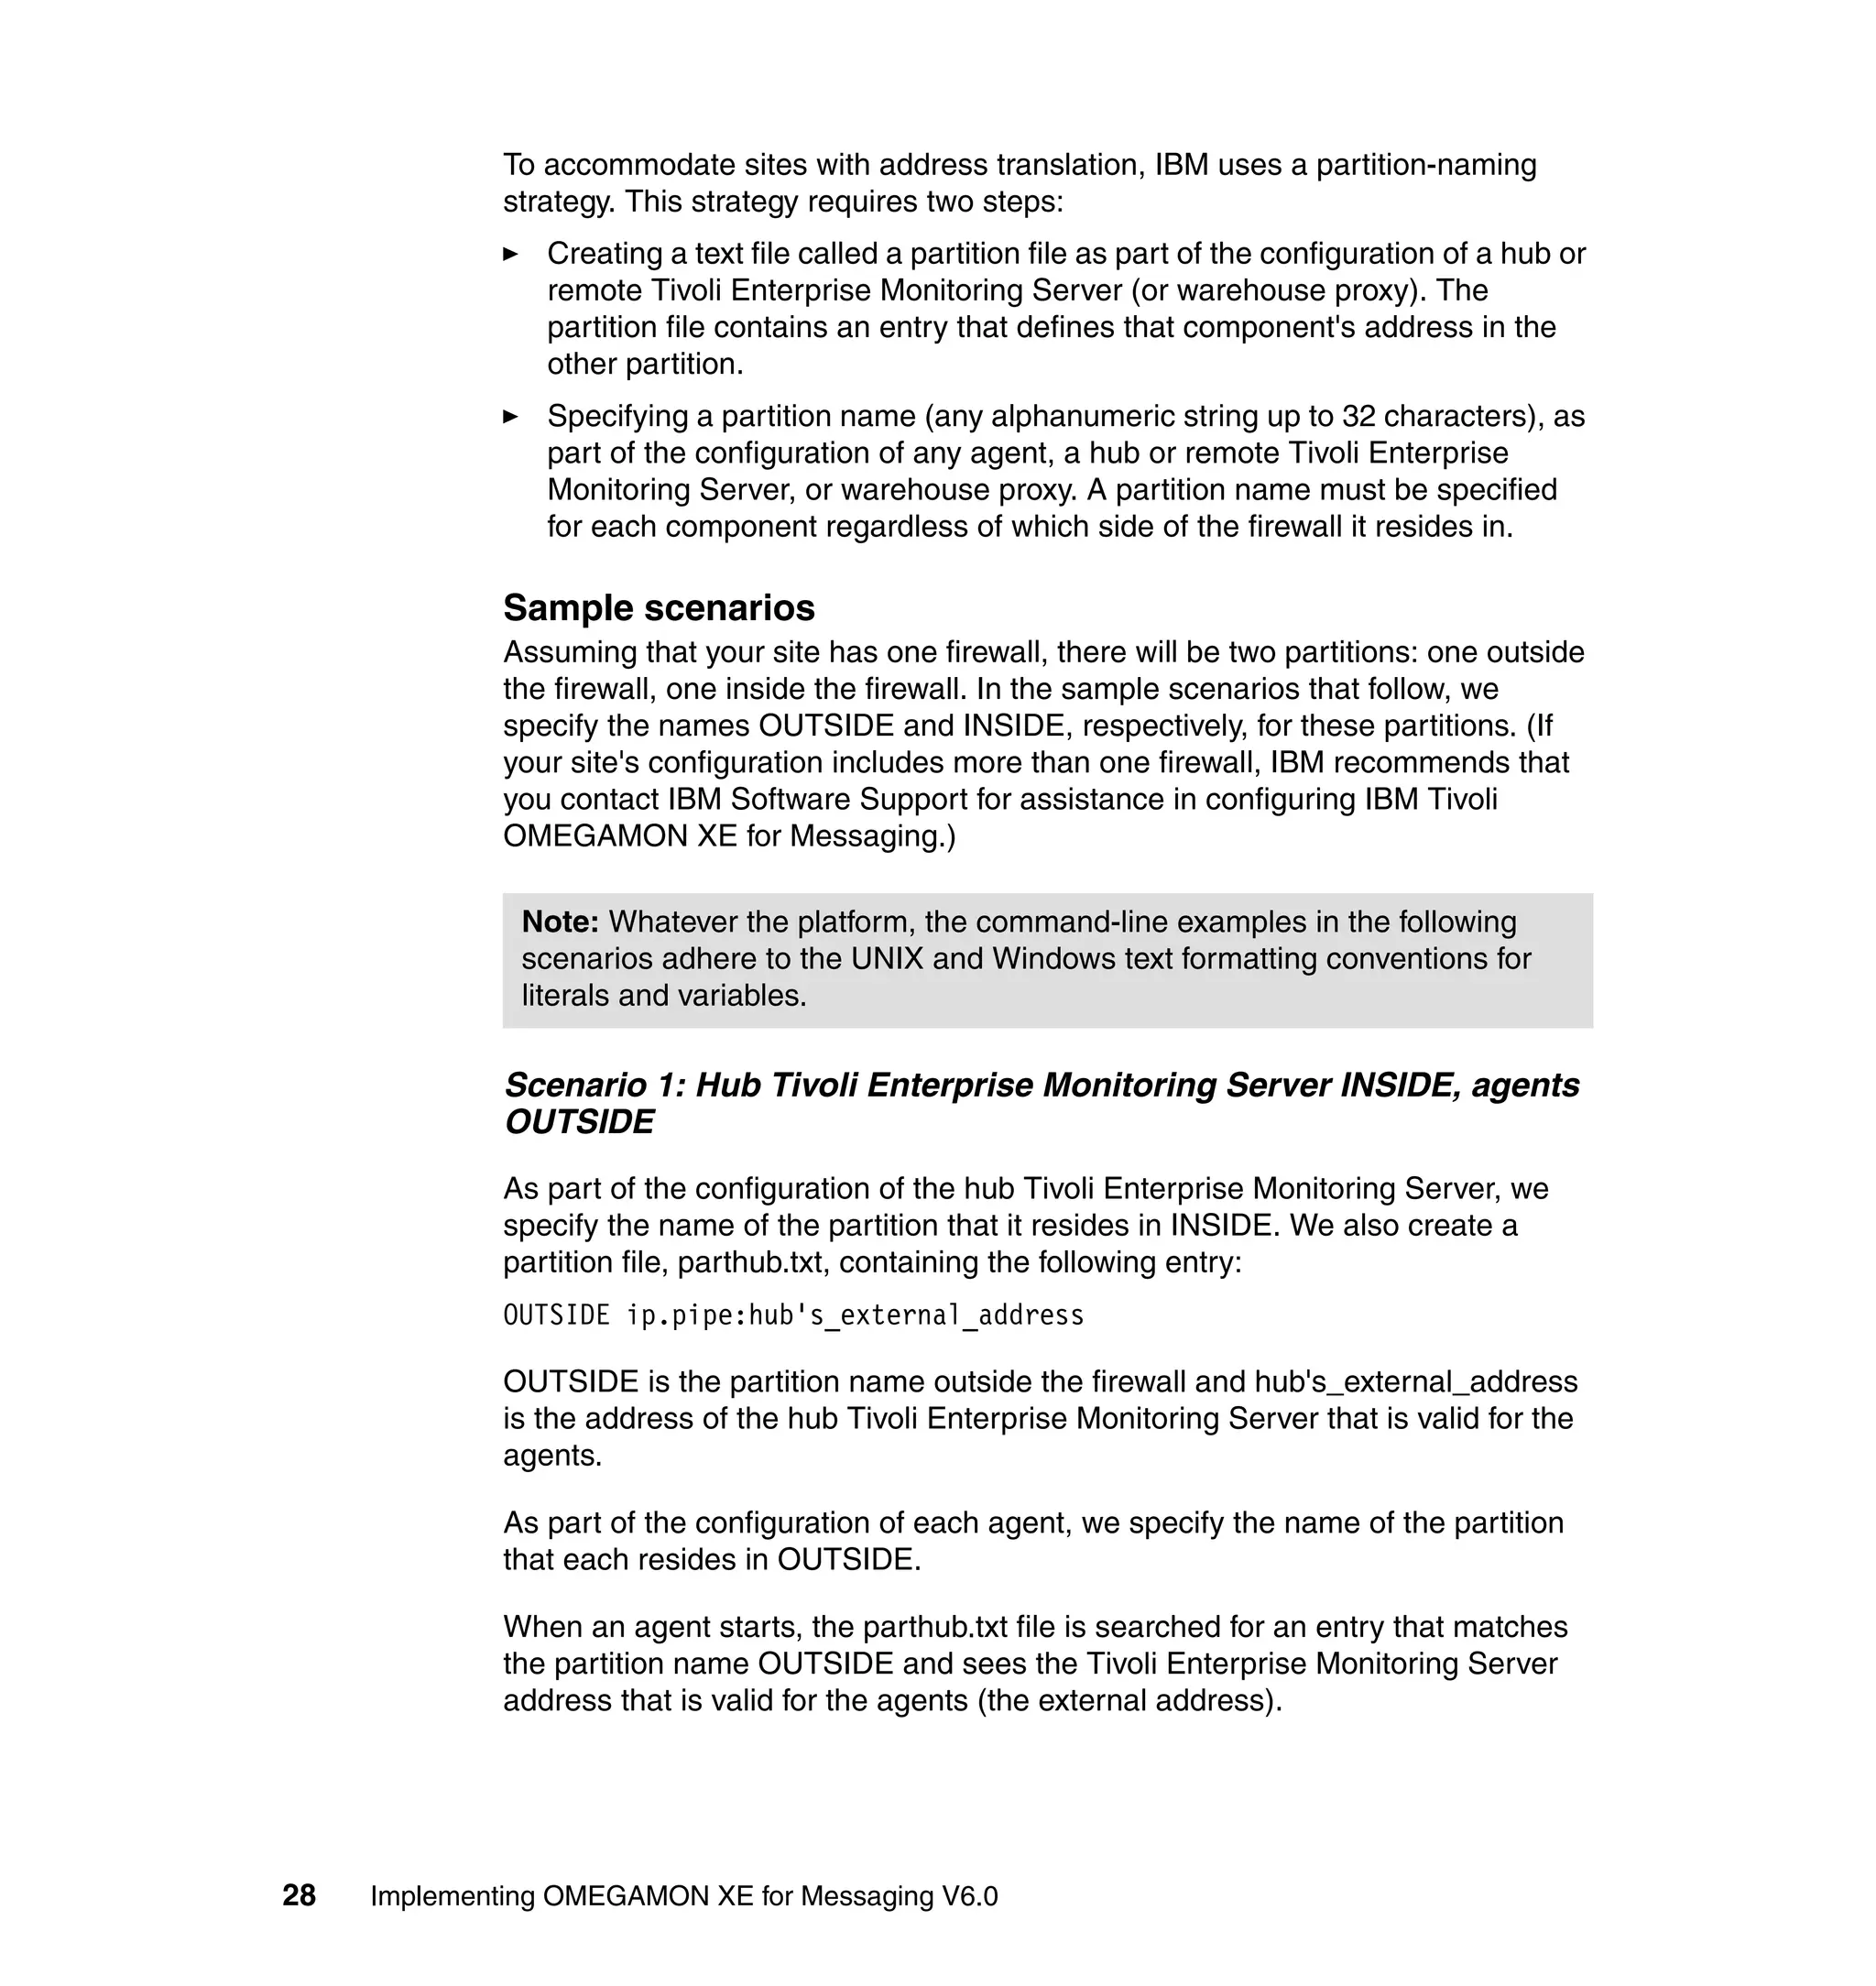
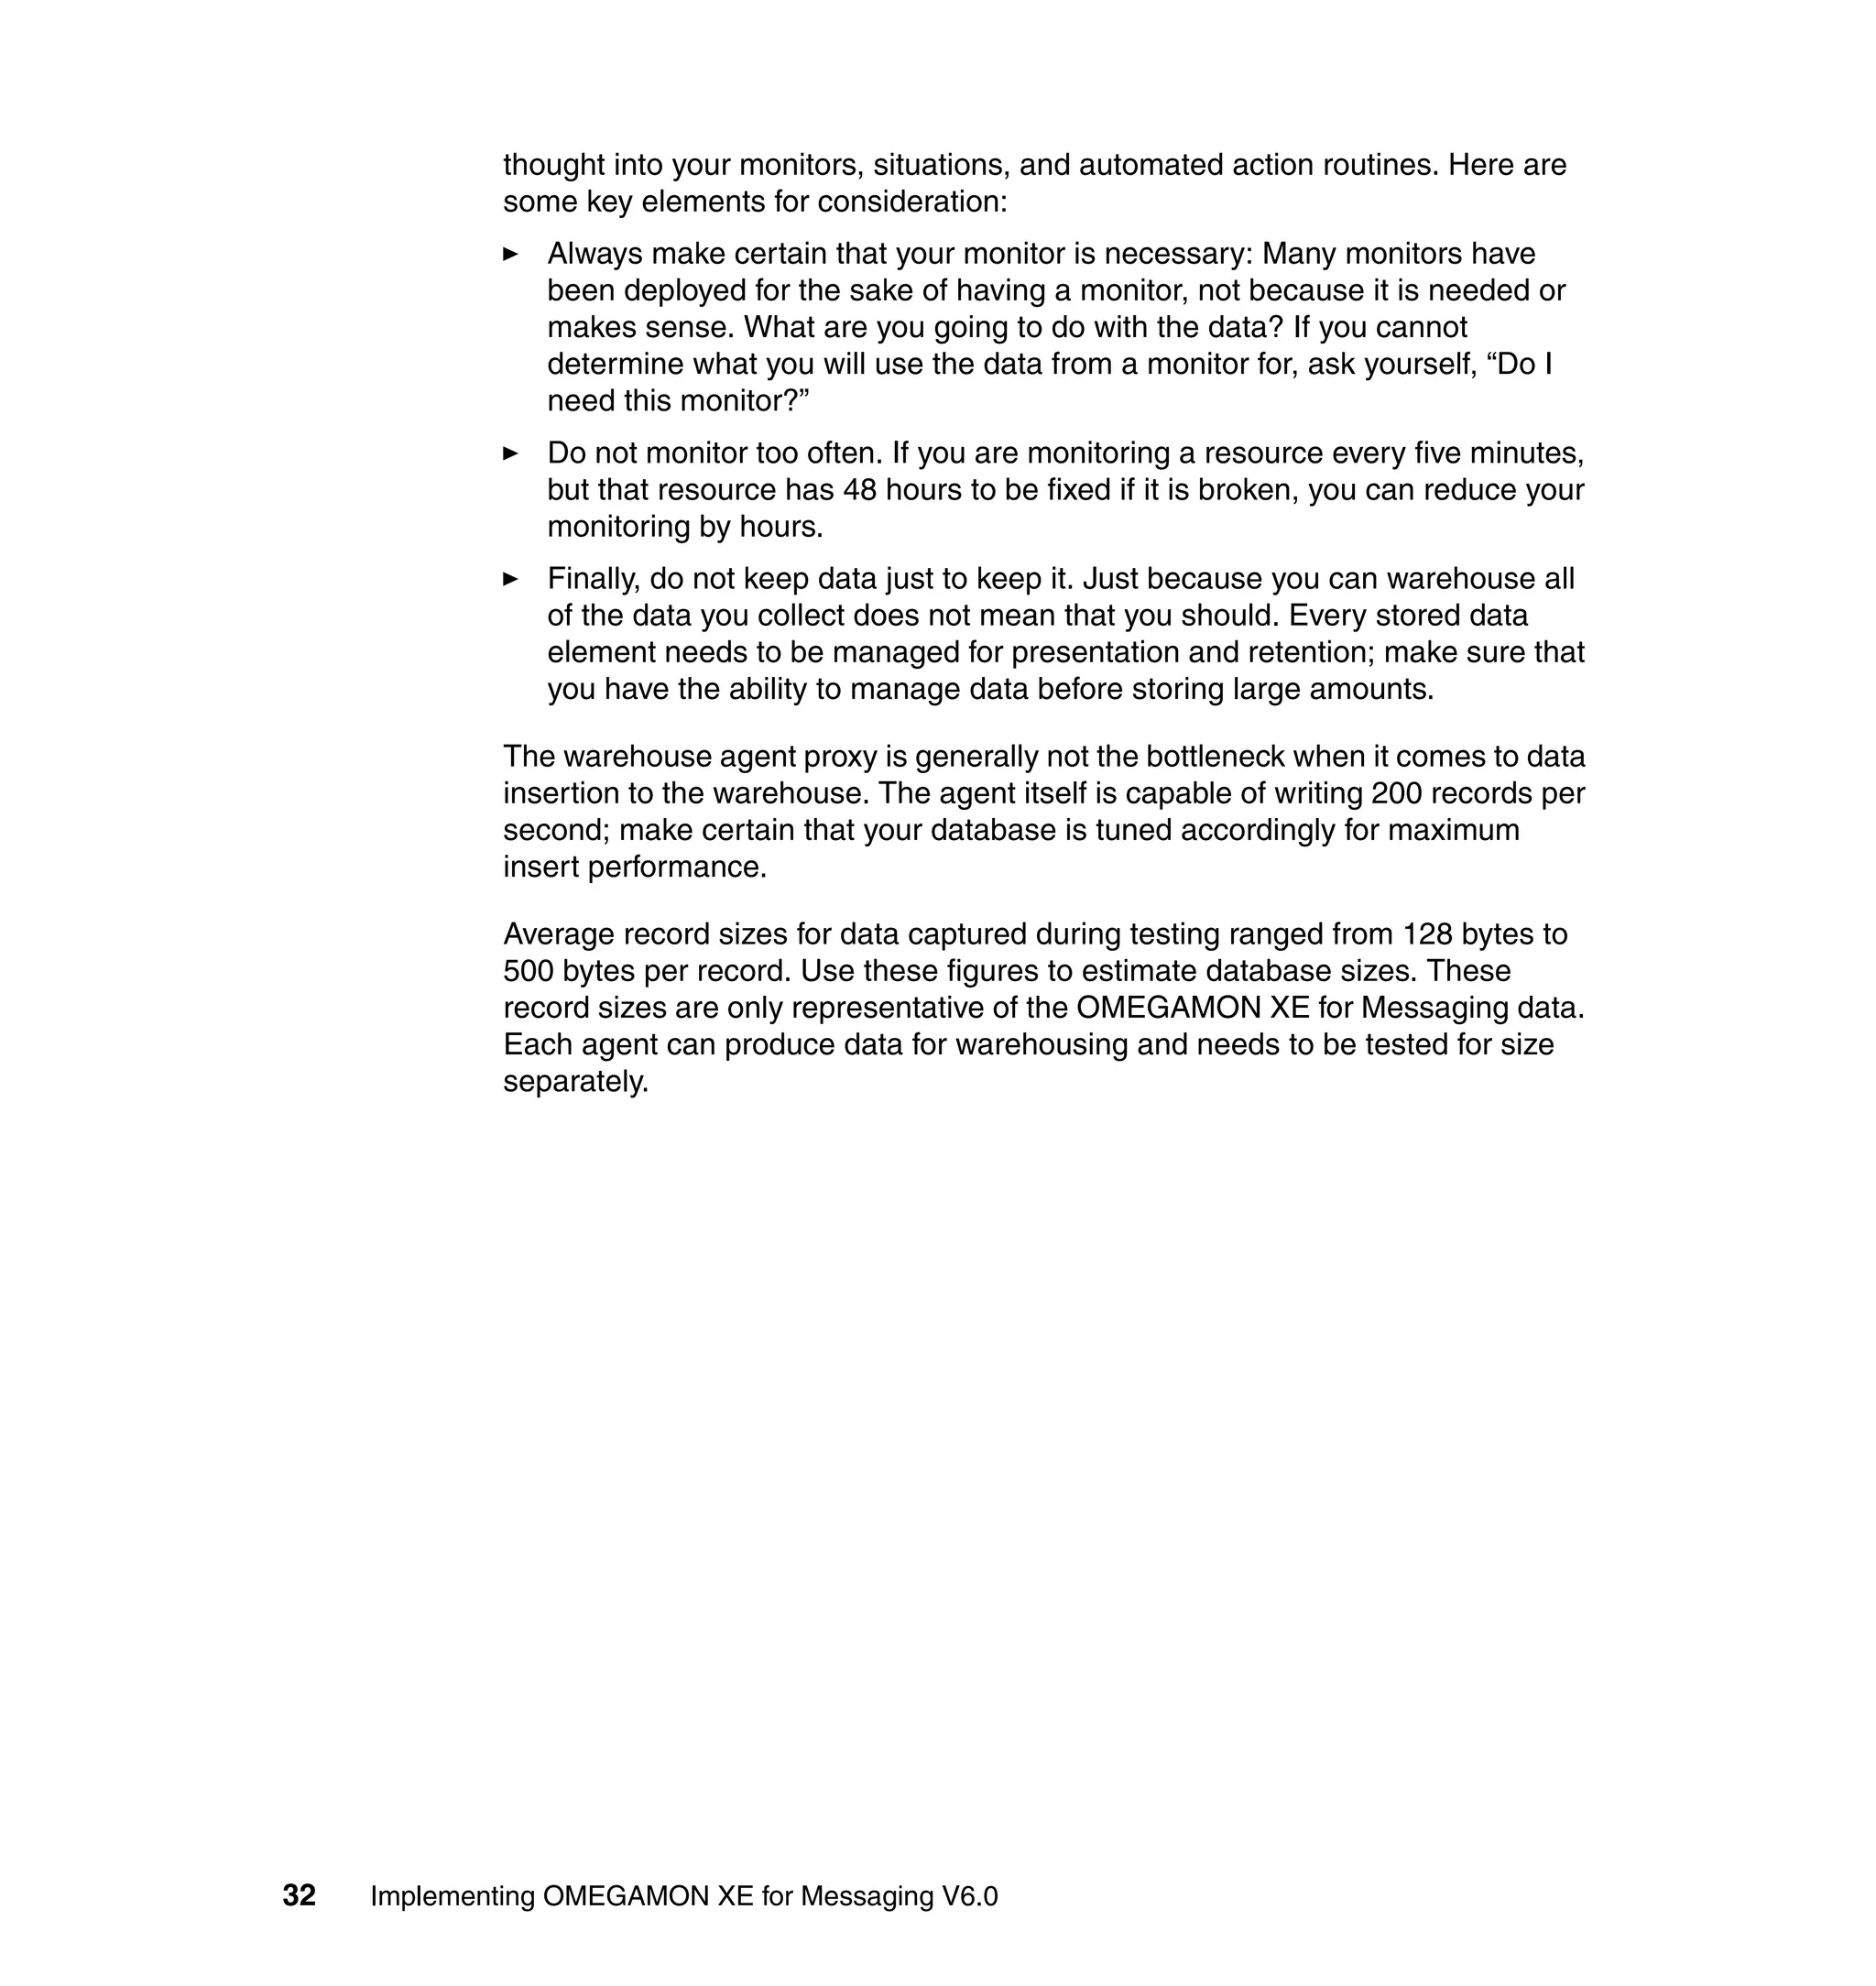
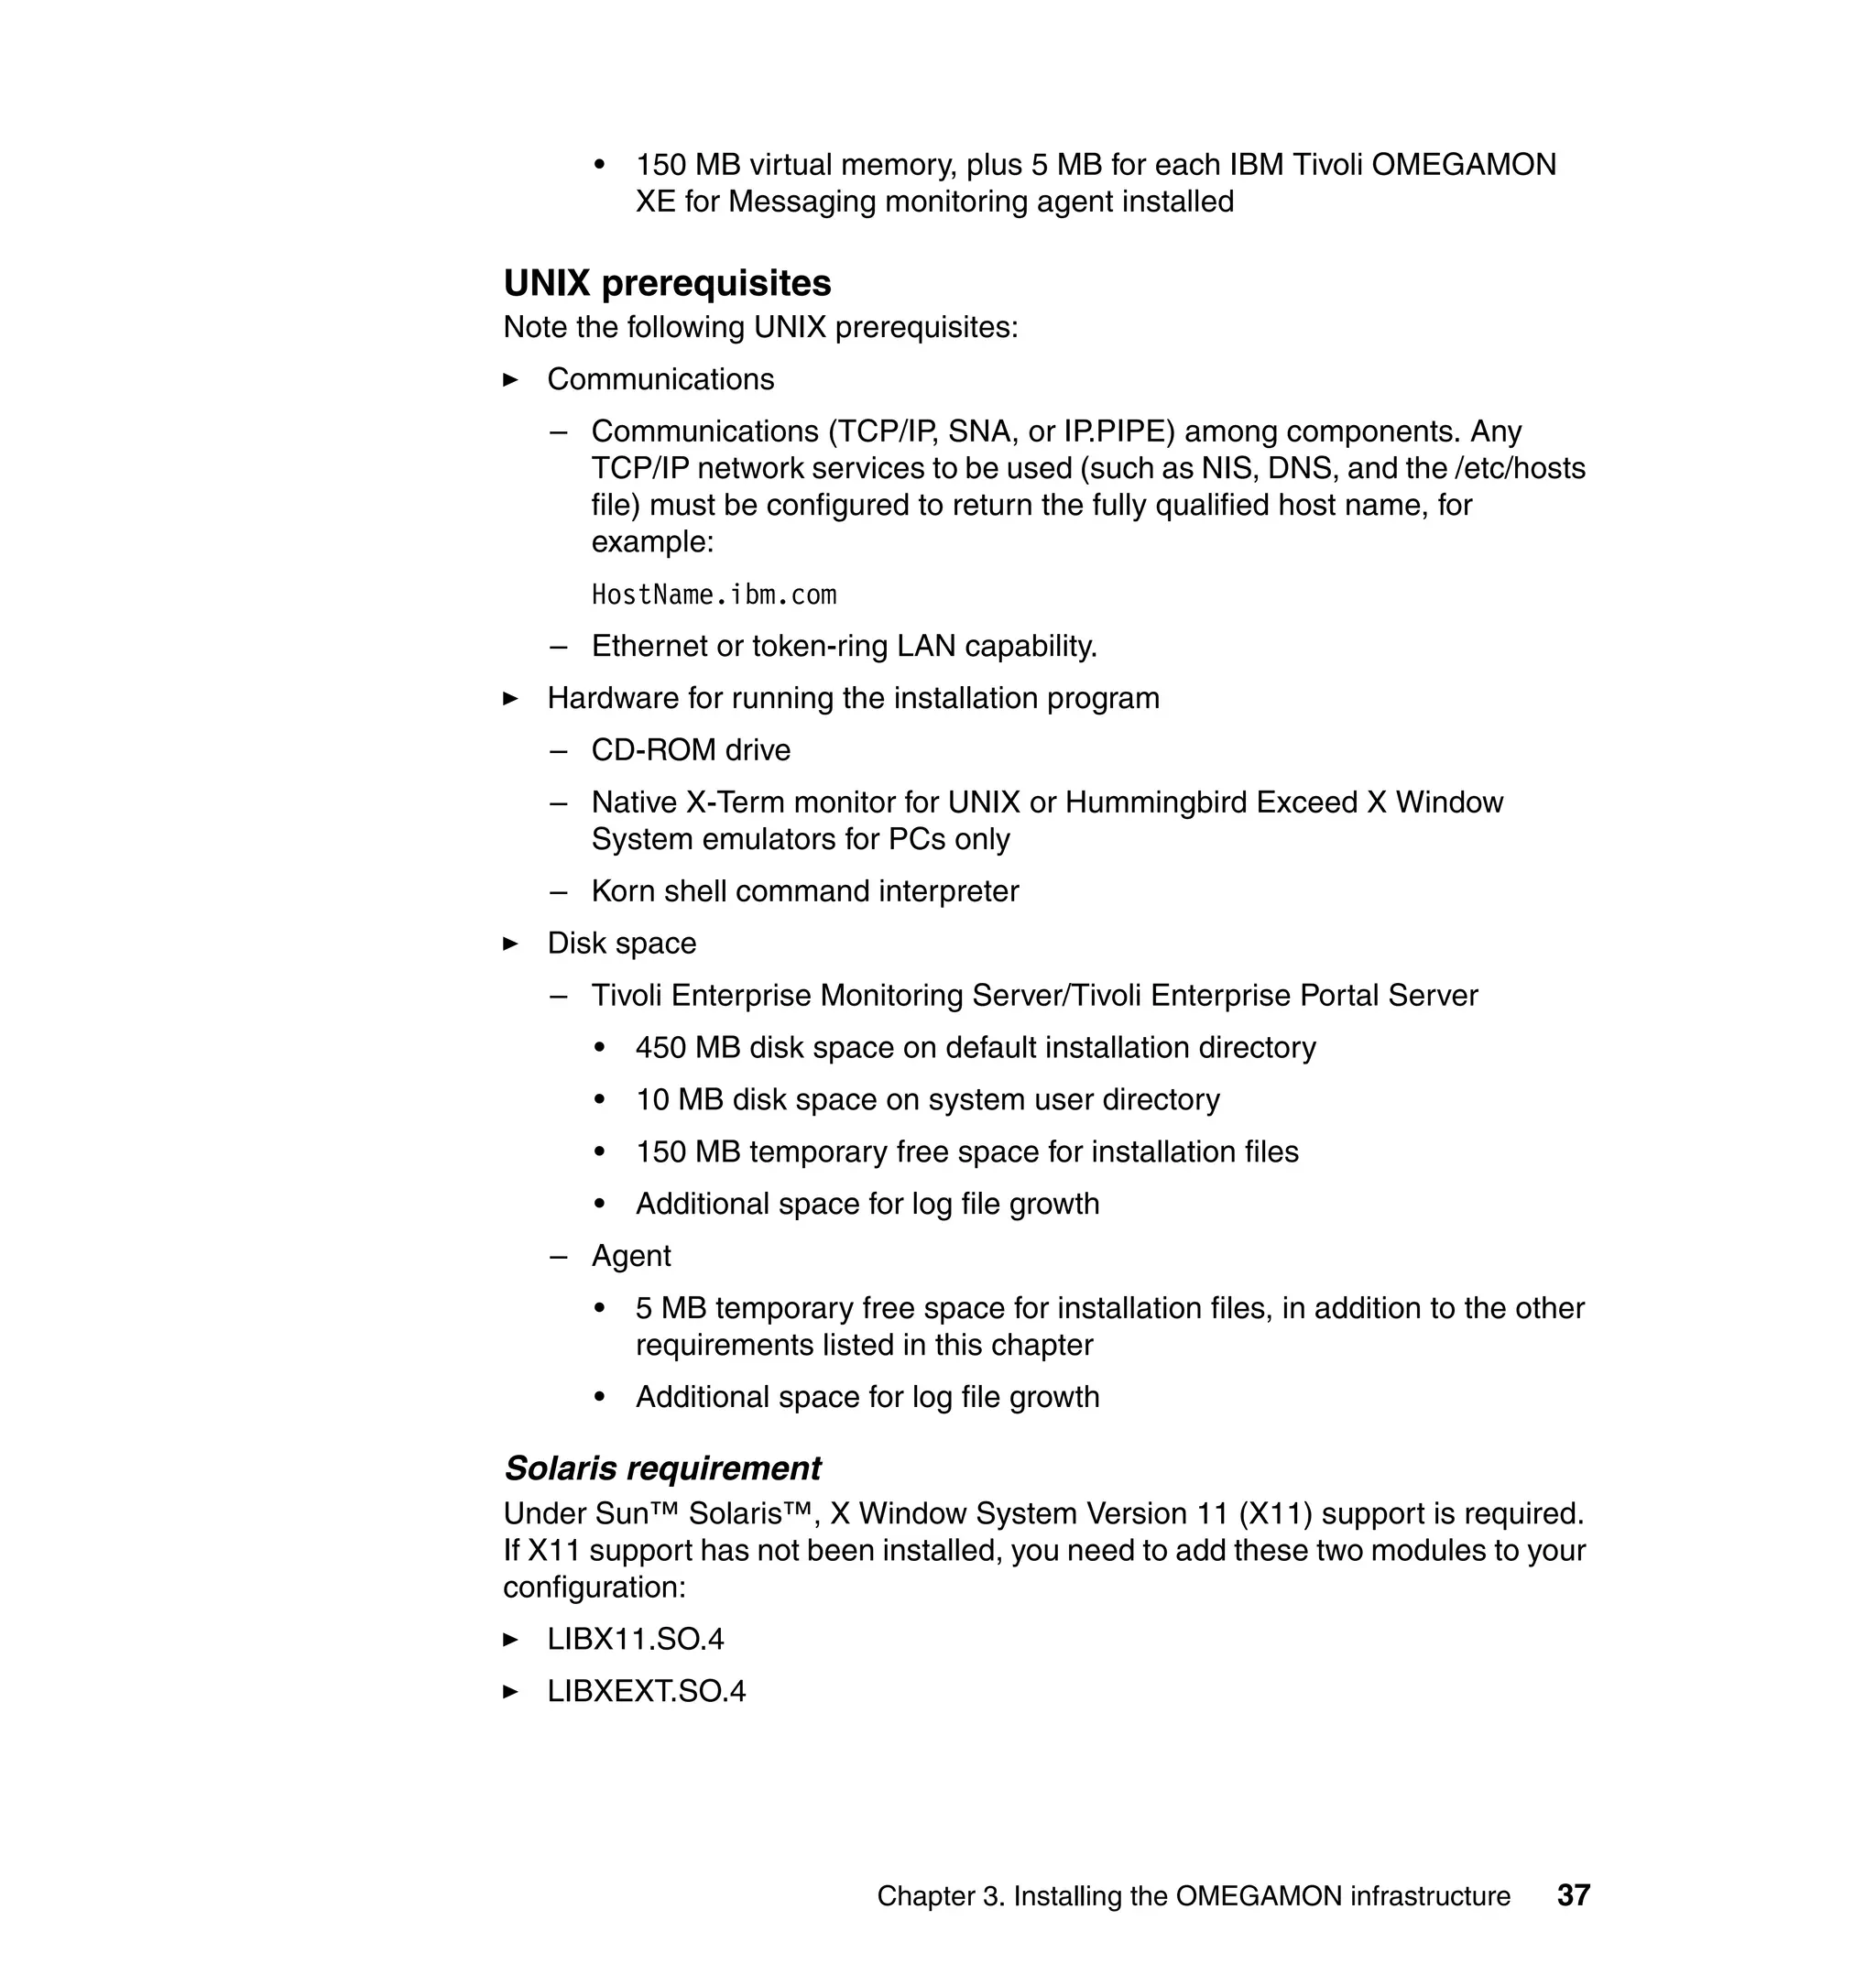
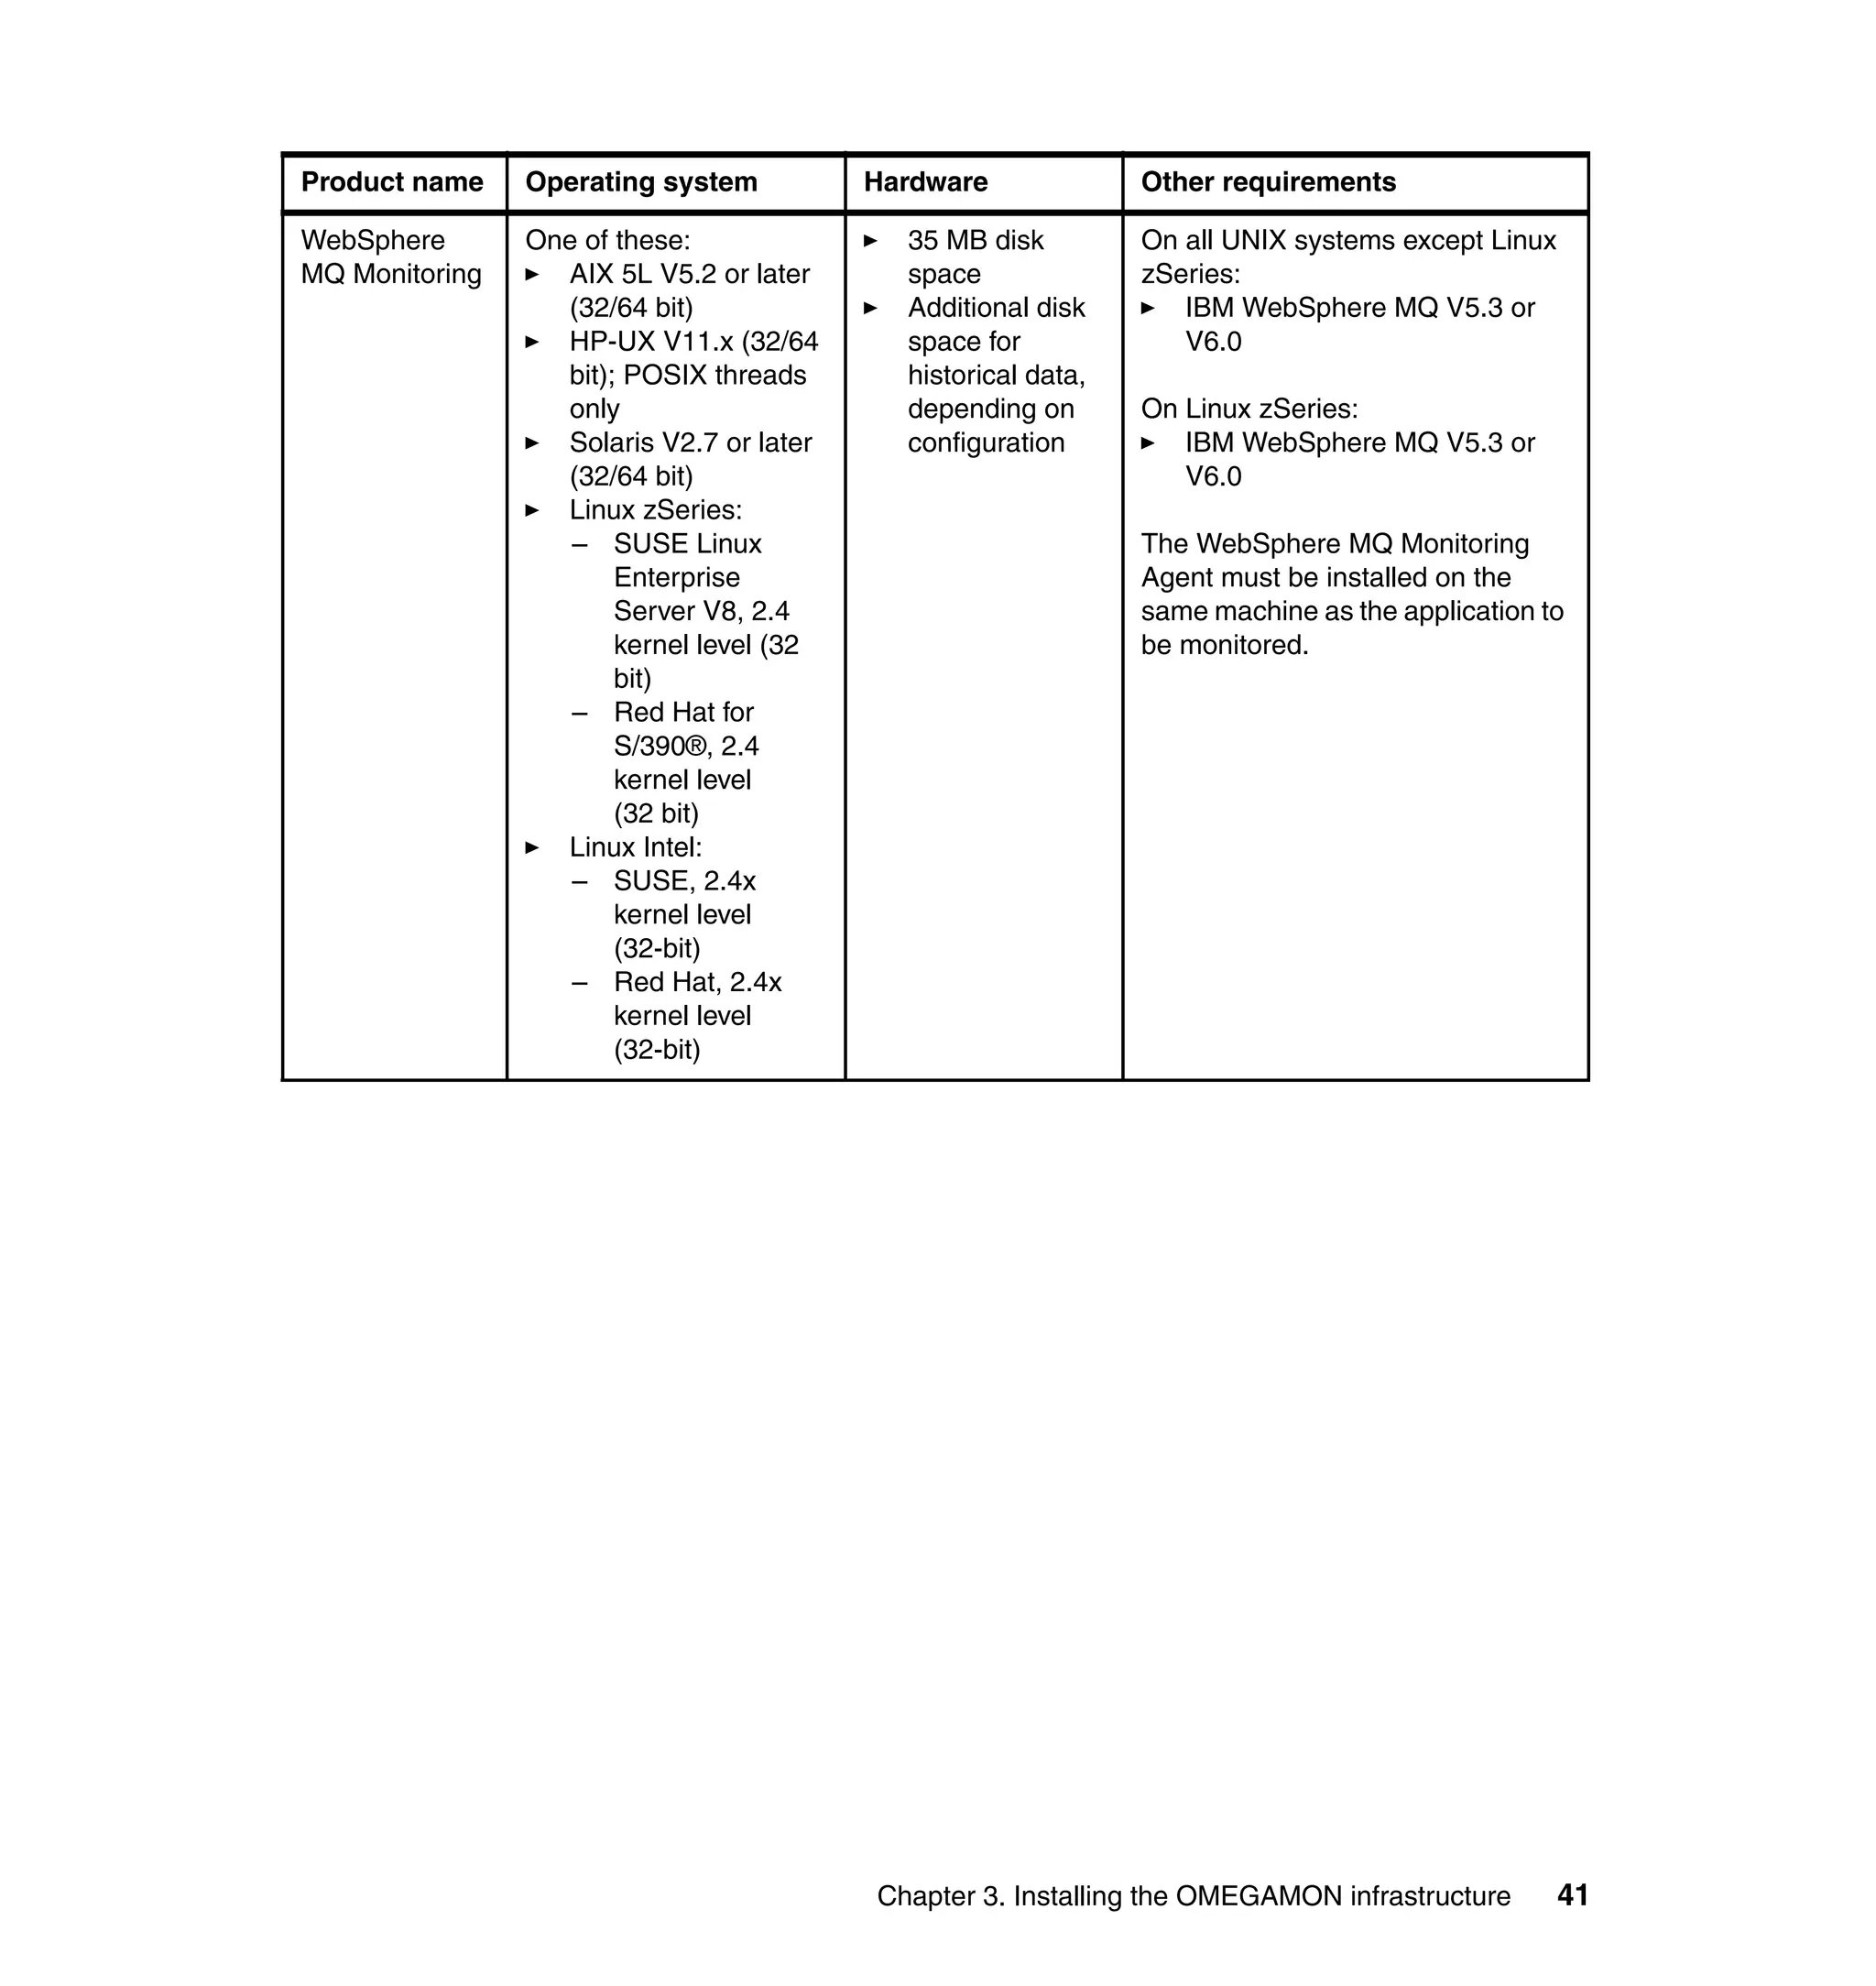
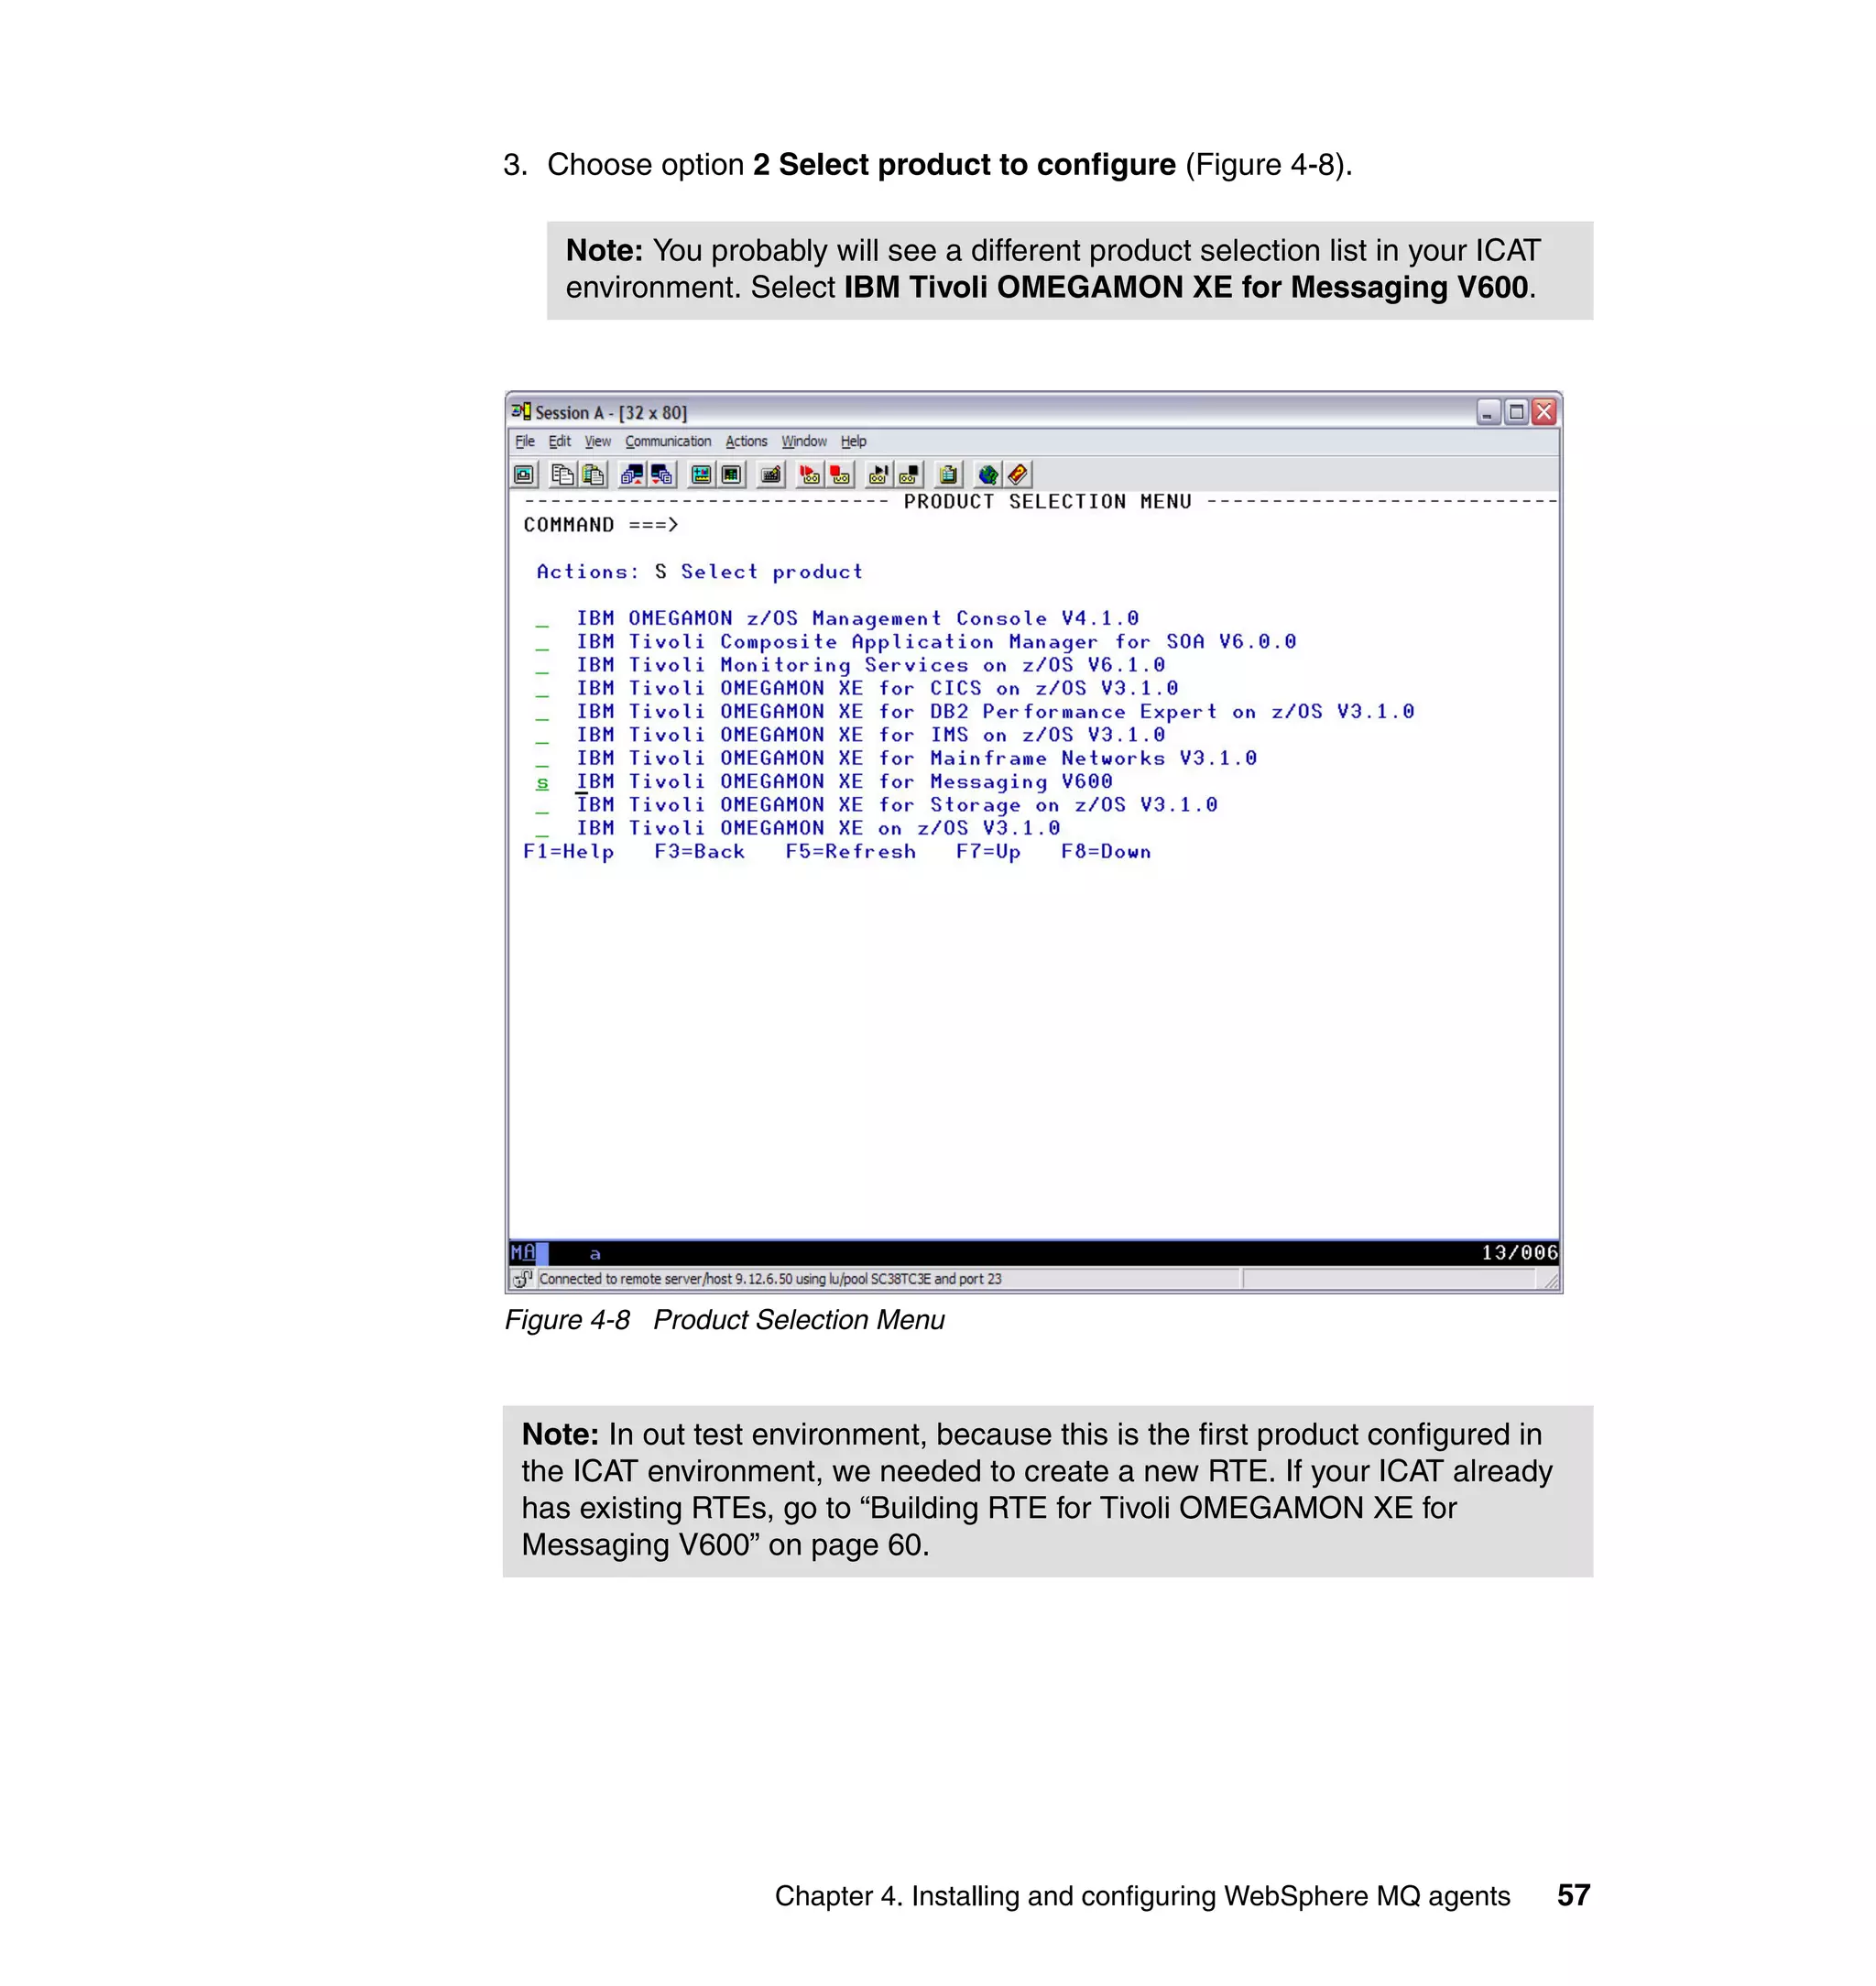
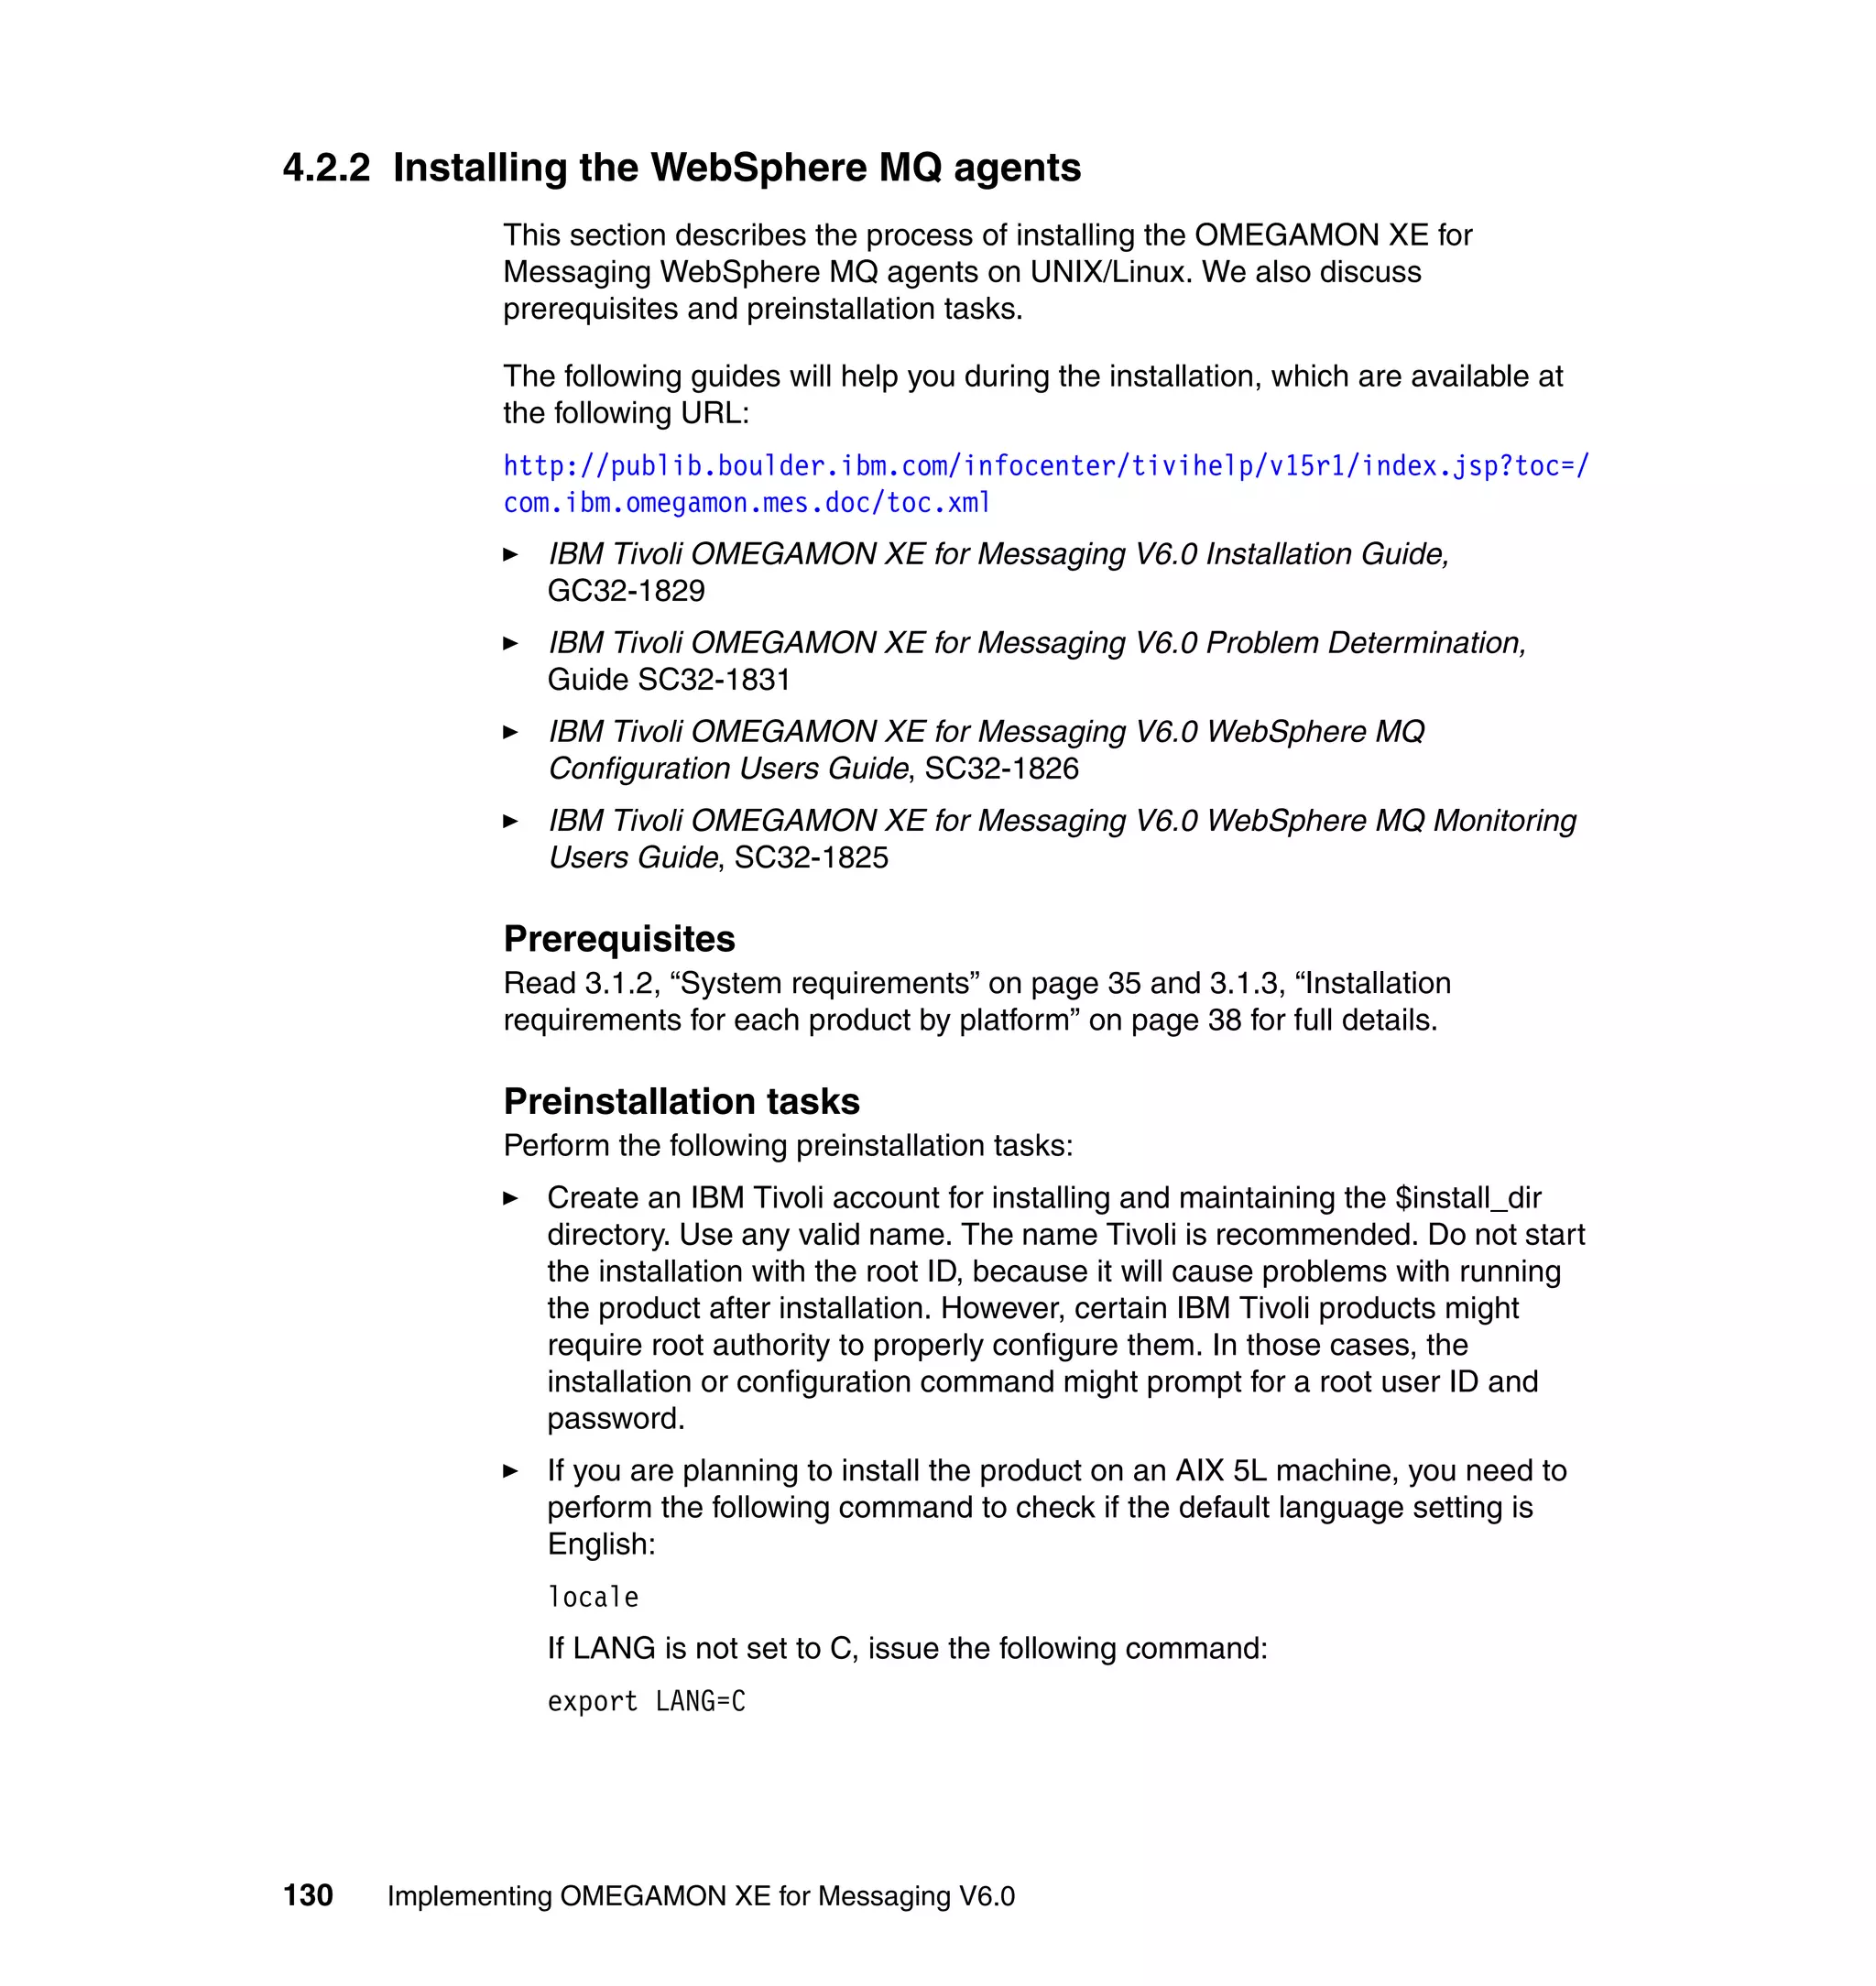
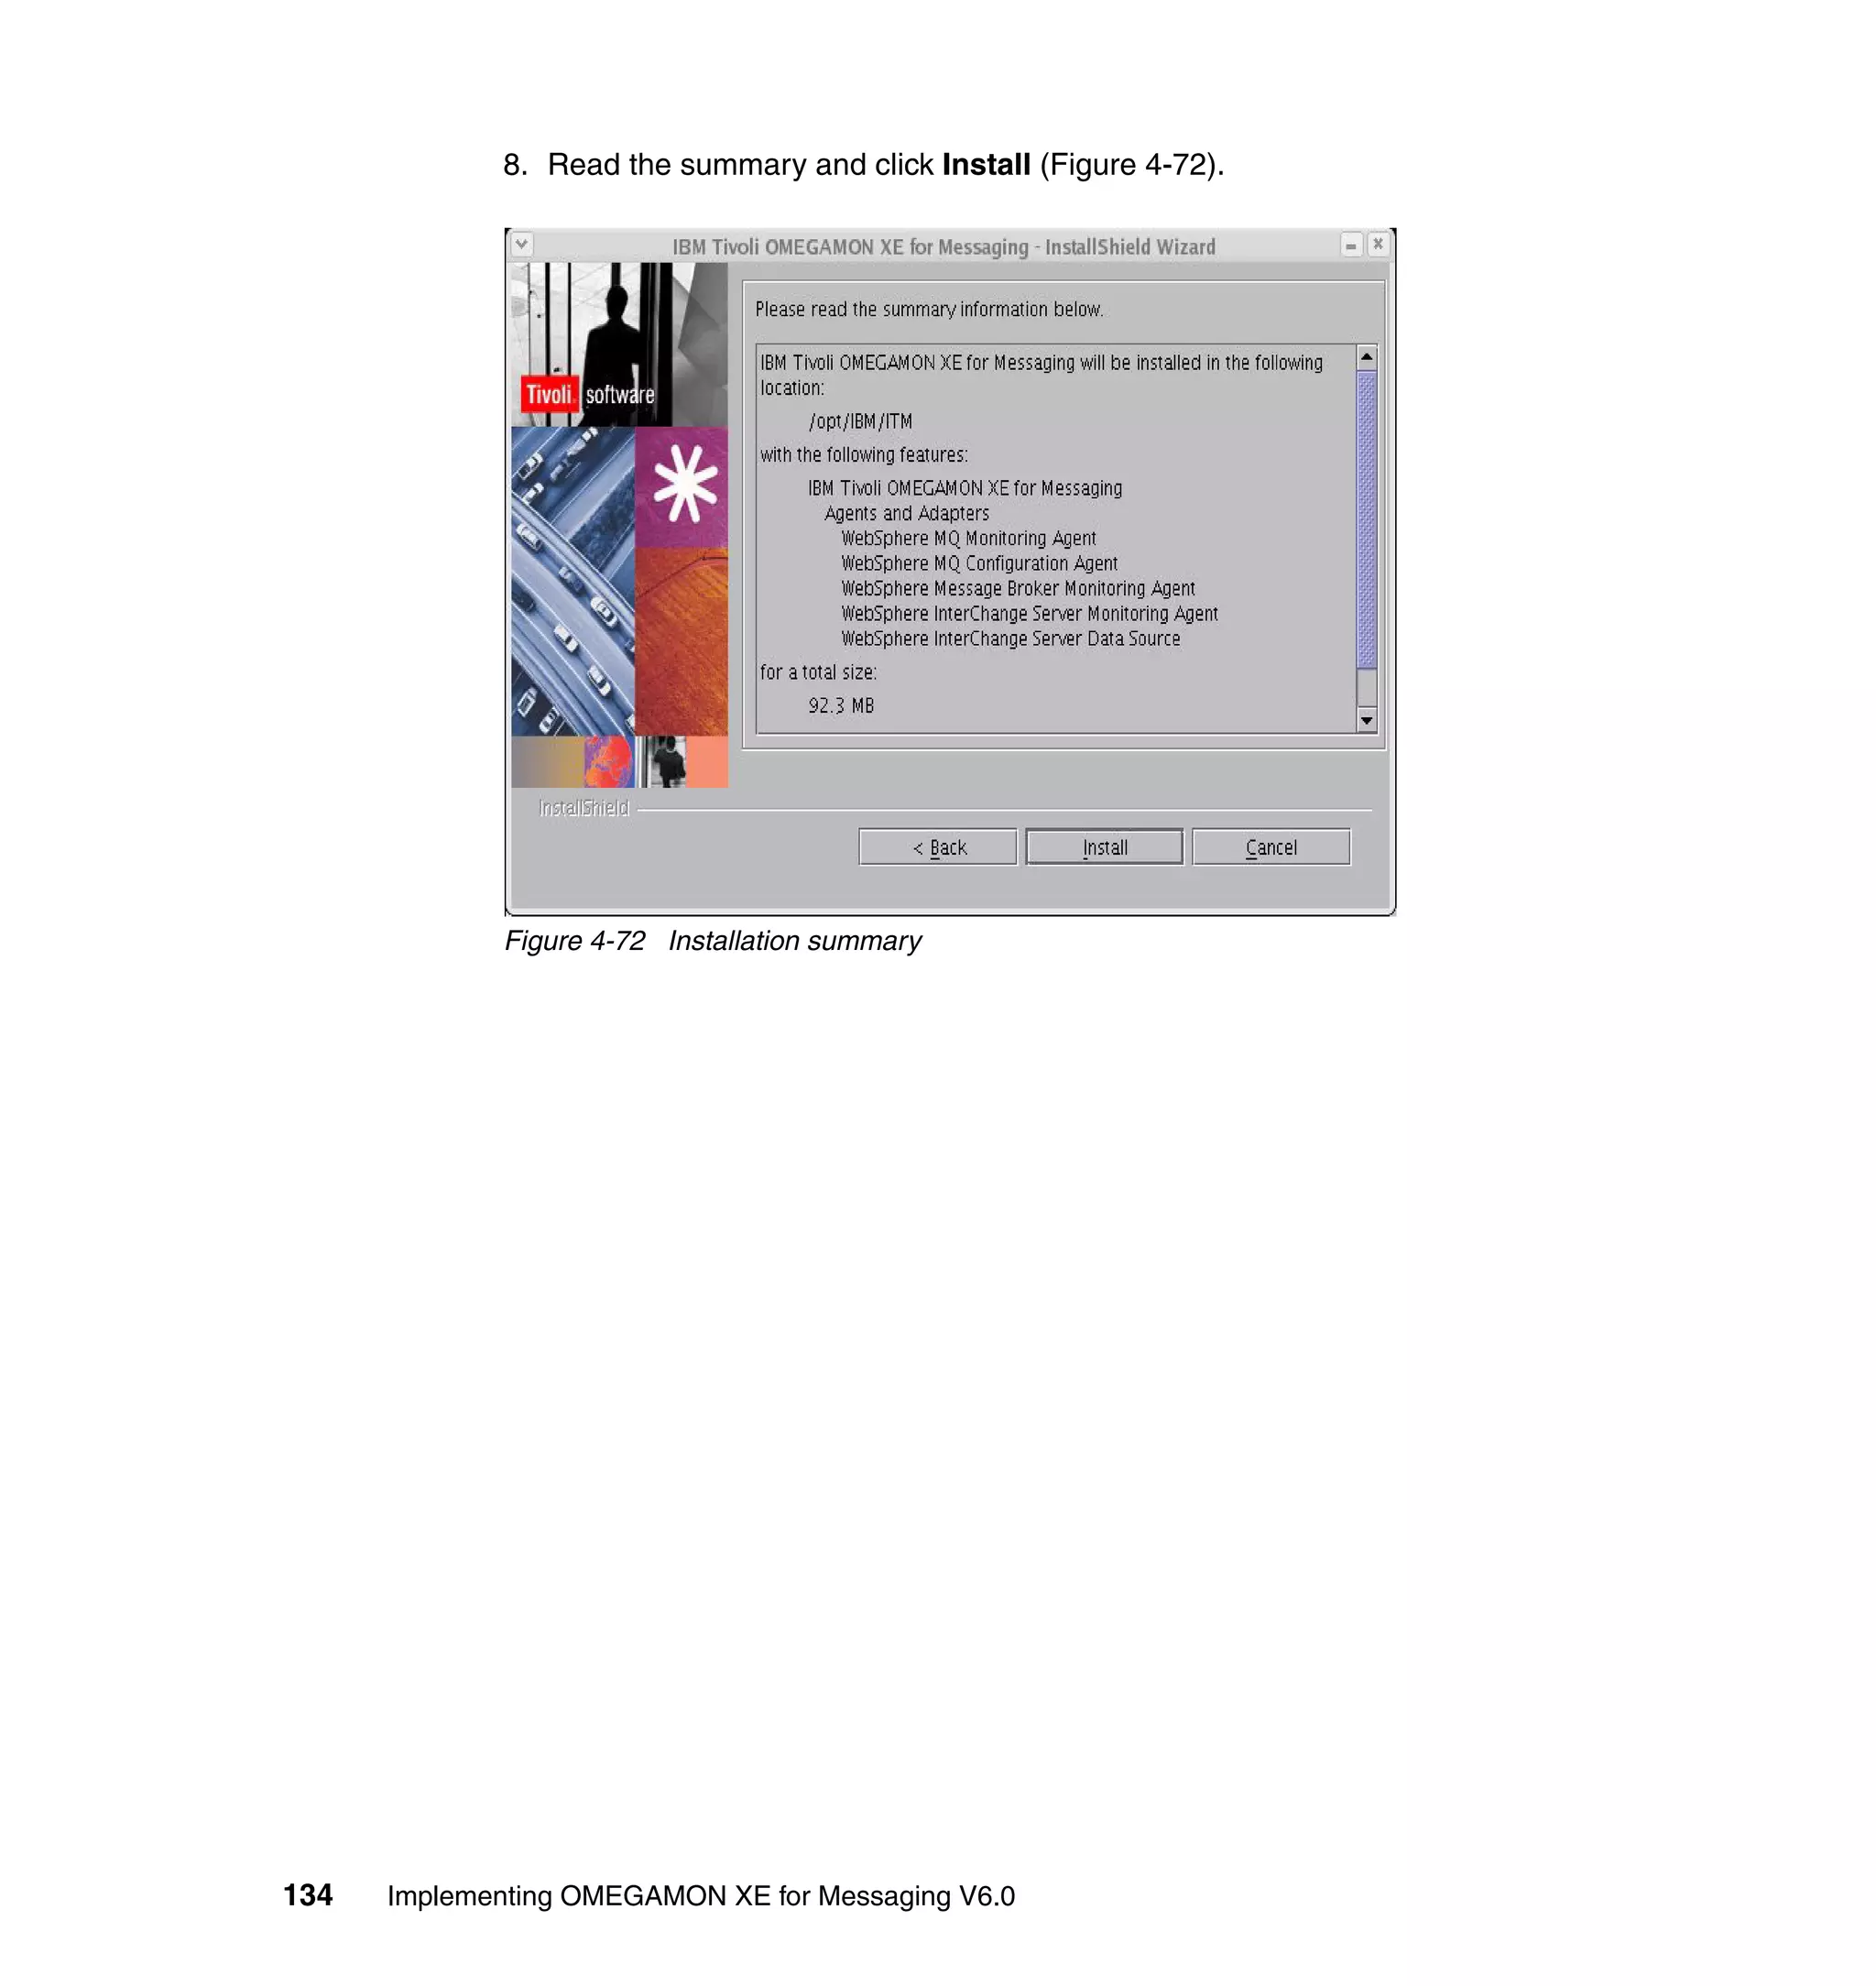
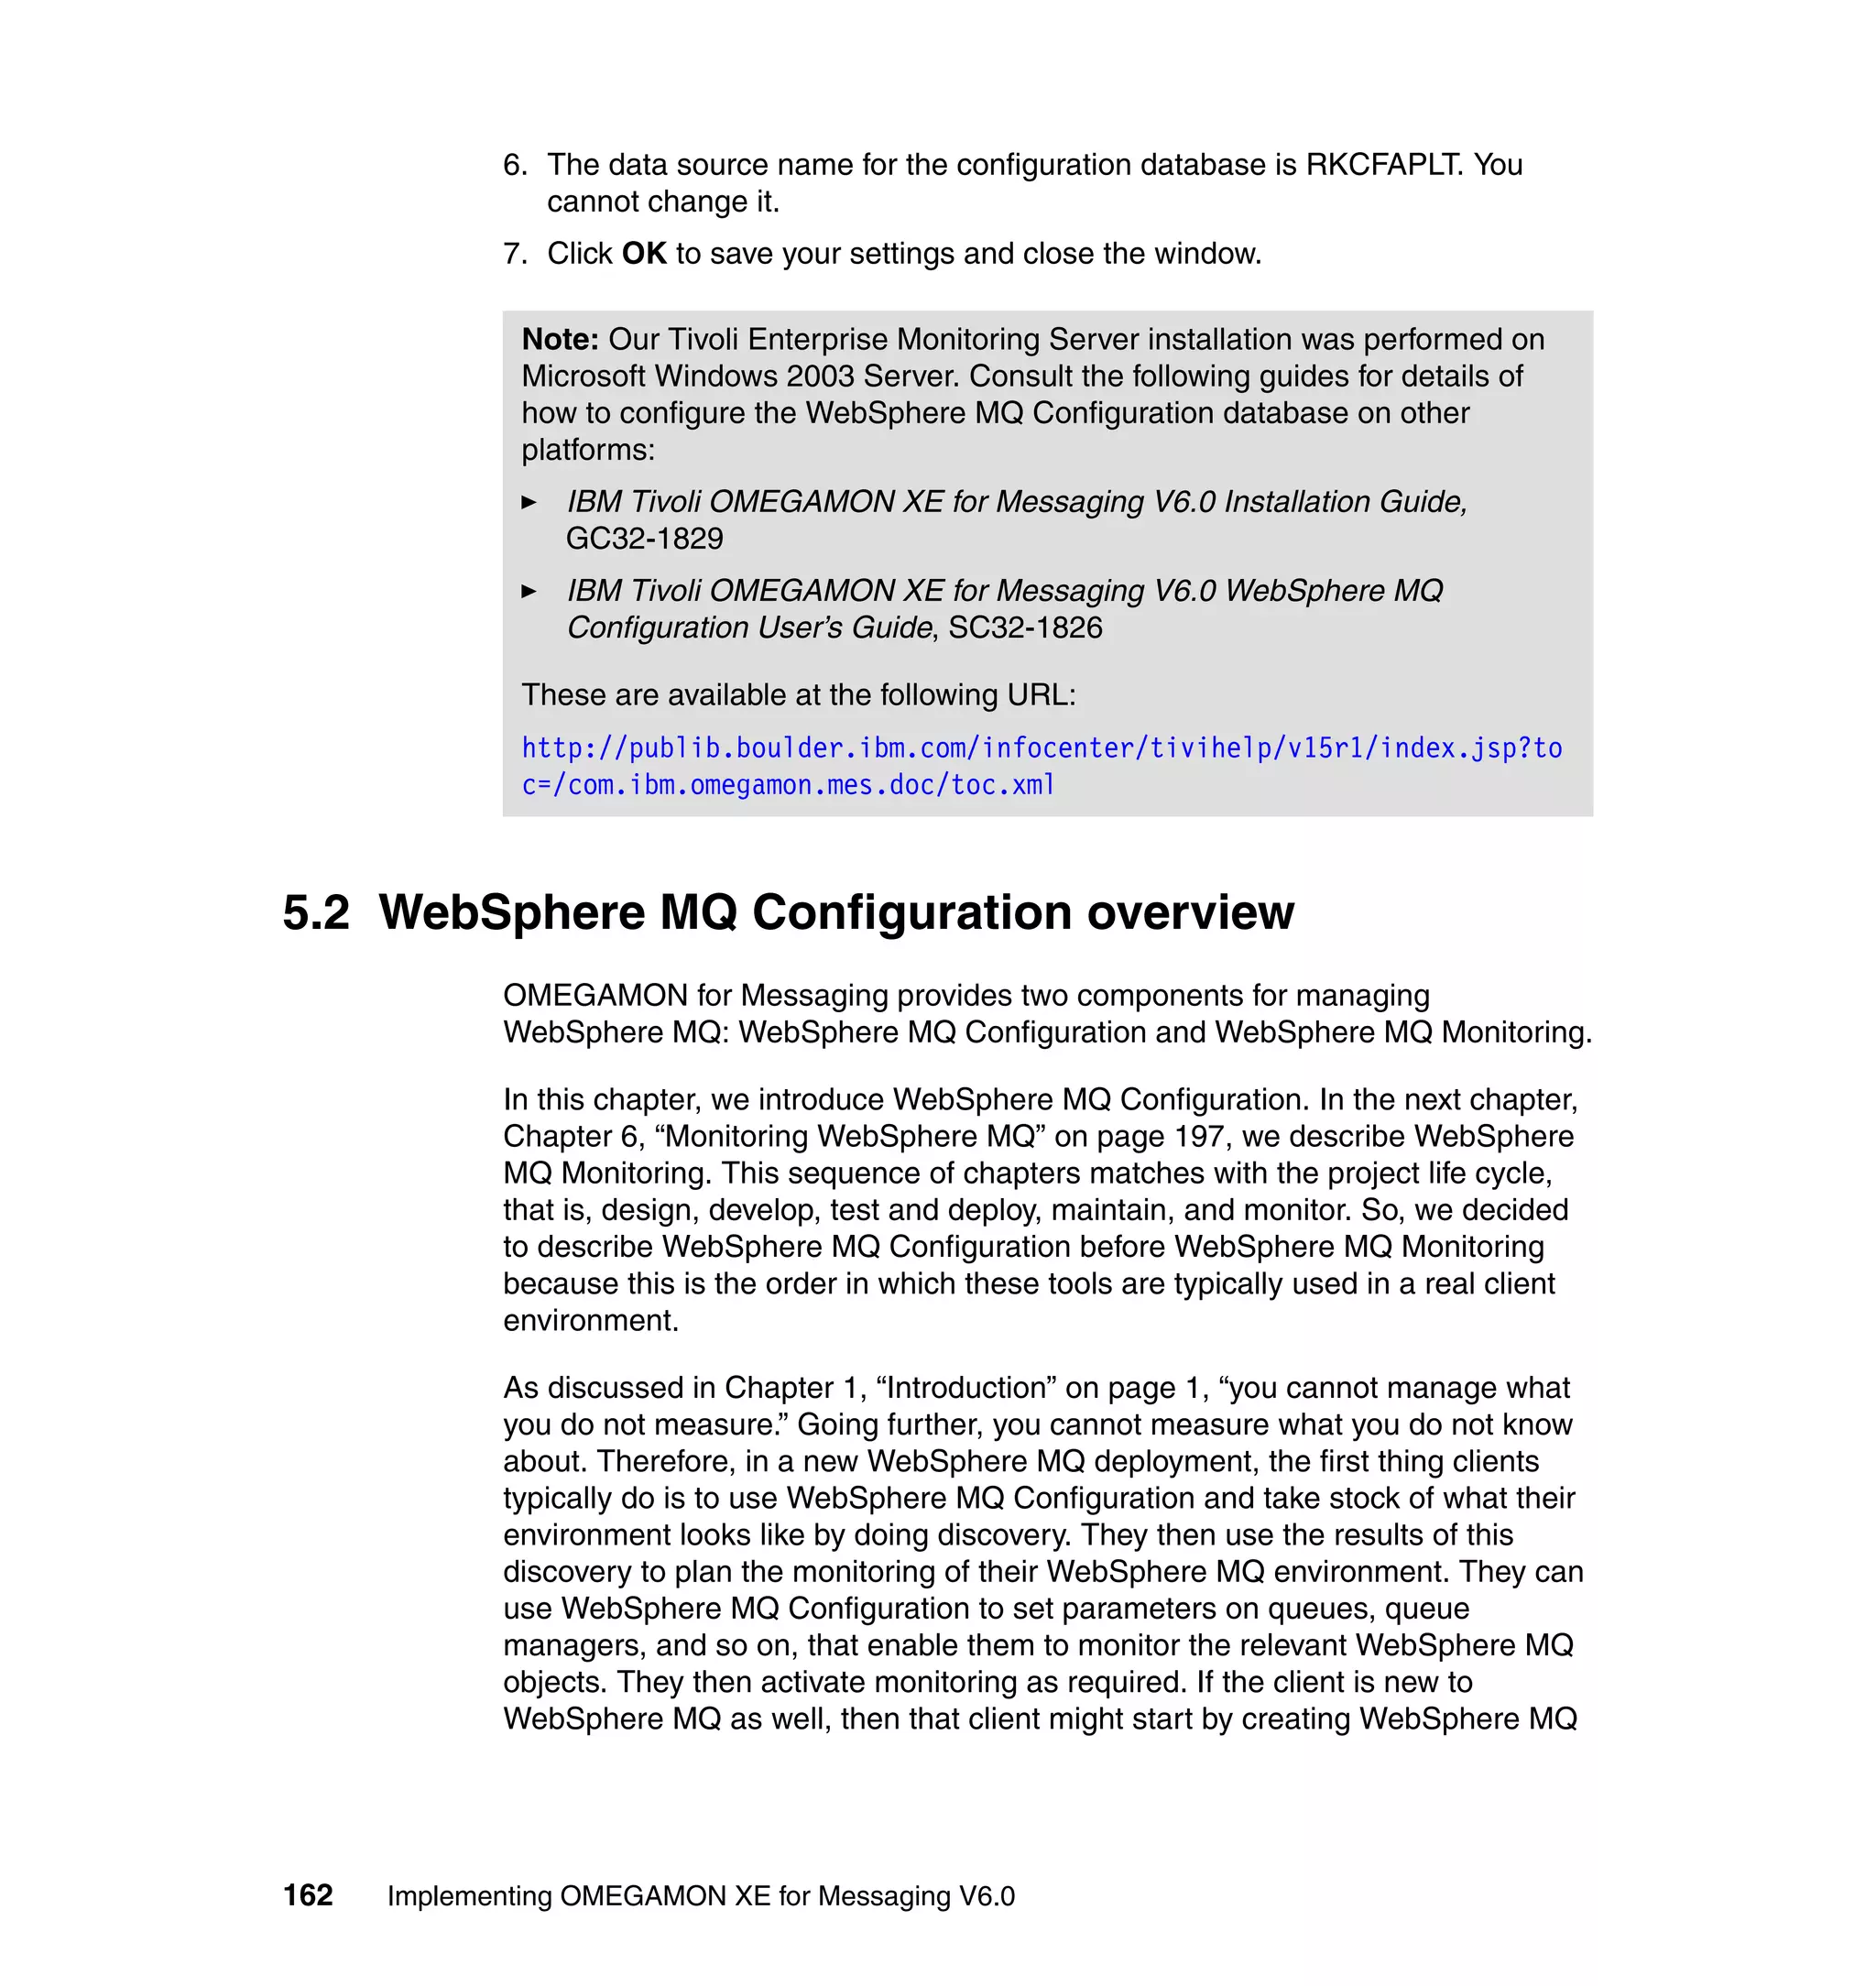
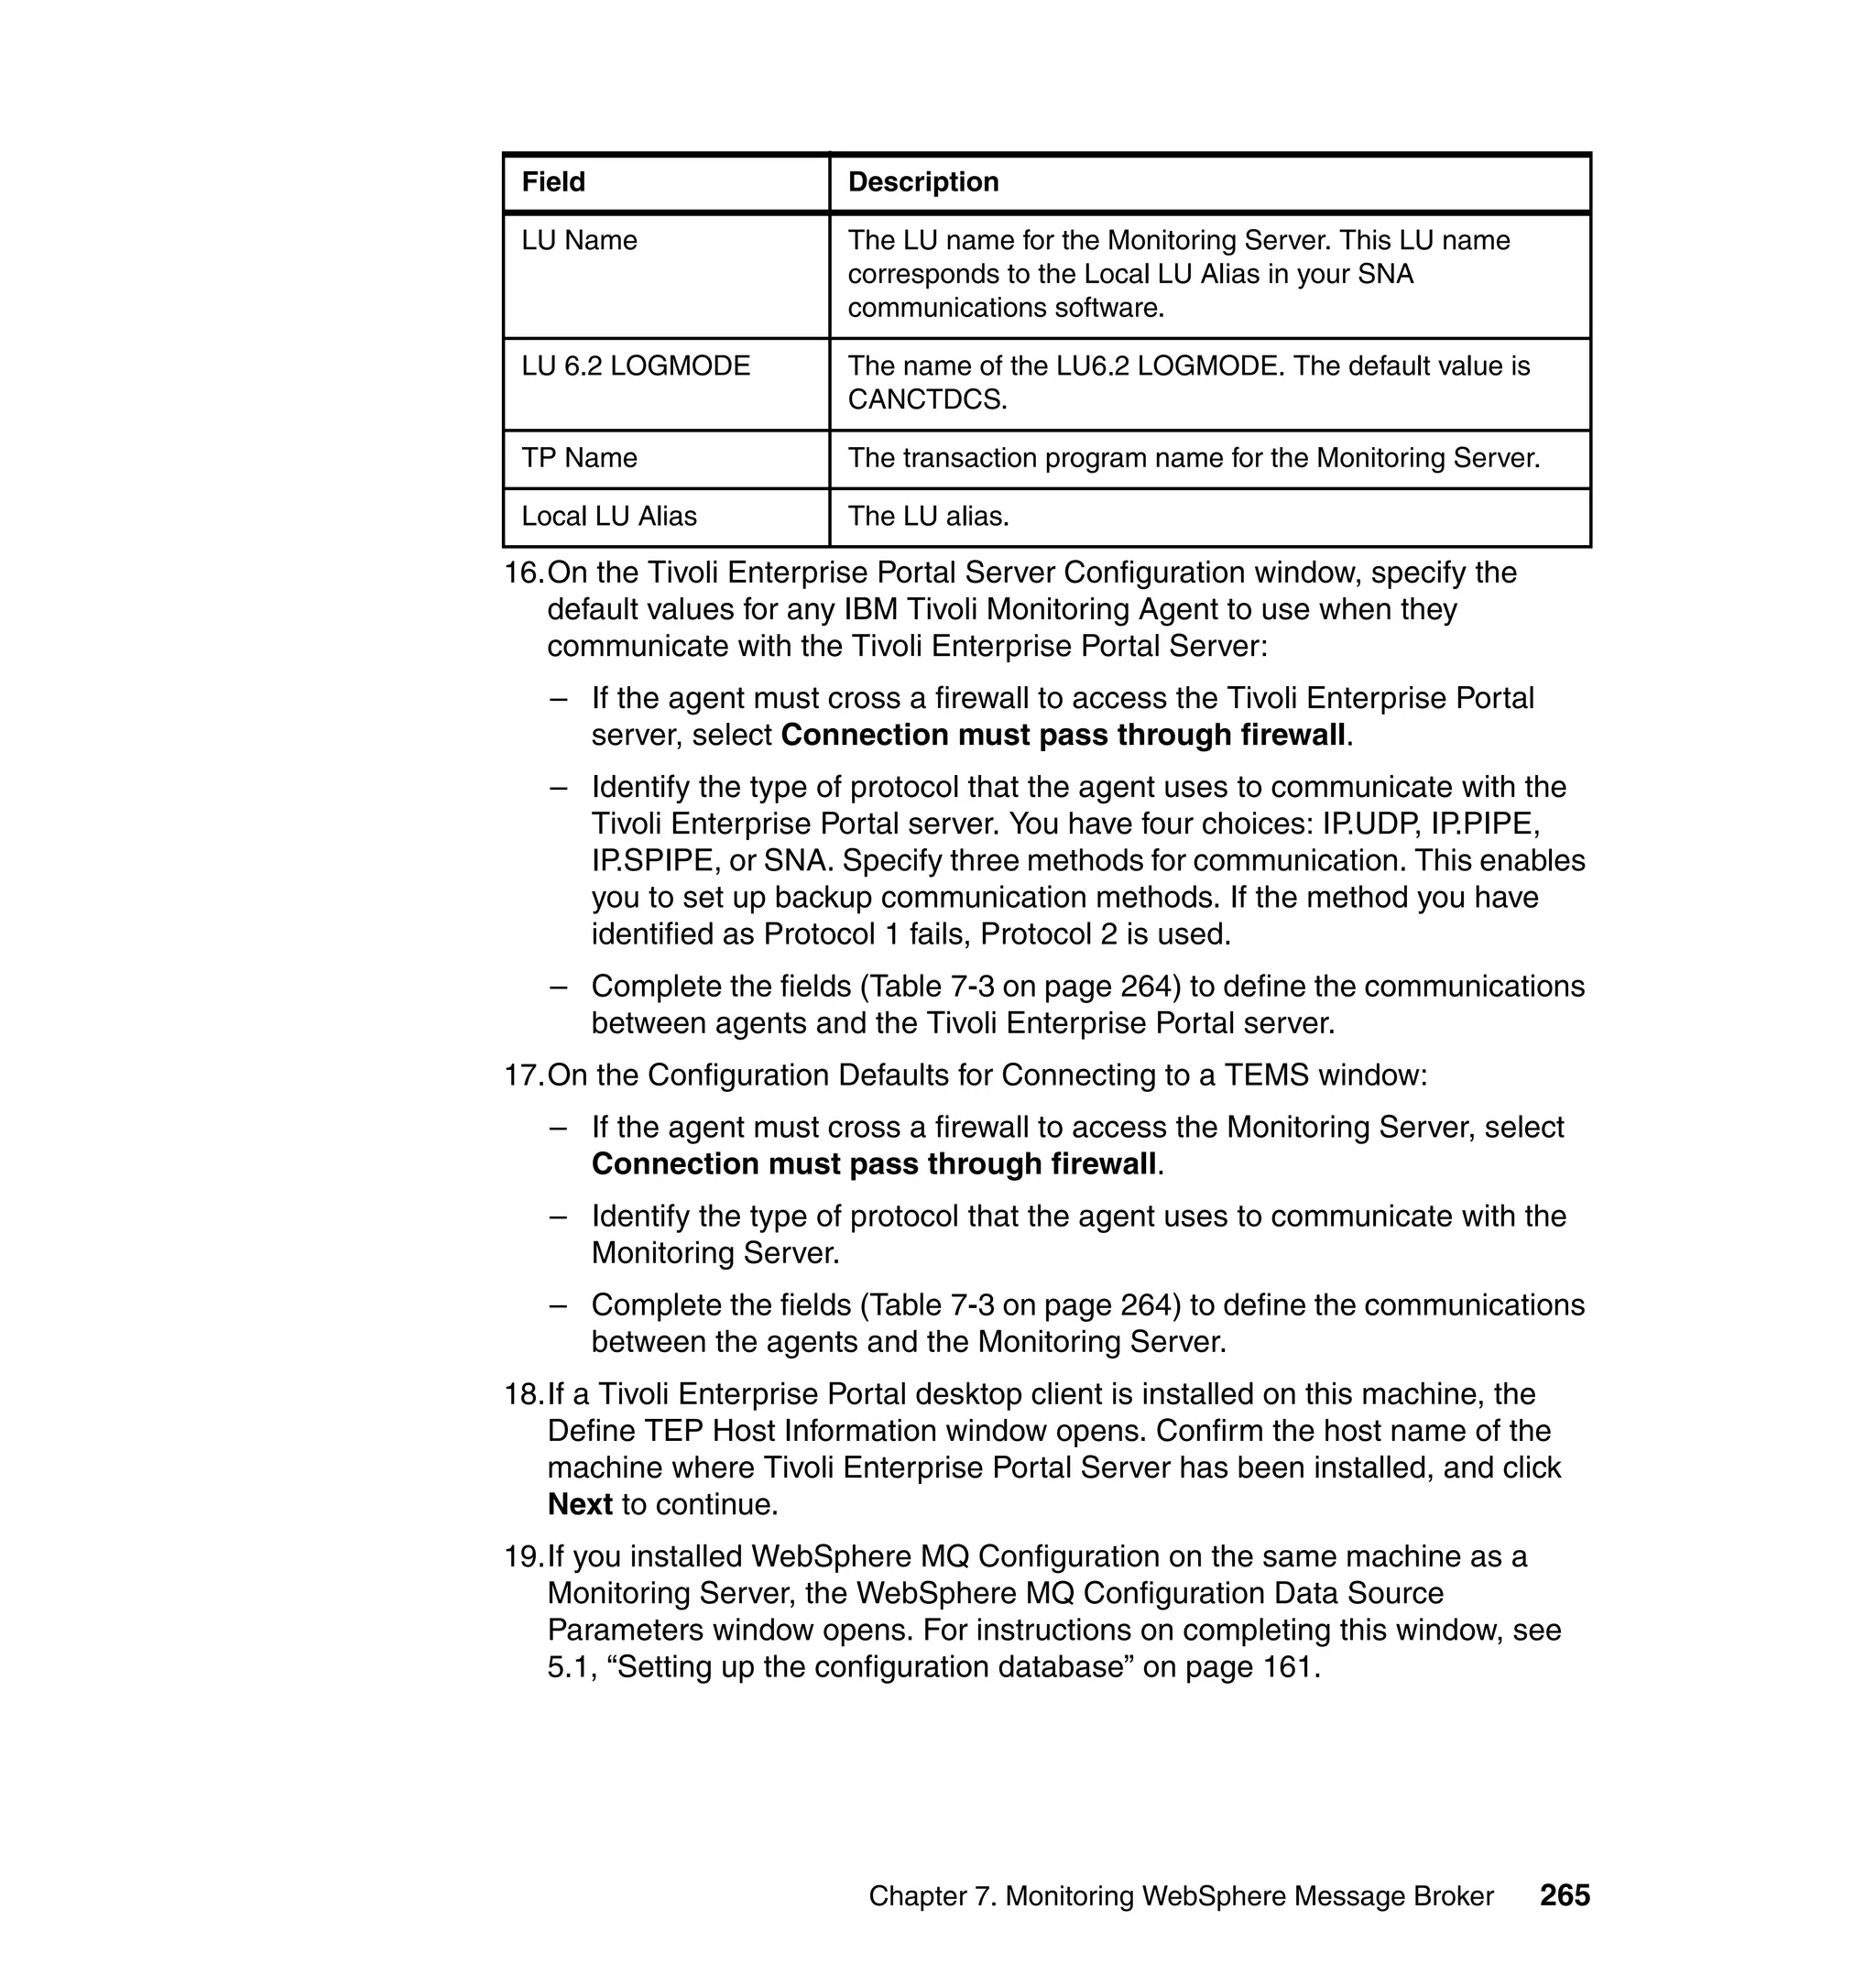
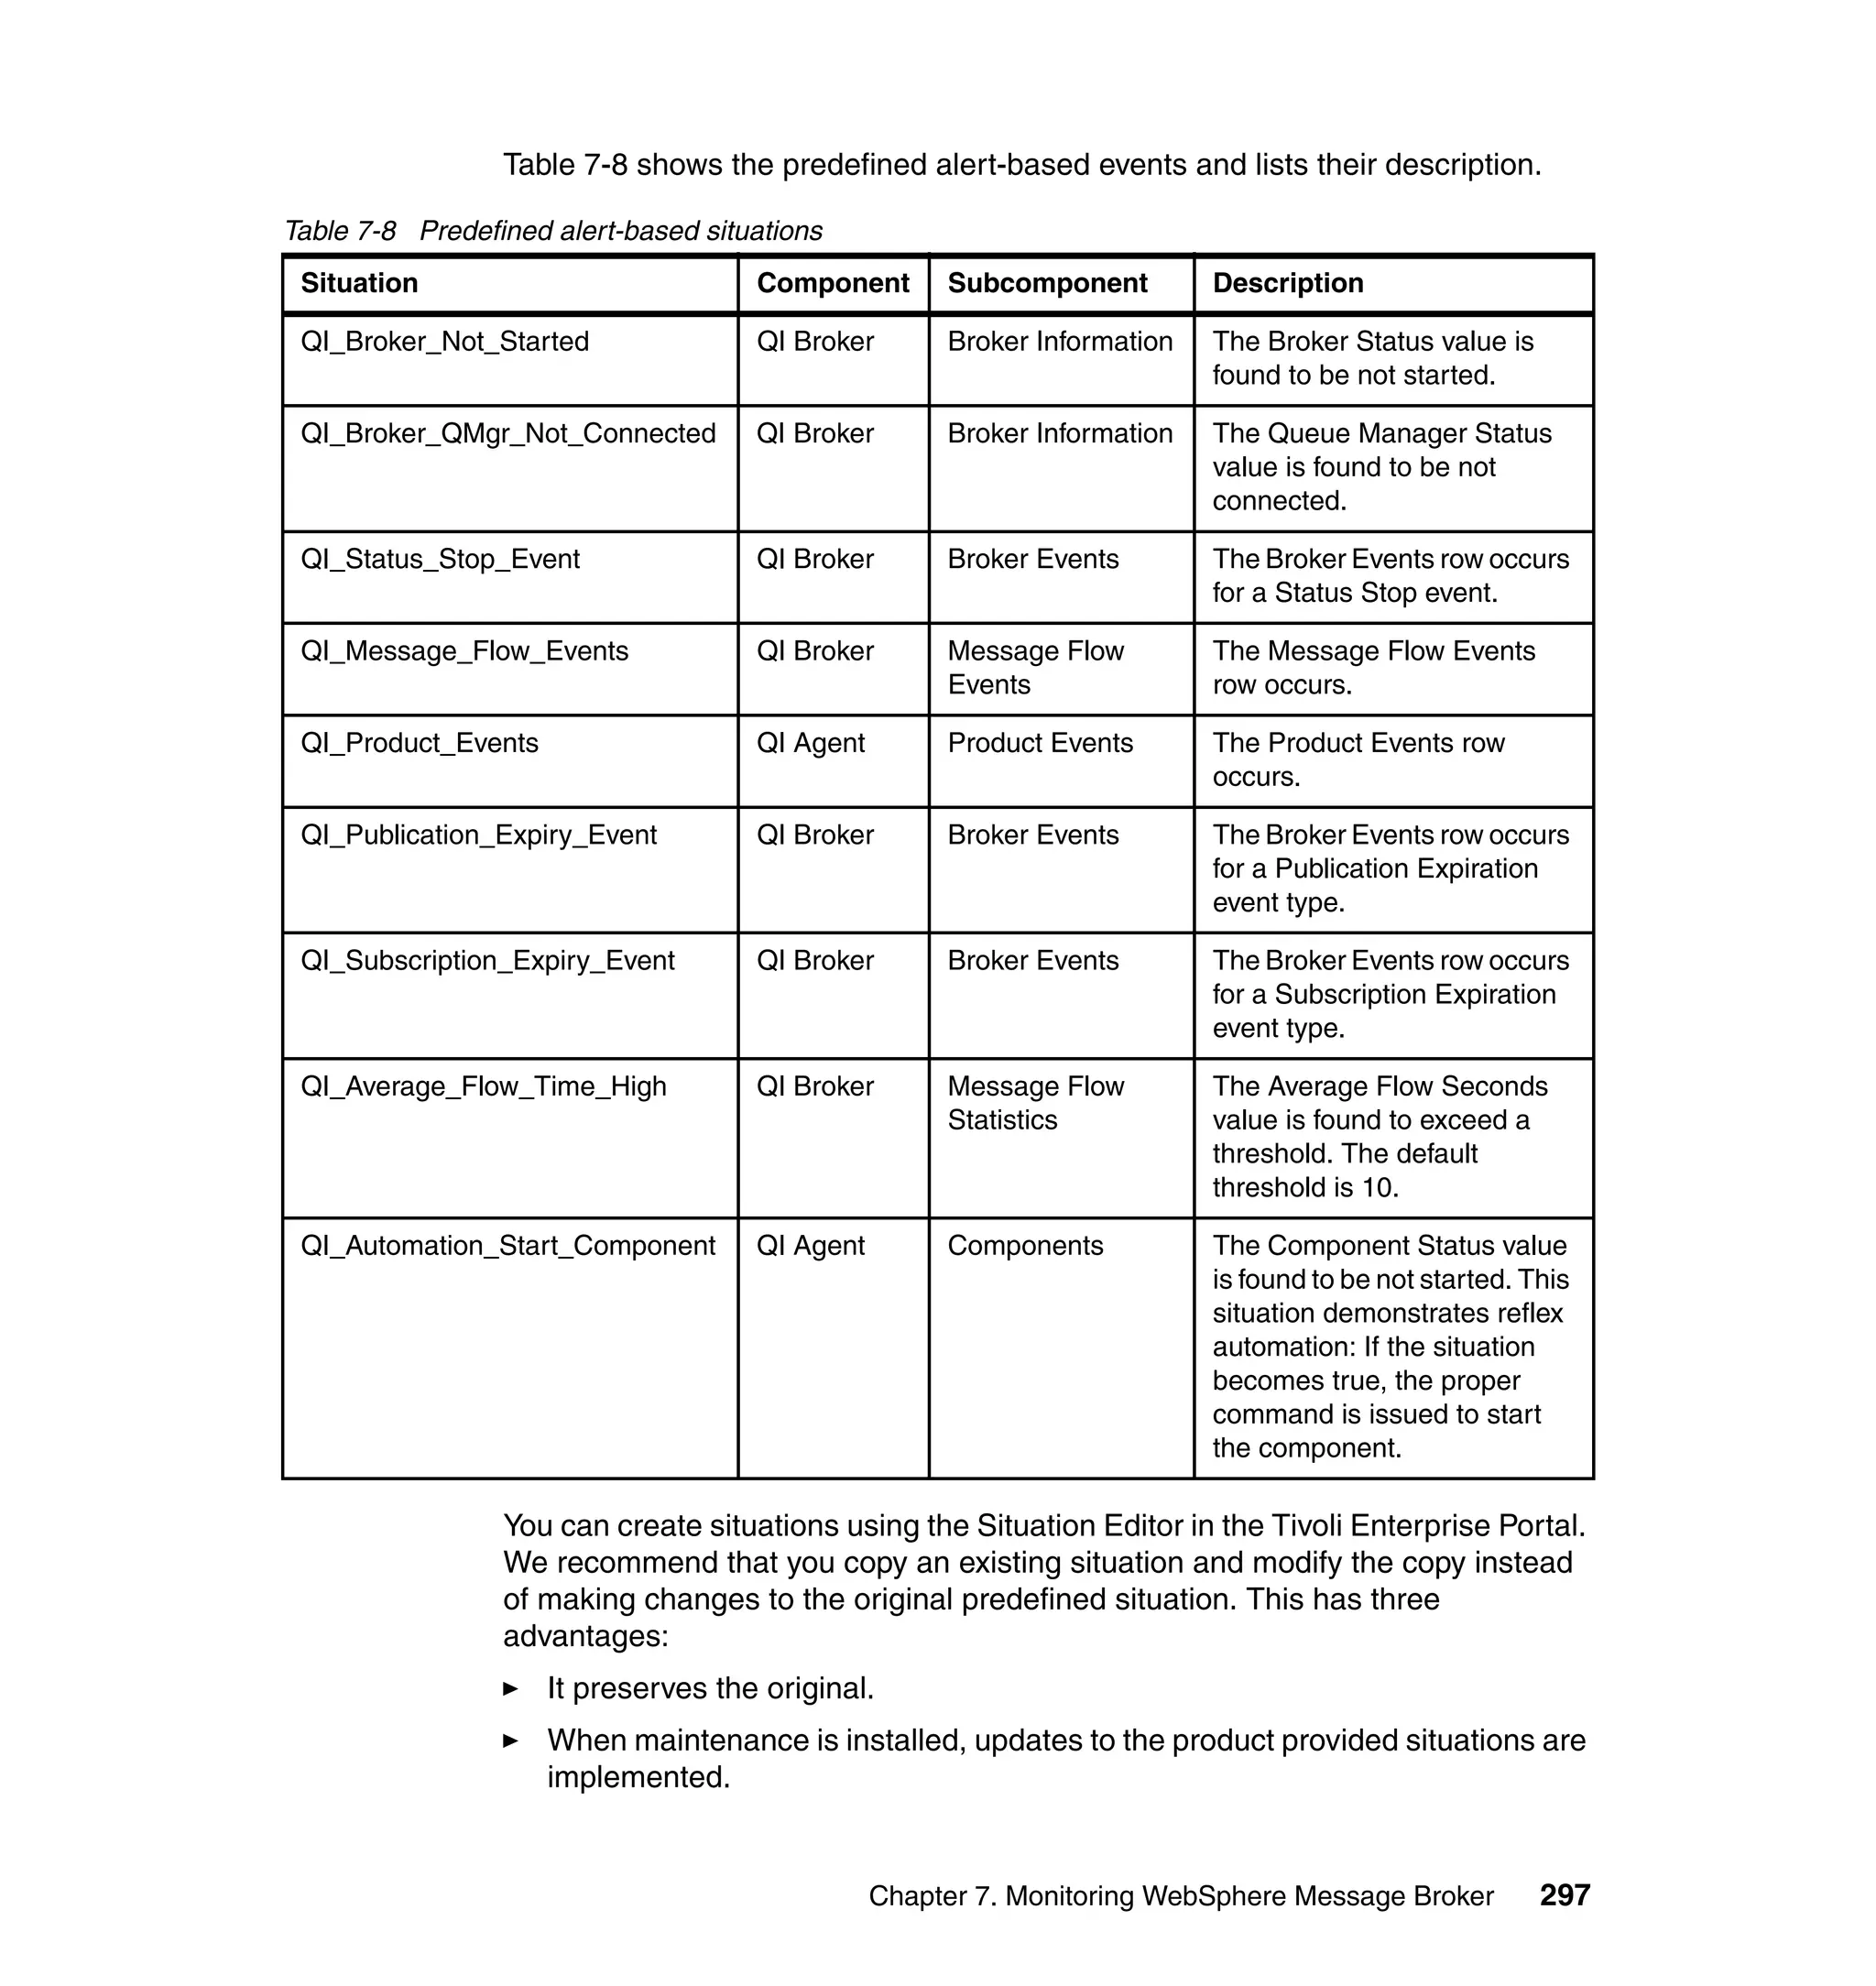
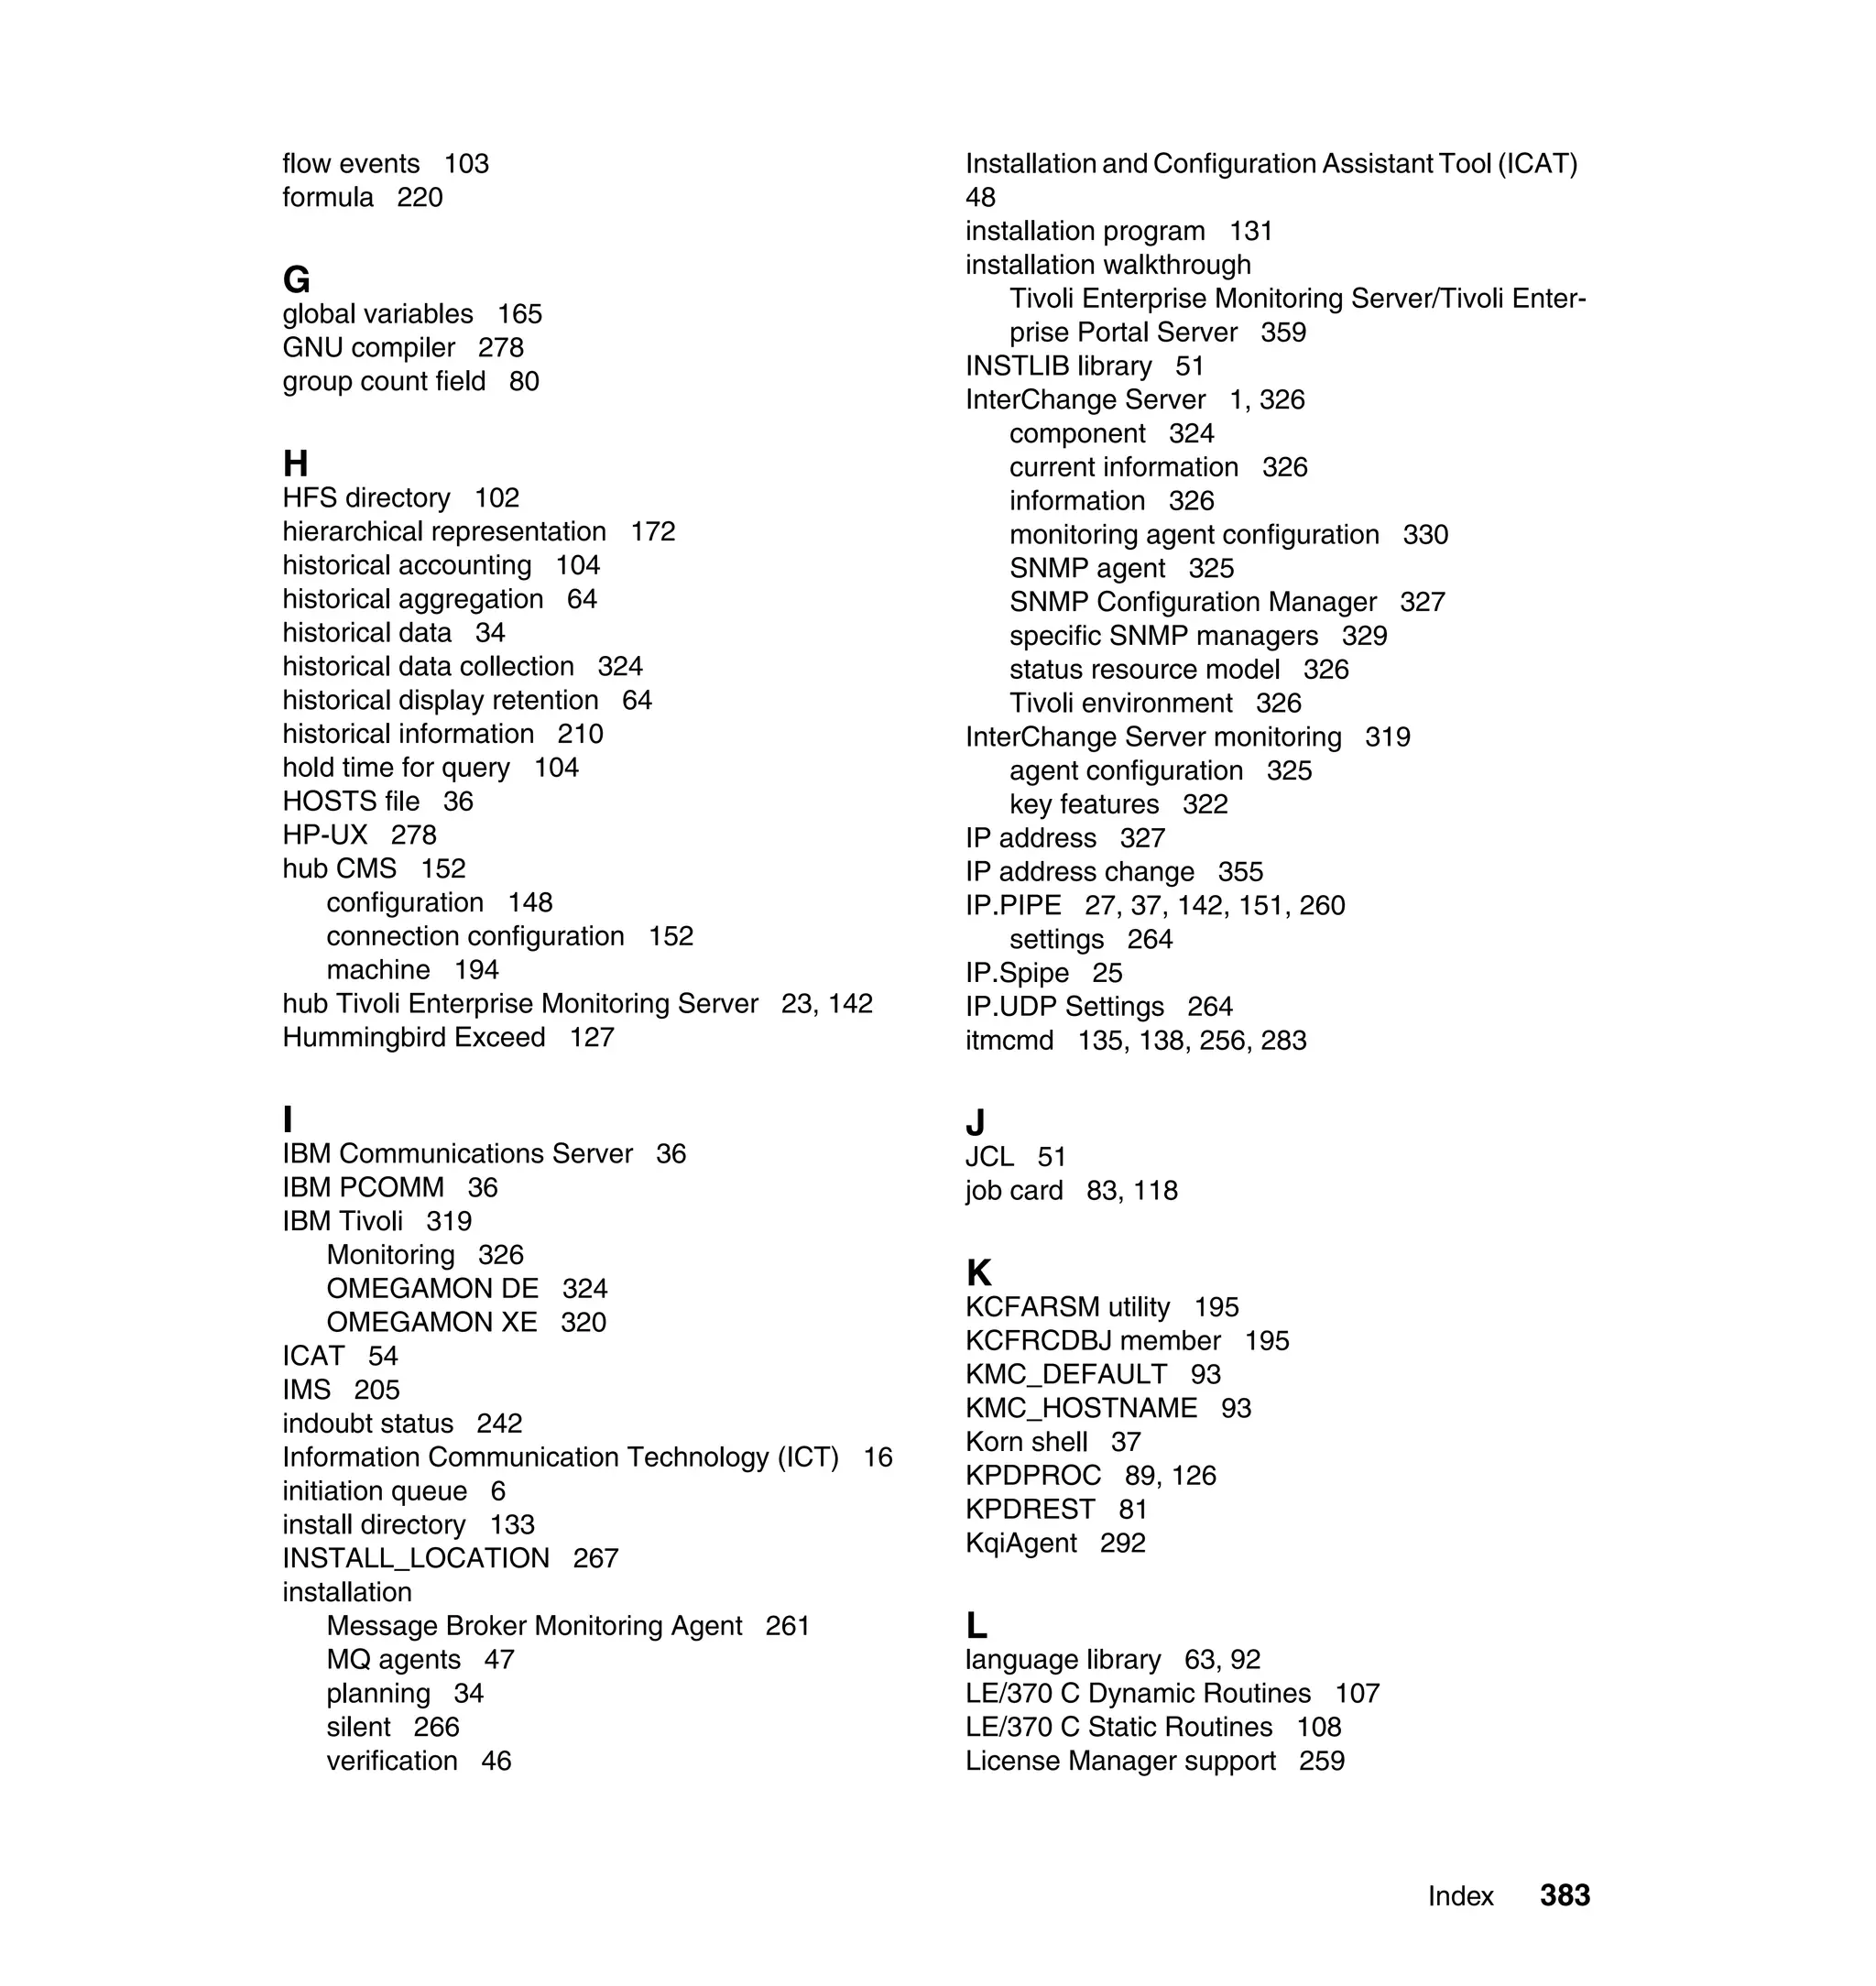
![When configuring agents, some or all of the prompts in Table 4-2 might appear
after executing itmcmd without optional parameters.
Table 4-2 Prompts in response to itmcmd execution
Parameters when configuring the agent on UNIX Our selections
Will this agent connect to a TEMS? [YES or NO] (The default is YES
YES.)
TEMS Host Name ALPHA
Network Protocol 1 [ip, sna, ip.pipe or ip.spipe] (The default is ip.) ip.pipe
Network Protocol 2 (The default is none.) ip
Network Protocol 3 (The default is none.)
IP Port Number (The default is 1918.) 1918
IP.PIPE Port Number (The default is 1918.) 1918
Enter name of KDC_PARTITION (The default is null.)
Configure connection for a secondary TEMS? [YES or NO] (The NO
default is NO.)
Enter Optional Primary Network Name or “none” (The default is
none.)
After answering all the questions, a config file is generated for the agent in the
$install_dir/config directory with the format pc.config, where the variable pc is the
product code of the agent you are configuring.
Note: The WebSphere MQ Monitoring Agent has an additional configuration
file called mq.cfg. This file stores a default set of monitoring options that are
read at agent startup, including the name of the queue manager to be
monitored. If the queue manager name is not explicitly entered, an attempt is
made to monitor the default queue manager. See 6.2, “WebSphere MQ
Monitoring options” on page 203 for a full description.
4.2.4 Starting and stopping the WebSphere MQ agents
Before an agent is started, ensure that it is authorized. The account to be used
for starting the agent must have mqm as the primary group.
Chapter 4. Installing and configuring WebSphere MQ agents 137](https://image.slidesharecdn.com/implementingomegamonxeformessagingv6-0sg247357-120524195829-phpapp02/75/Implementing-omegamon-xe-for-messaging-v6-0-sg247357-159-2048.jpg)
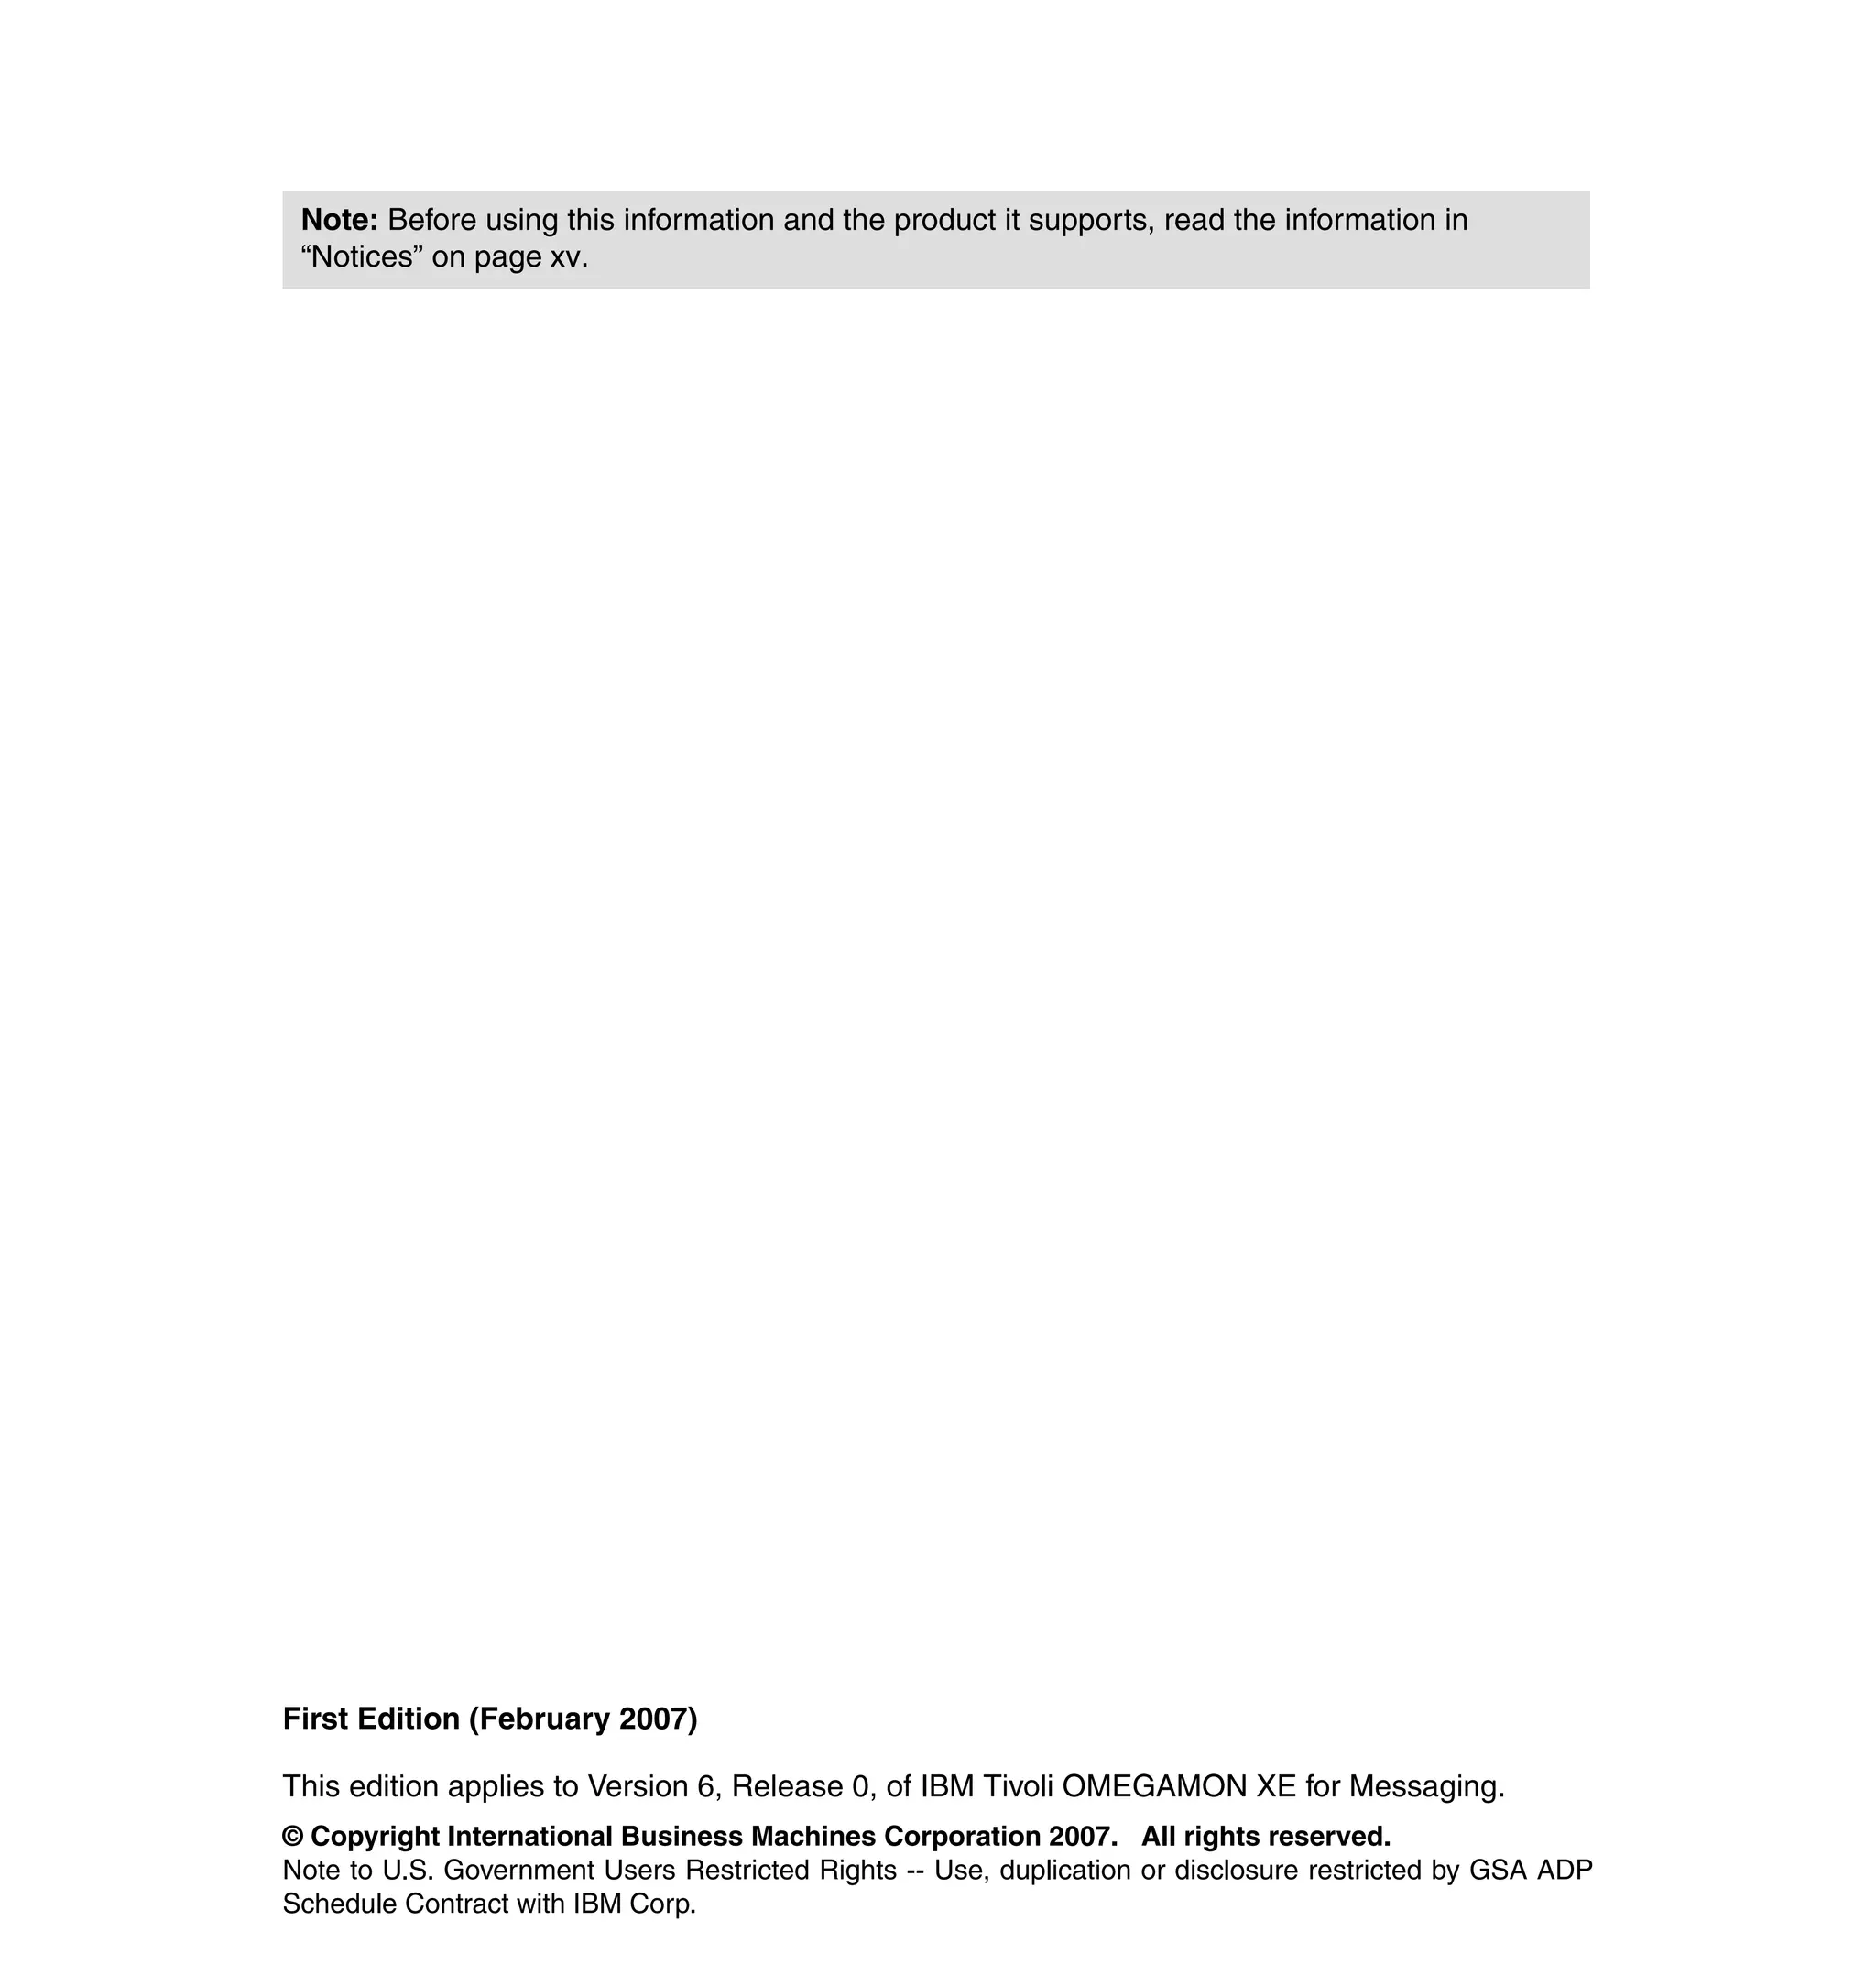
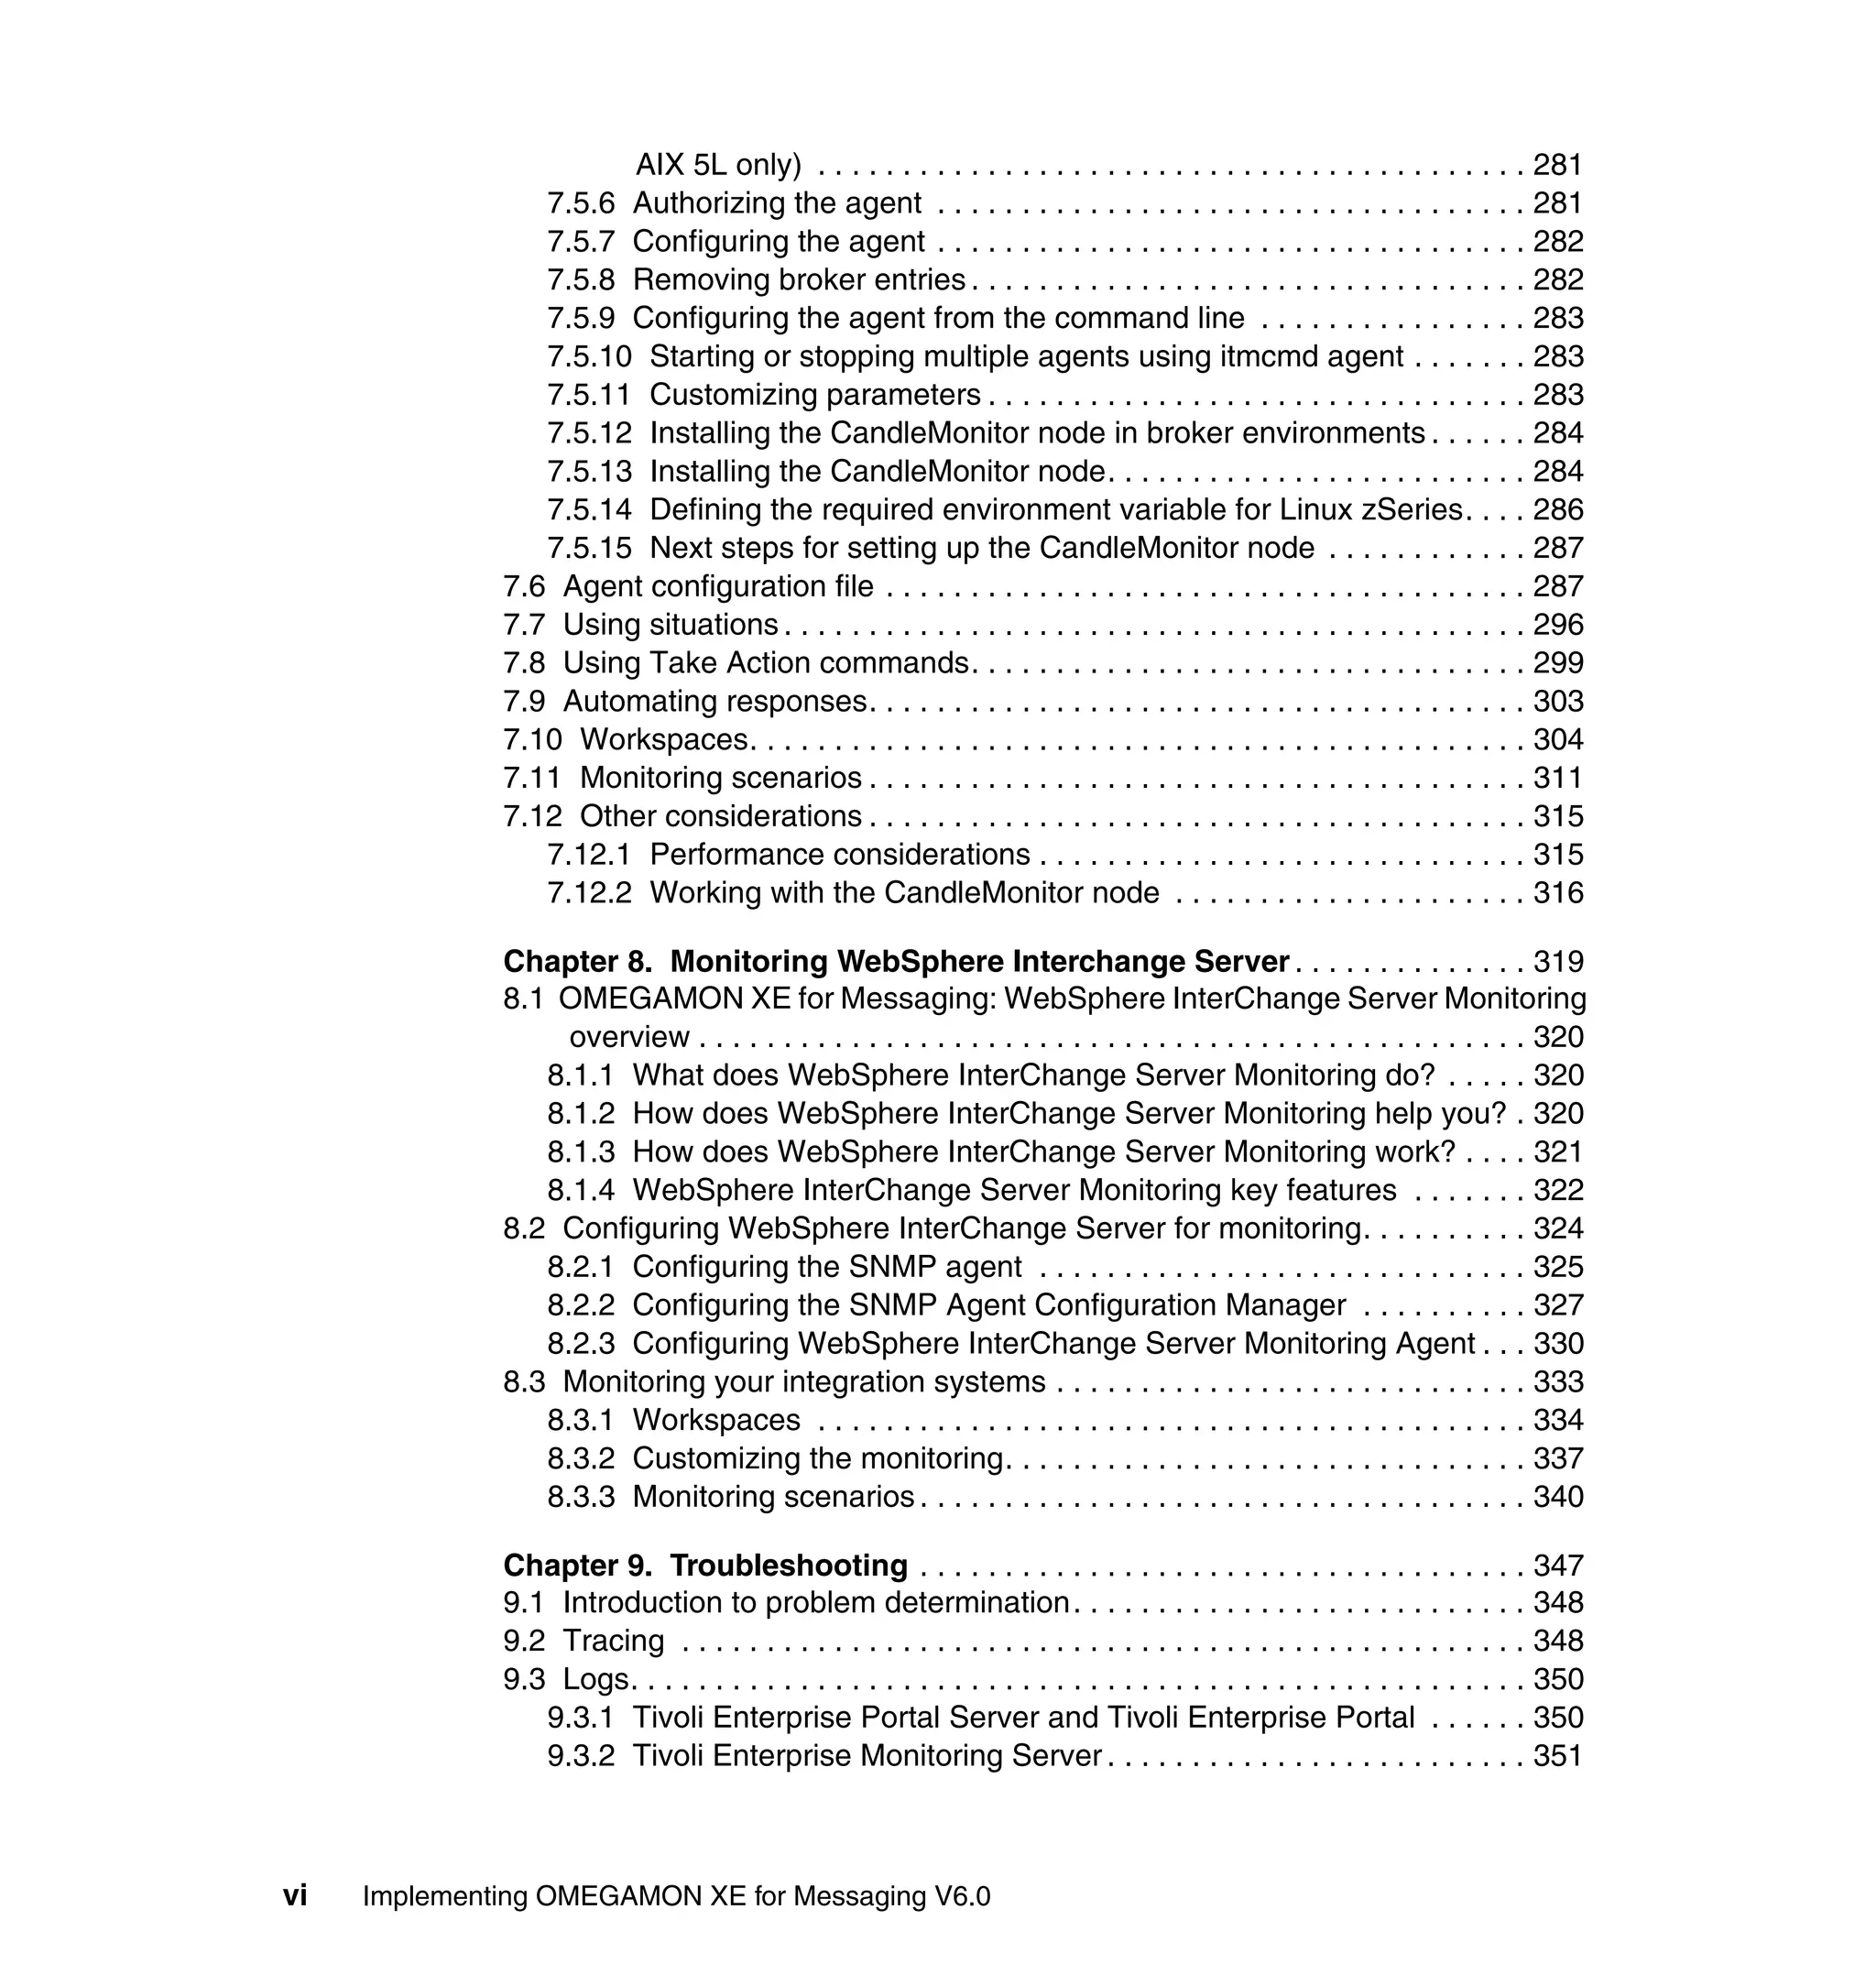
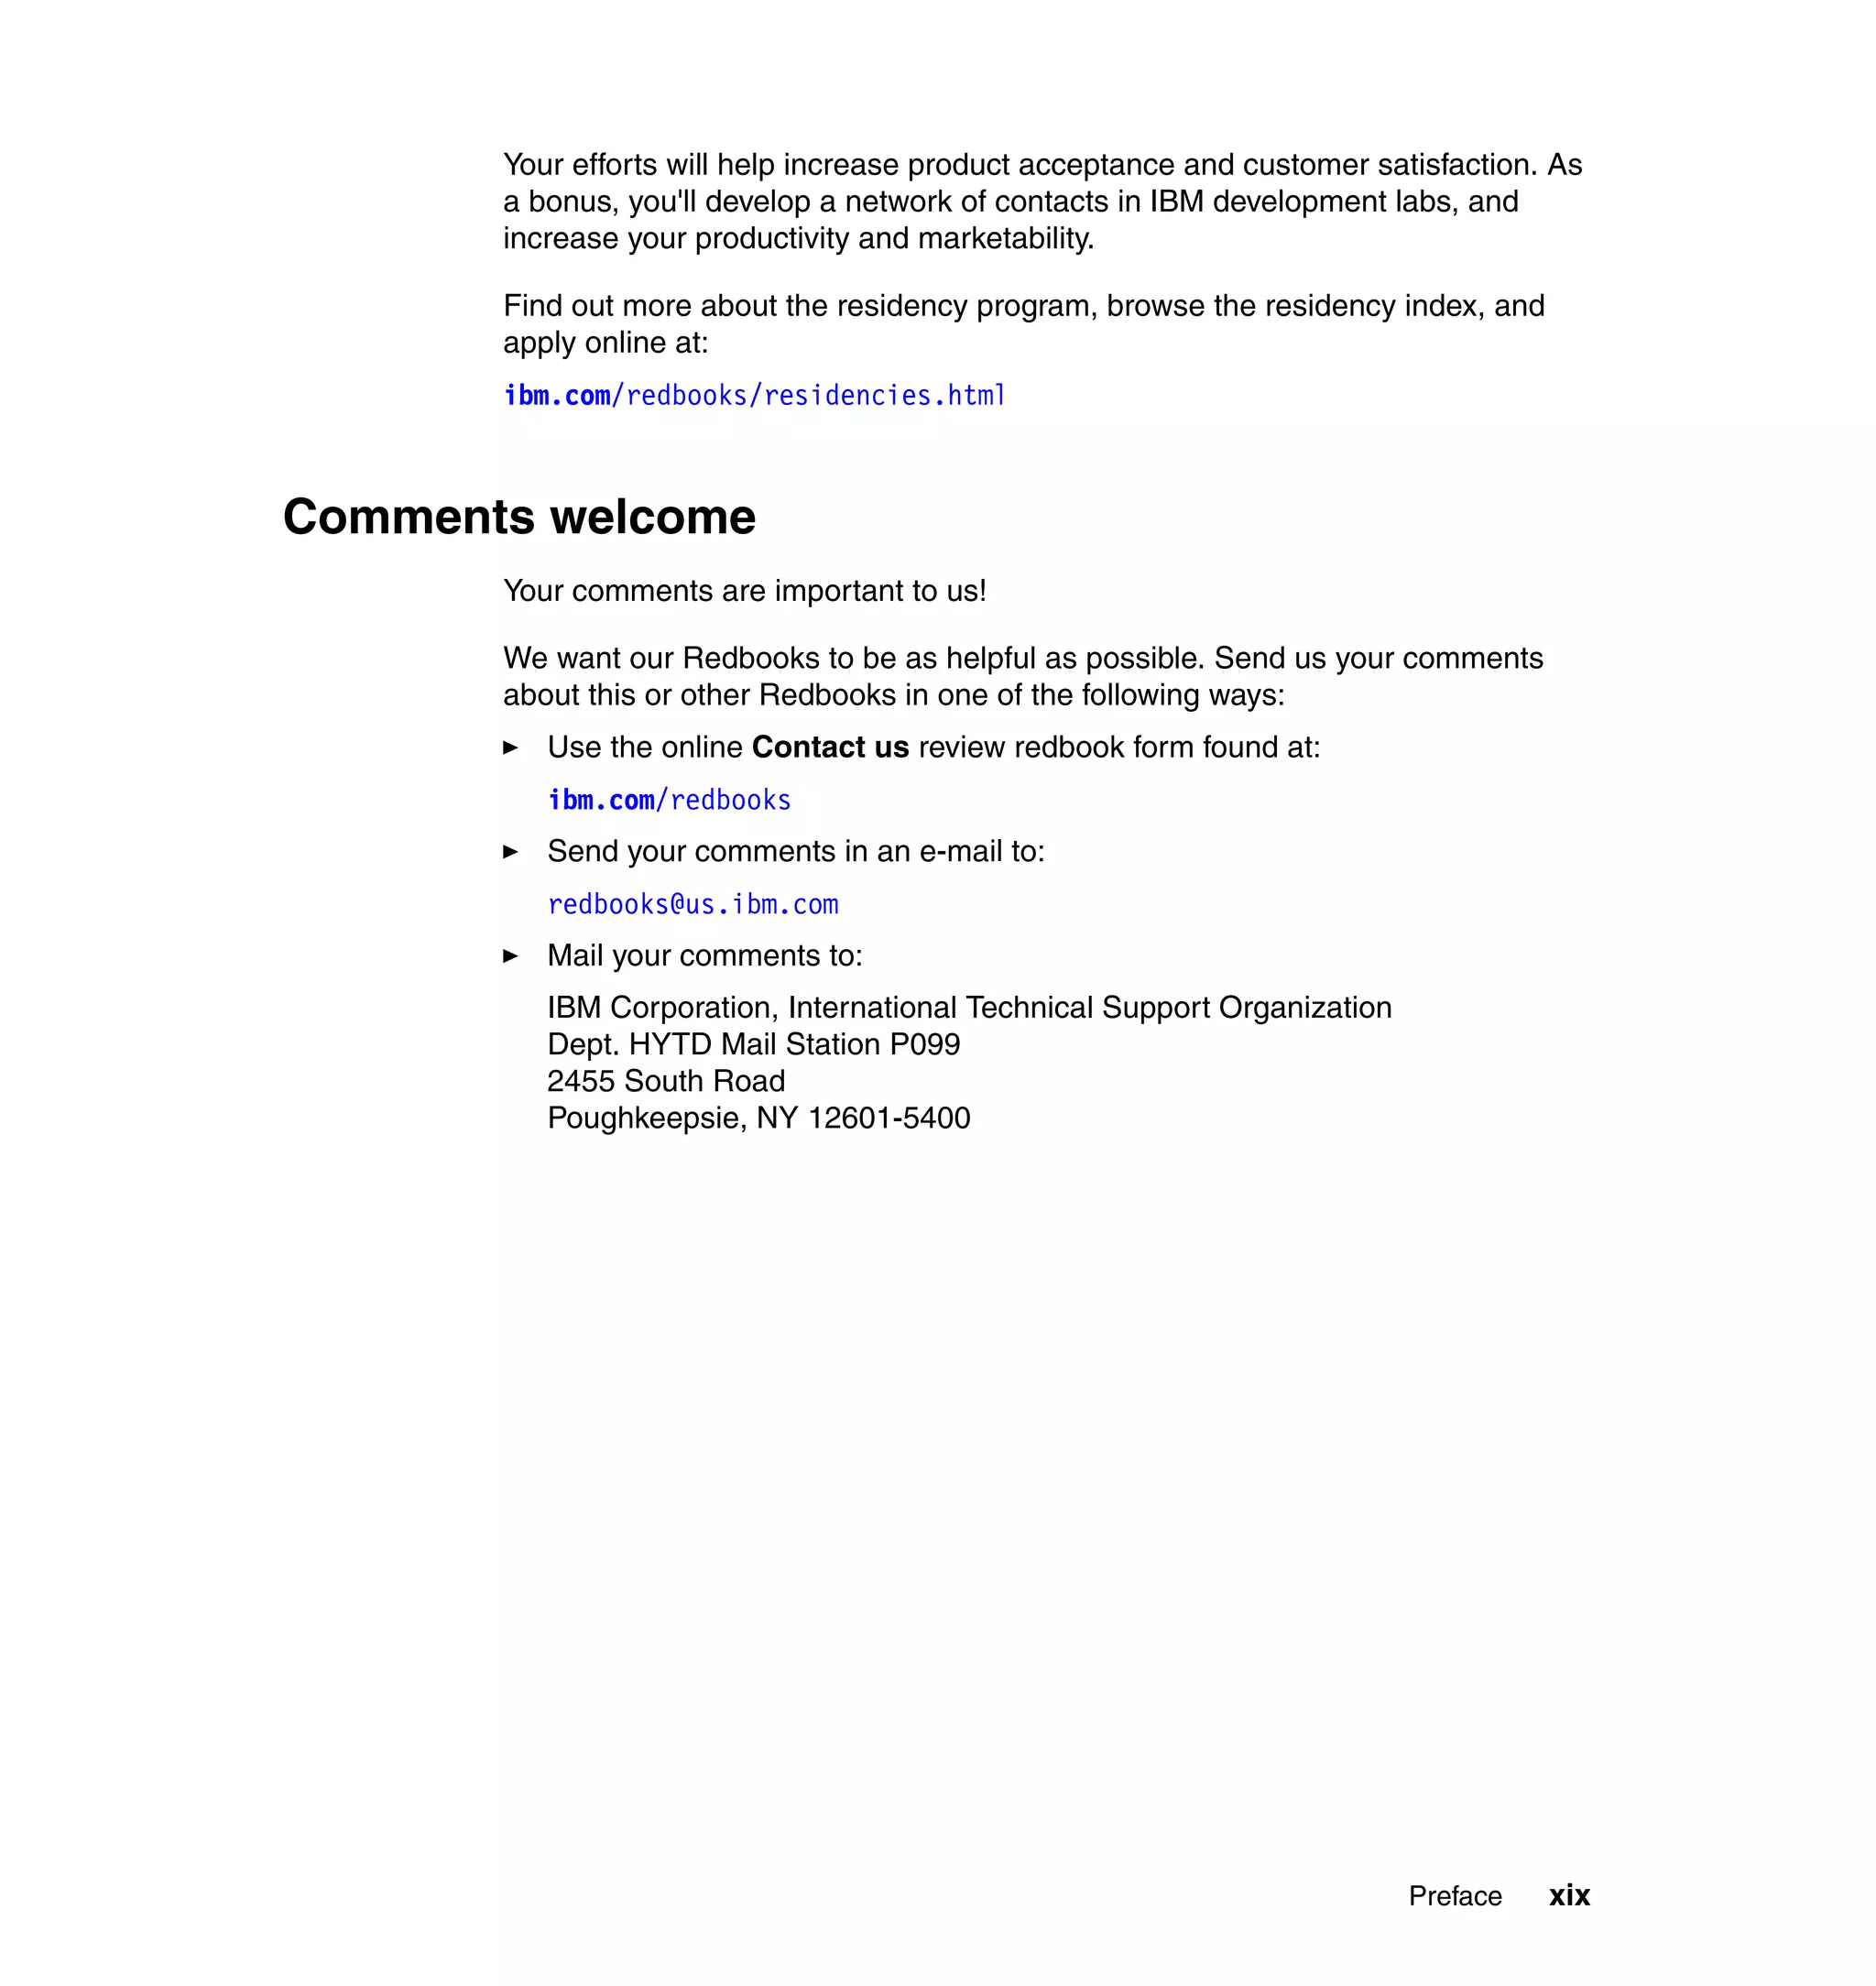
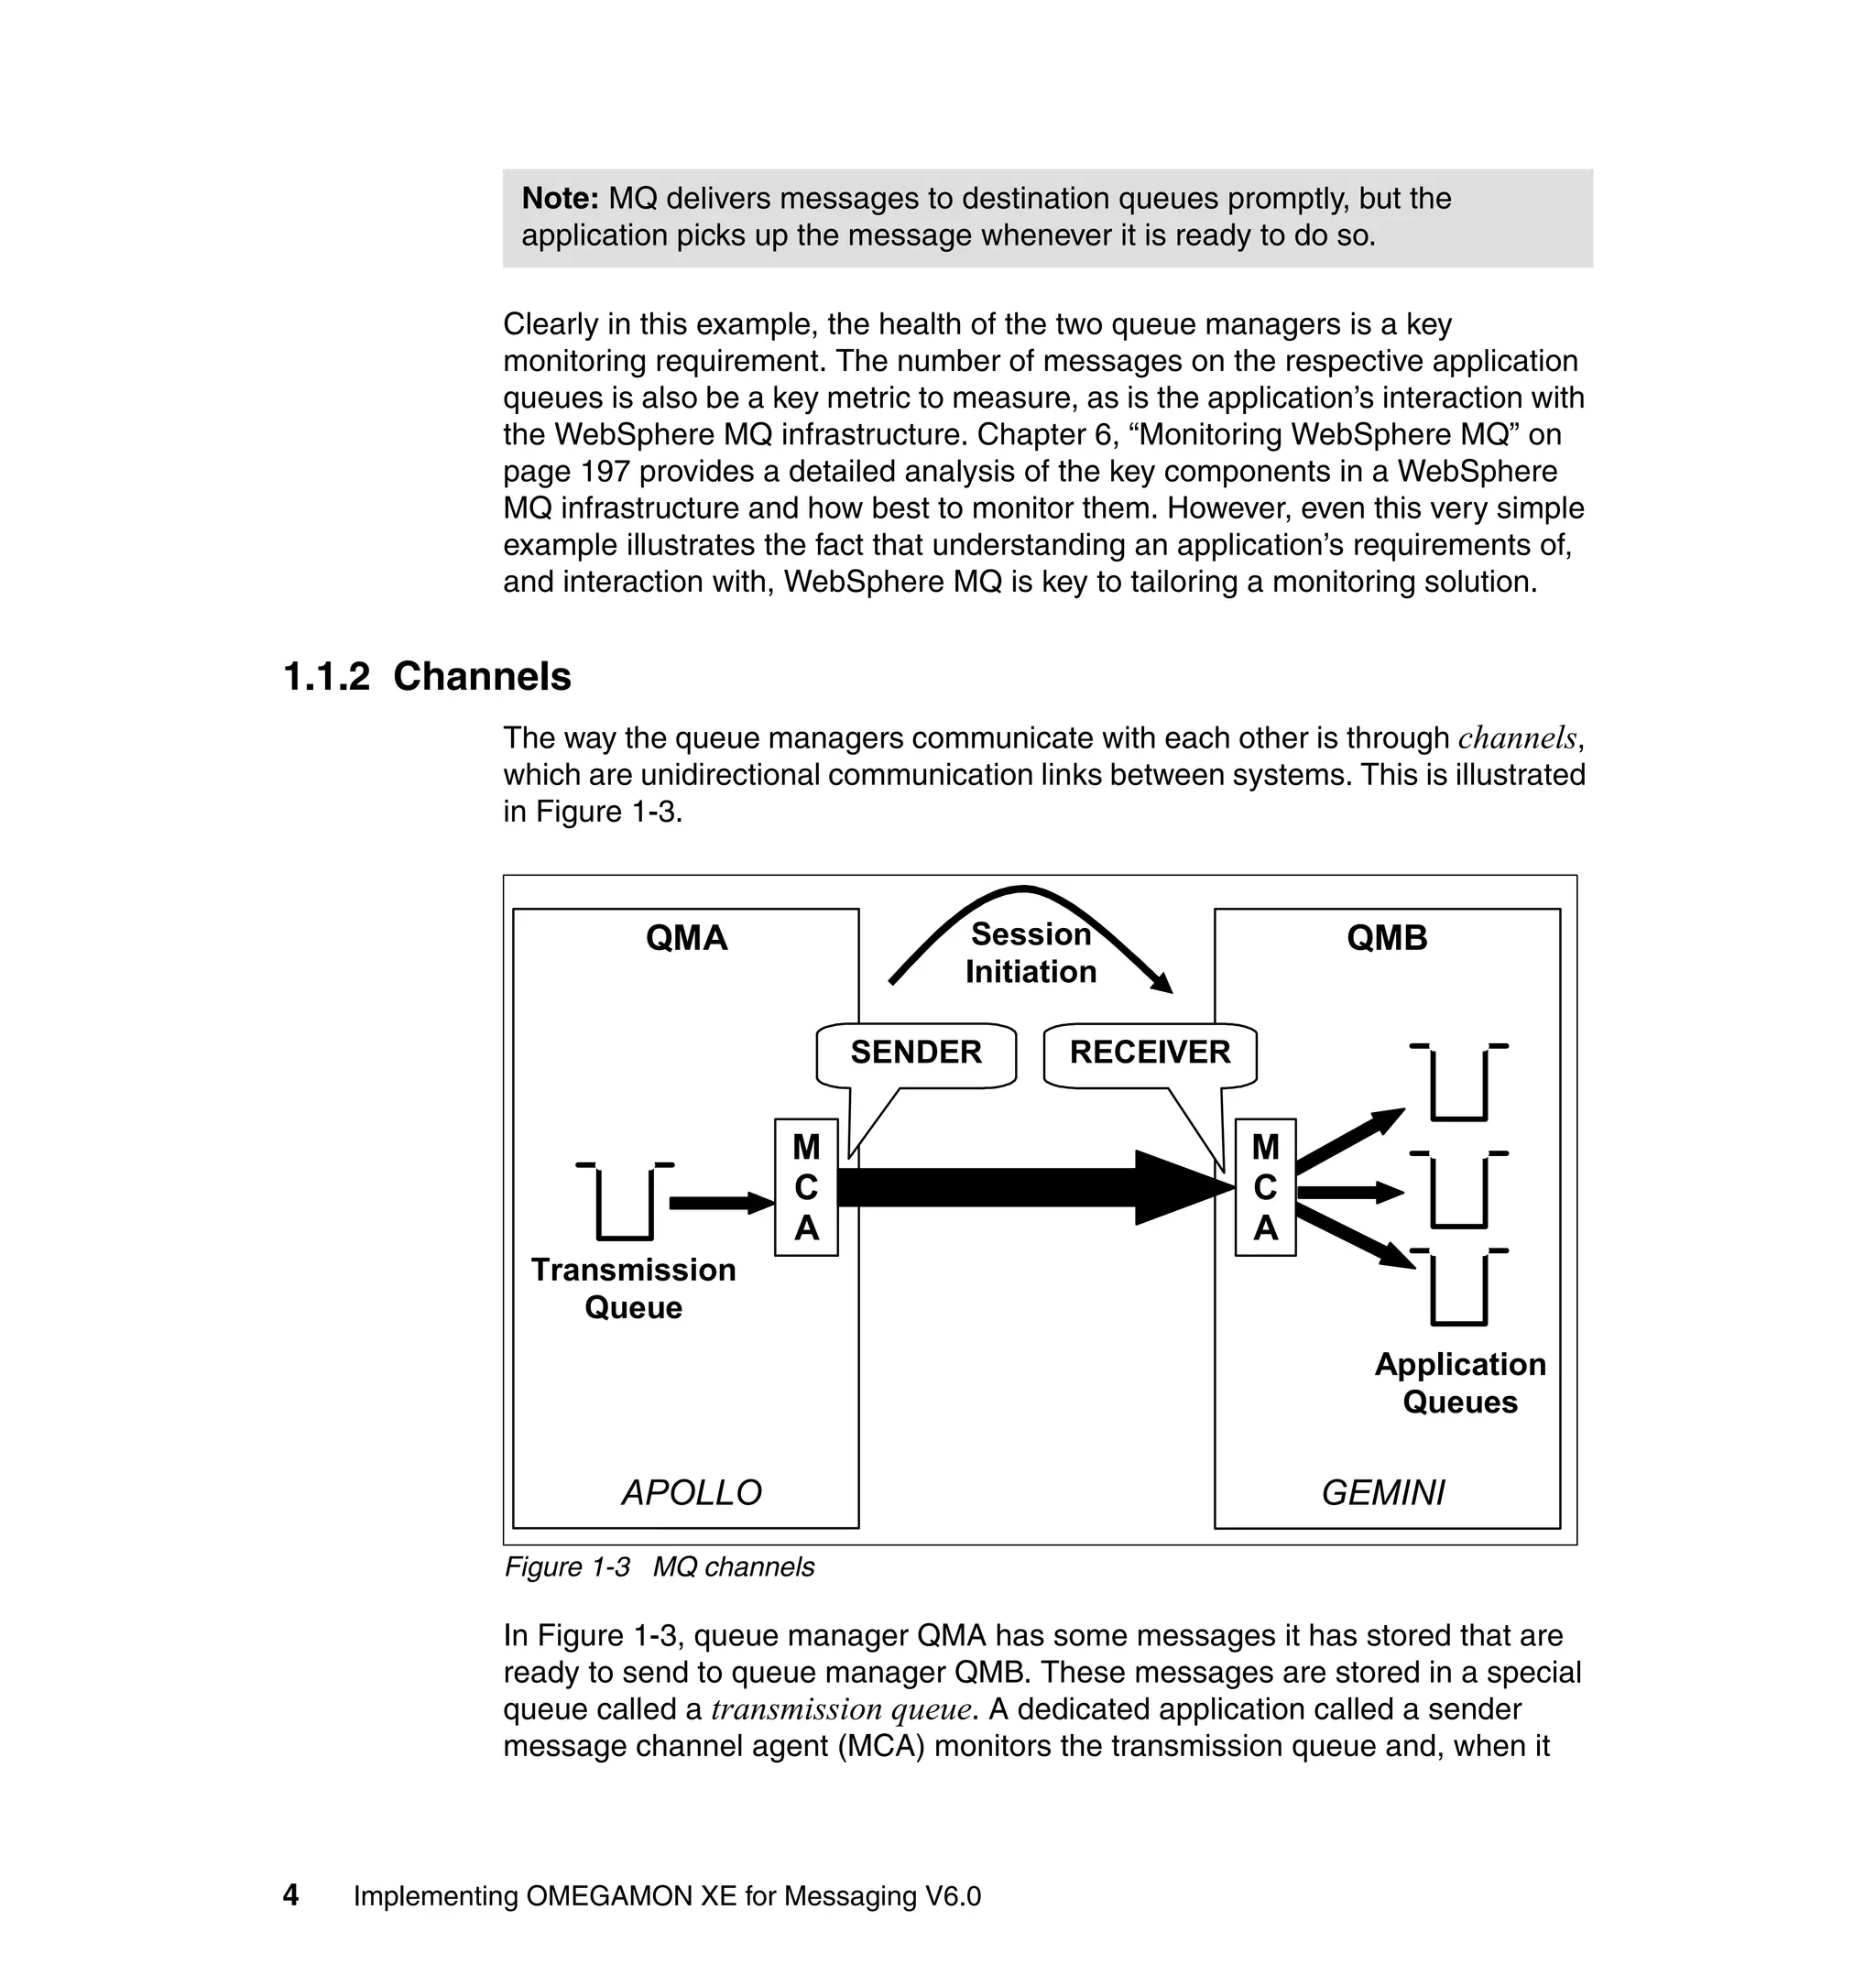
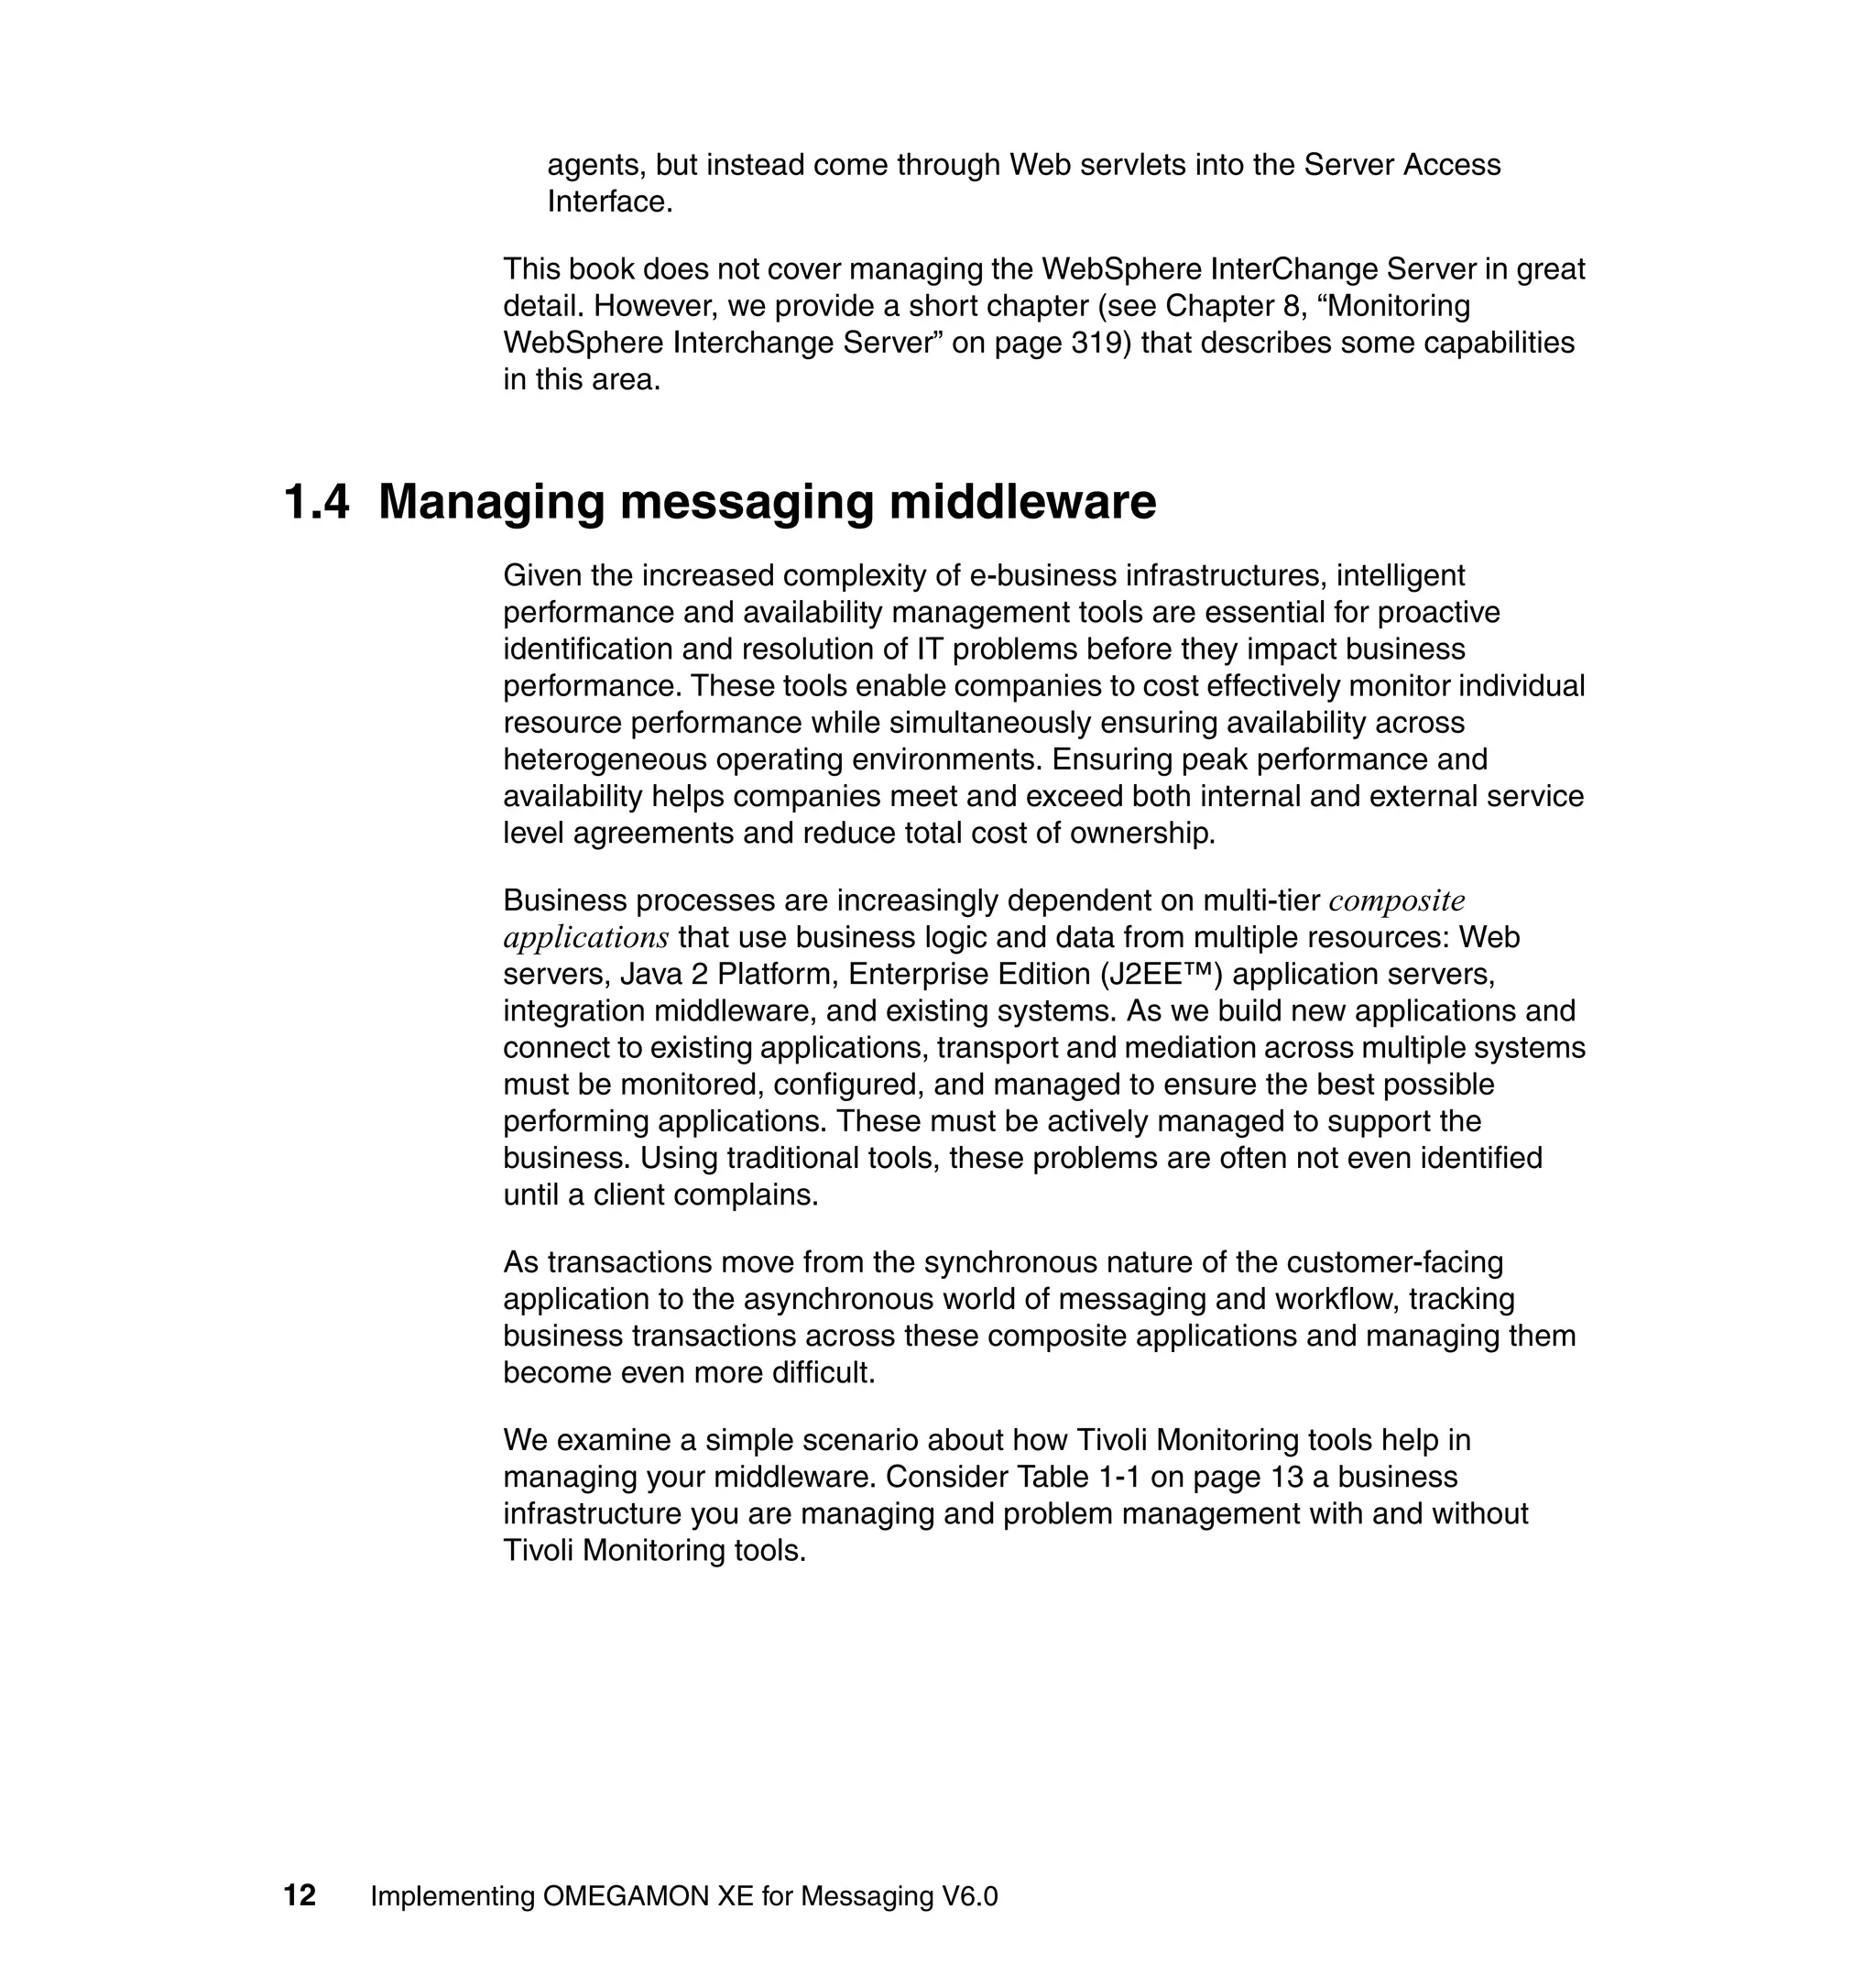
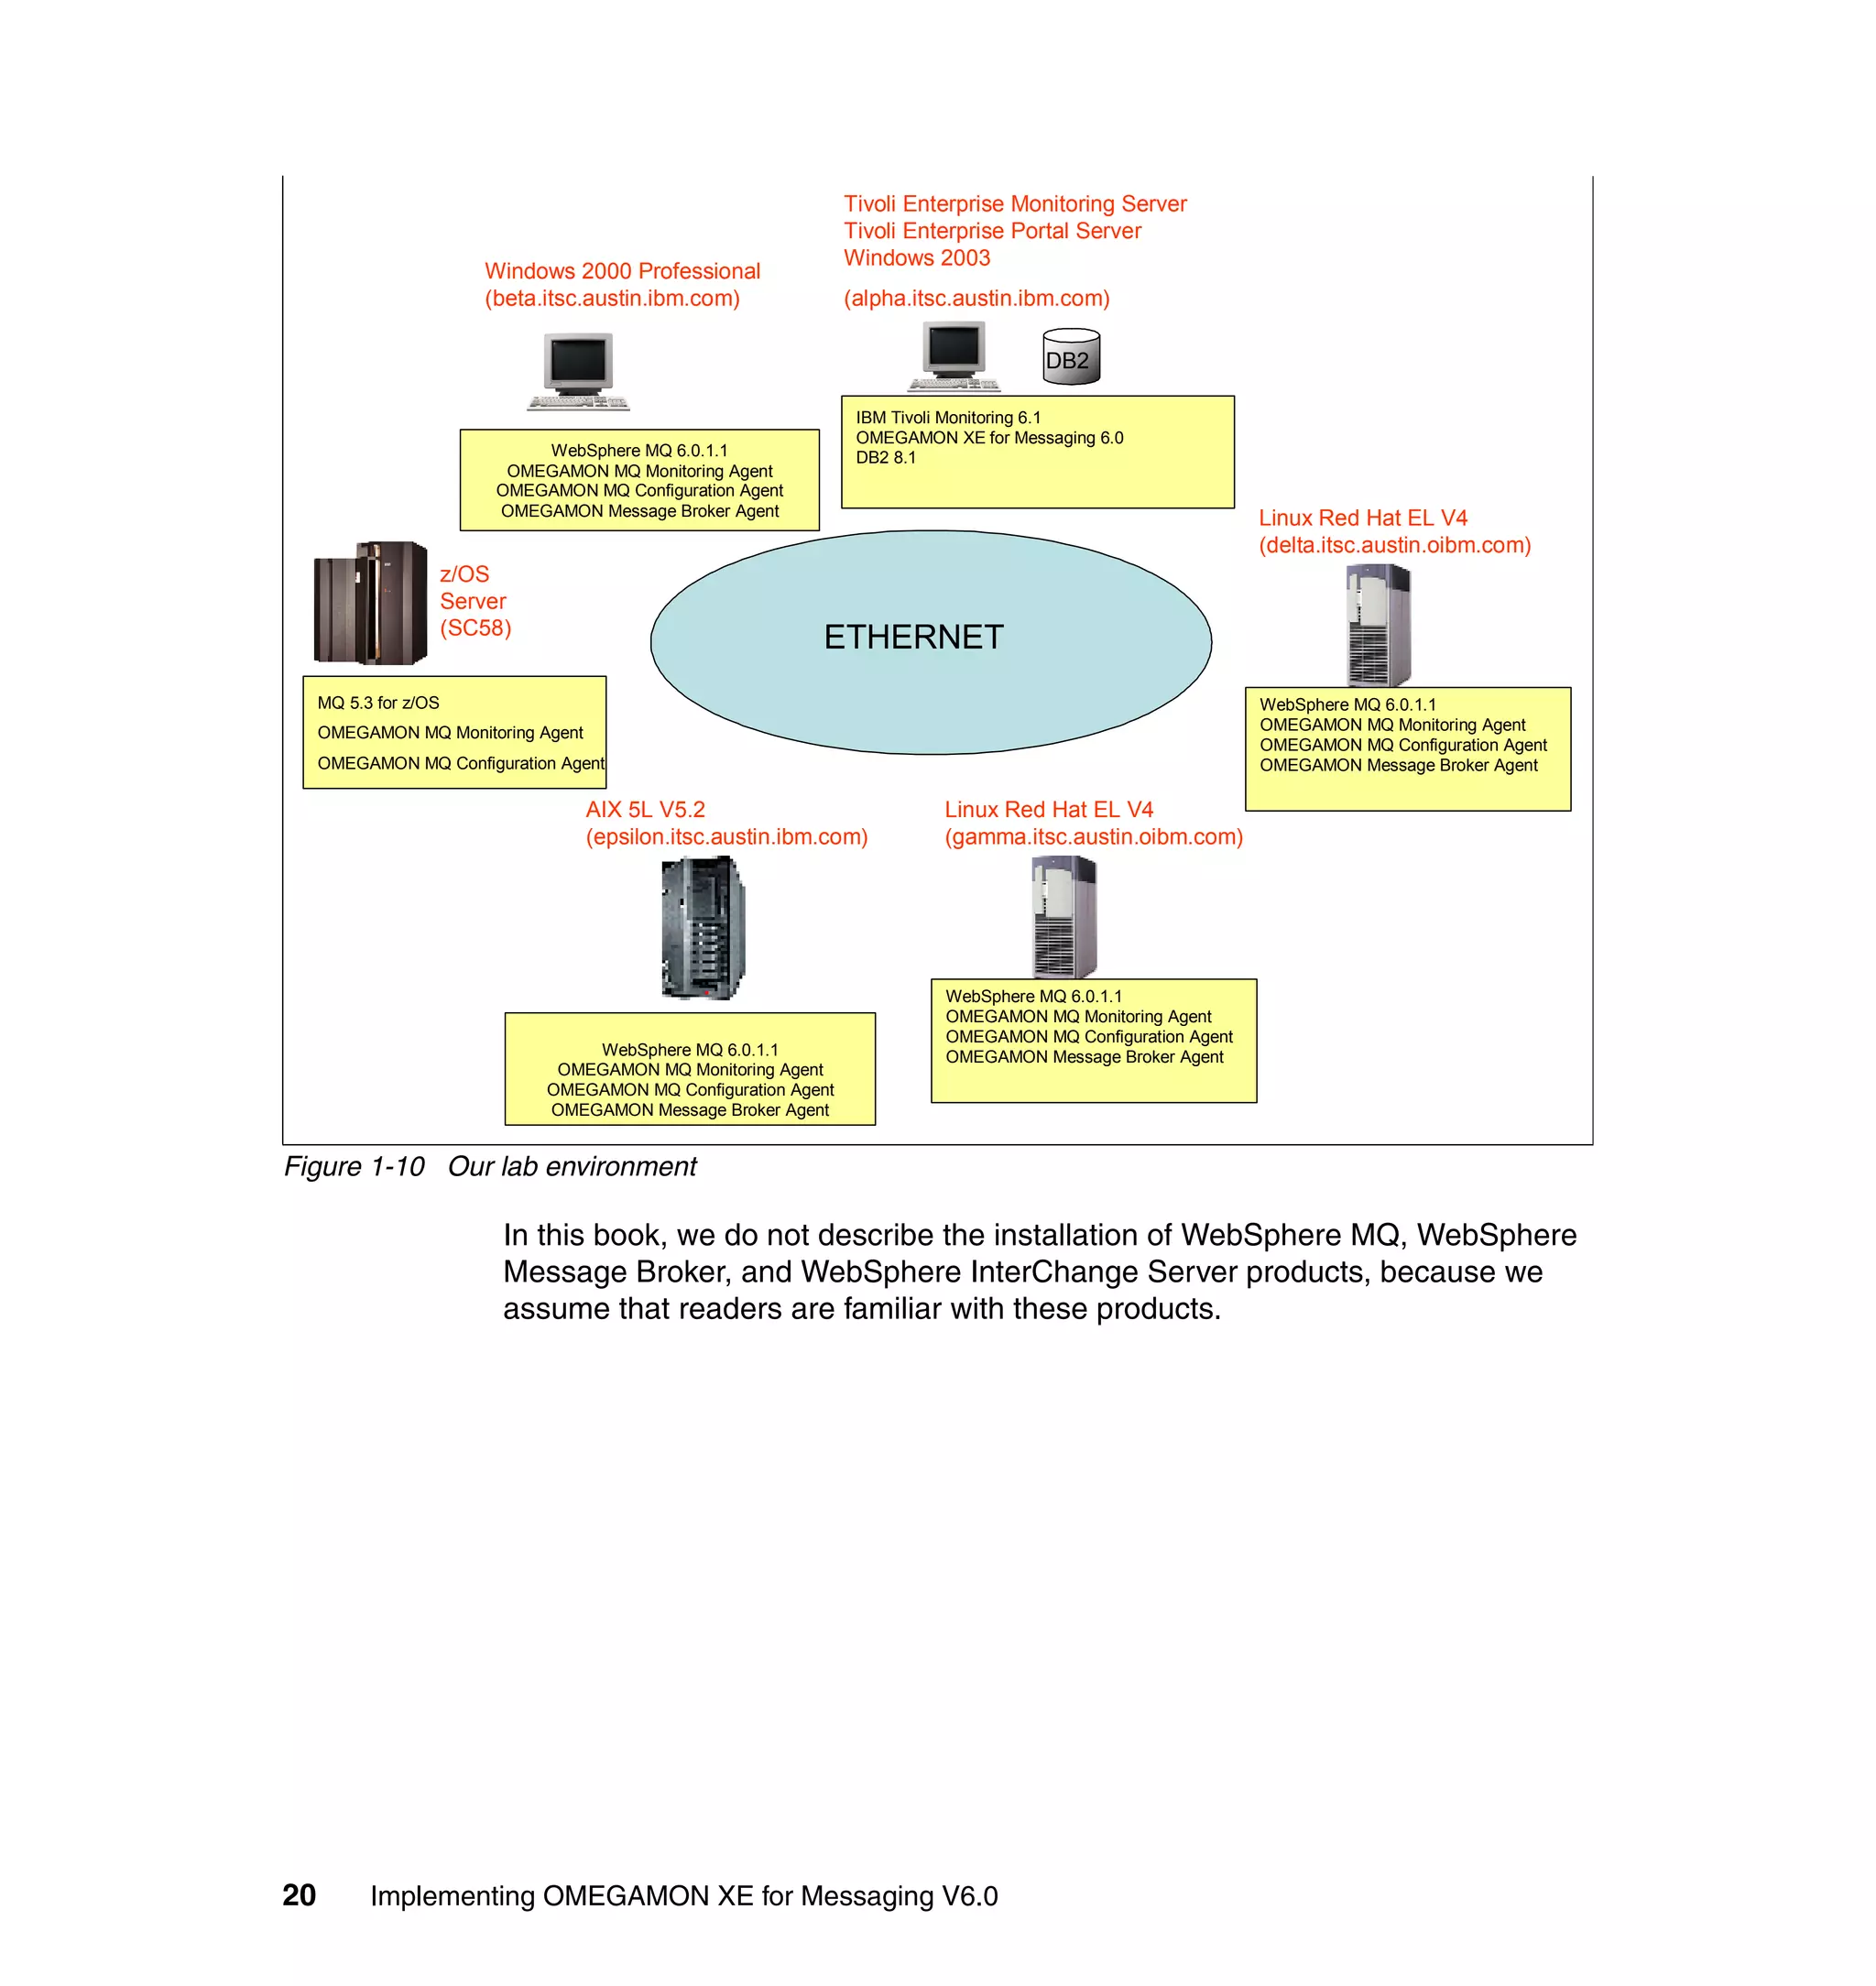
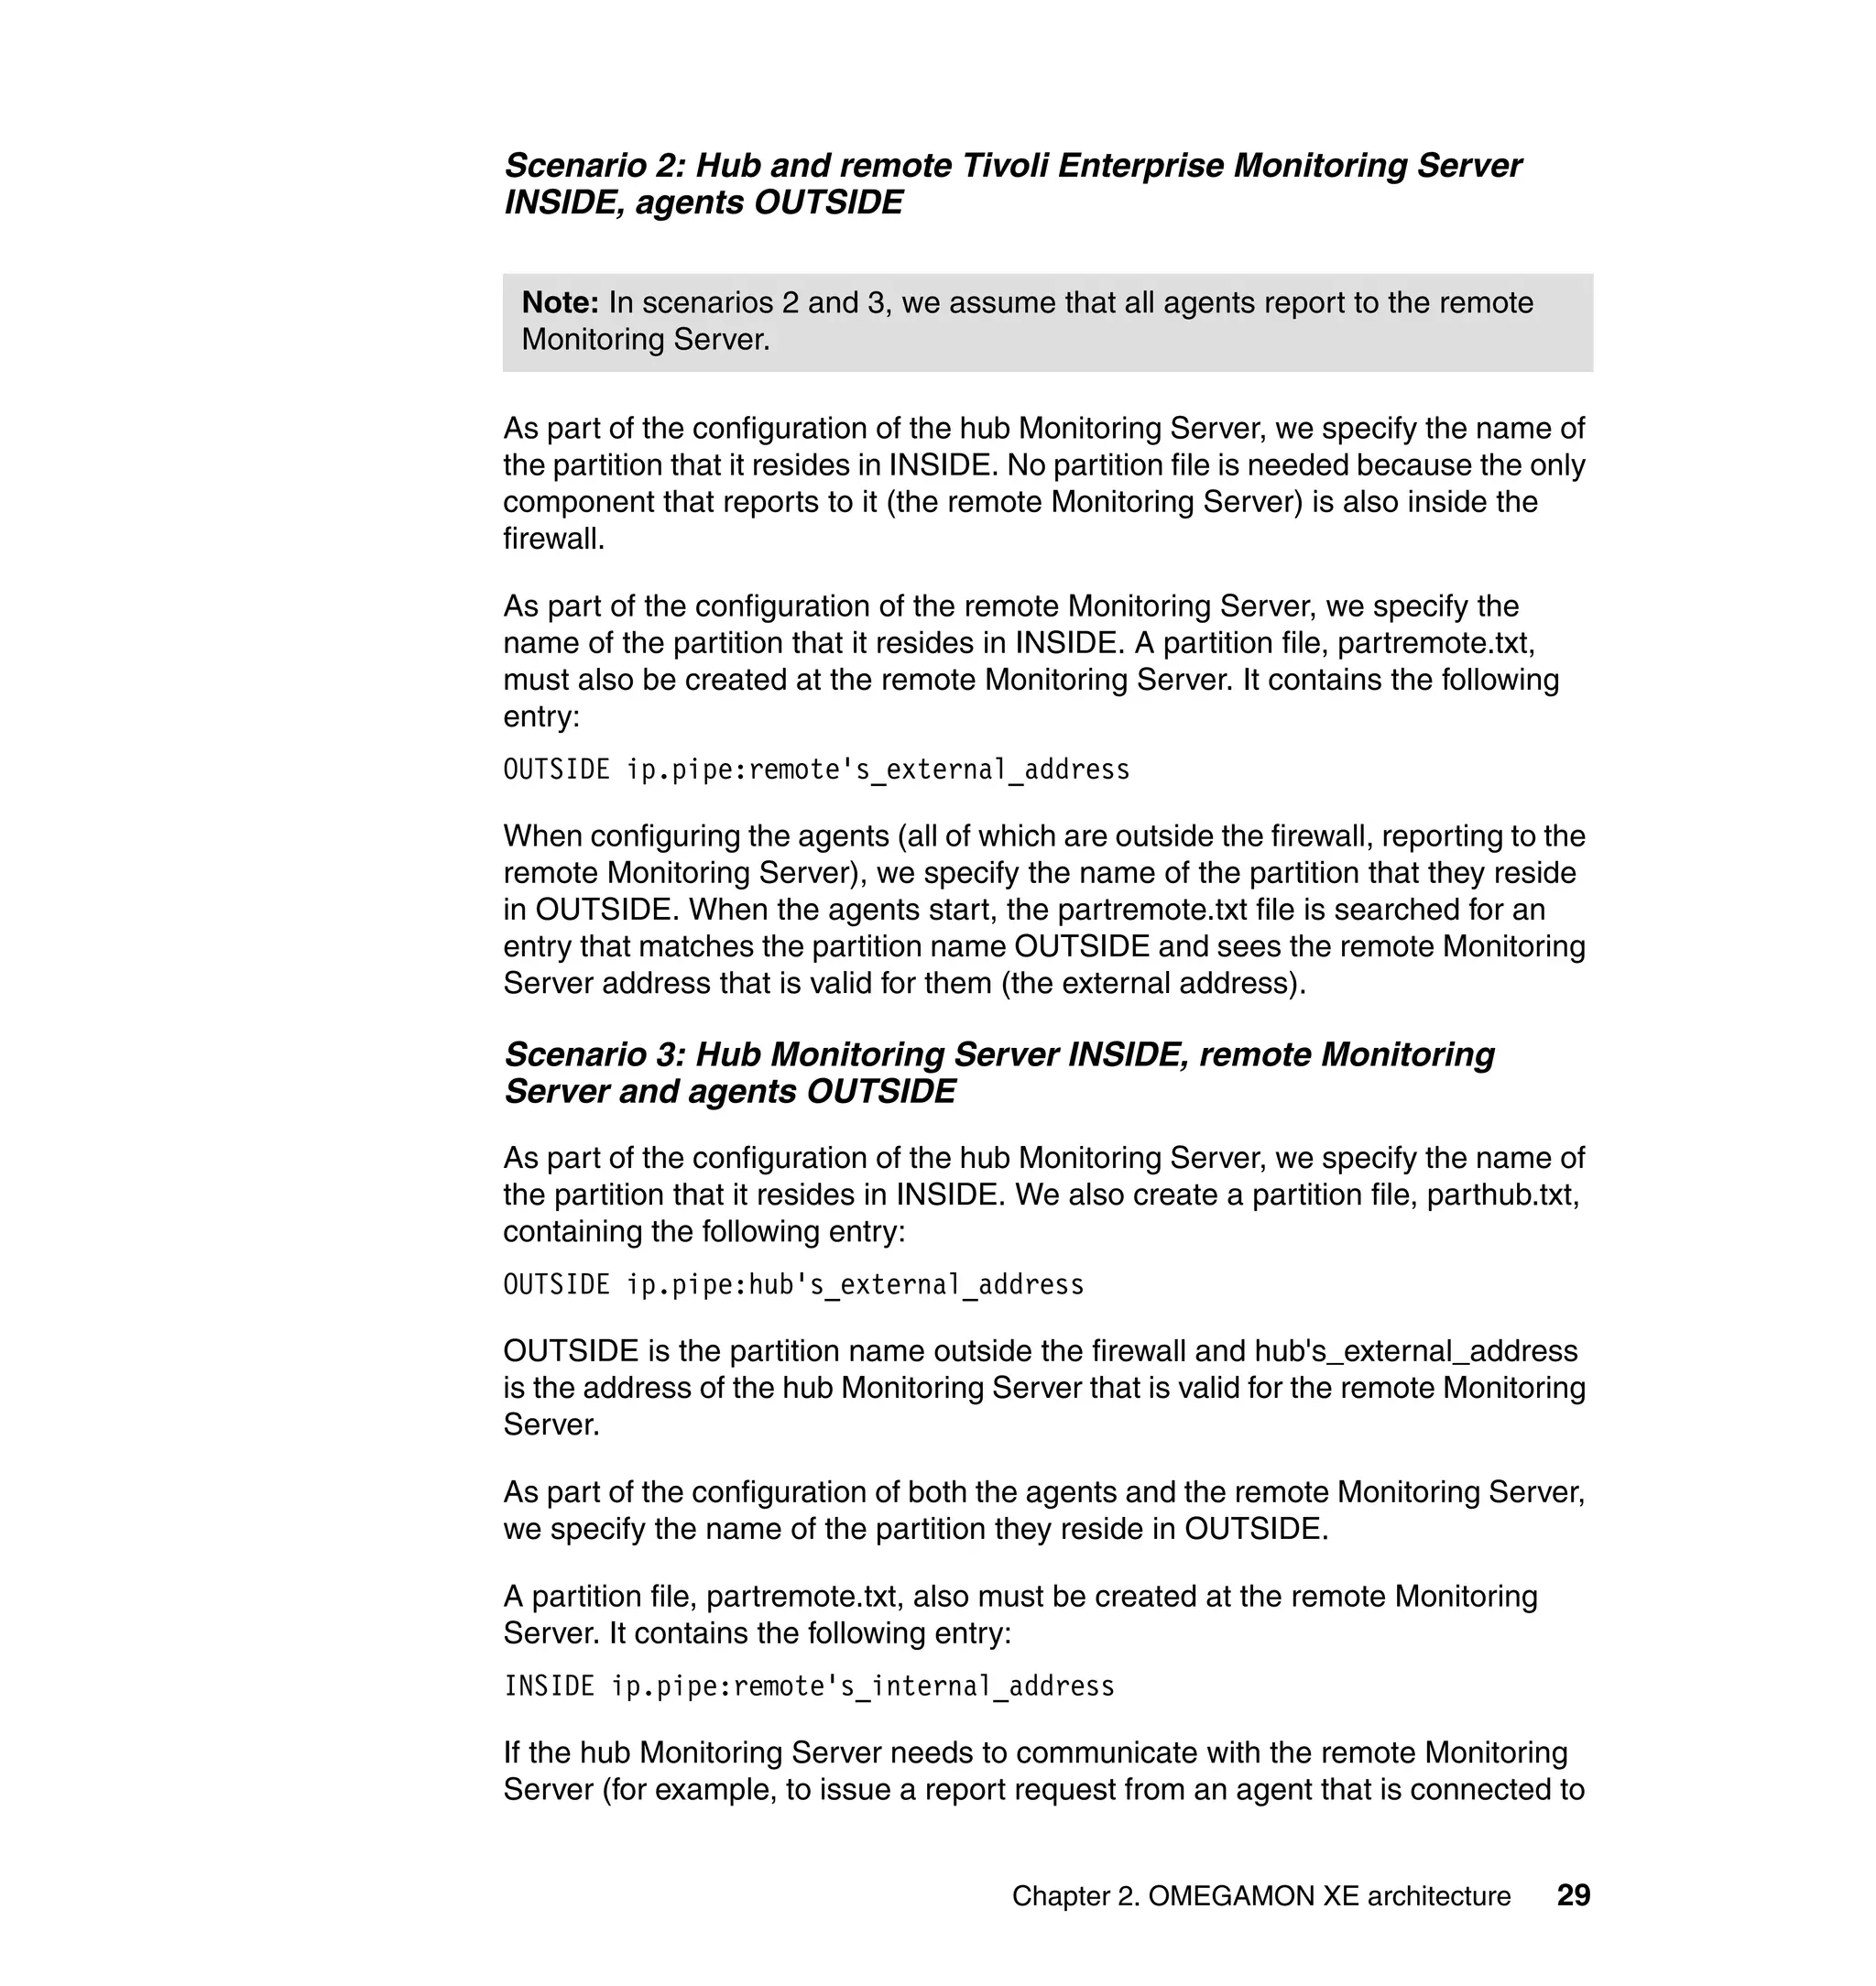
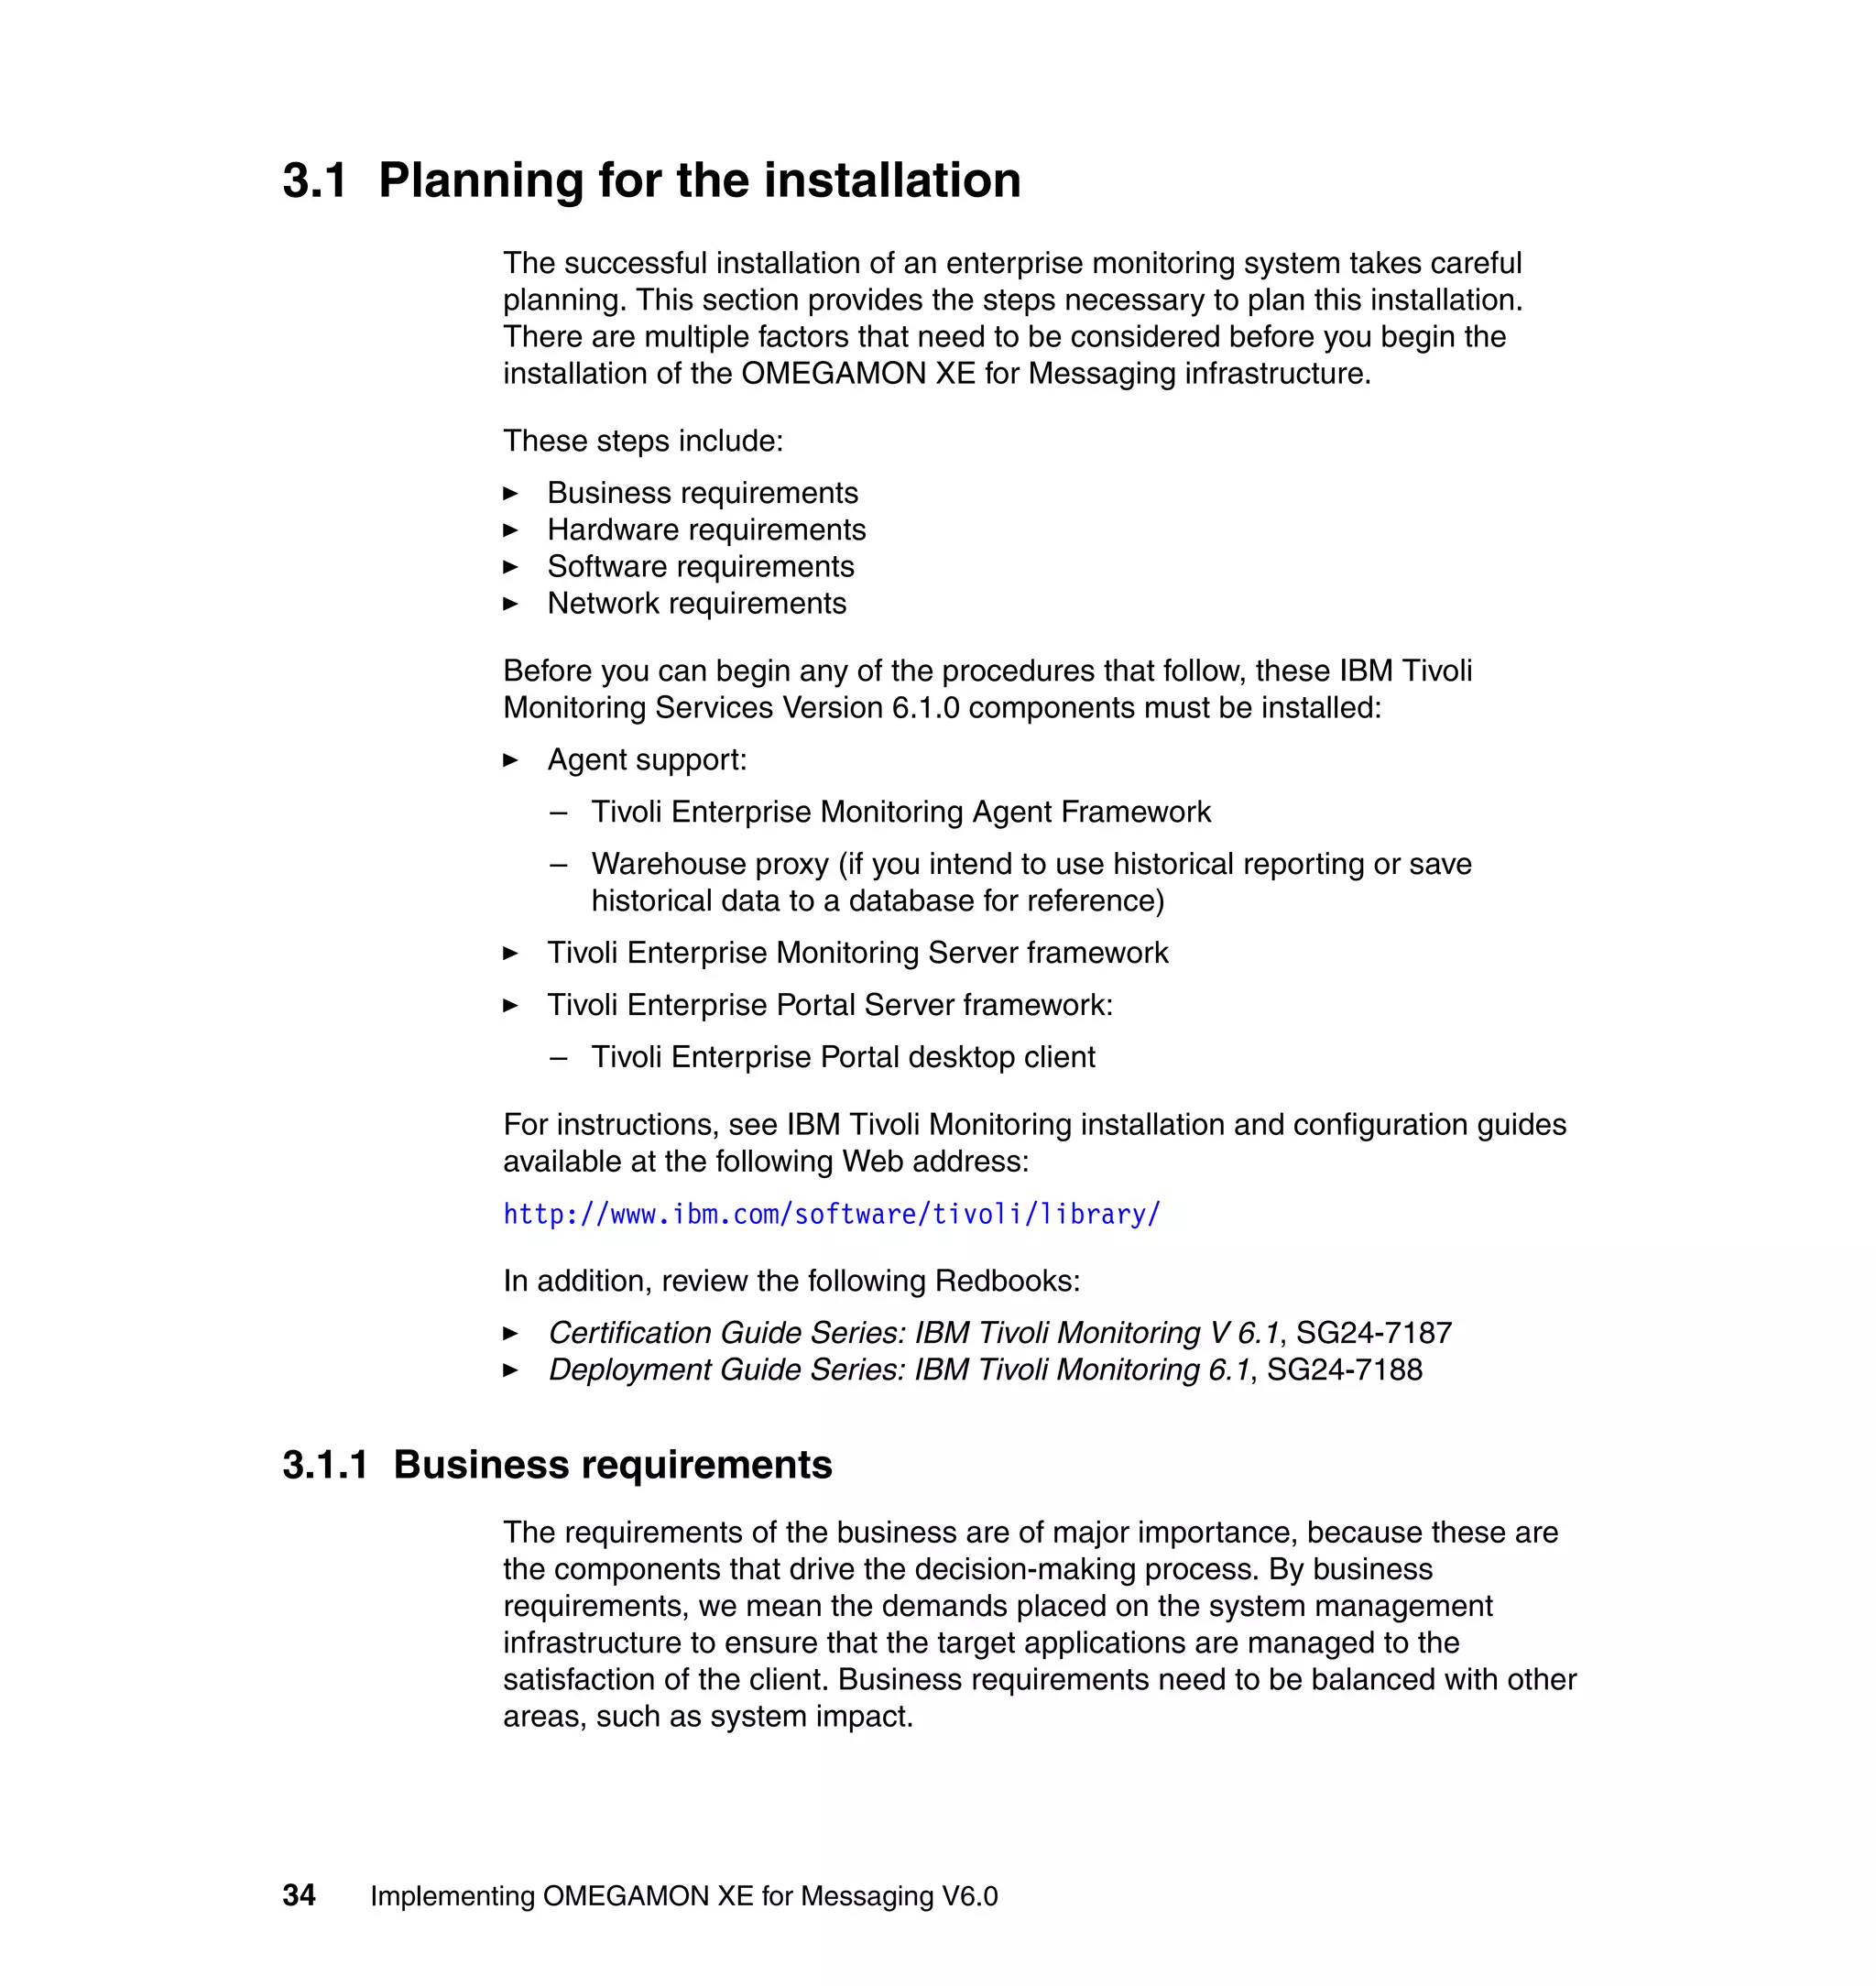
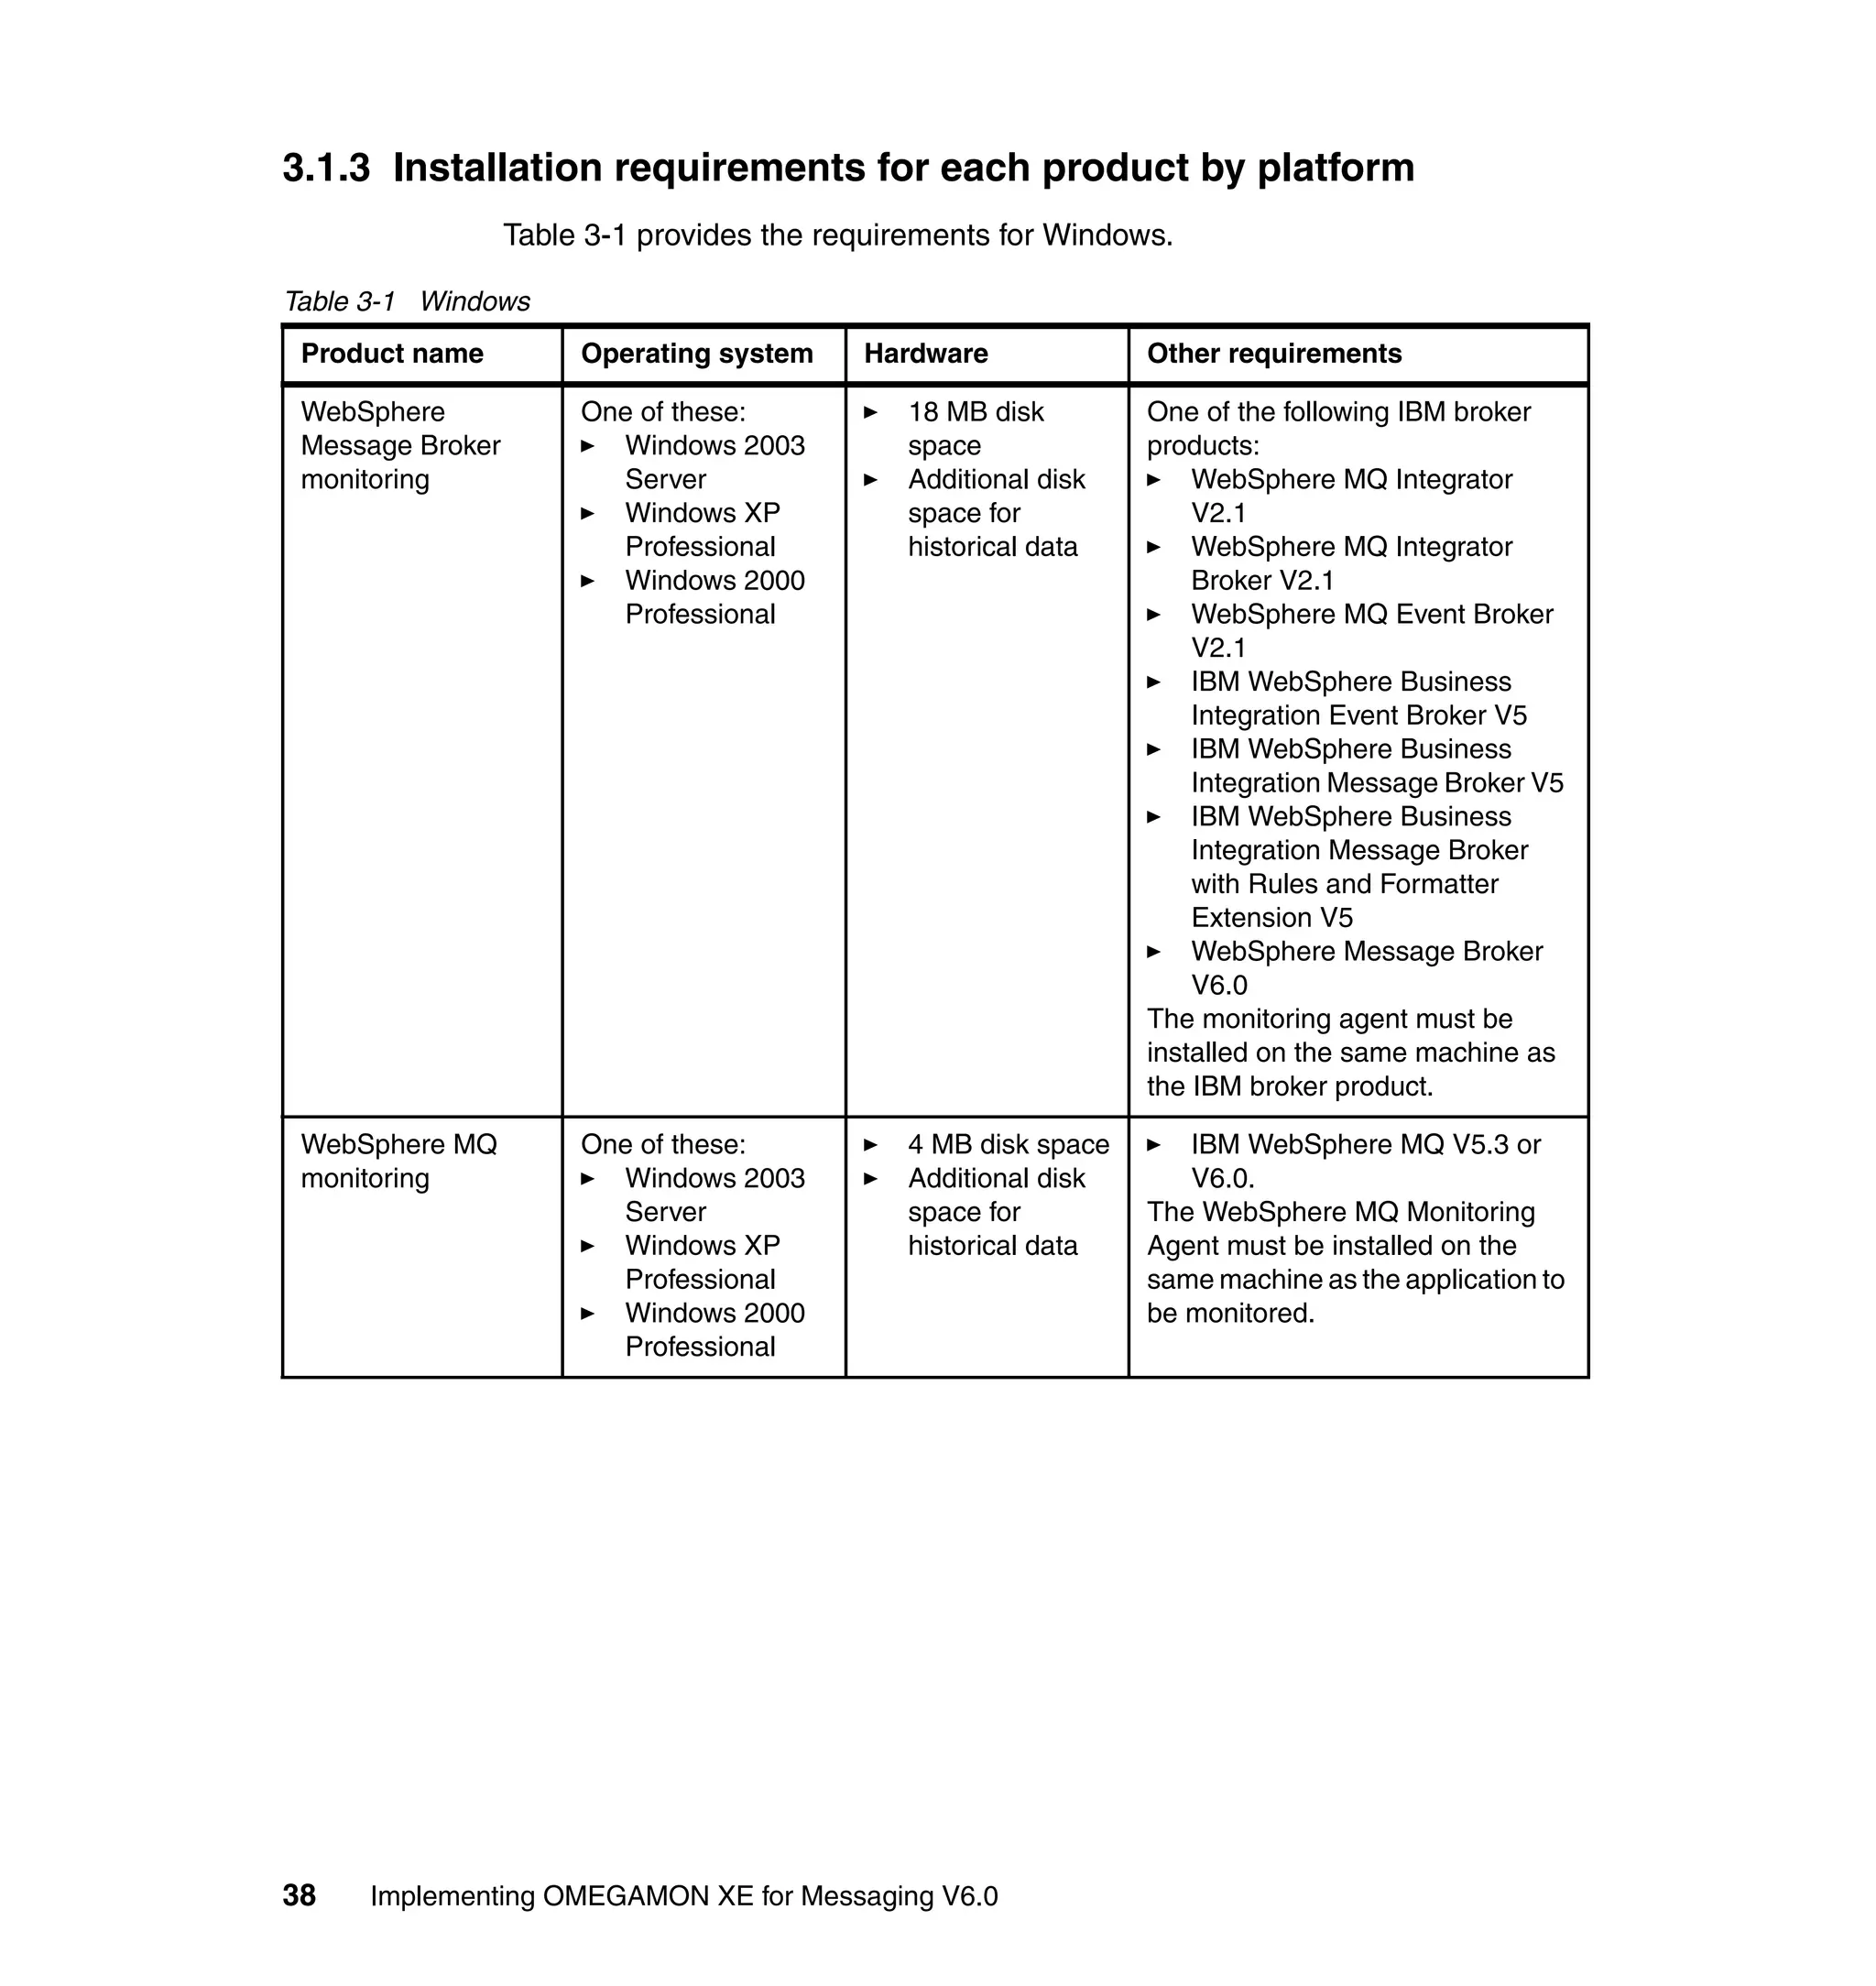
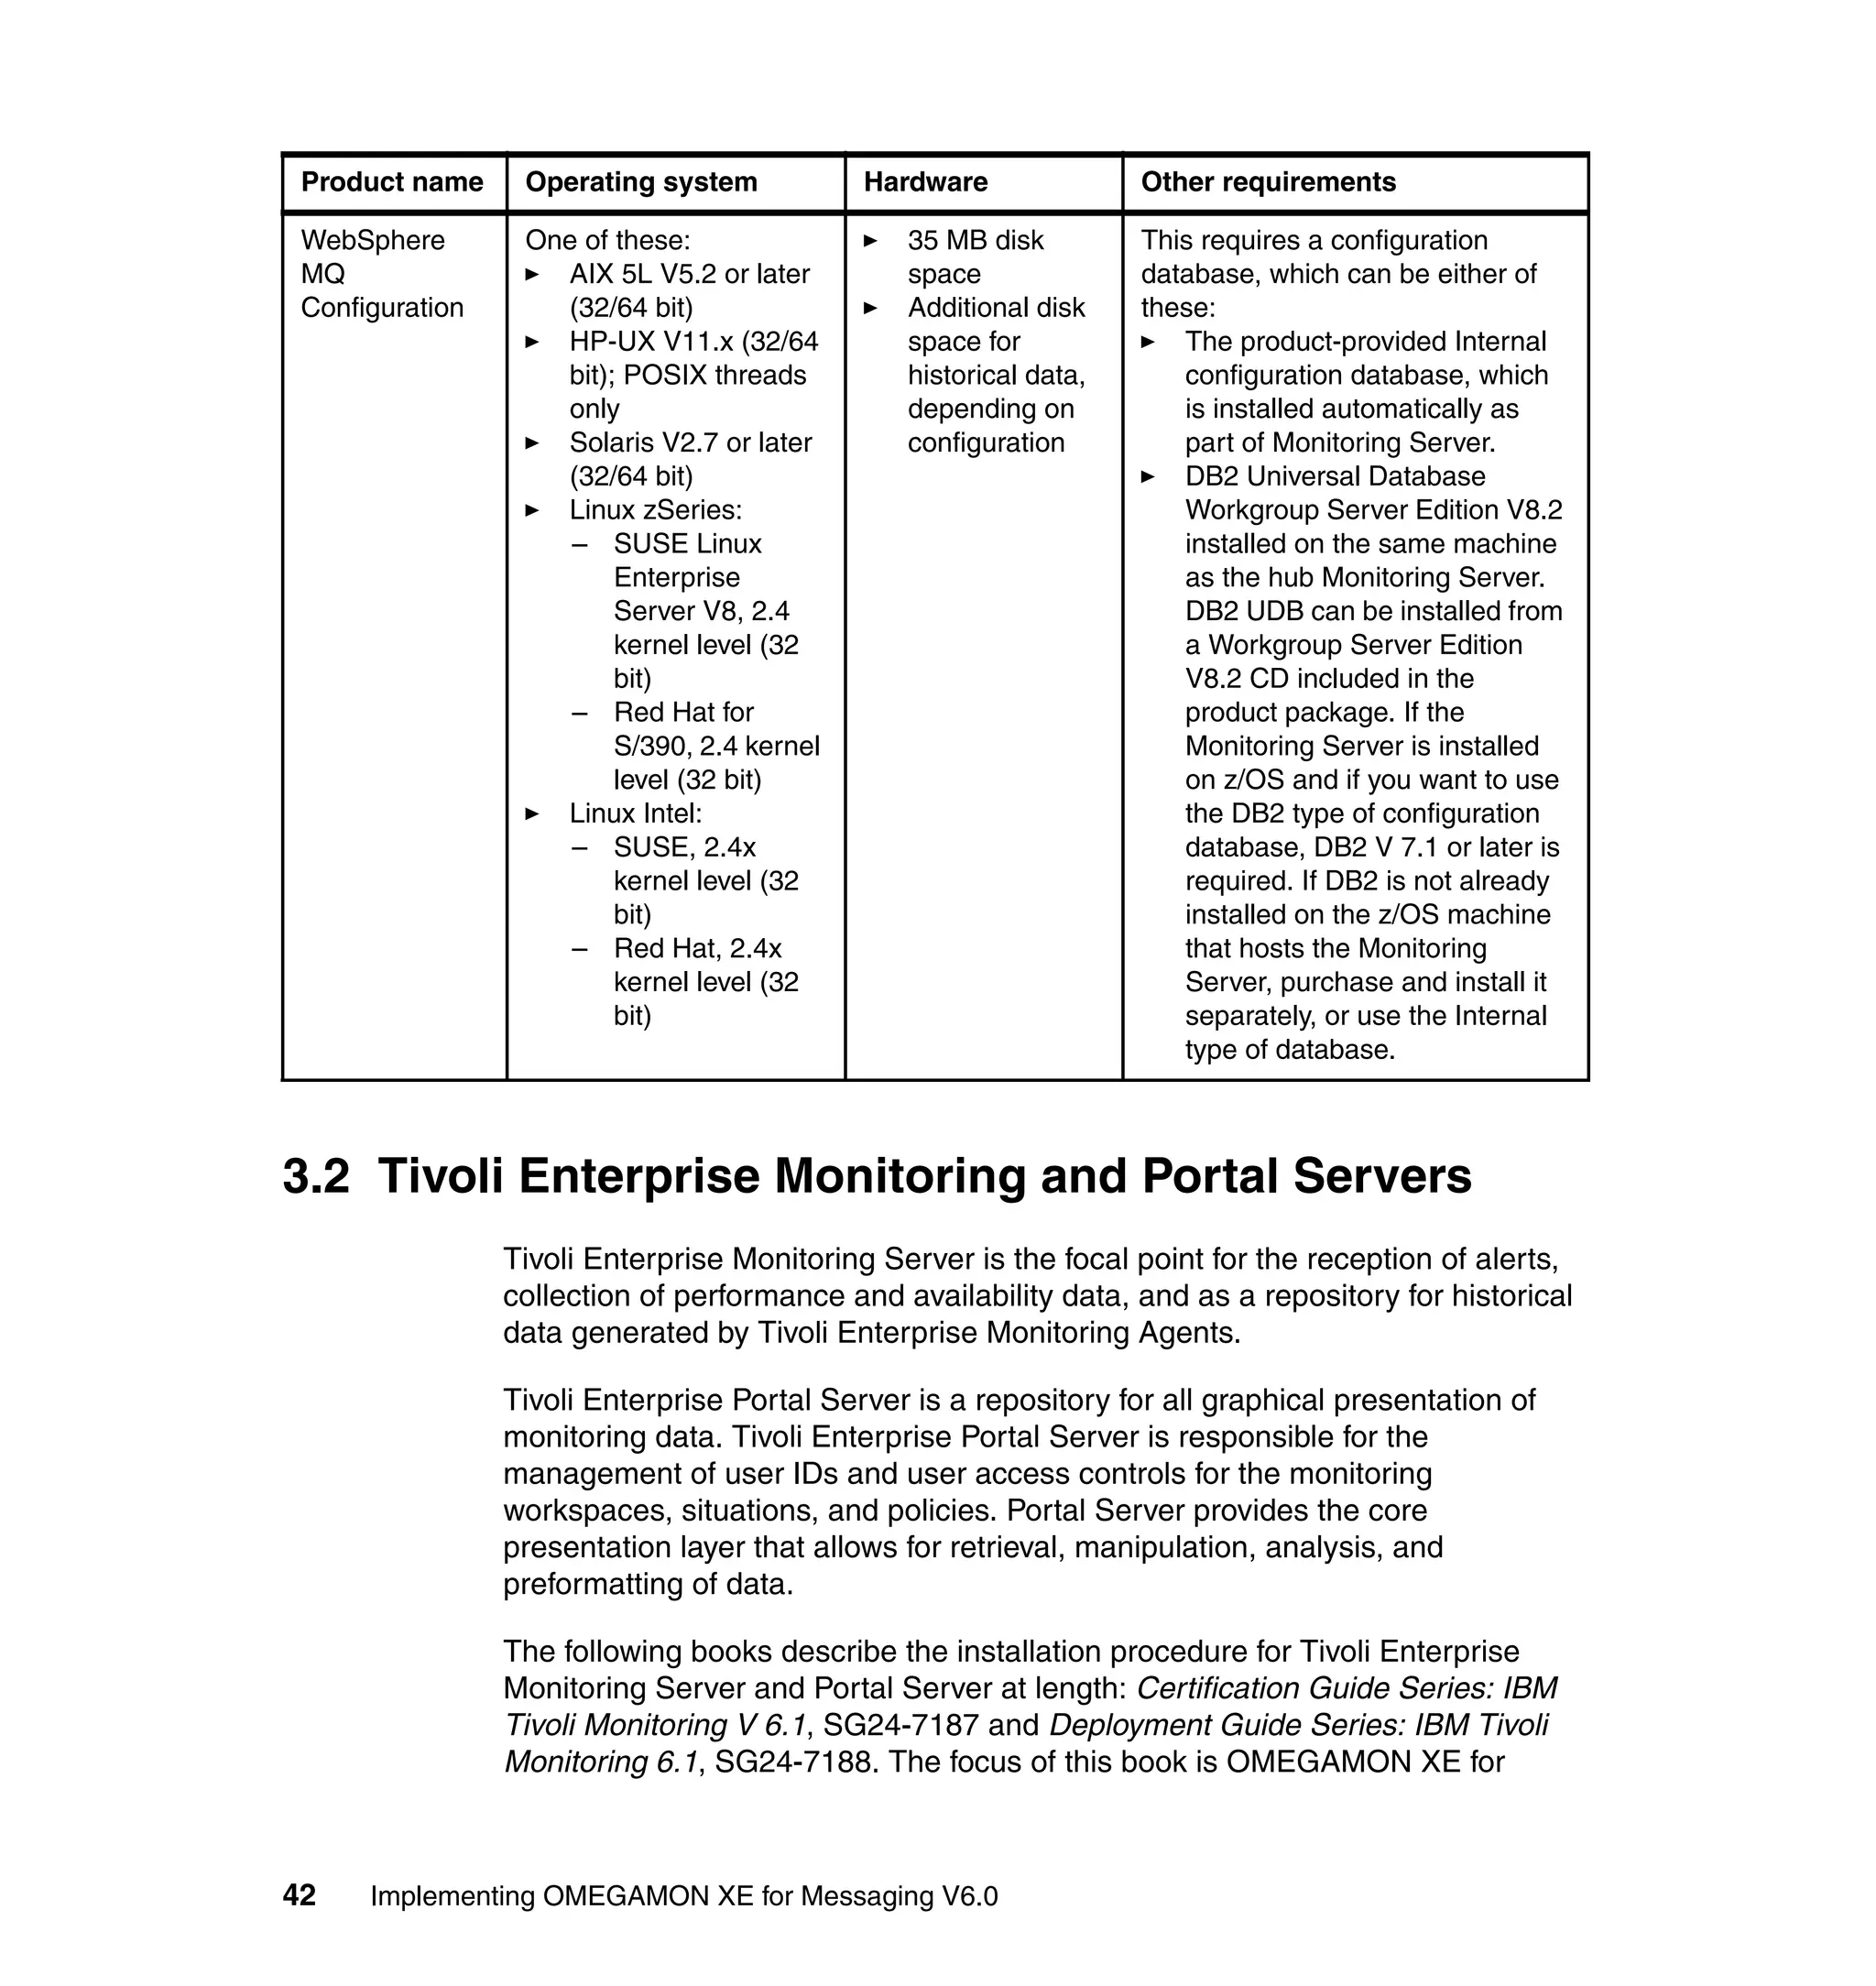
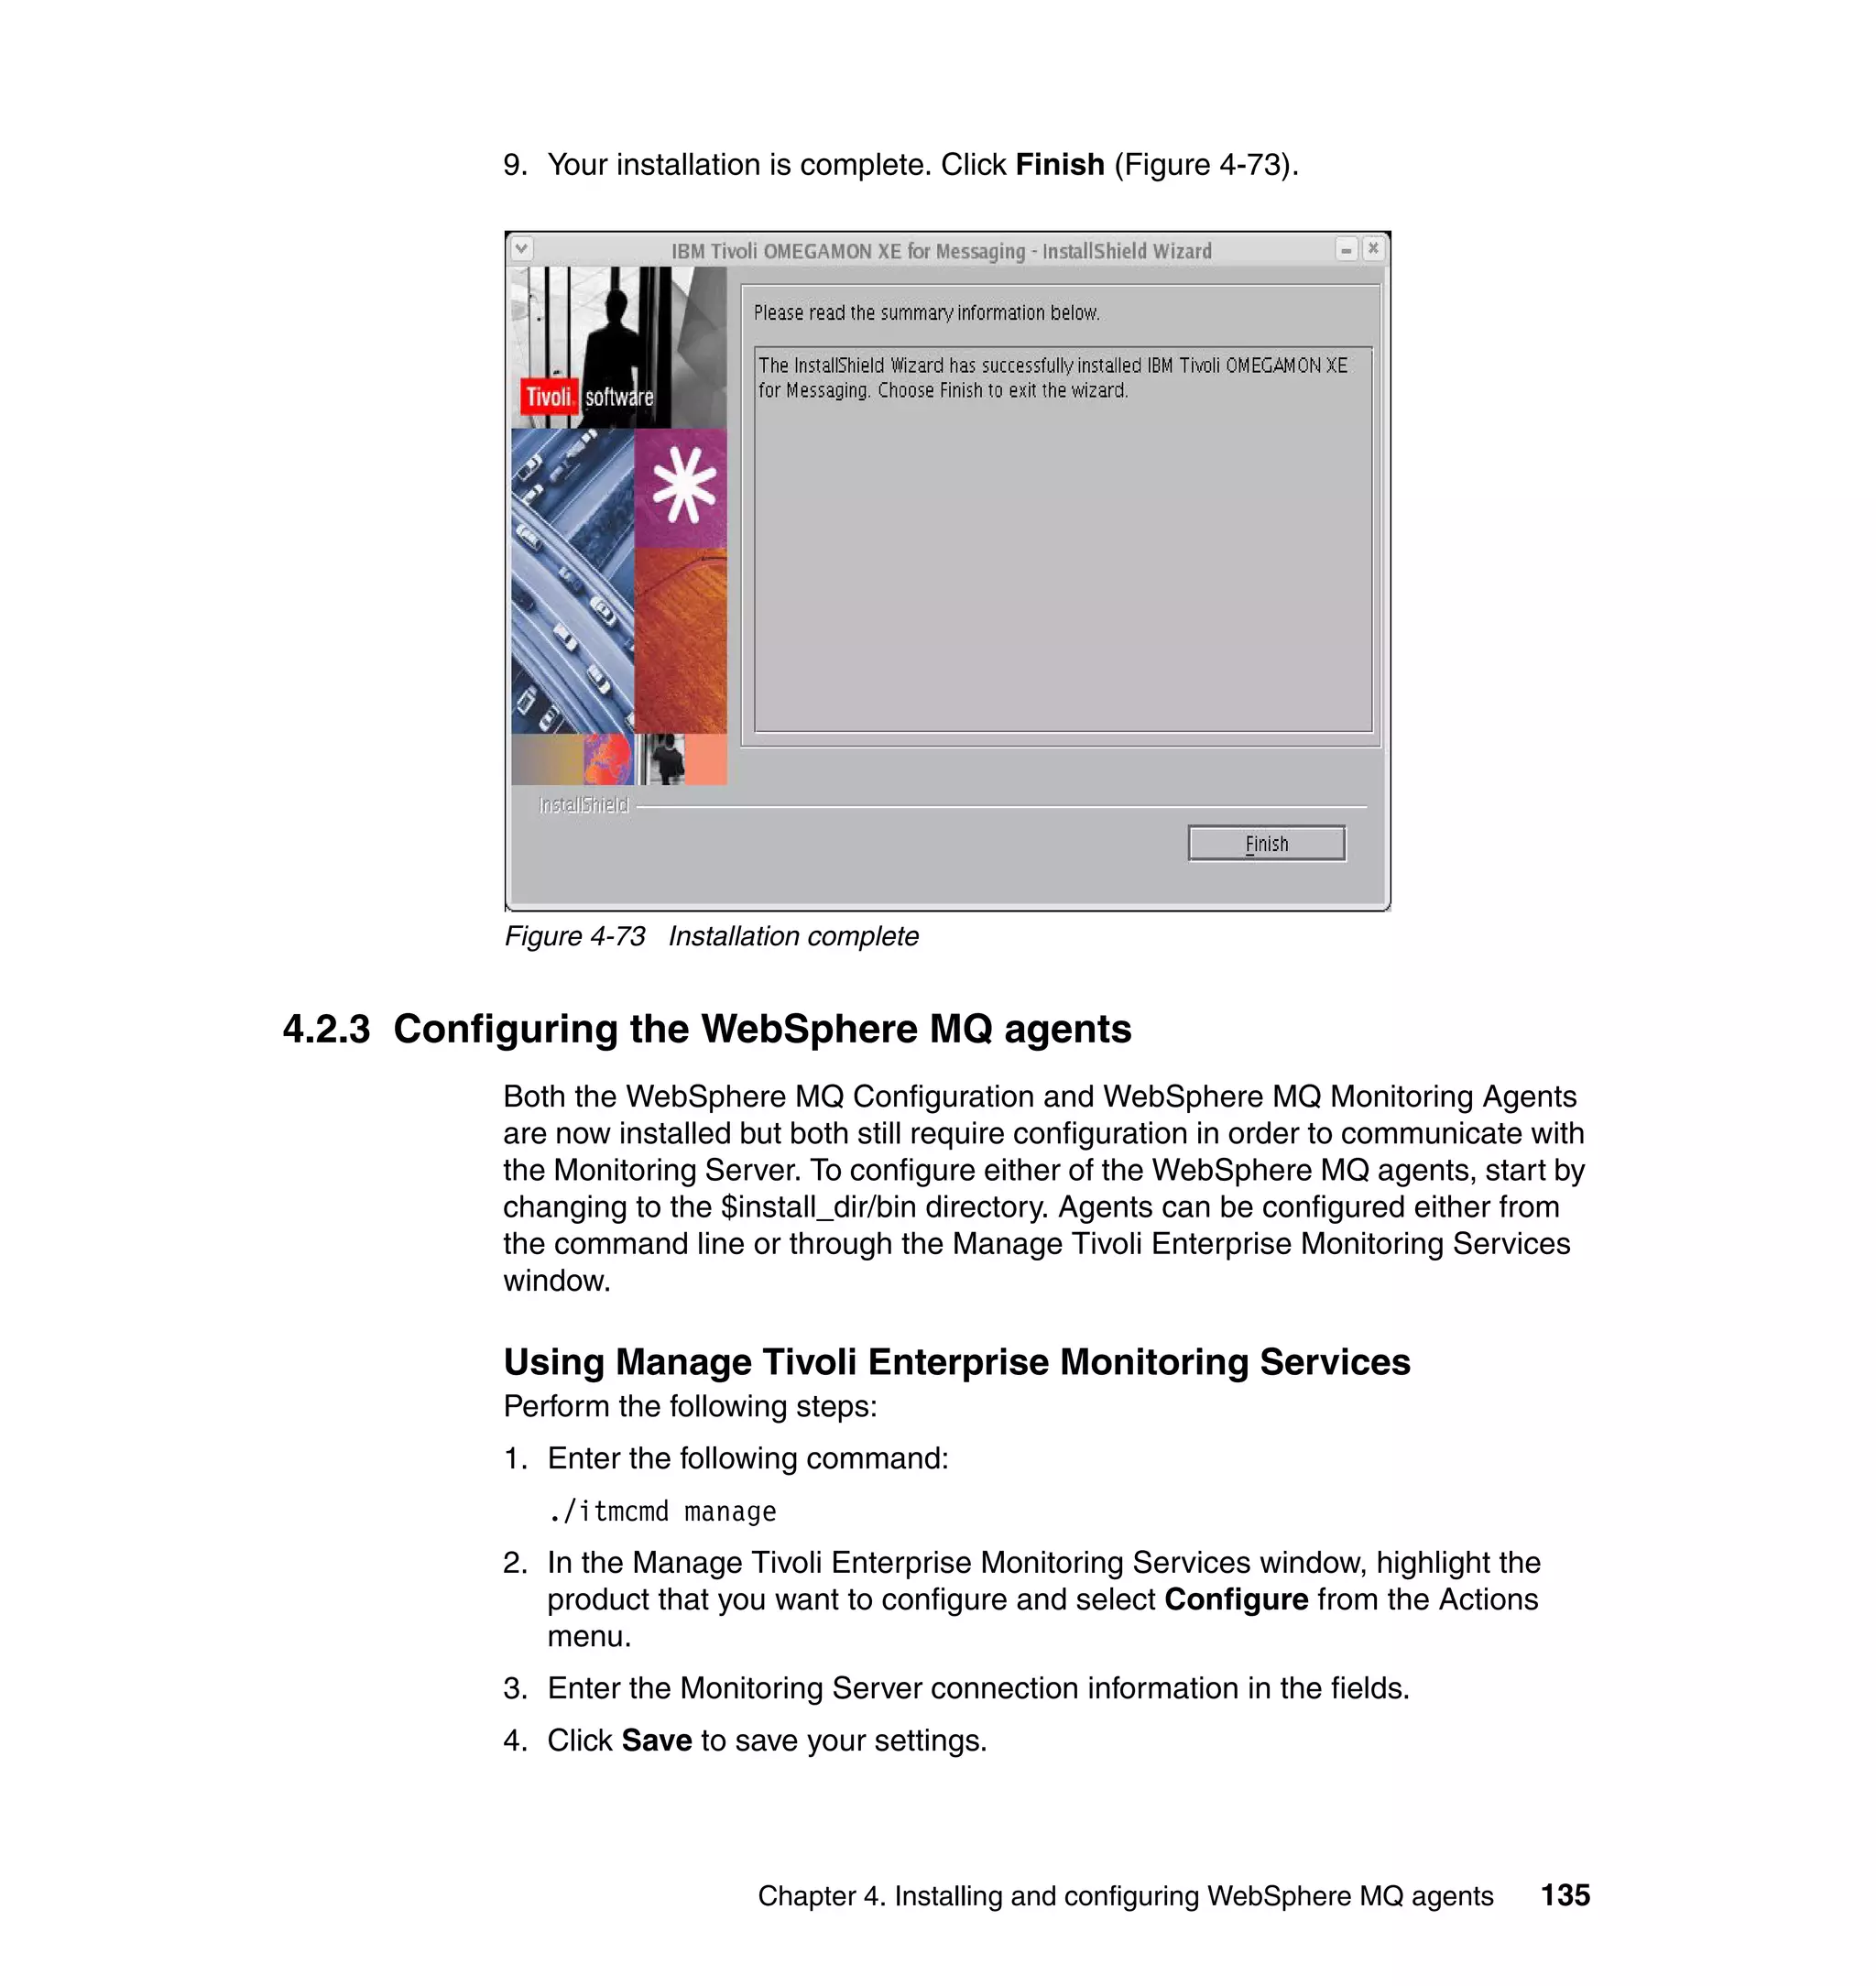
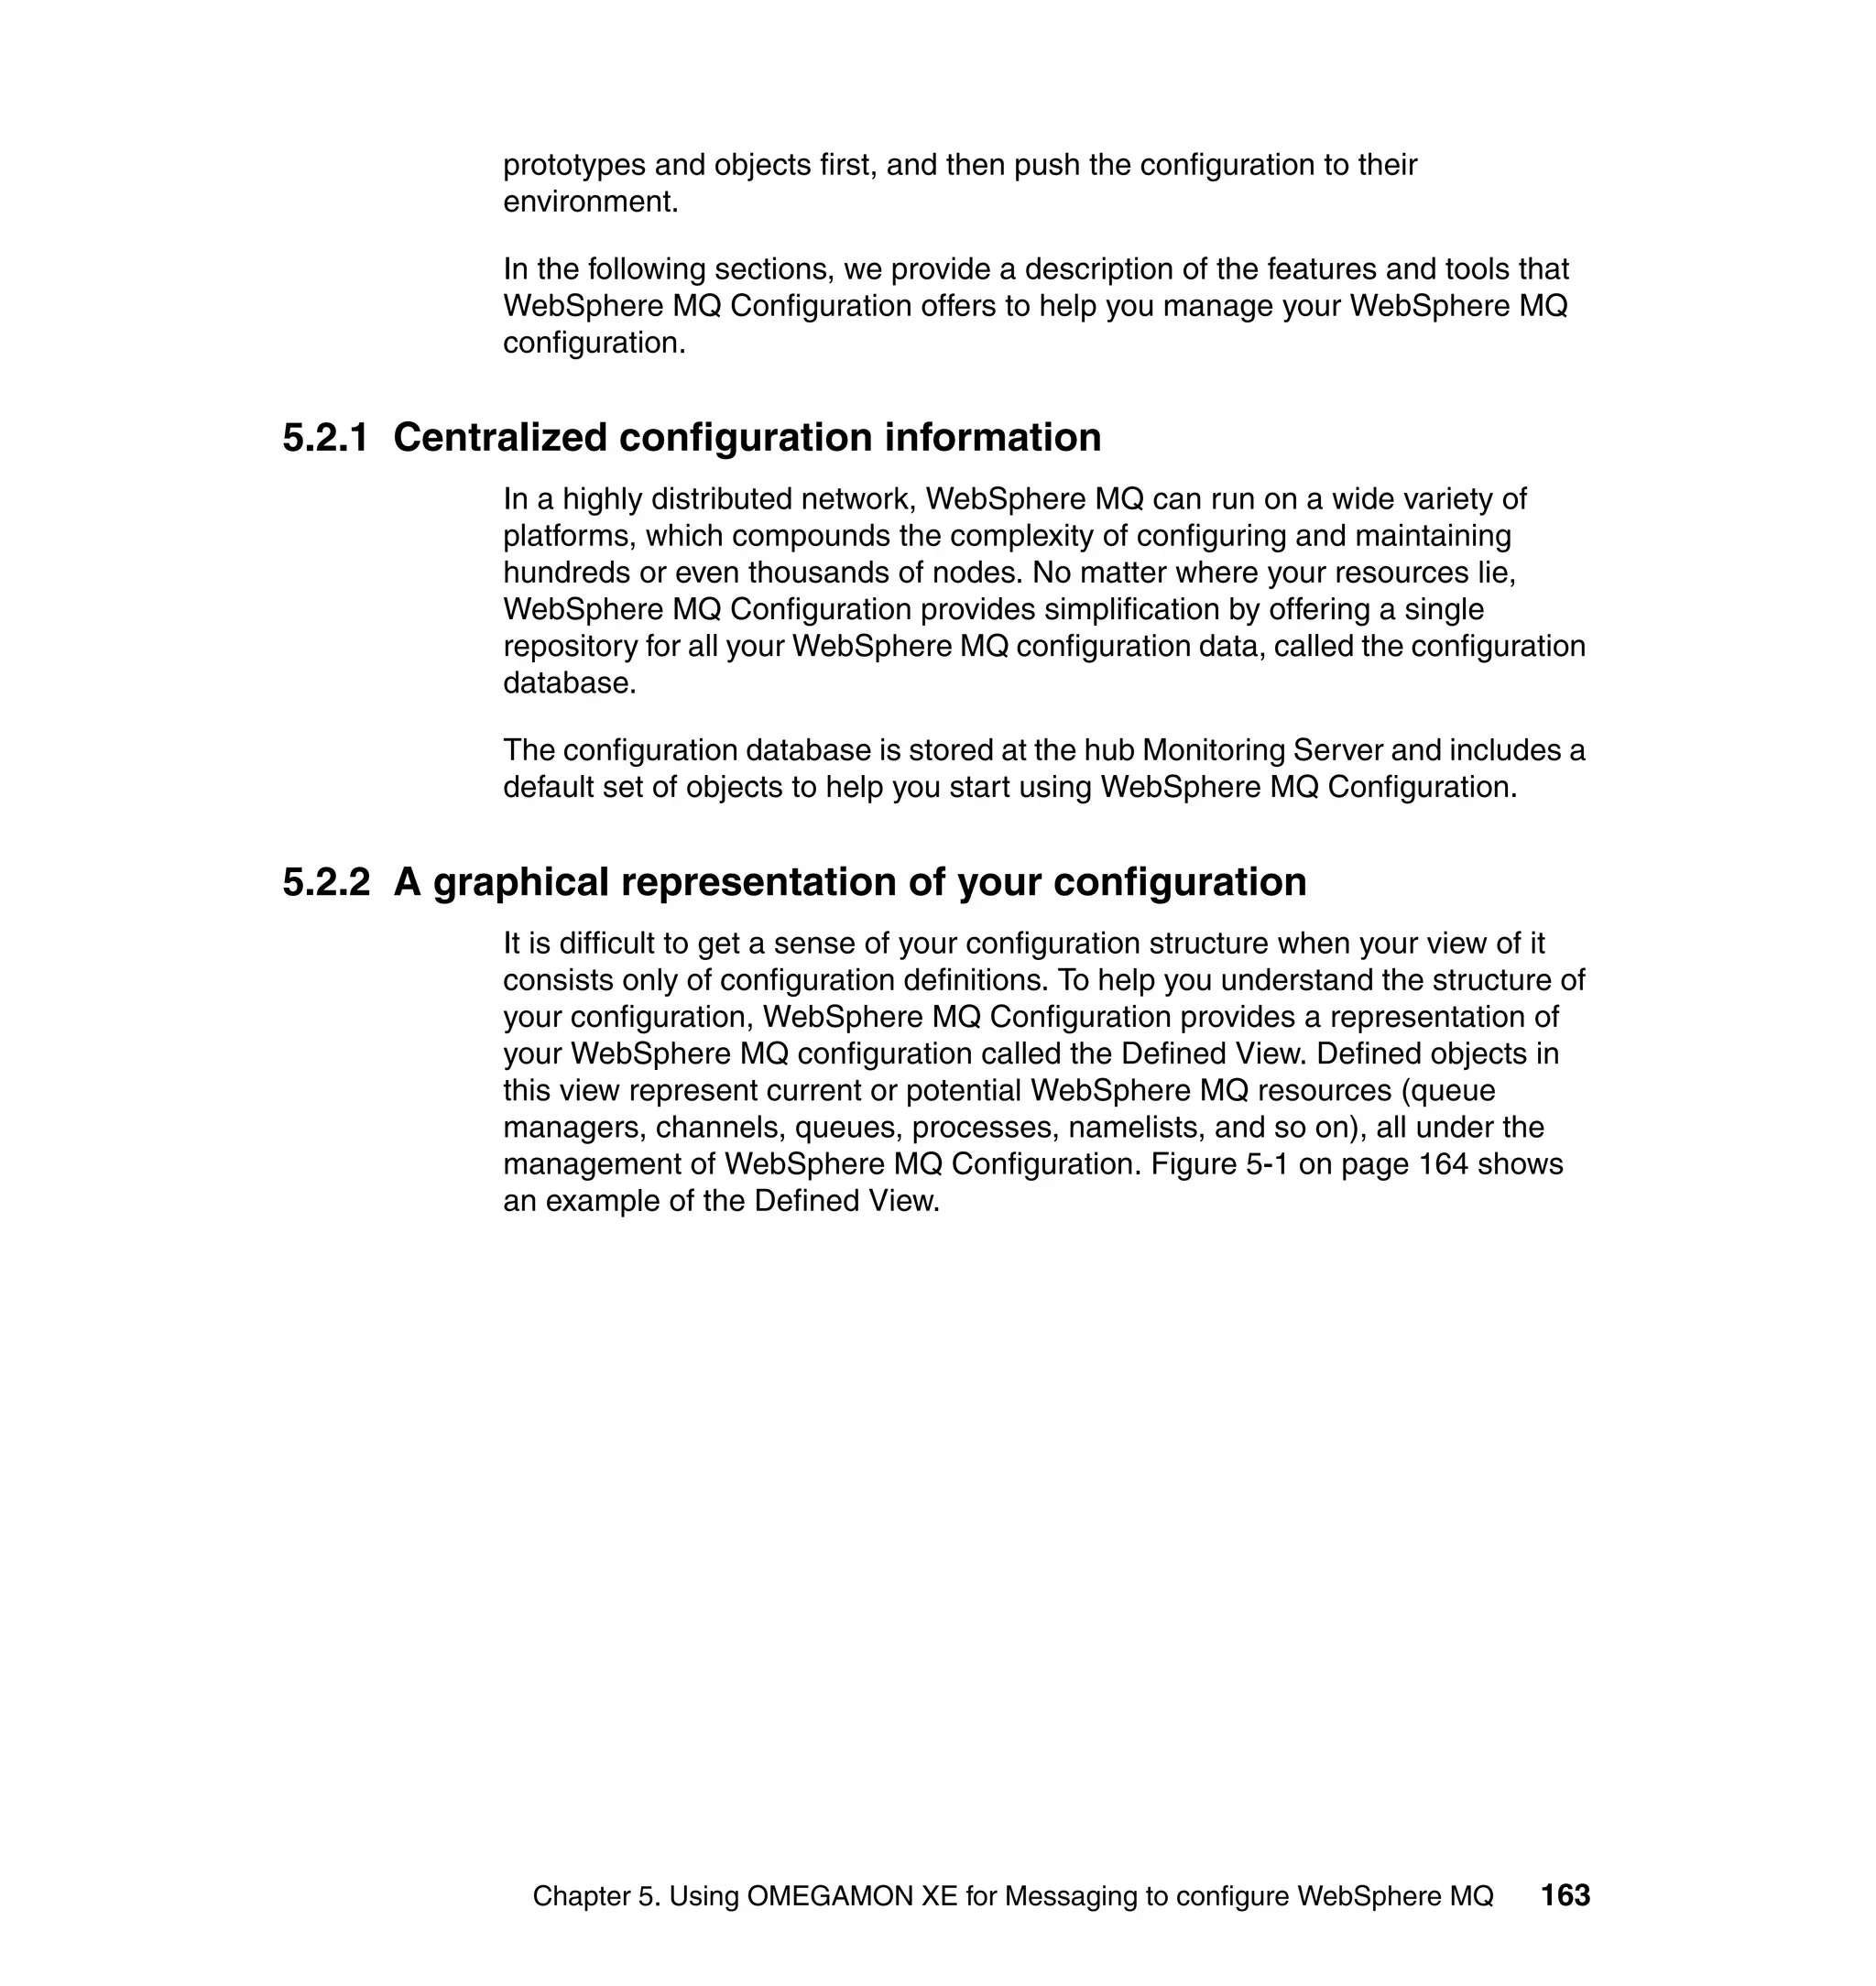
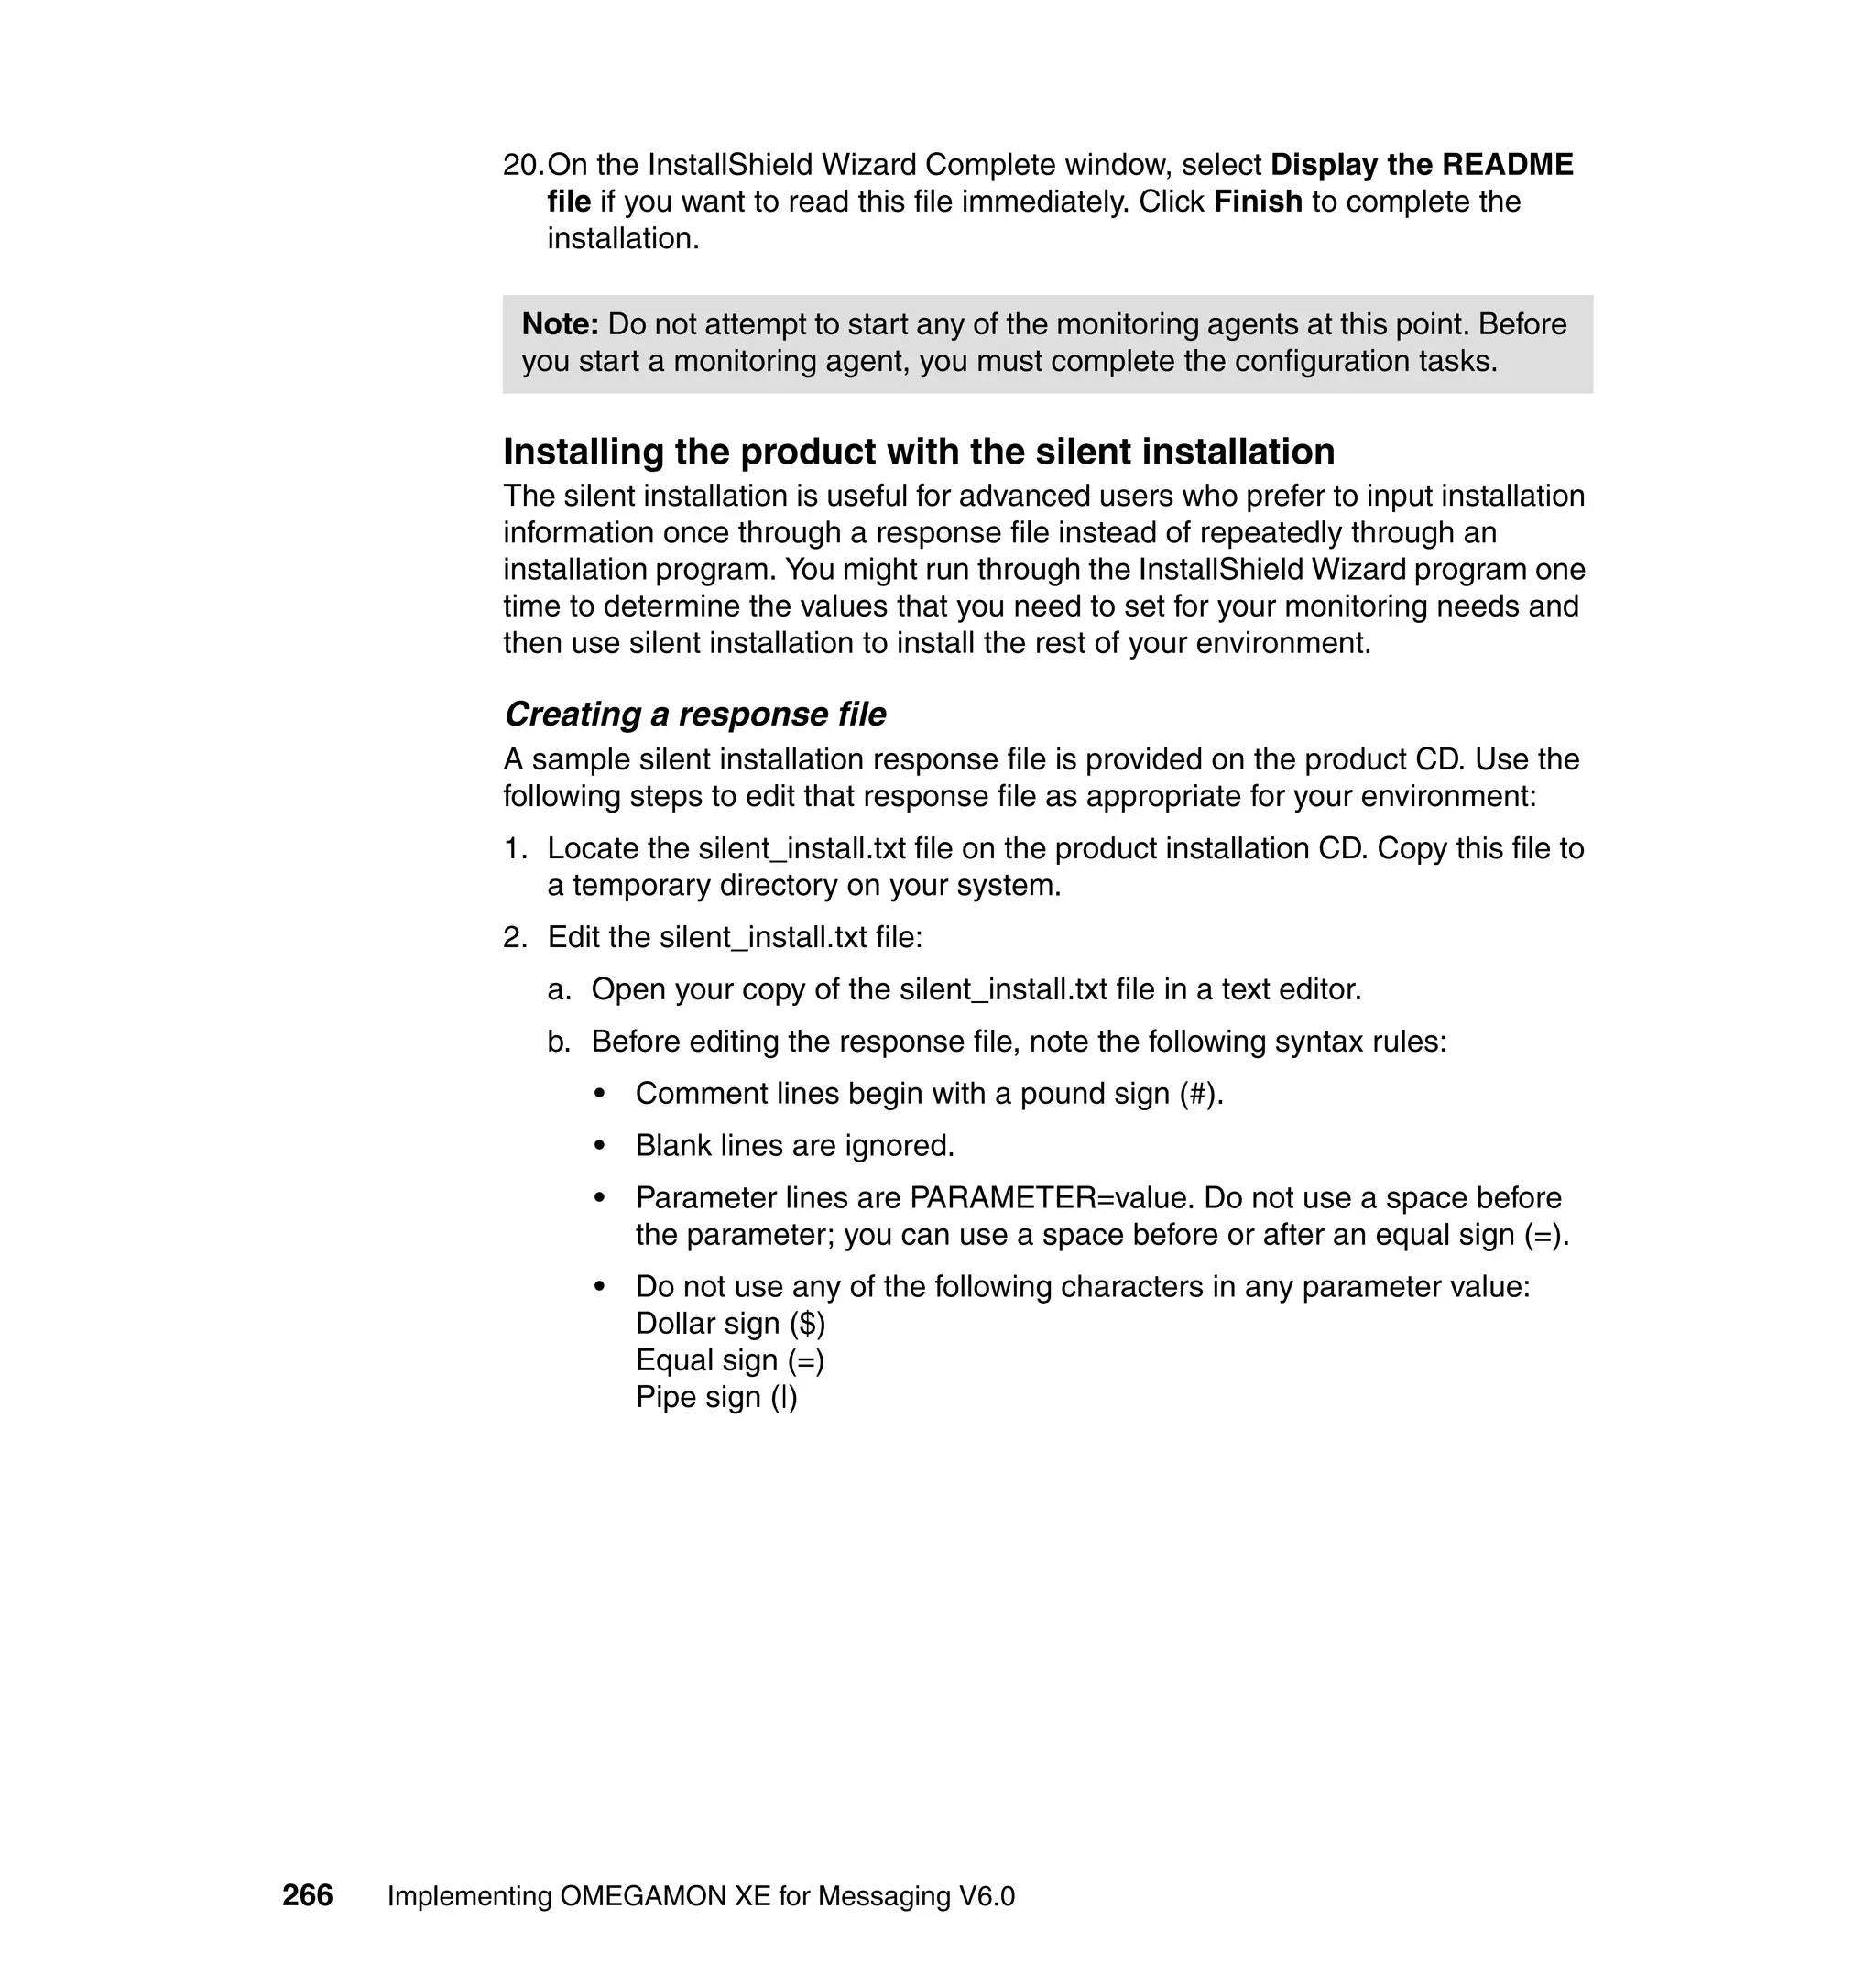
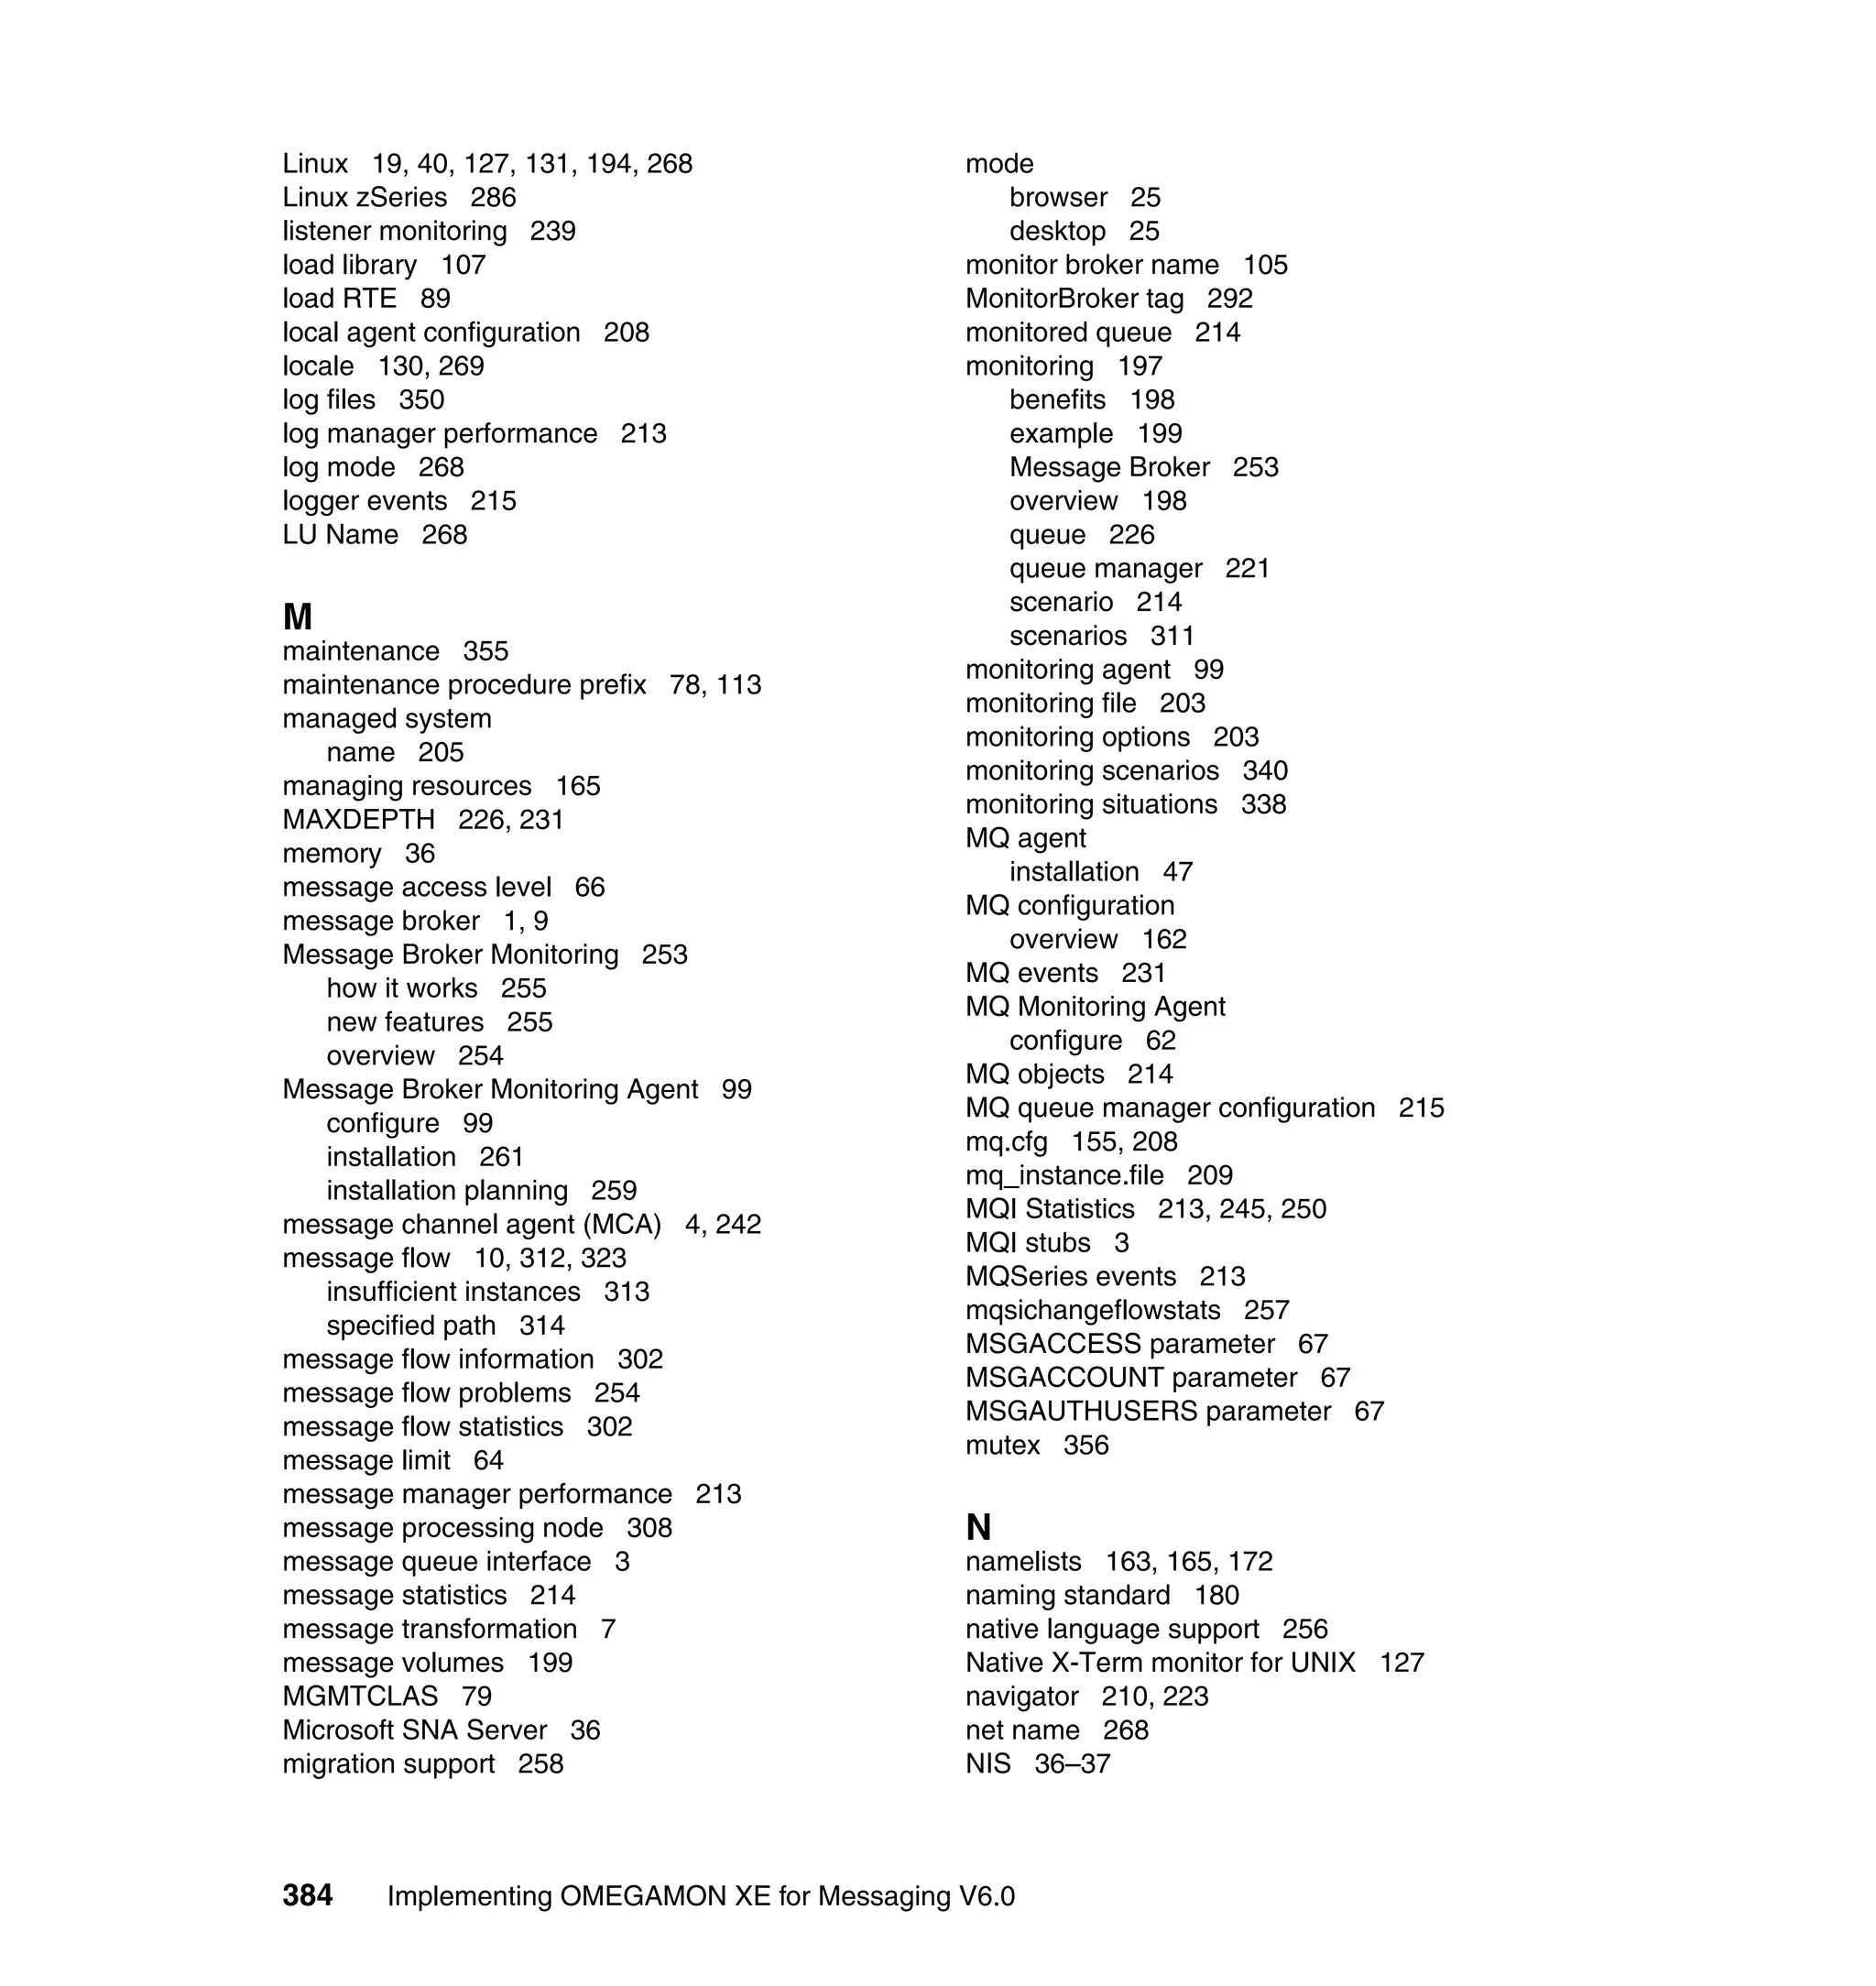
![Using Tivoli Enterprise Monitoring Services
Perform the following steps:
1. Change the directory to install_dir/bin.
2. Enter the following command:
./itmcmd manage
3. In The Manage Tivoli Enterprise Monitoring Services window, highlight the
product that you want to start or stop.
4. Right-click and select start or stop.
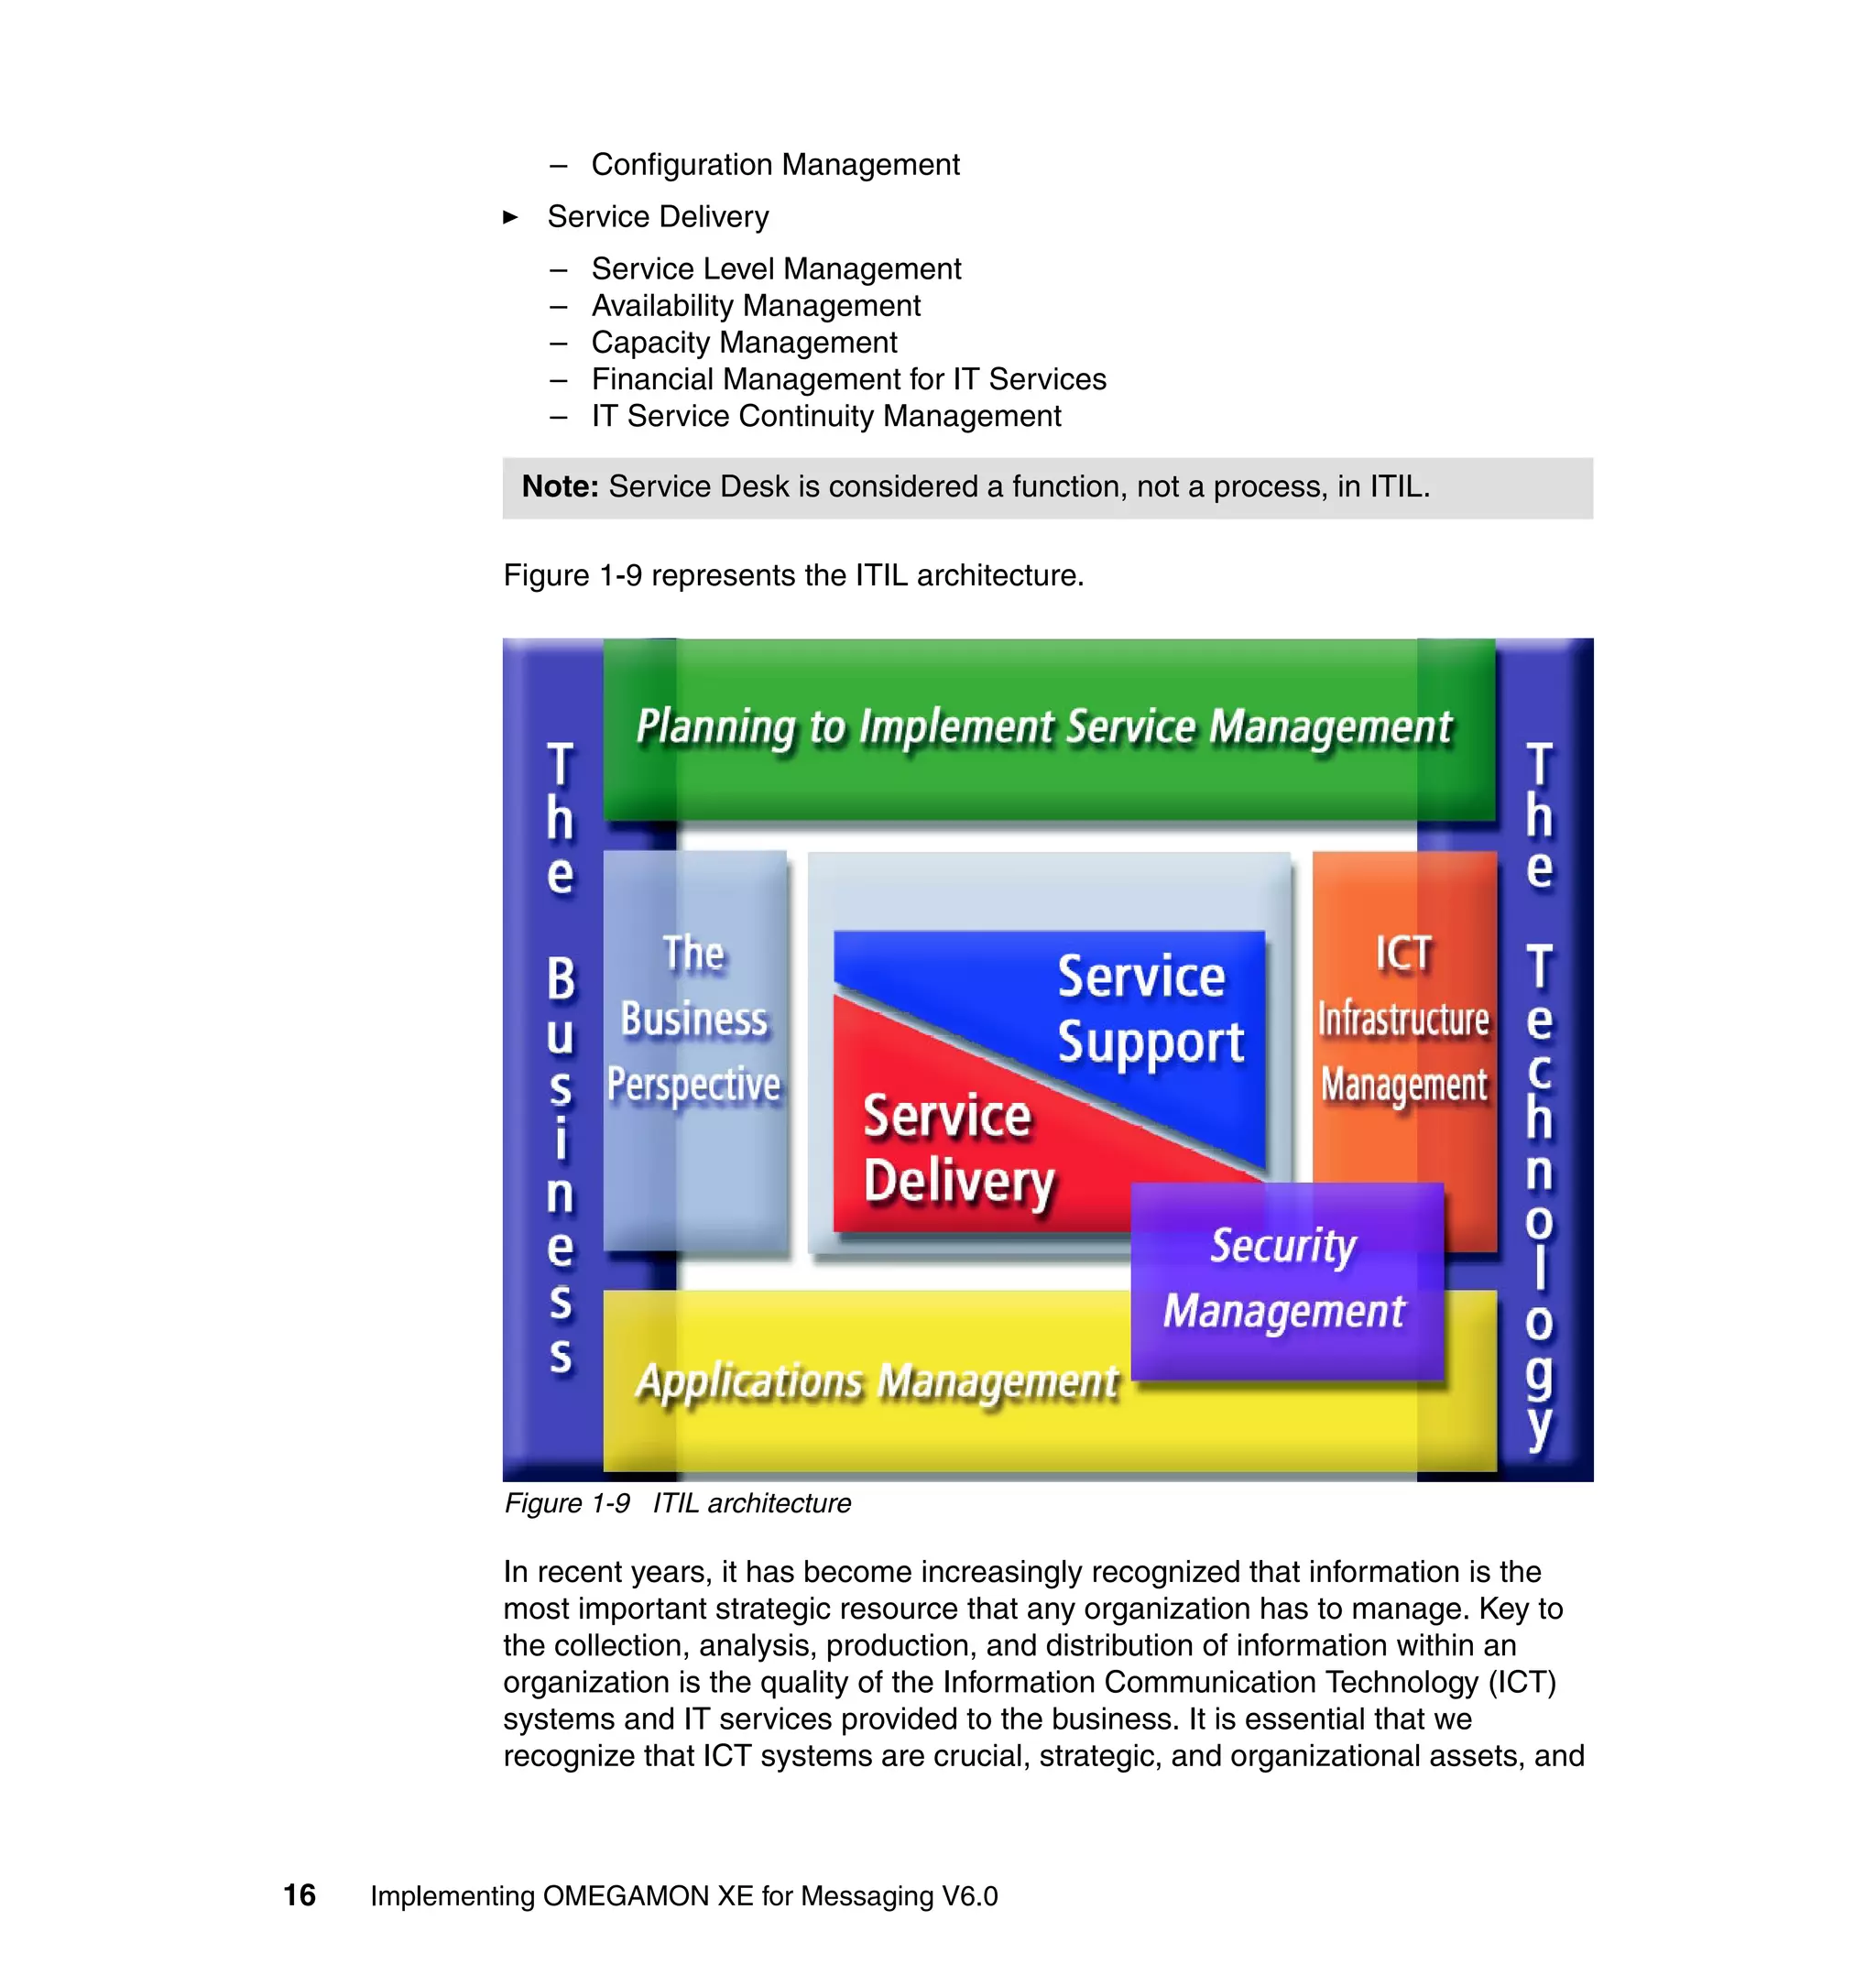
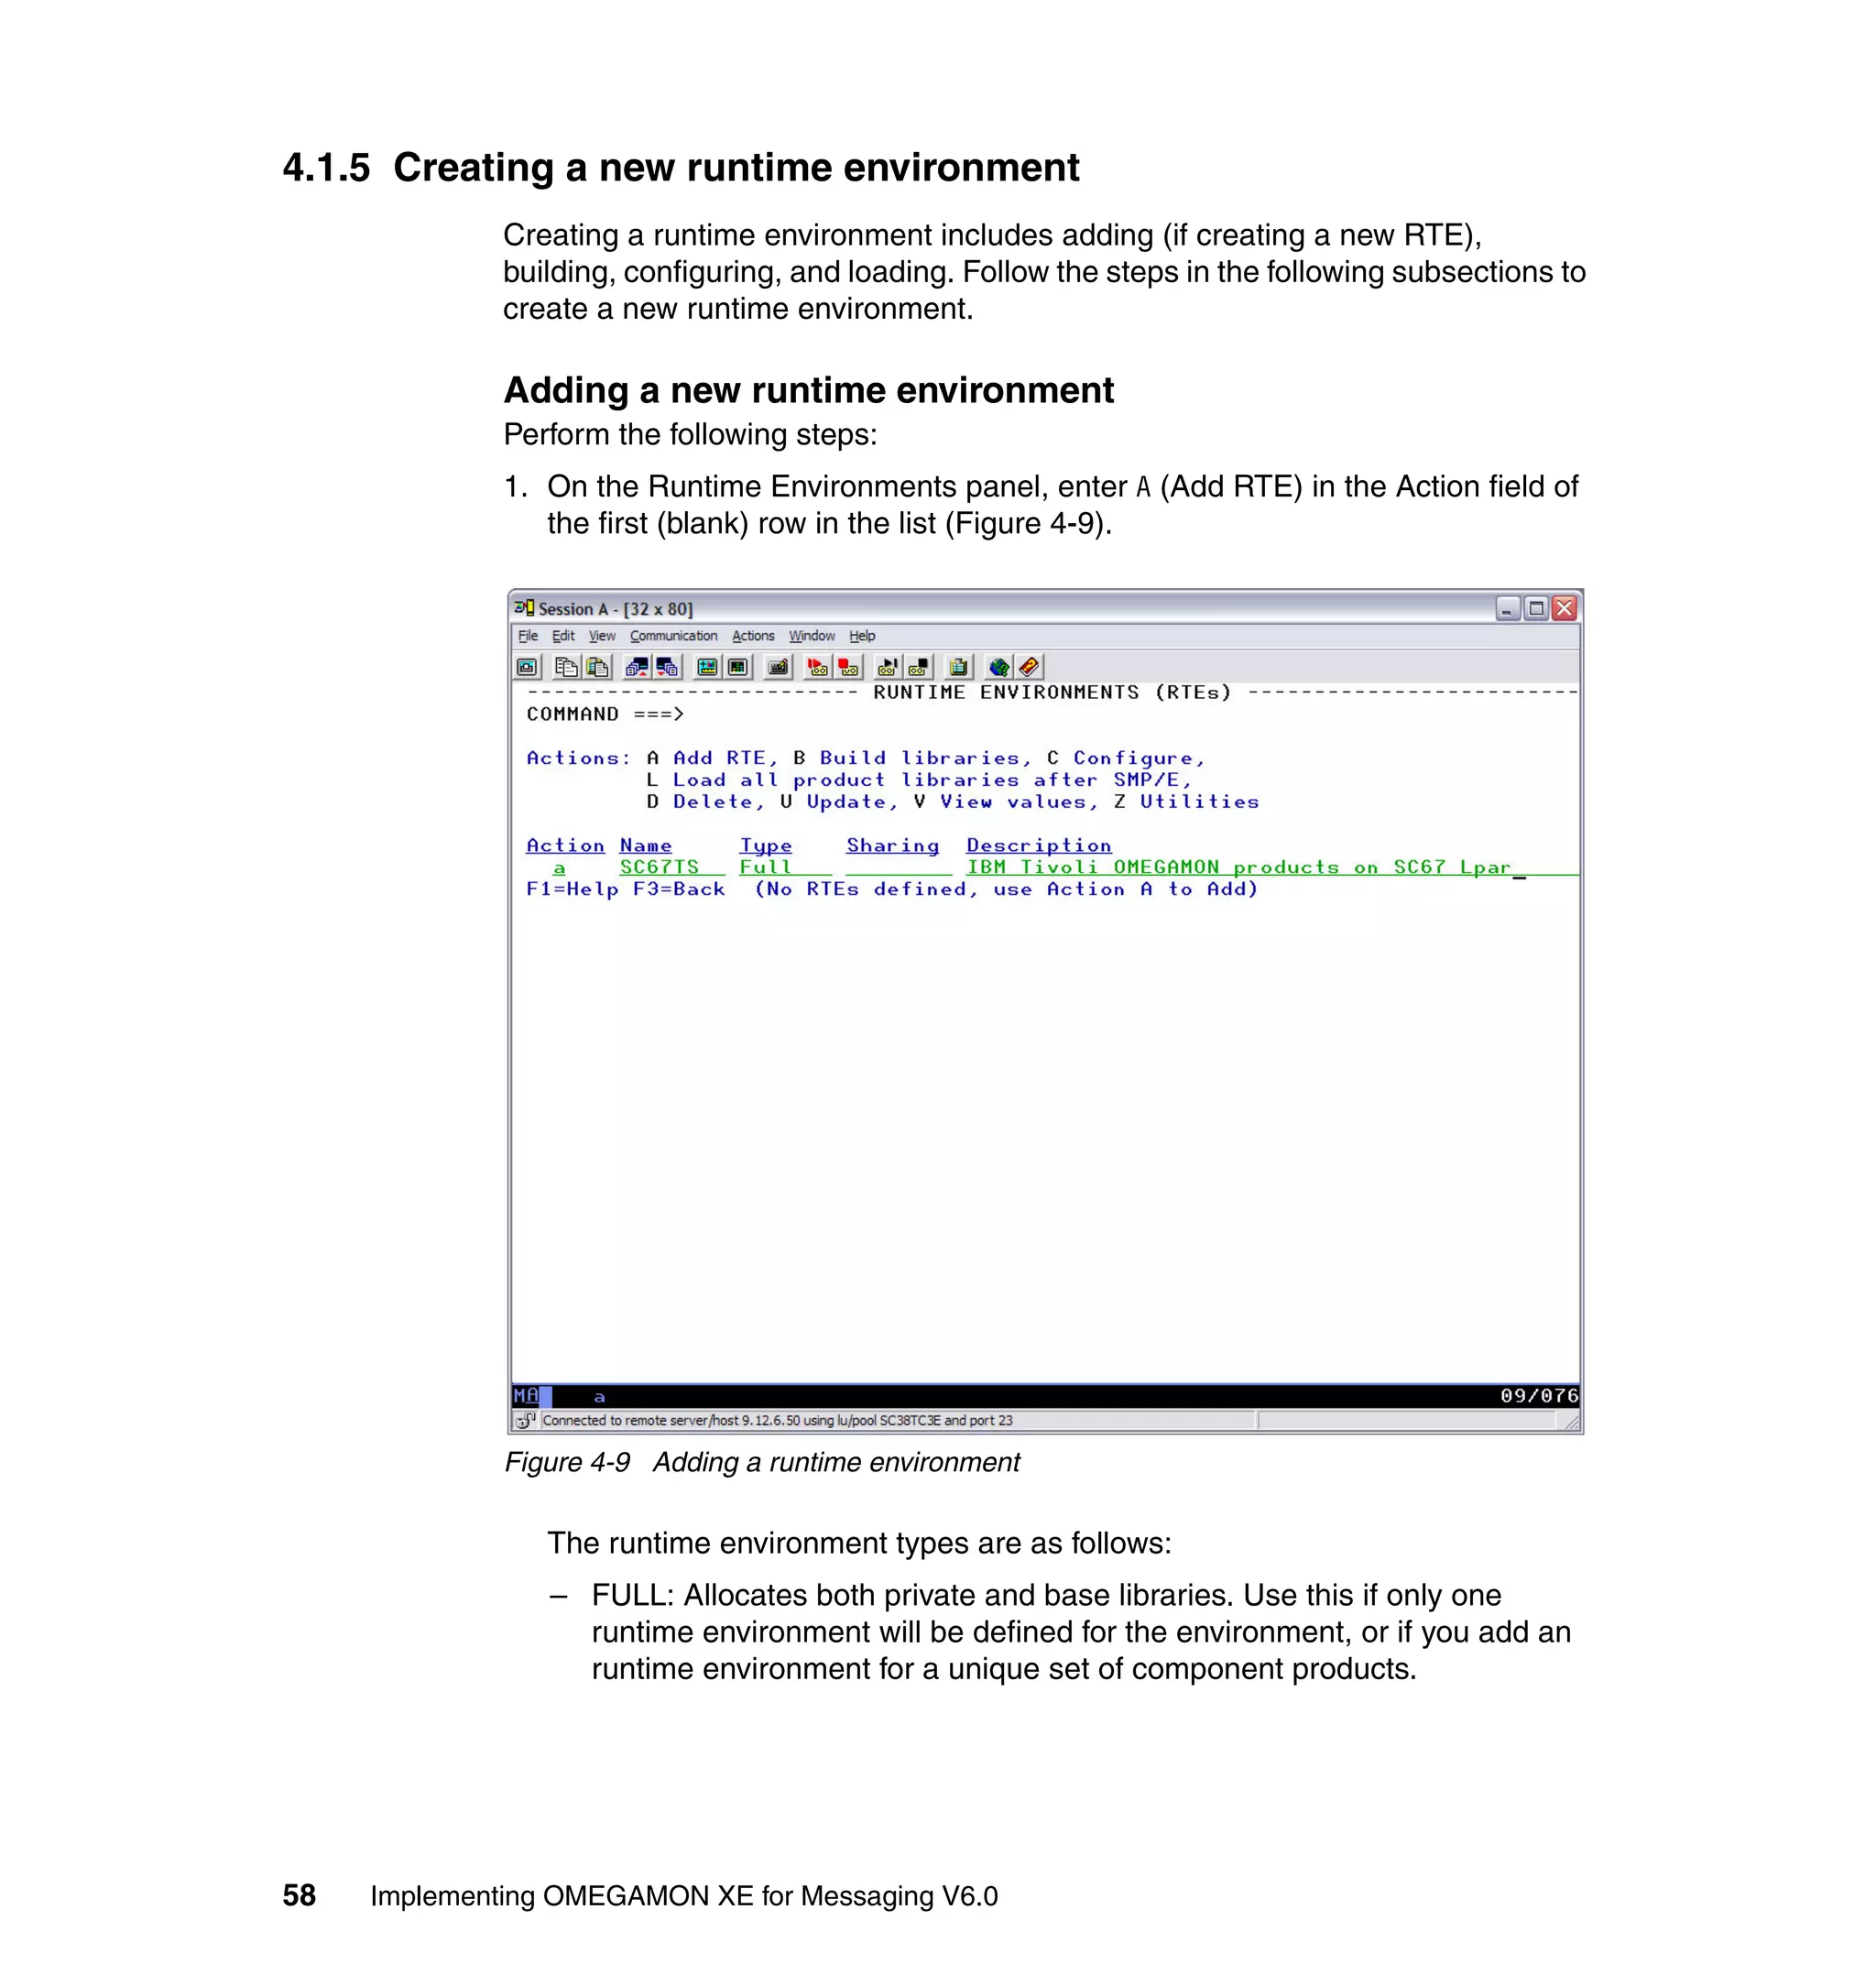
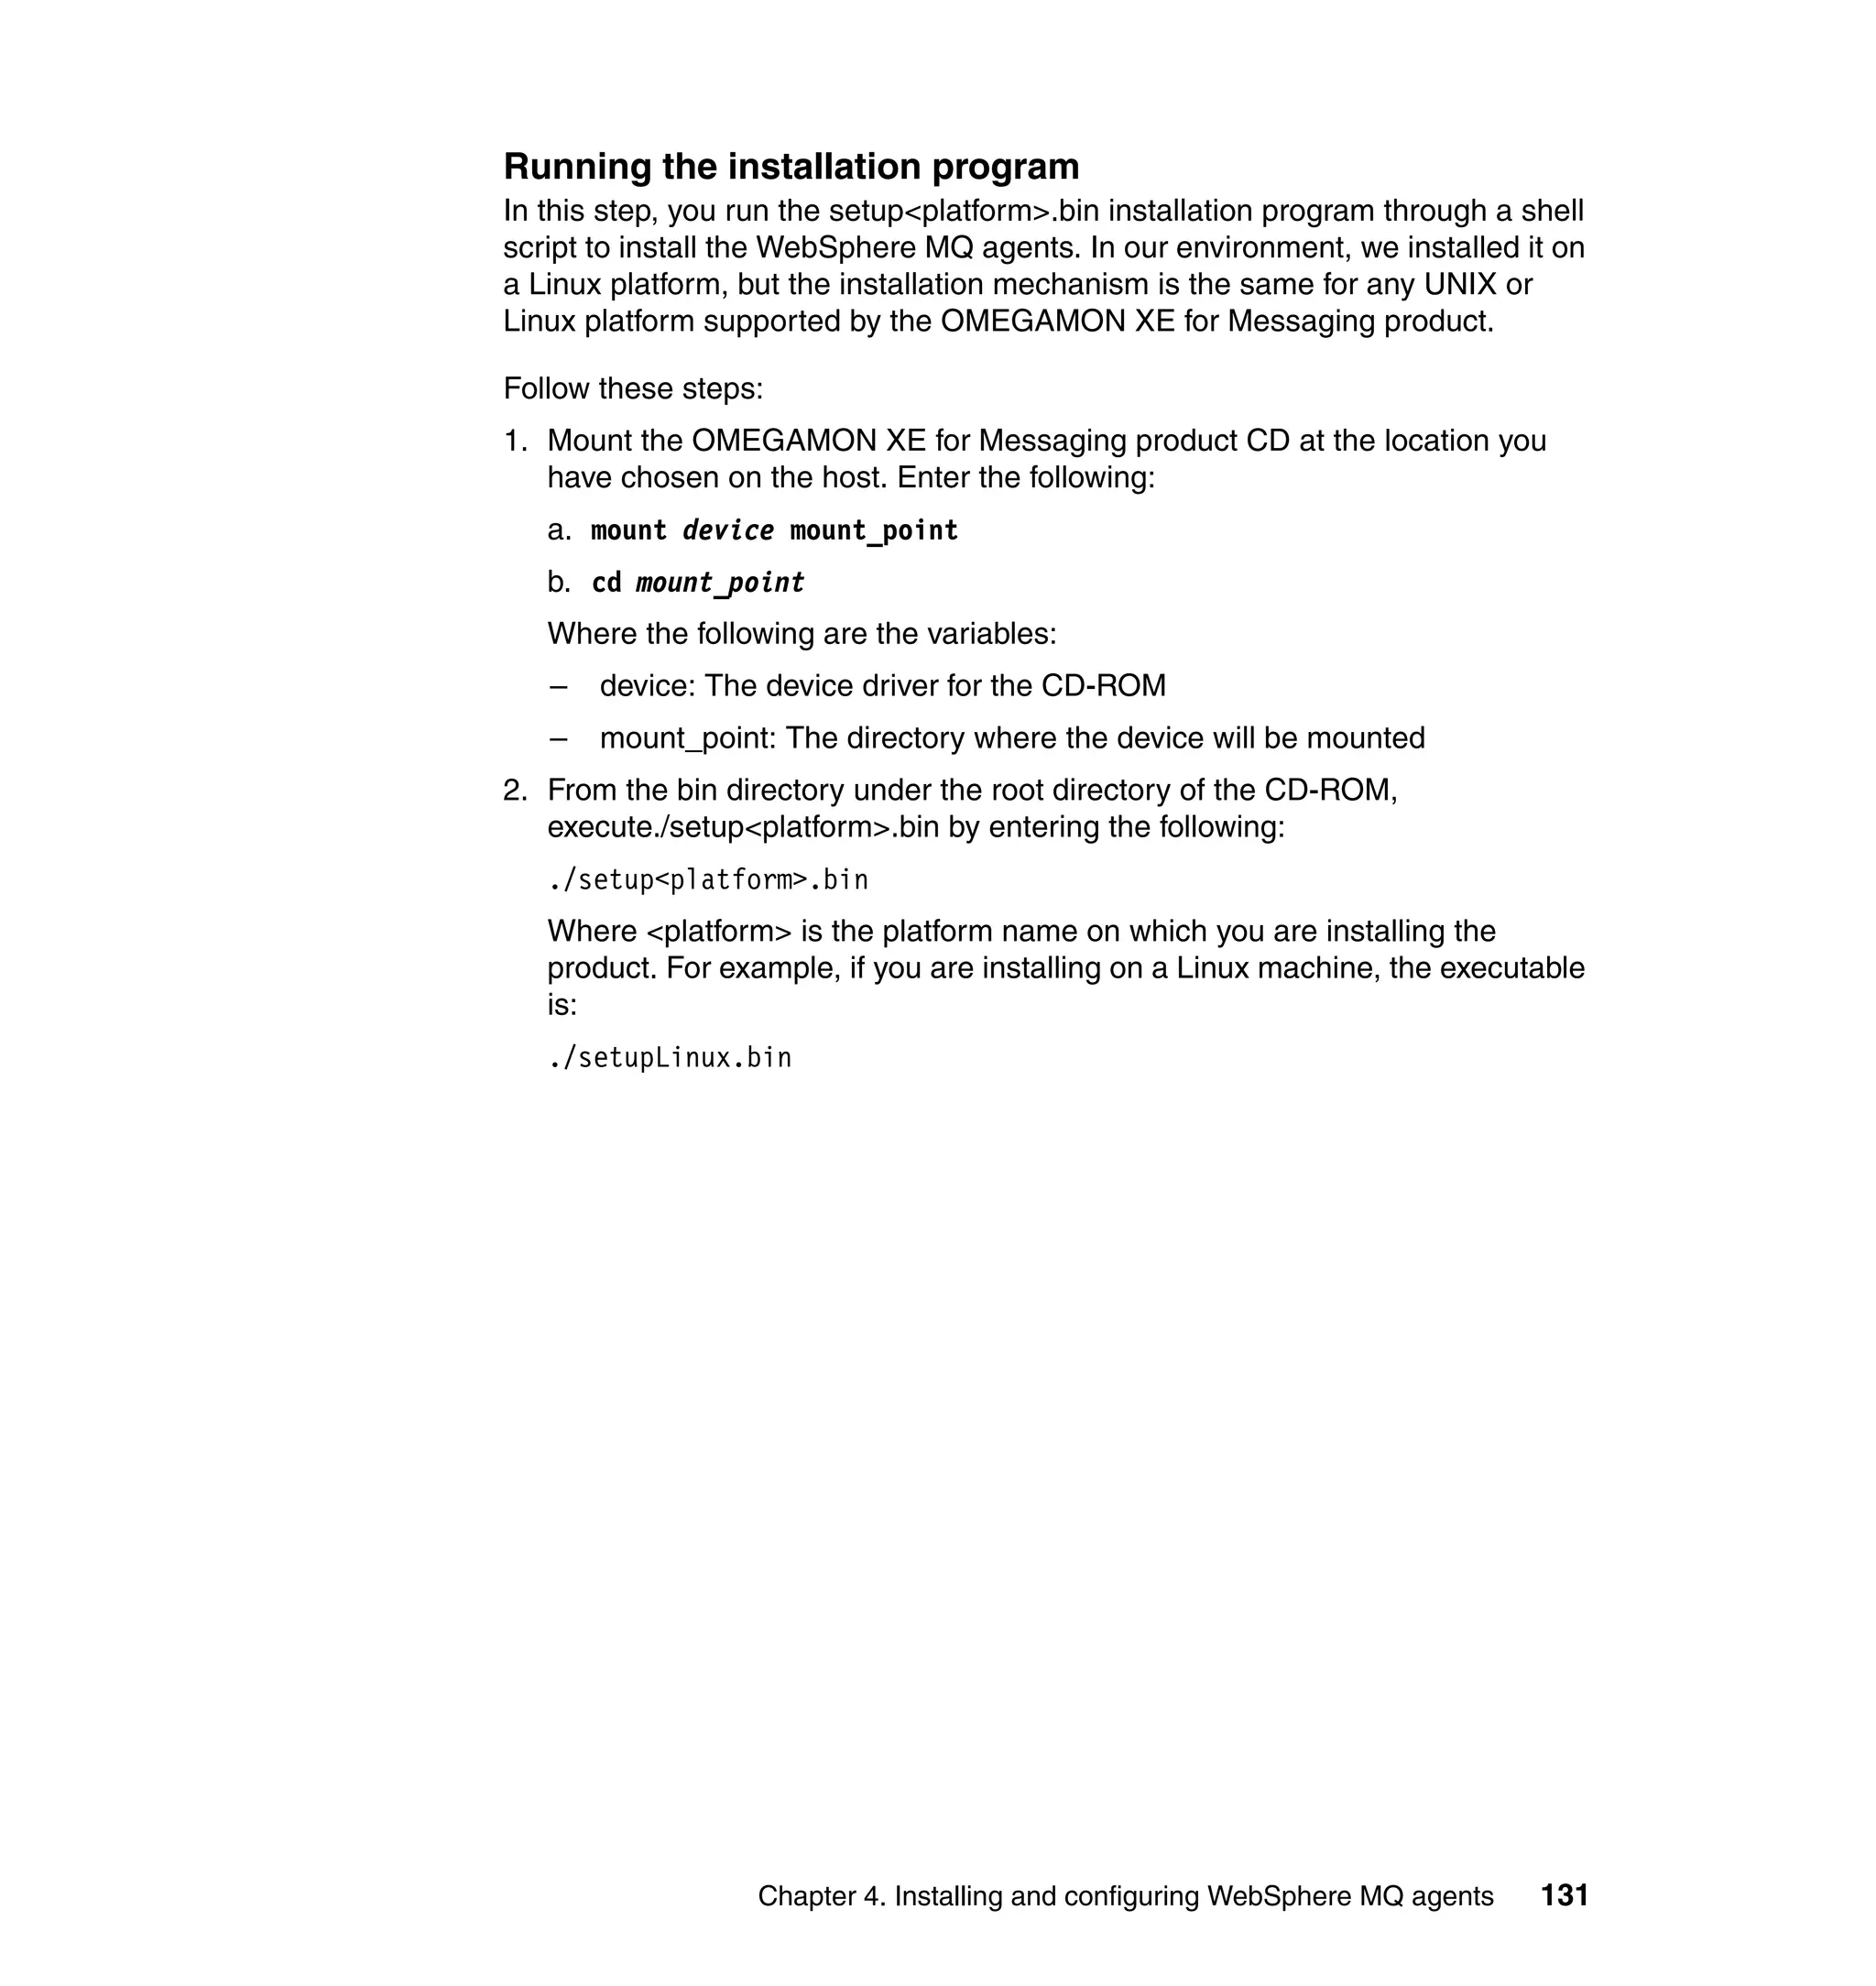
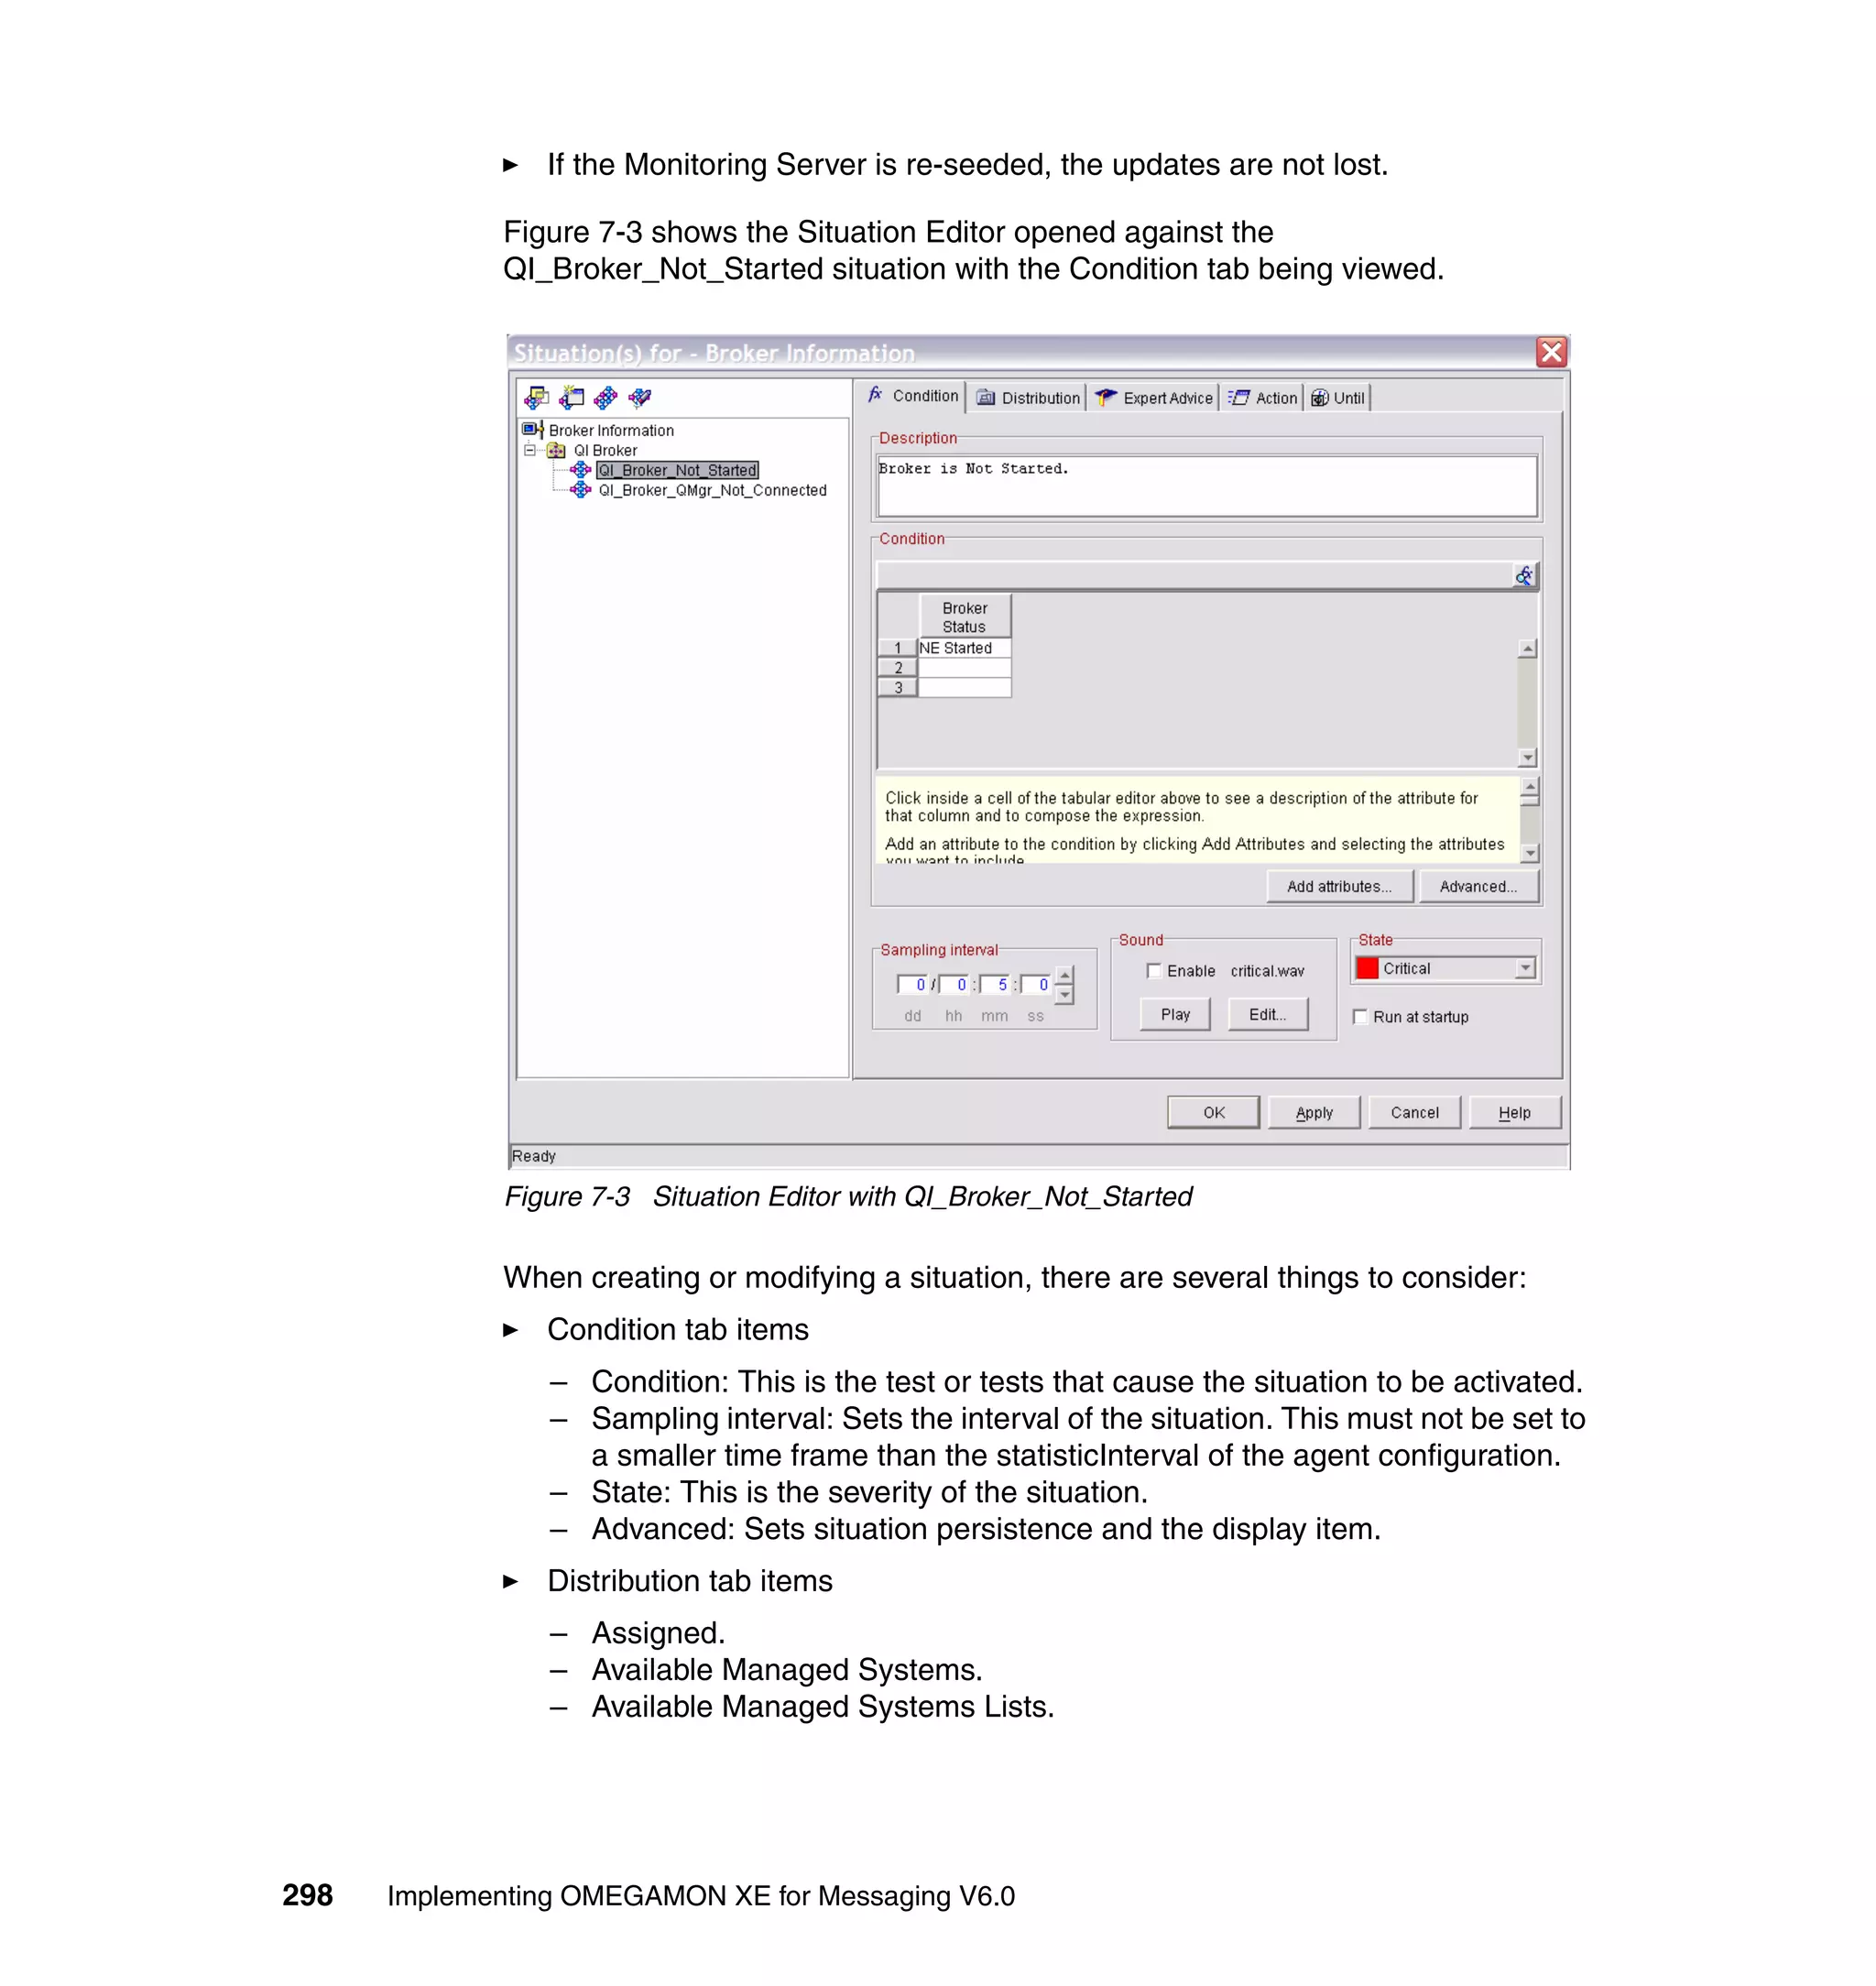
Using the command line
Use the itmcmd command to start and stop WebSphere MQ agents. It must be
executed on the architecture for which the agent is installed. Execute the
following command:
./itmcmd agent [-l] [-h install_dir] [-c] [-s] start|stop {pc|all}
Table 4-3 explains the functions of the parameters of this command.
Table 4-3 itmcmd agent command parameters
Variable Description
-c (Optional) Indicates that the configuration file used on agent startup
must not be updated. By default, this file is updated each time the
agent is started.
-h (Optional) Identifies the installation directory if it is not the one in
which the script is located. Also use this option to take action on an
IBM Tivoli Monitoring installation directory other than the one in the
current system.
-s (Optional) Option to specify safe mode operation. Safe mode invokes
the JRE™ with the -nojit option.
start|stop Specifies whether you want to start or stop the designated agent.
-l (Optional) Used to delete the log file associated with the agent that is
being stopped. By default, the log file is saved when the monitoring
agent is stopped.
pc The product code of the agent. You can specify one or more products
to start or stop. If multiple products, you must separate the product
codes with either a space or comma as illustrated earlier. To start or
stop all agents on the computer, use the all option.
138 Implementing OMEGAMON XE for Messaging V6.0](https://image.slidesharecdn.com/implementingomegamonxeformessagingv6-0sg247357-120524195829-phpapp02/75/Implementing-omegamon-xe-for-messaging-v6-0-sg247357-160-2048.jpg)

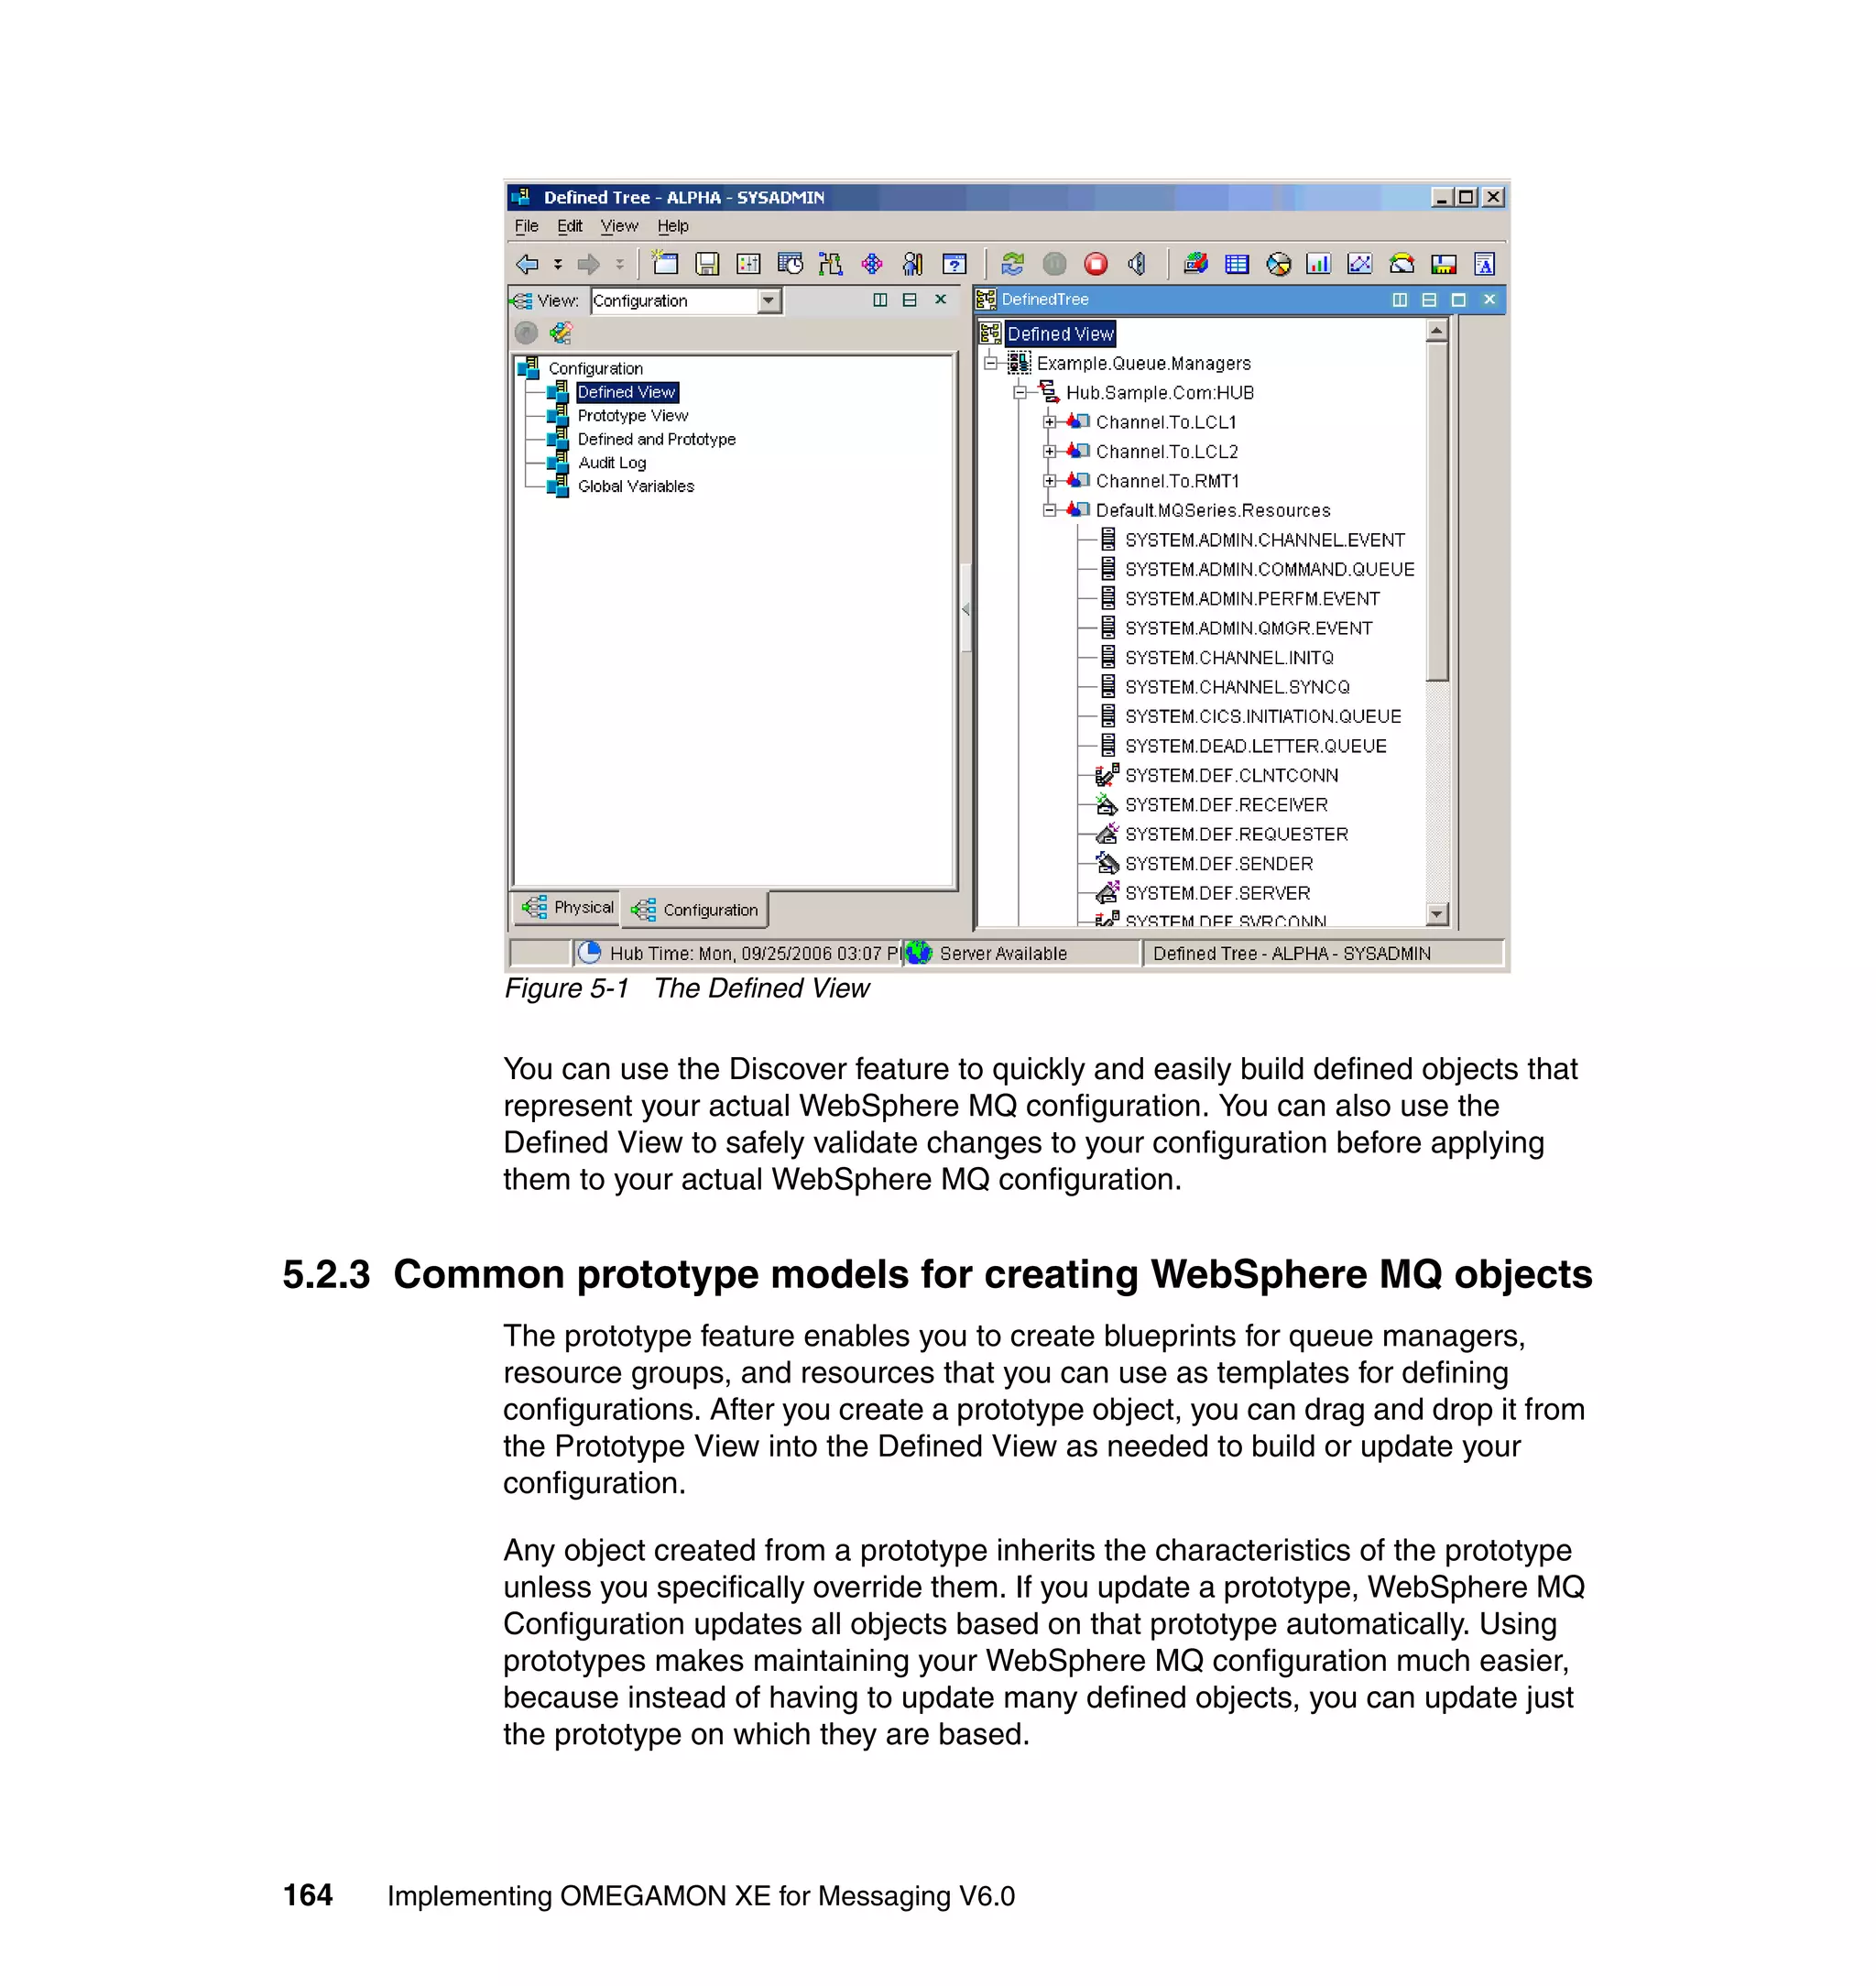


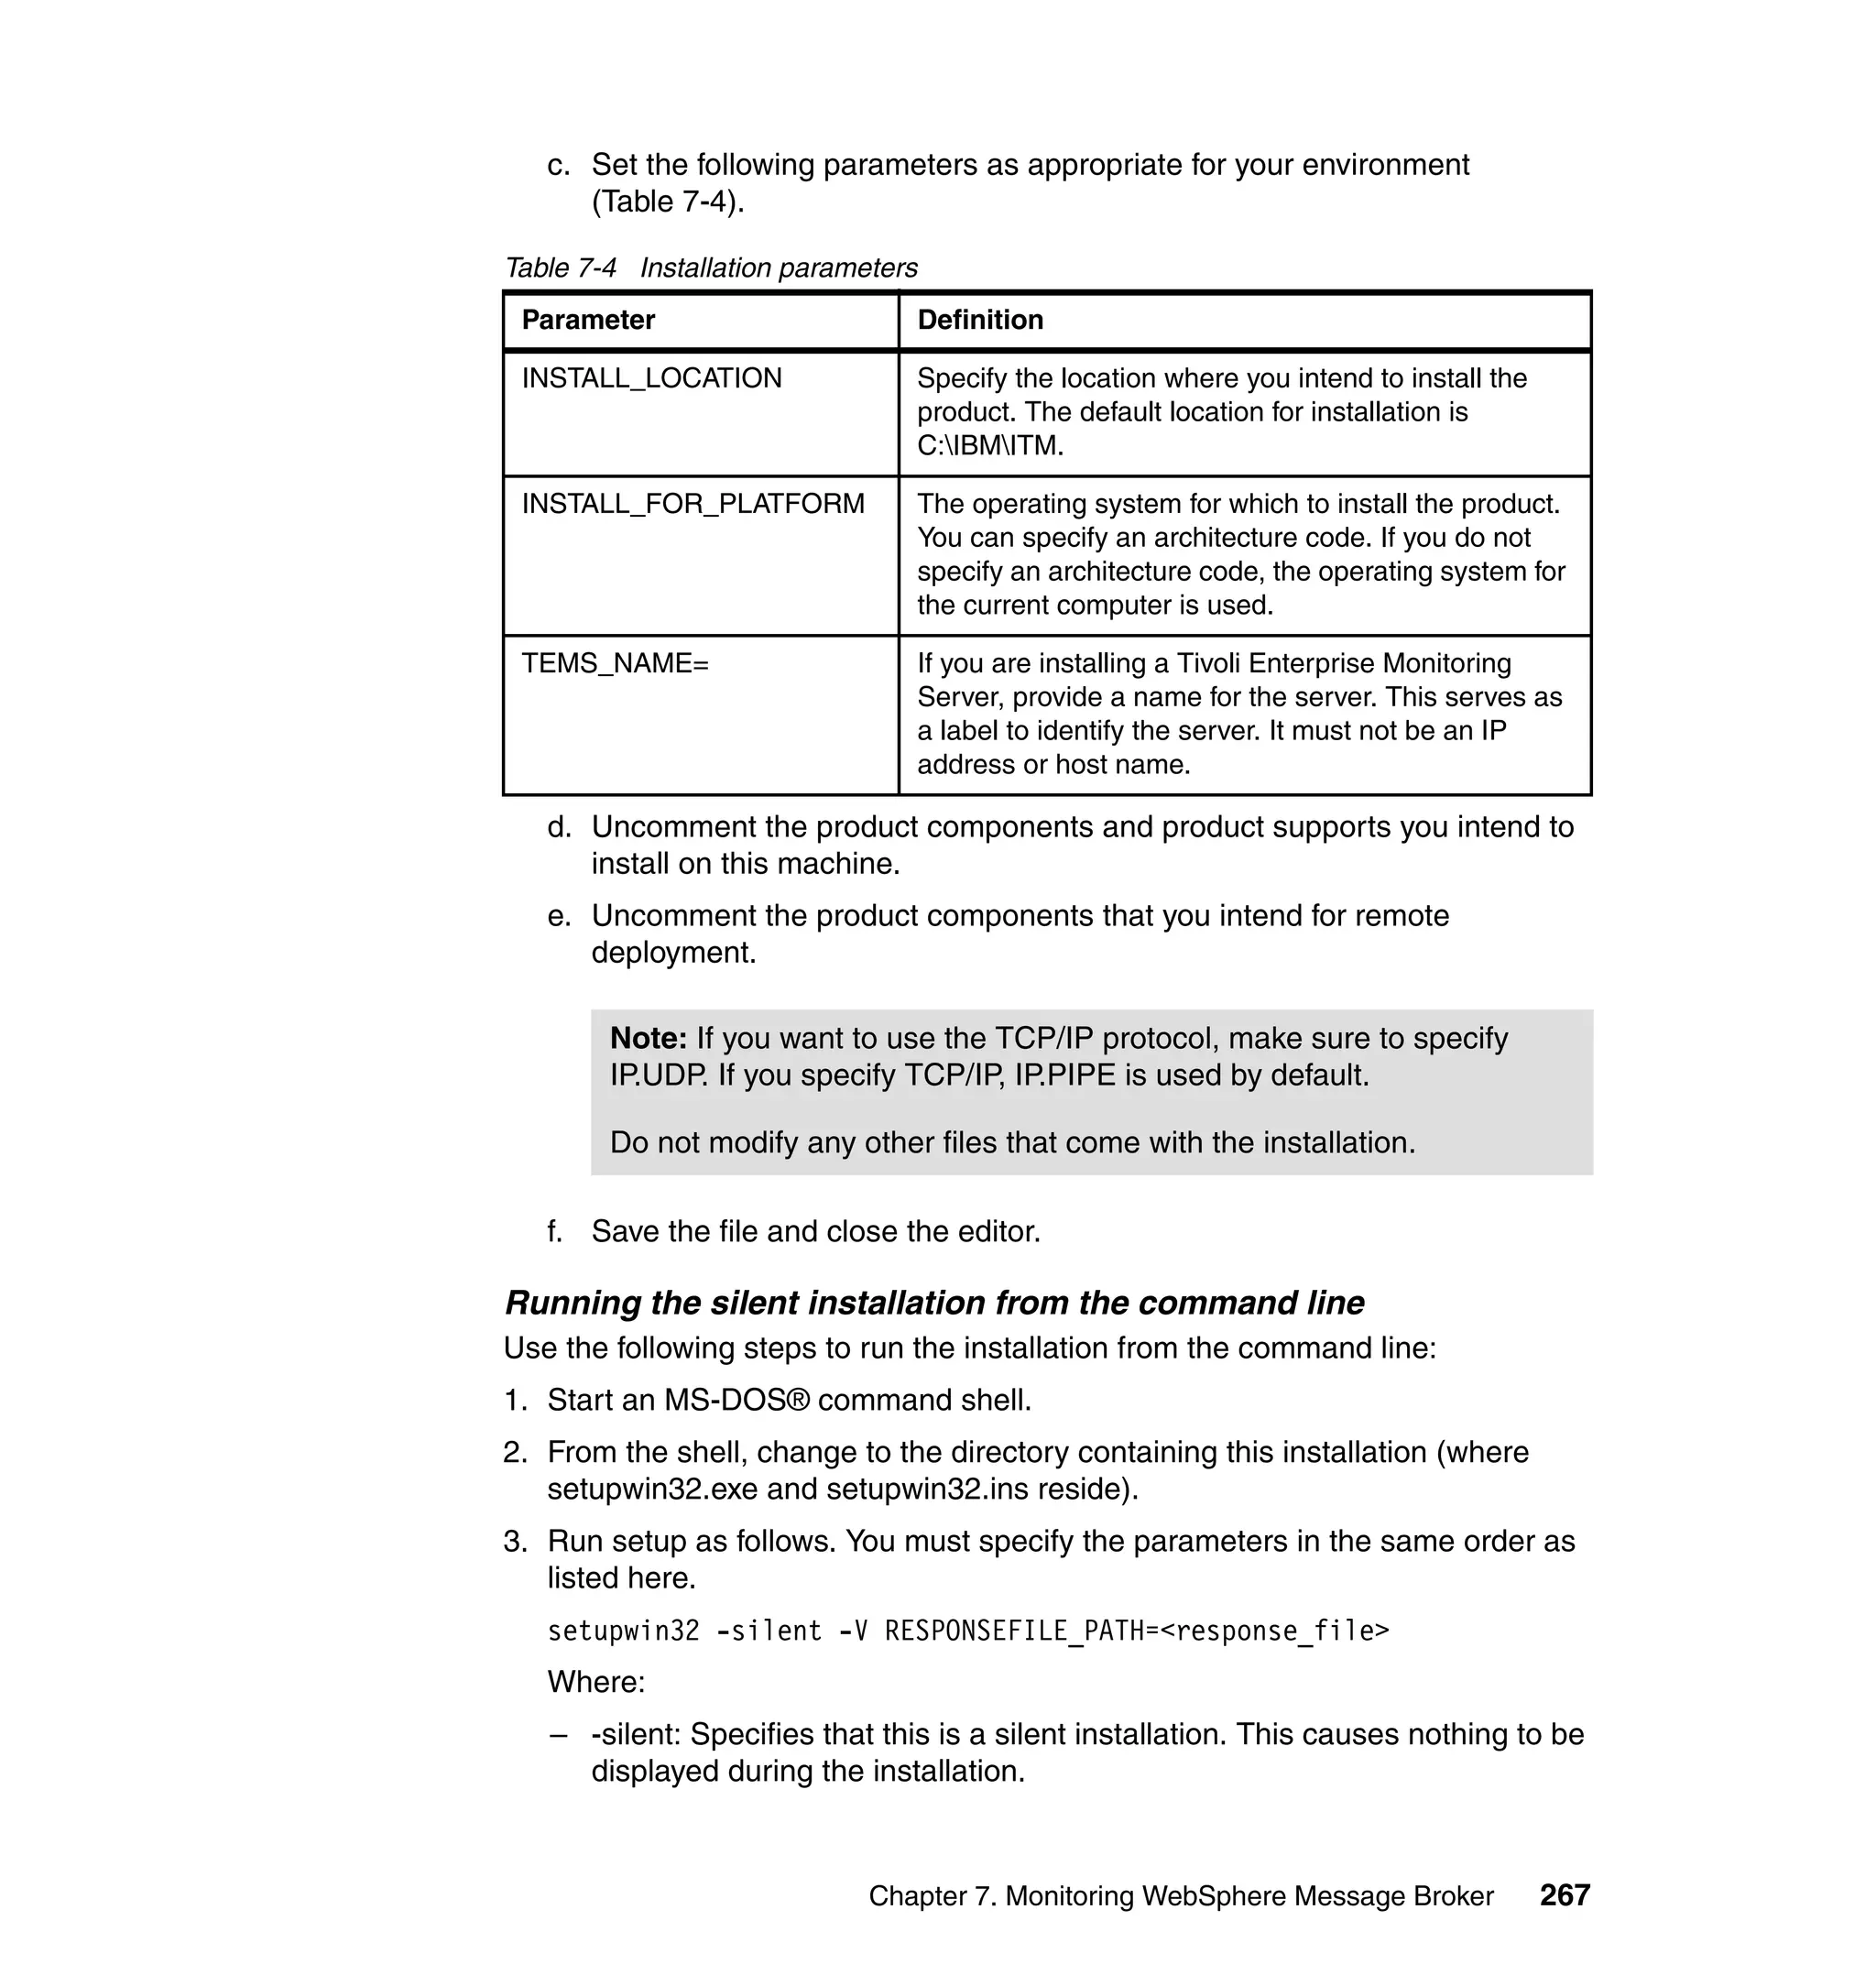
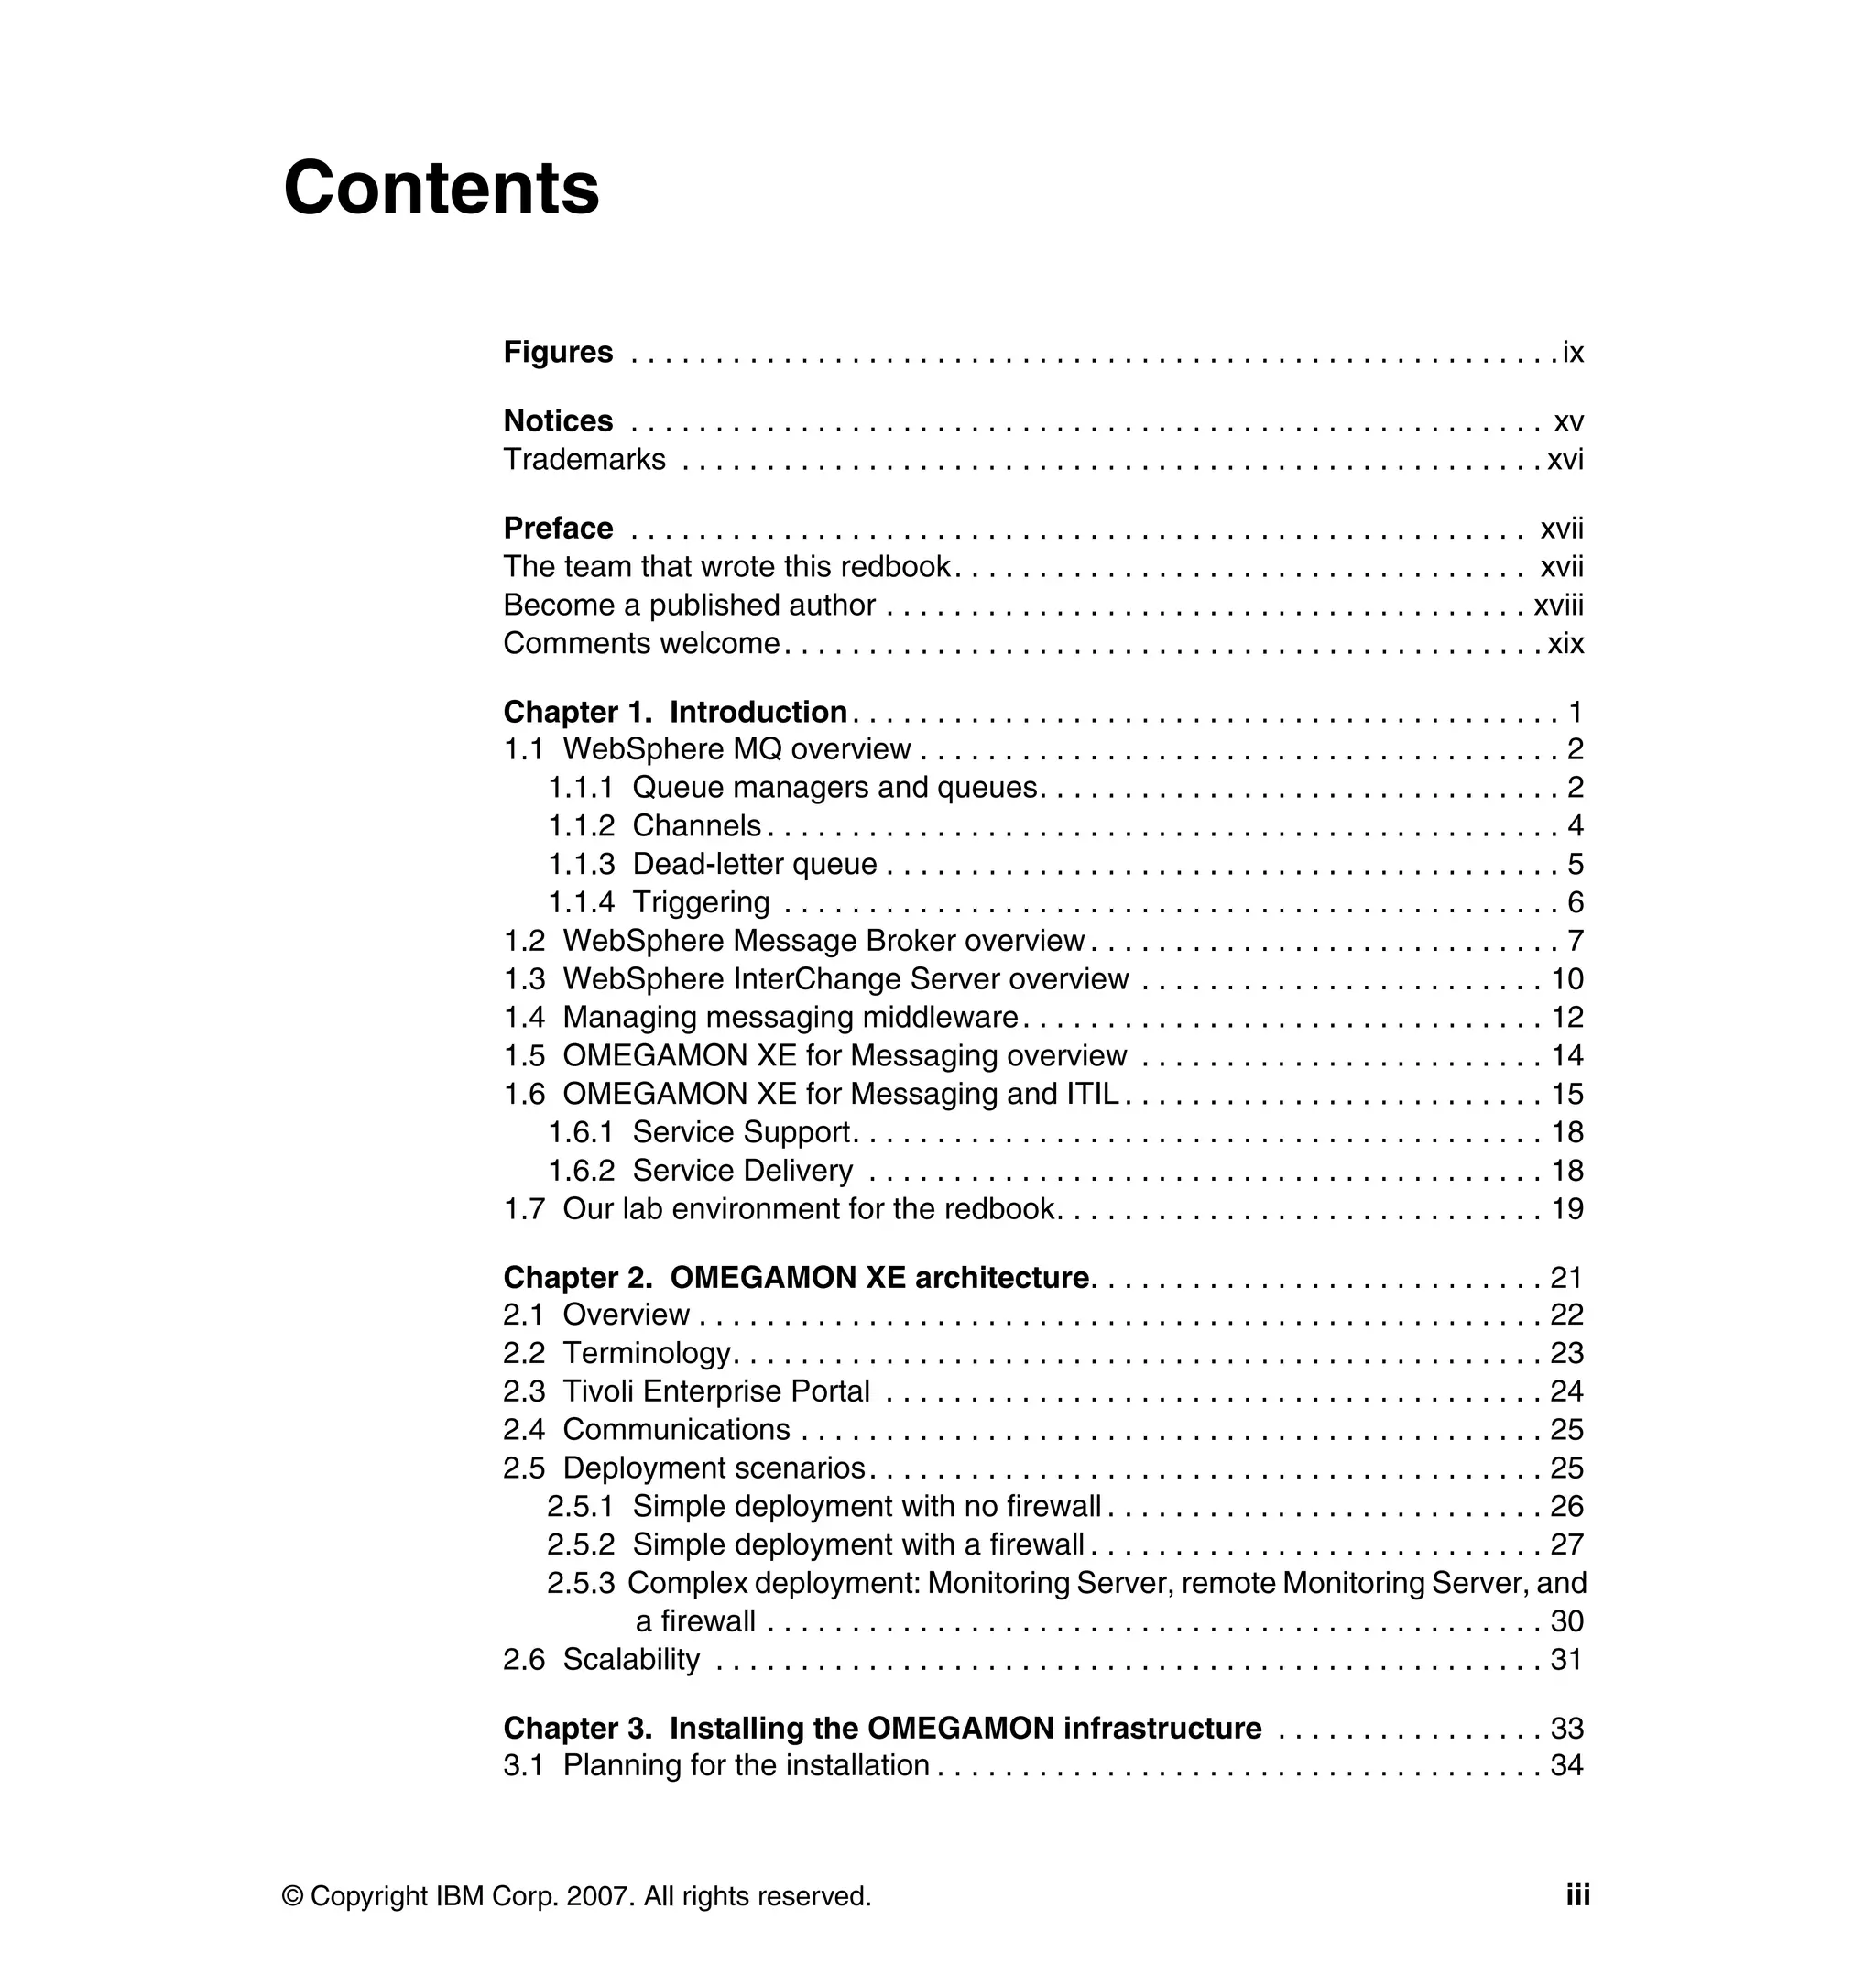
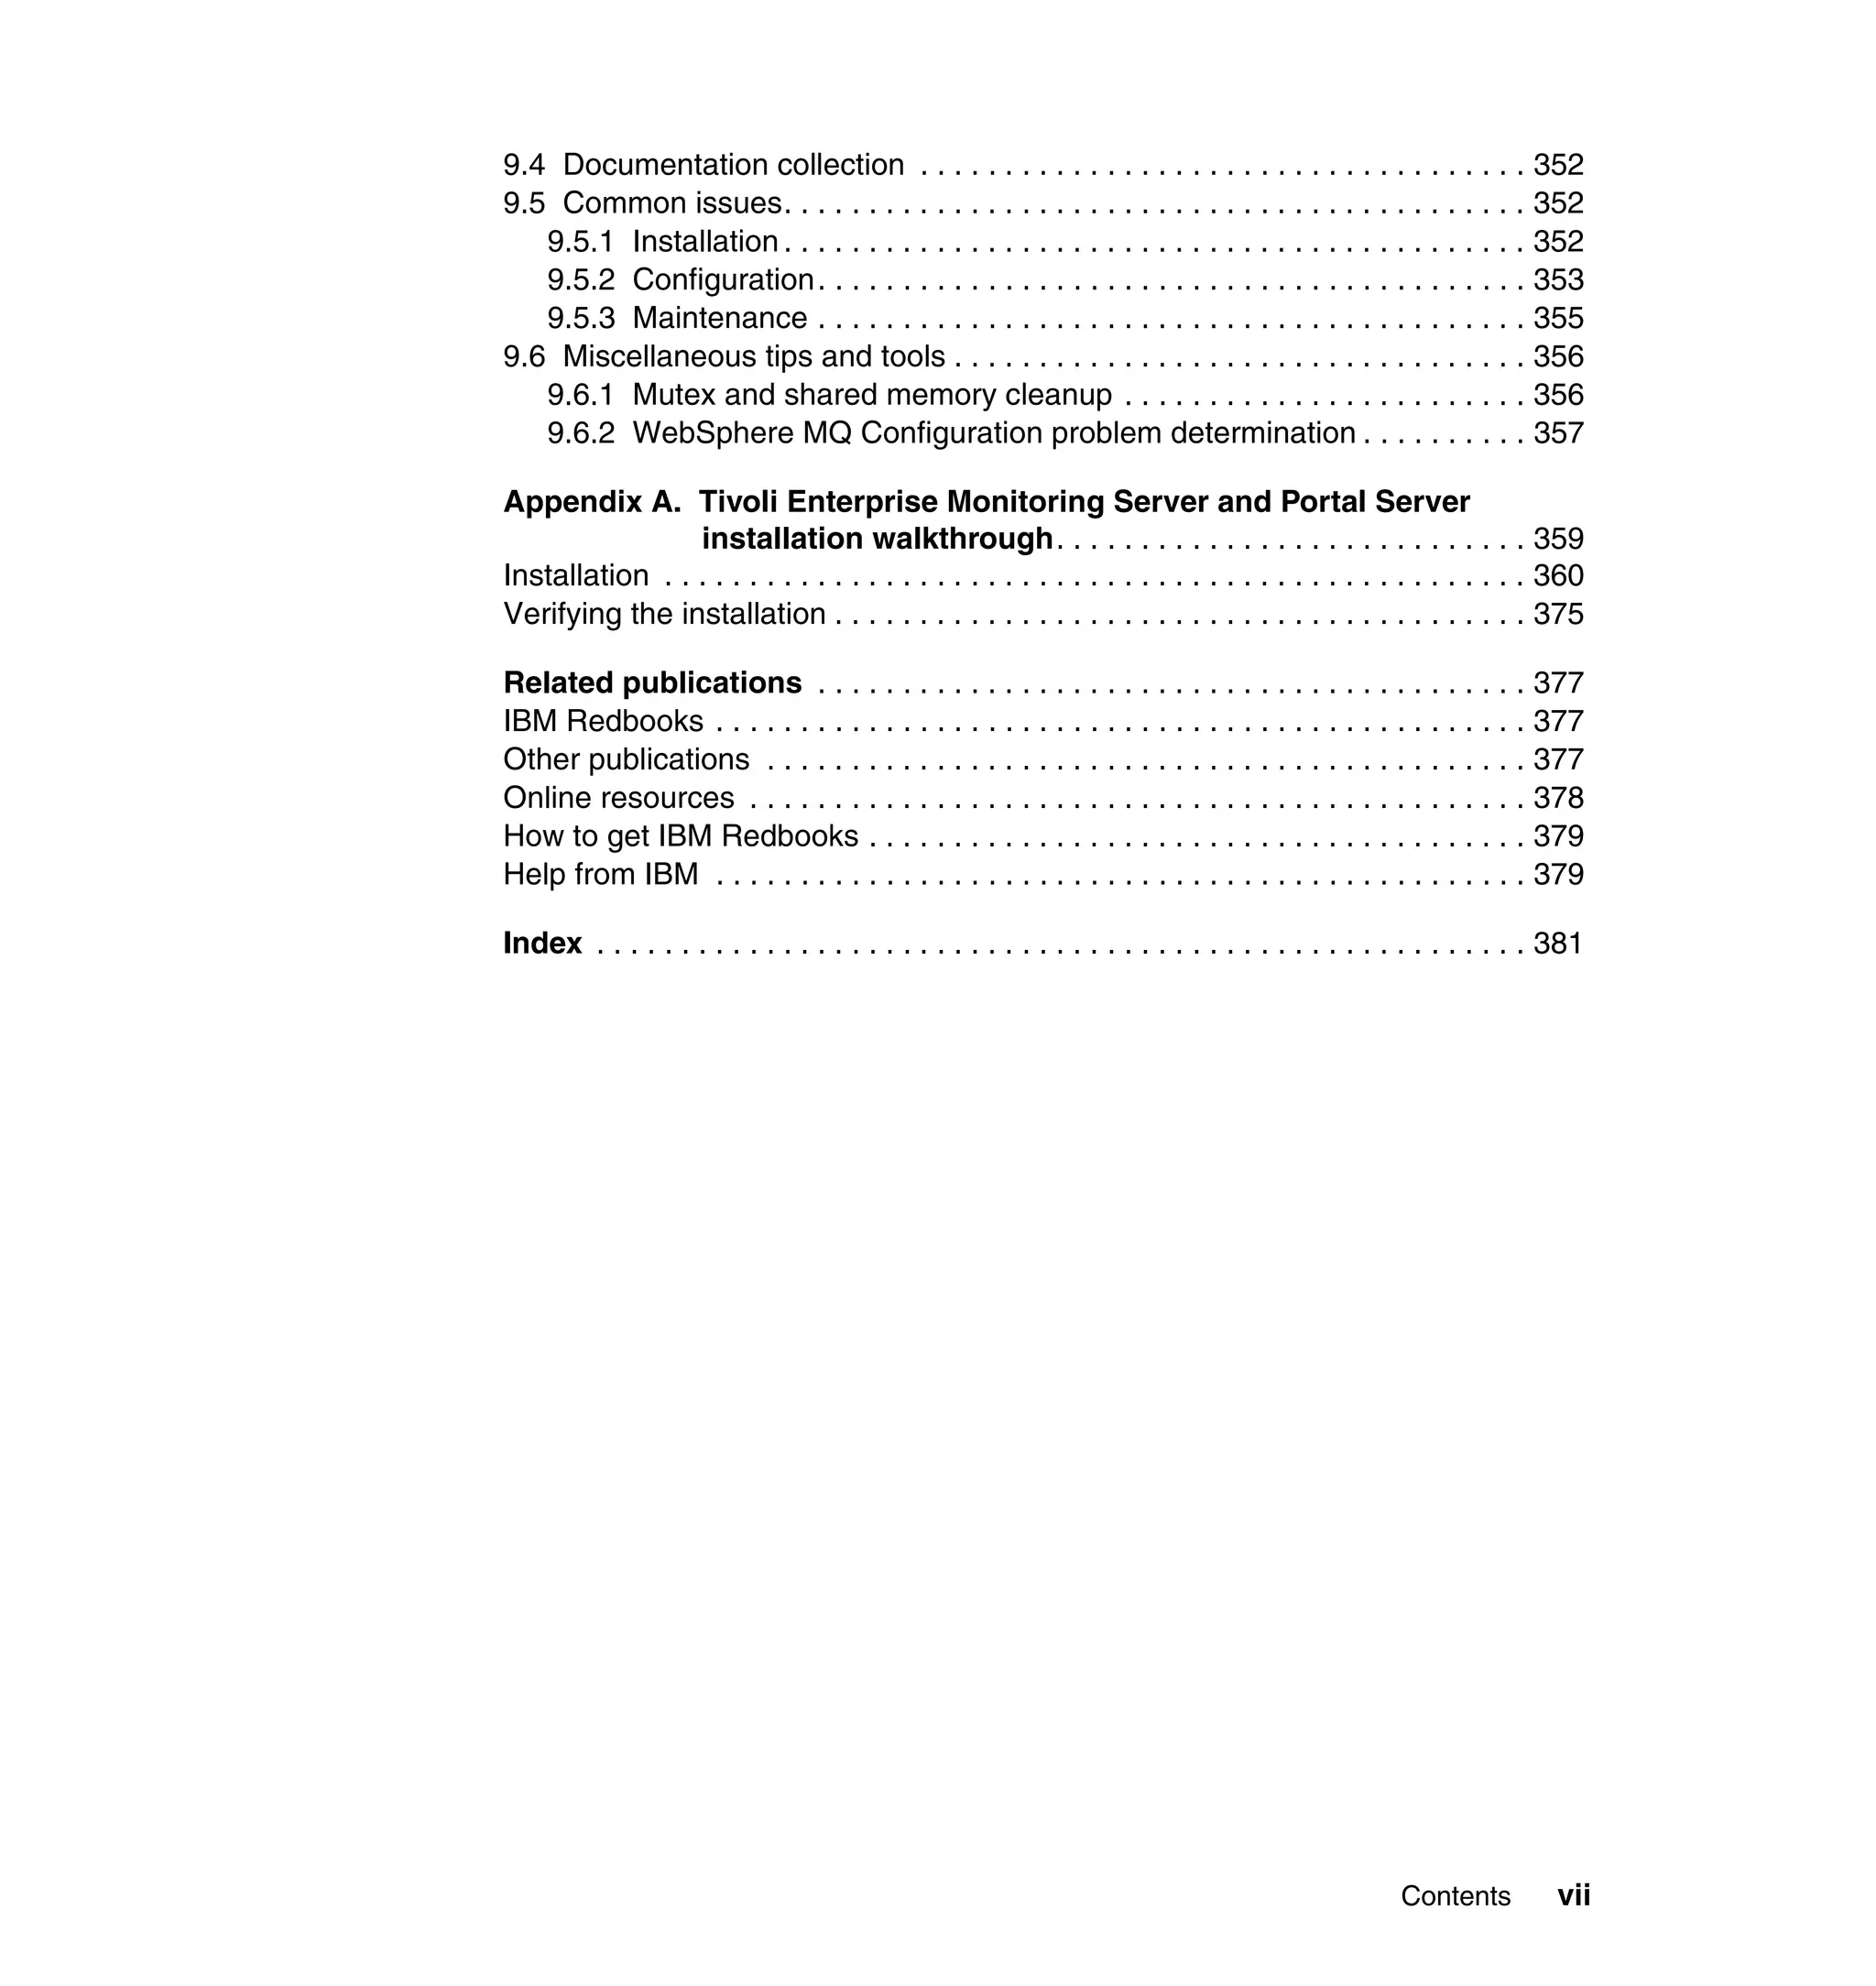
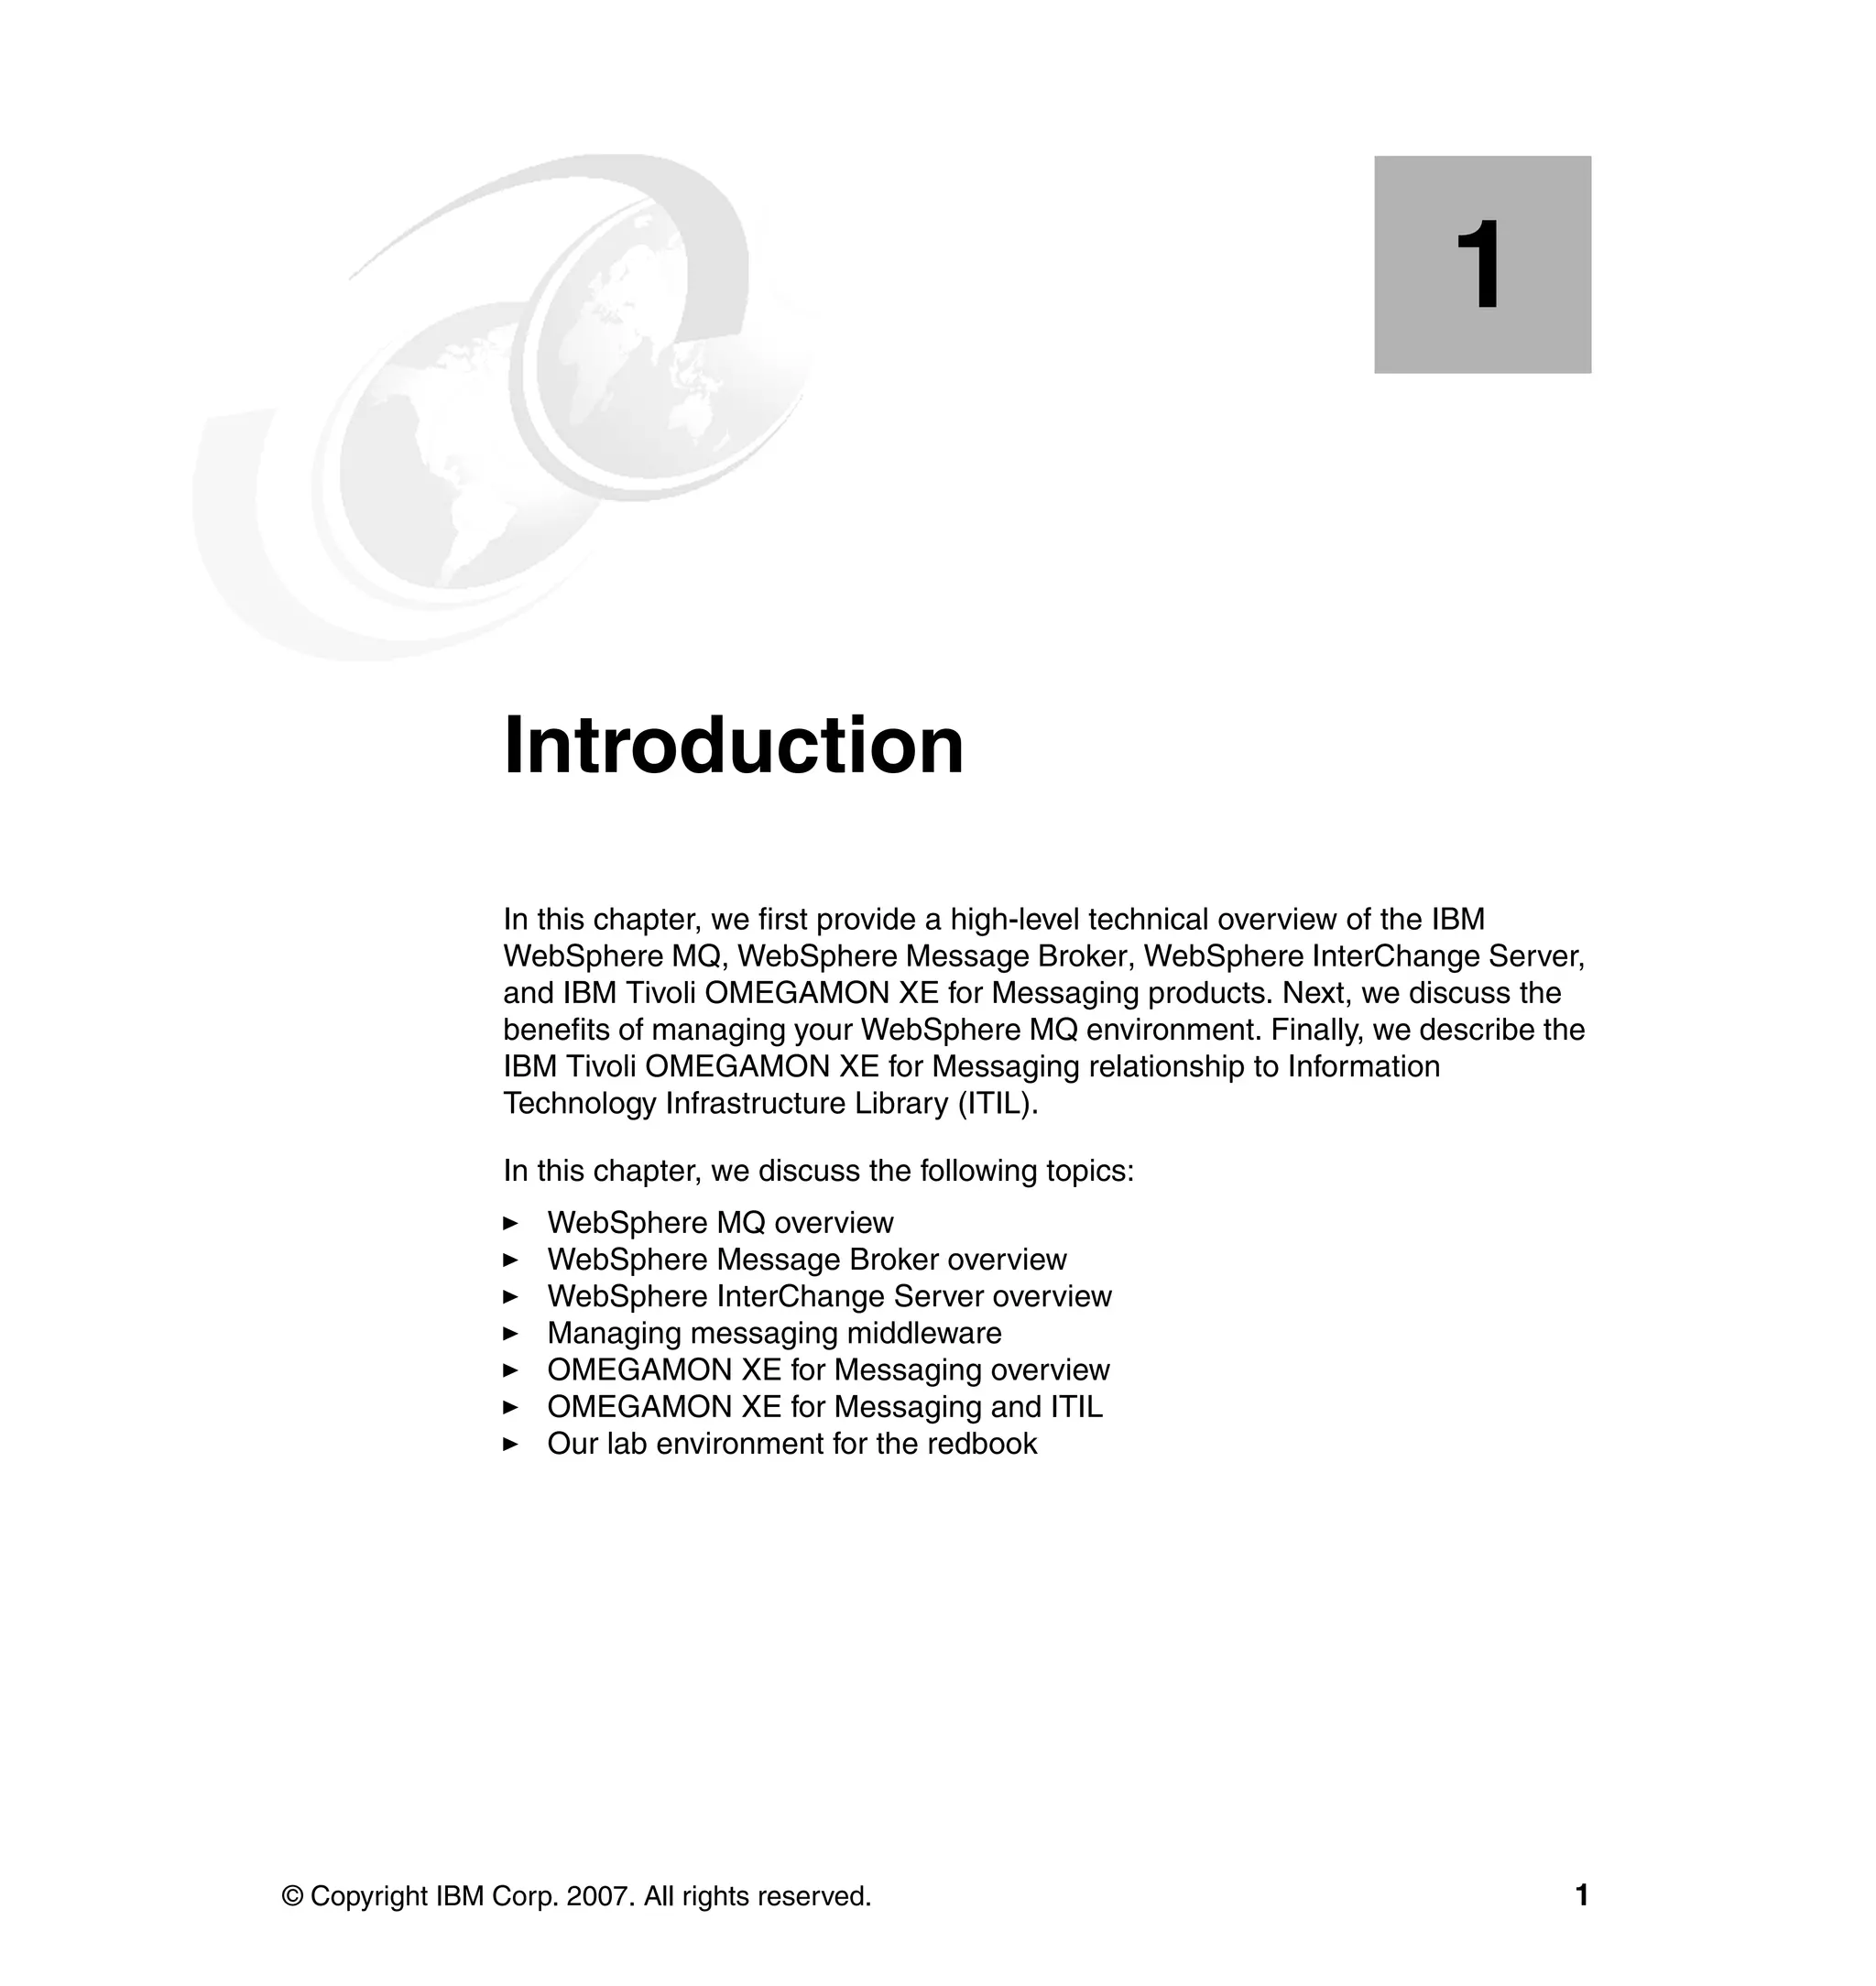
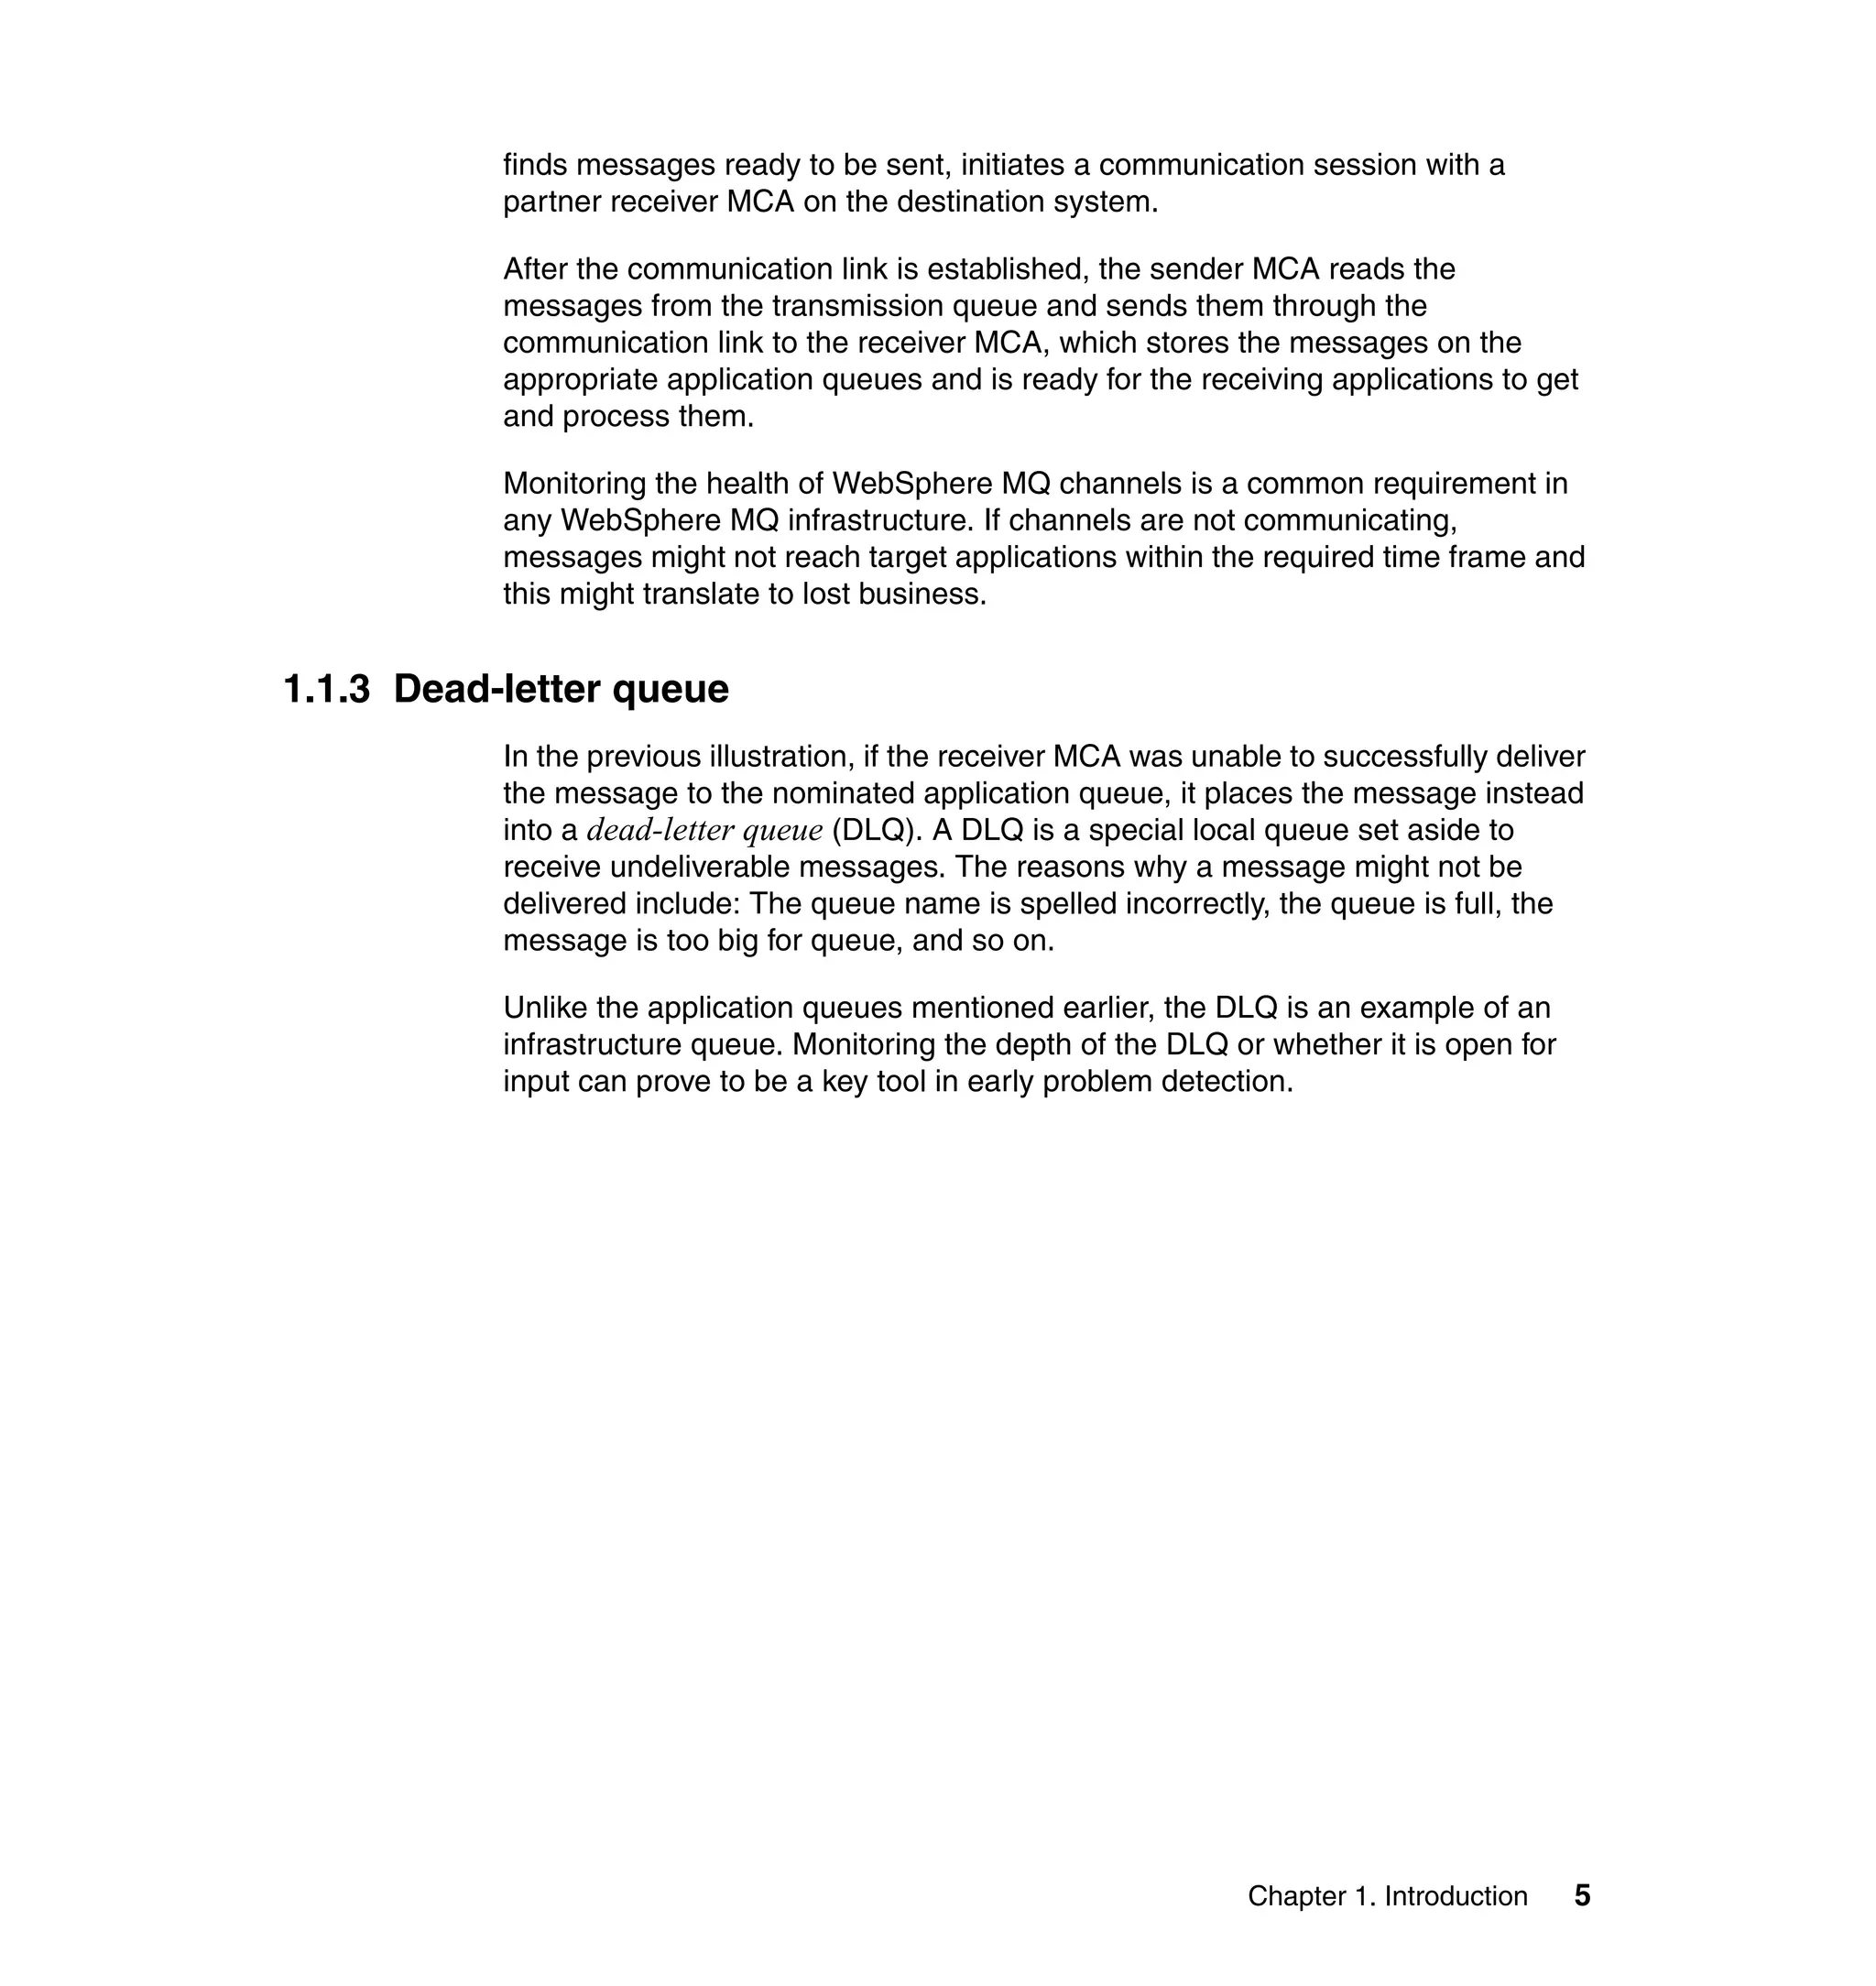
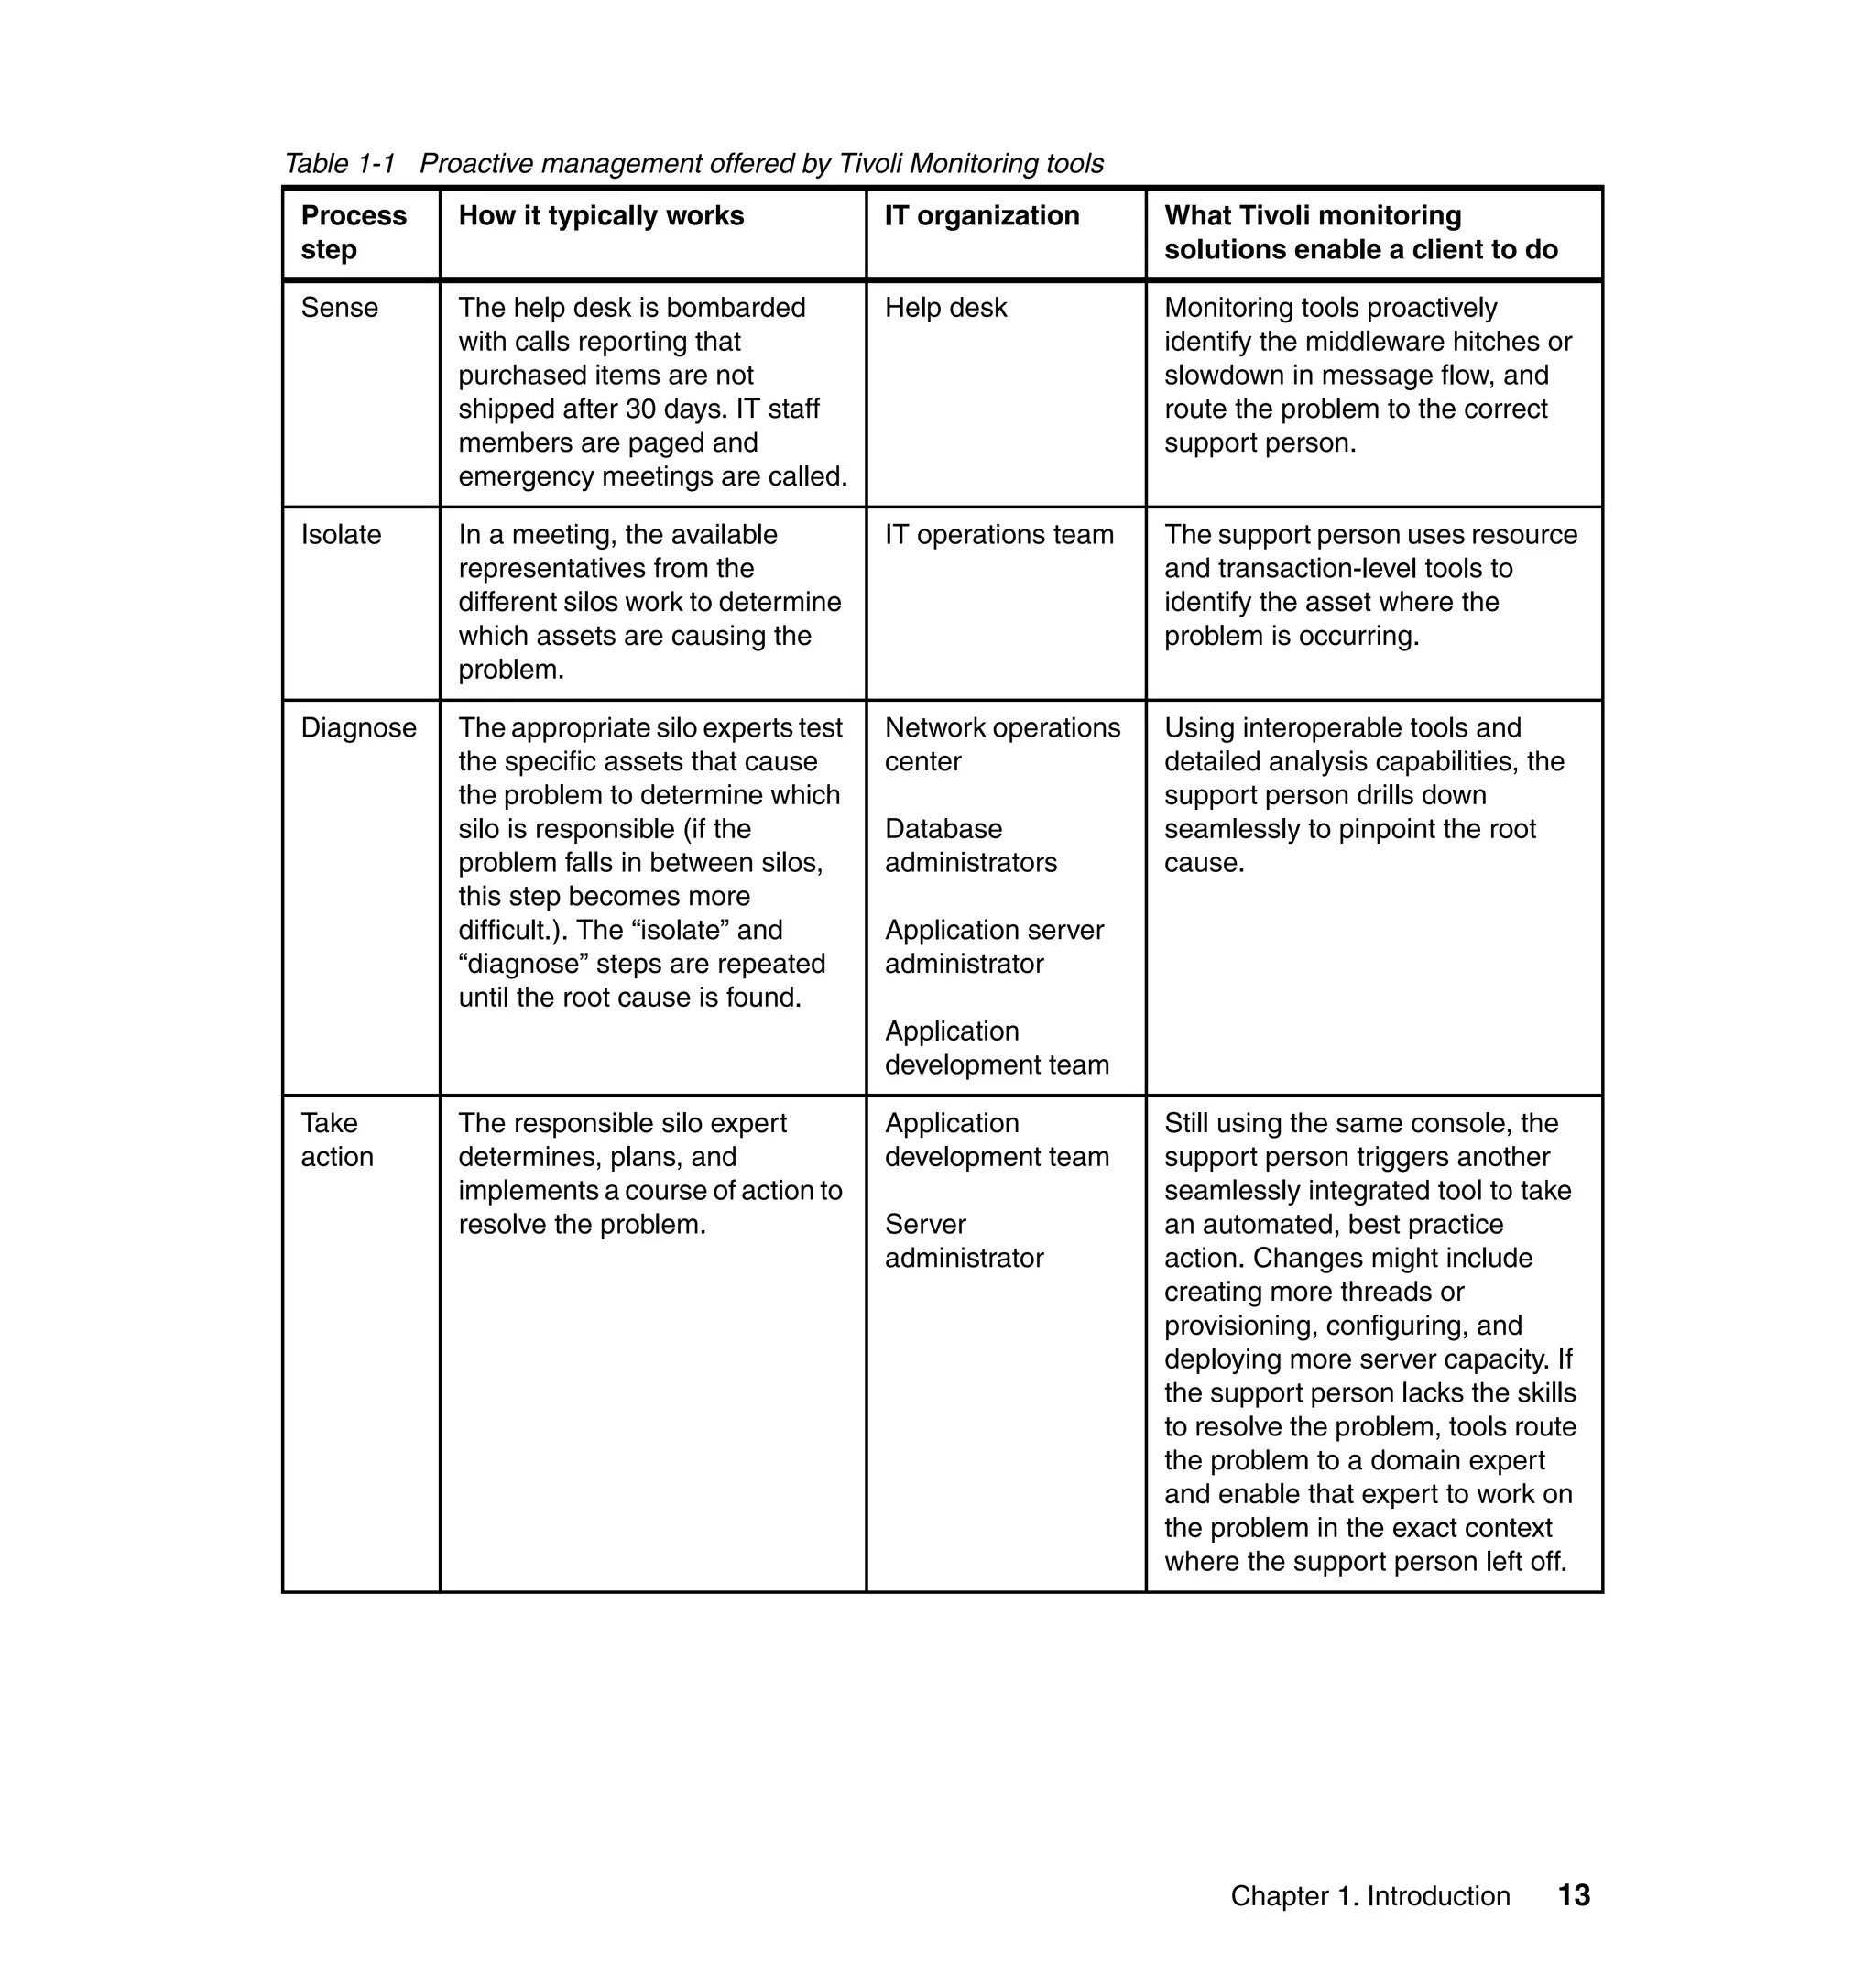
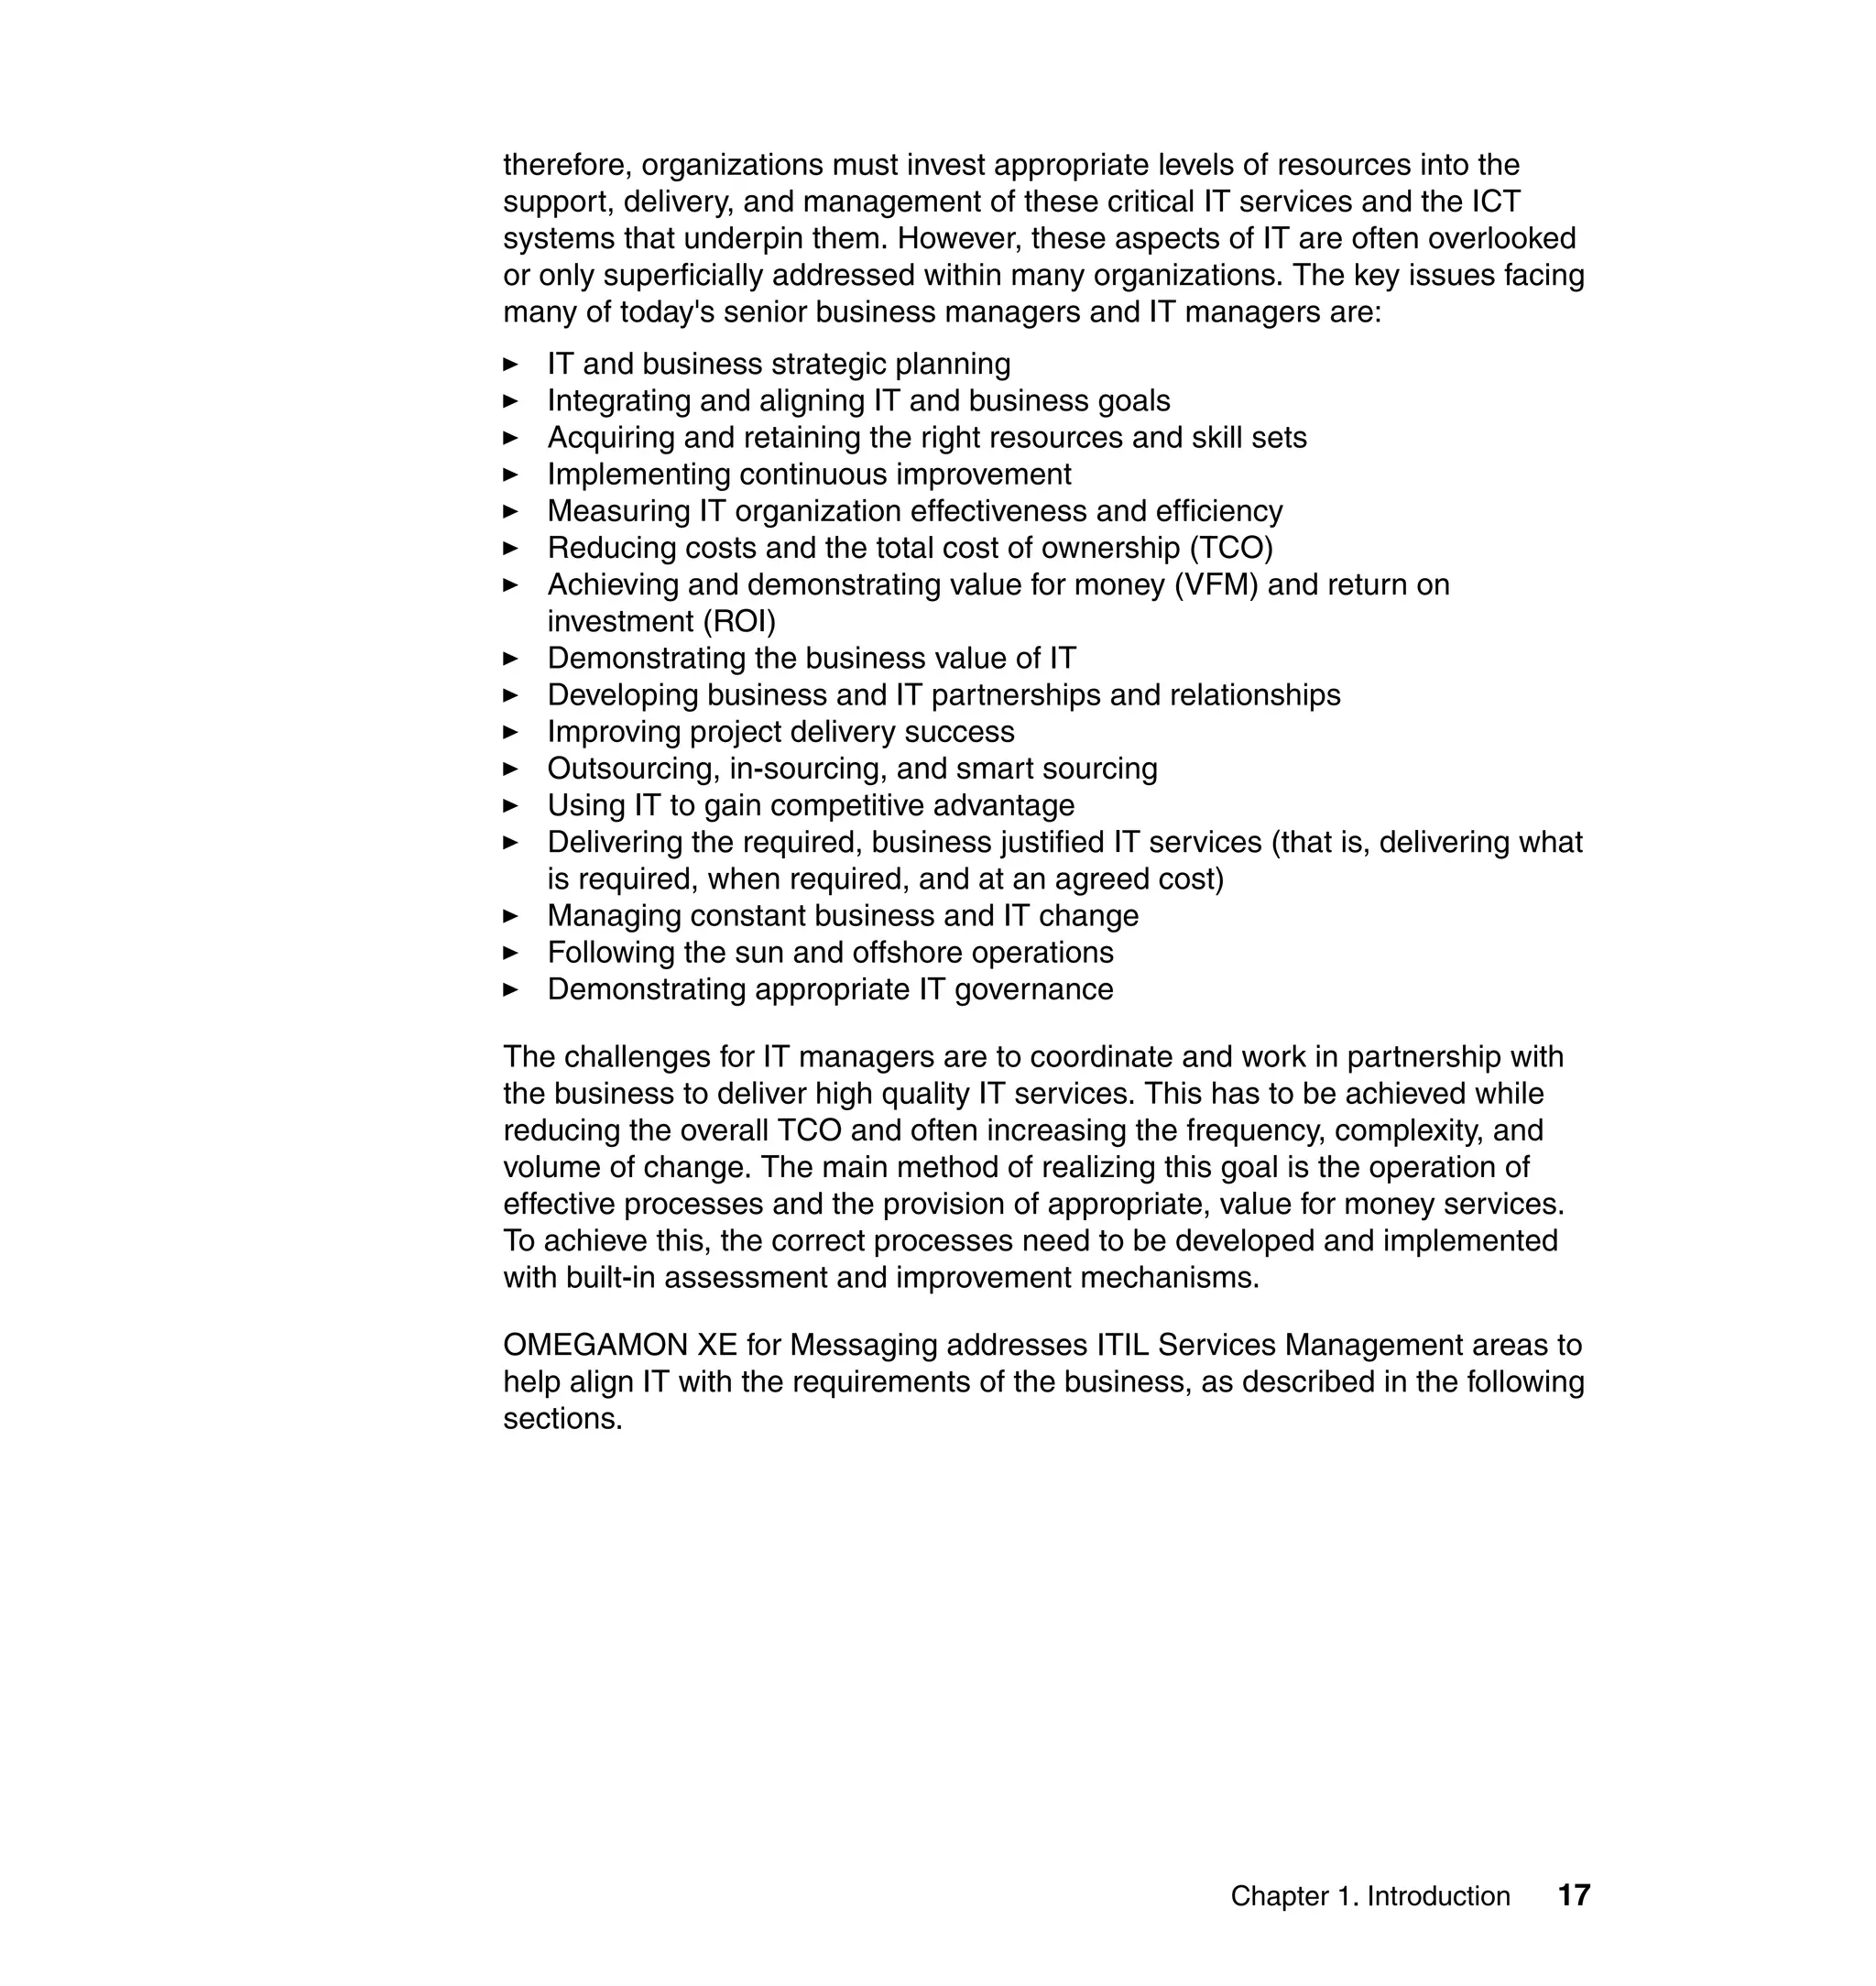
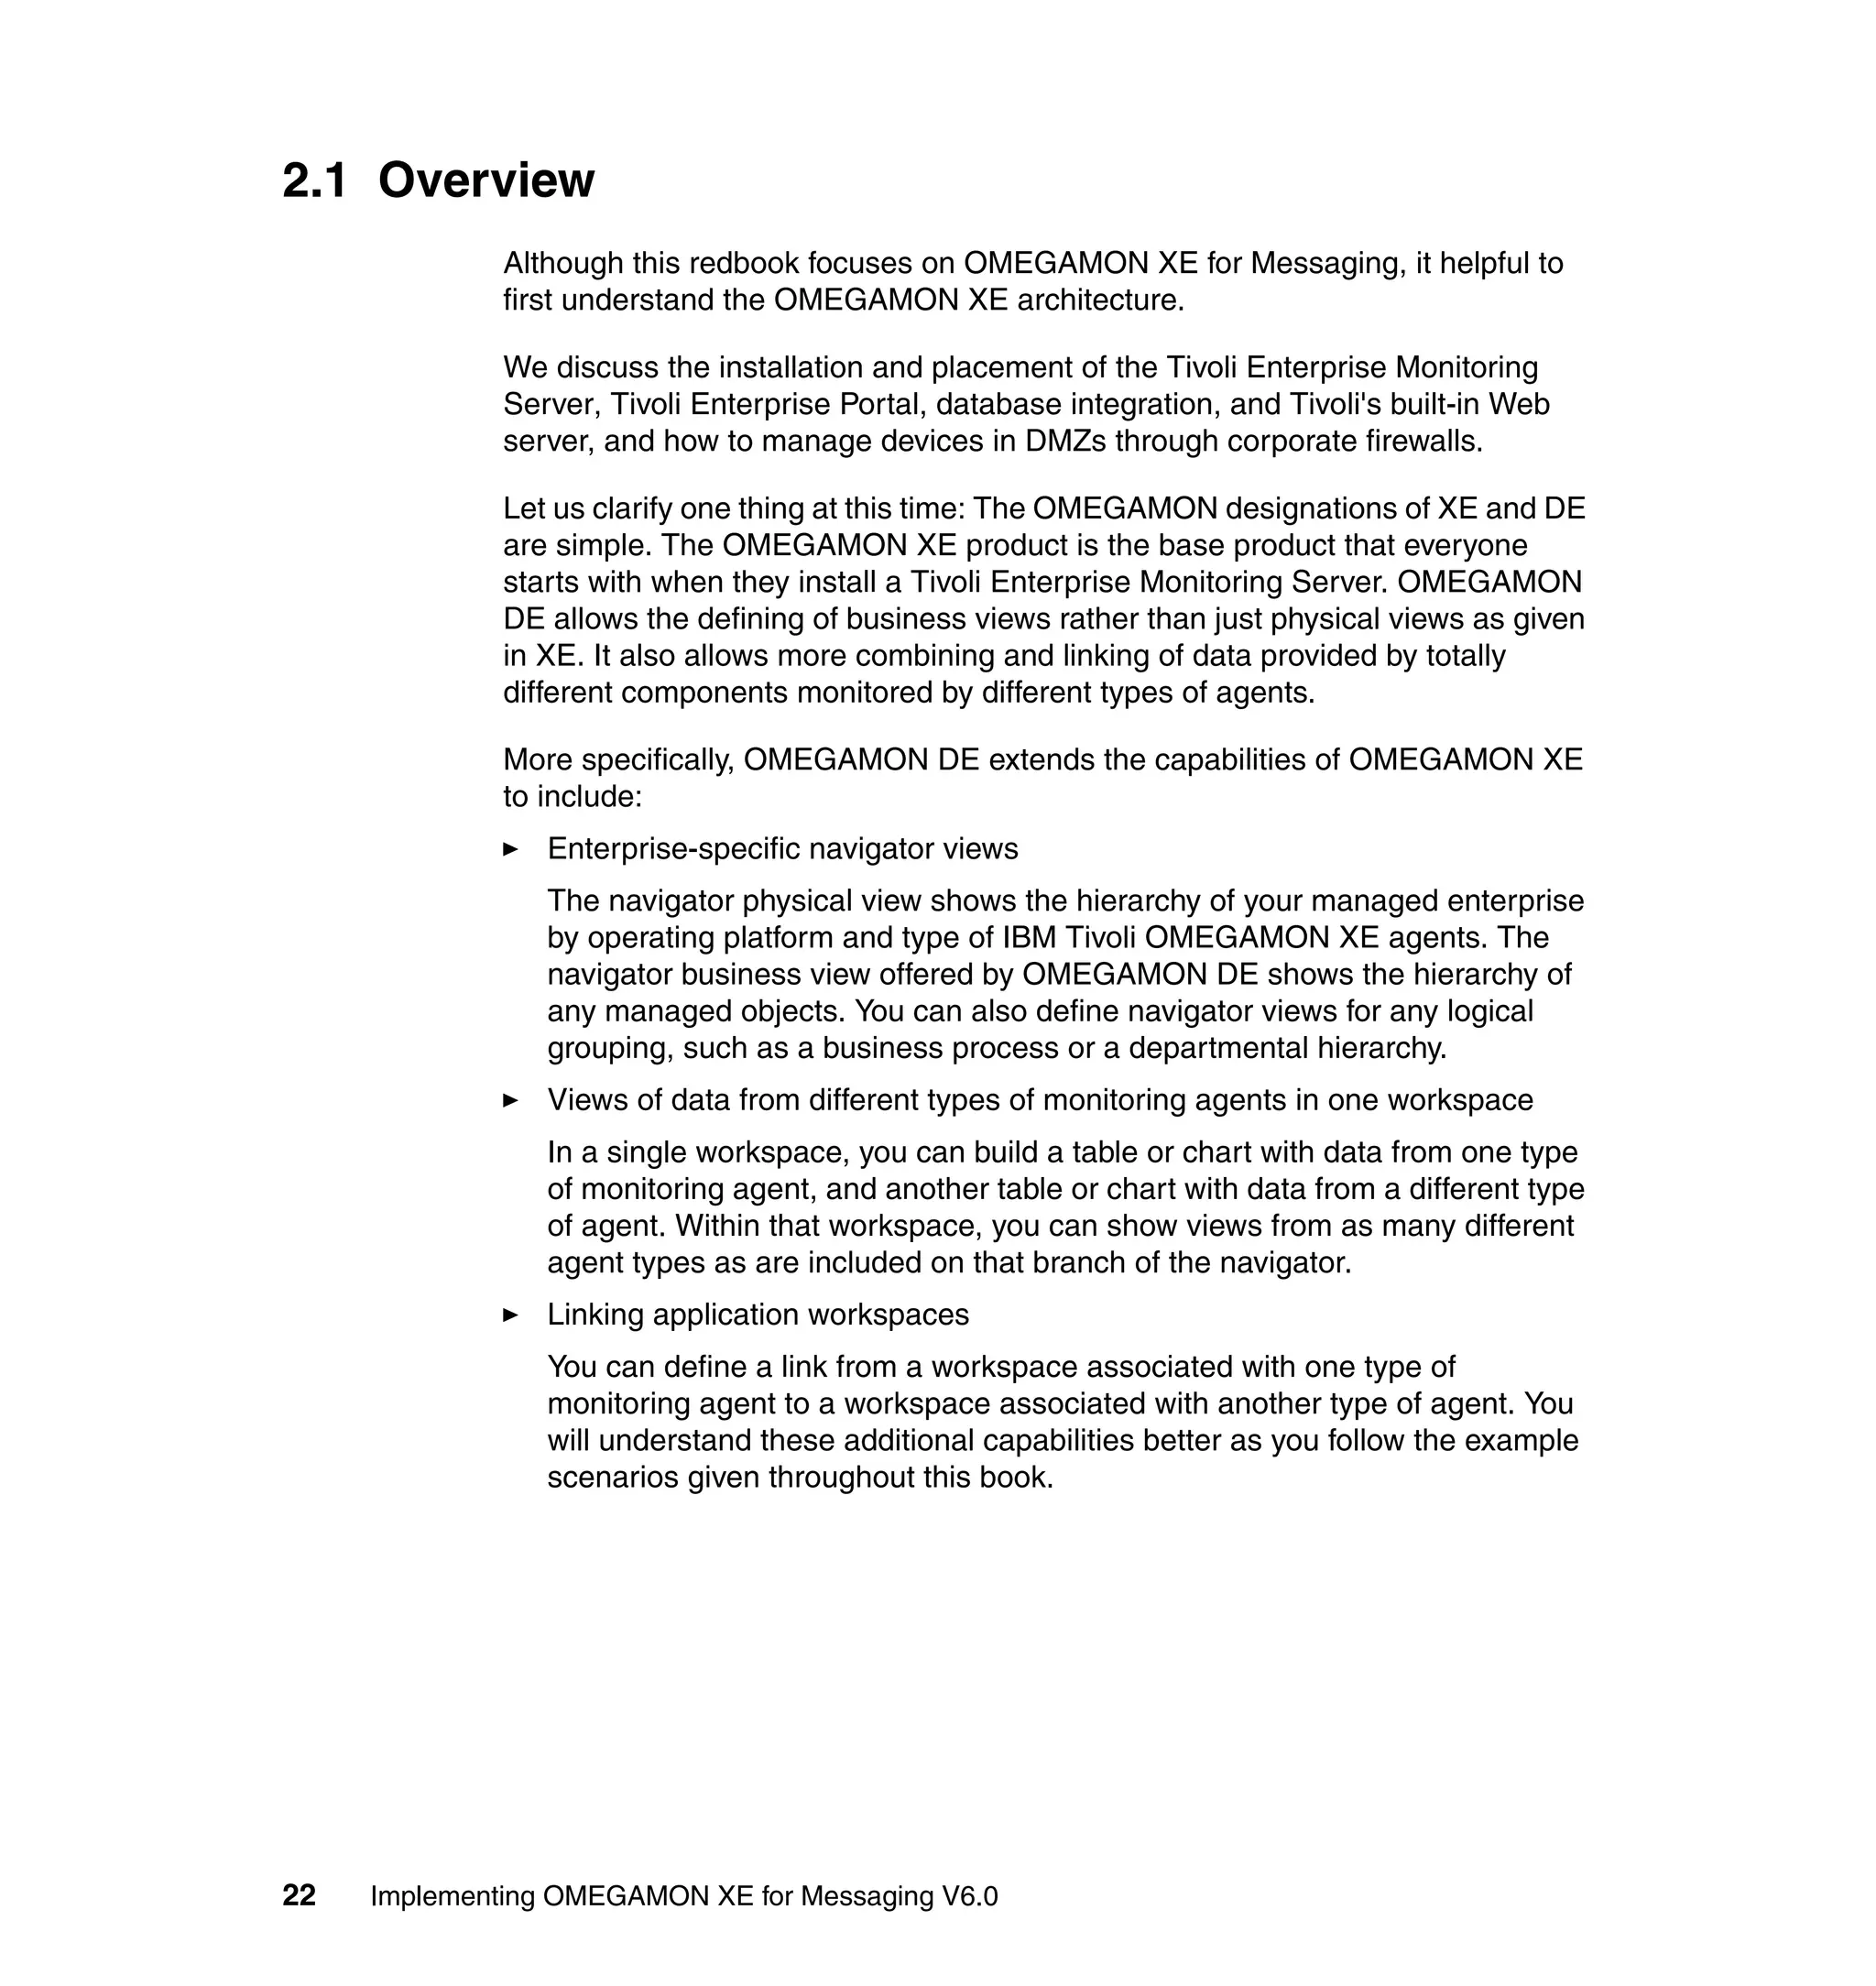
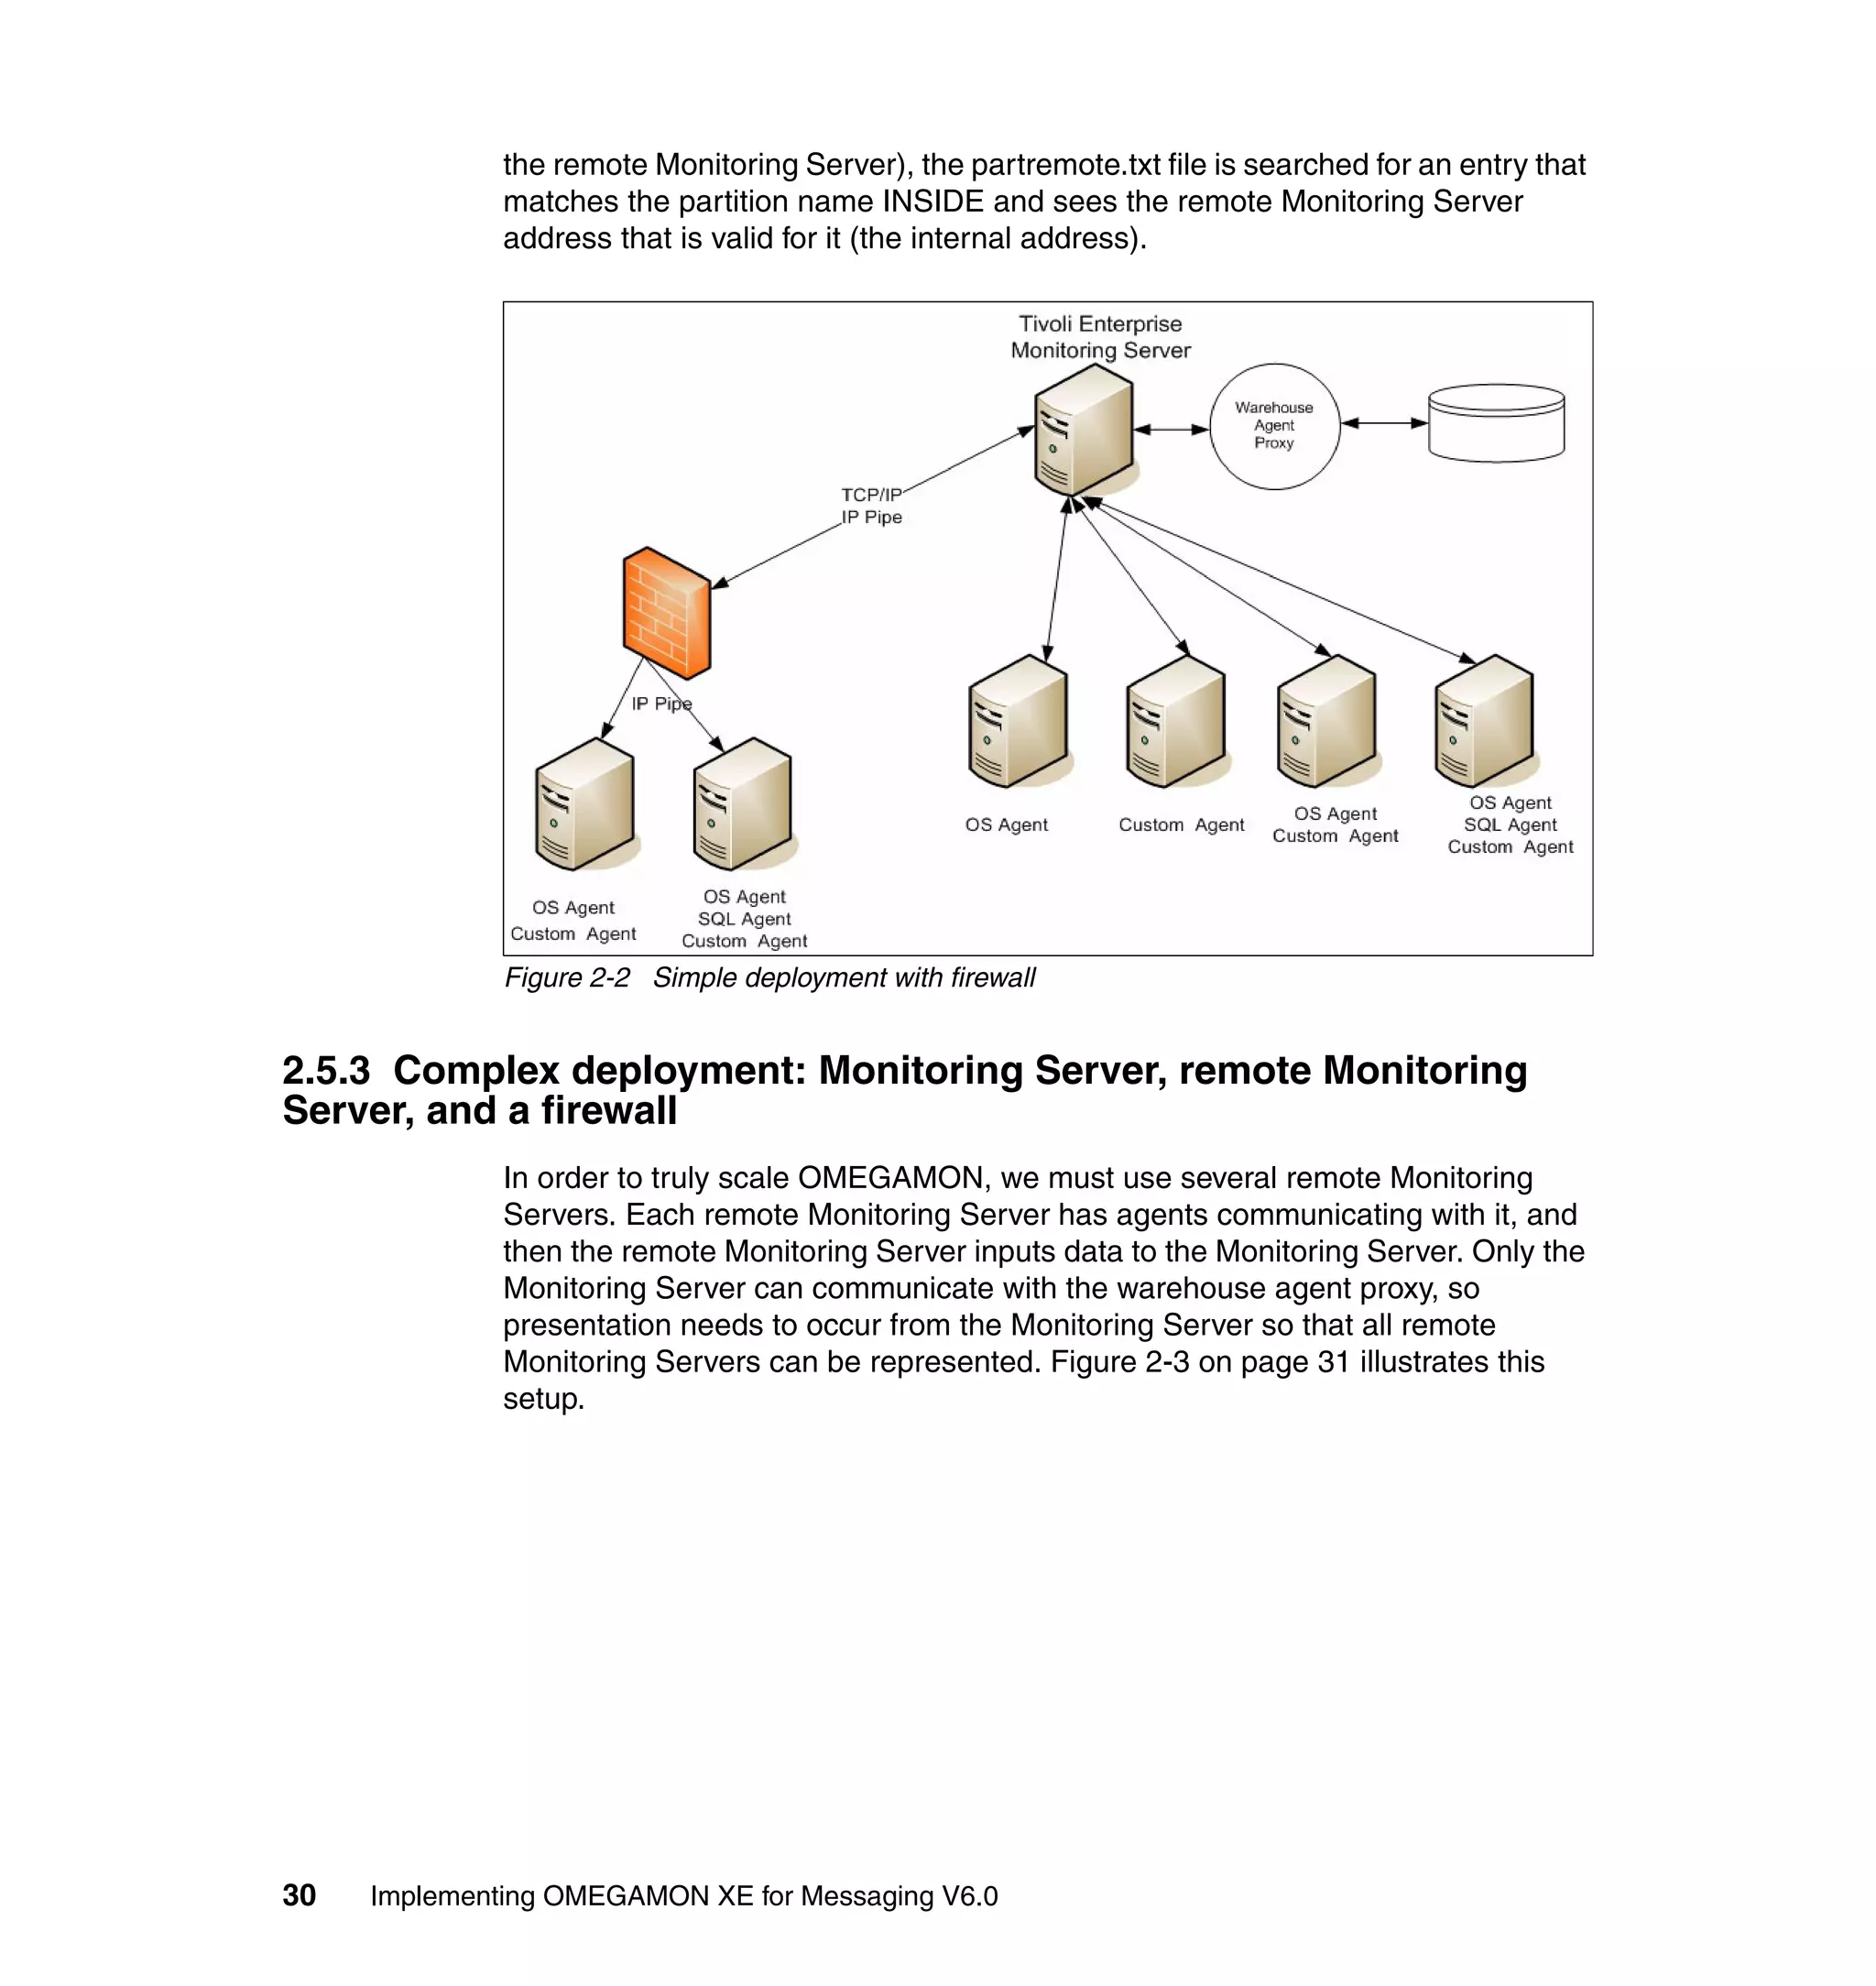
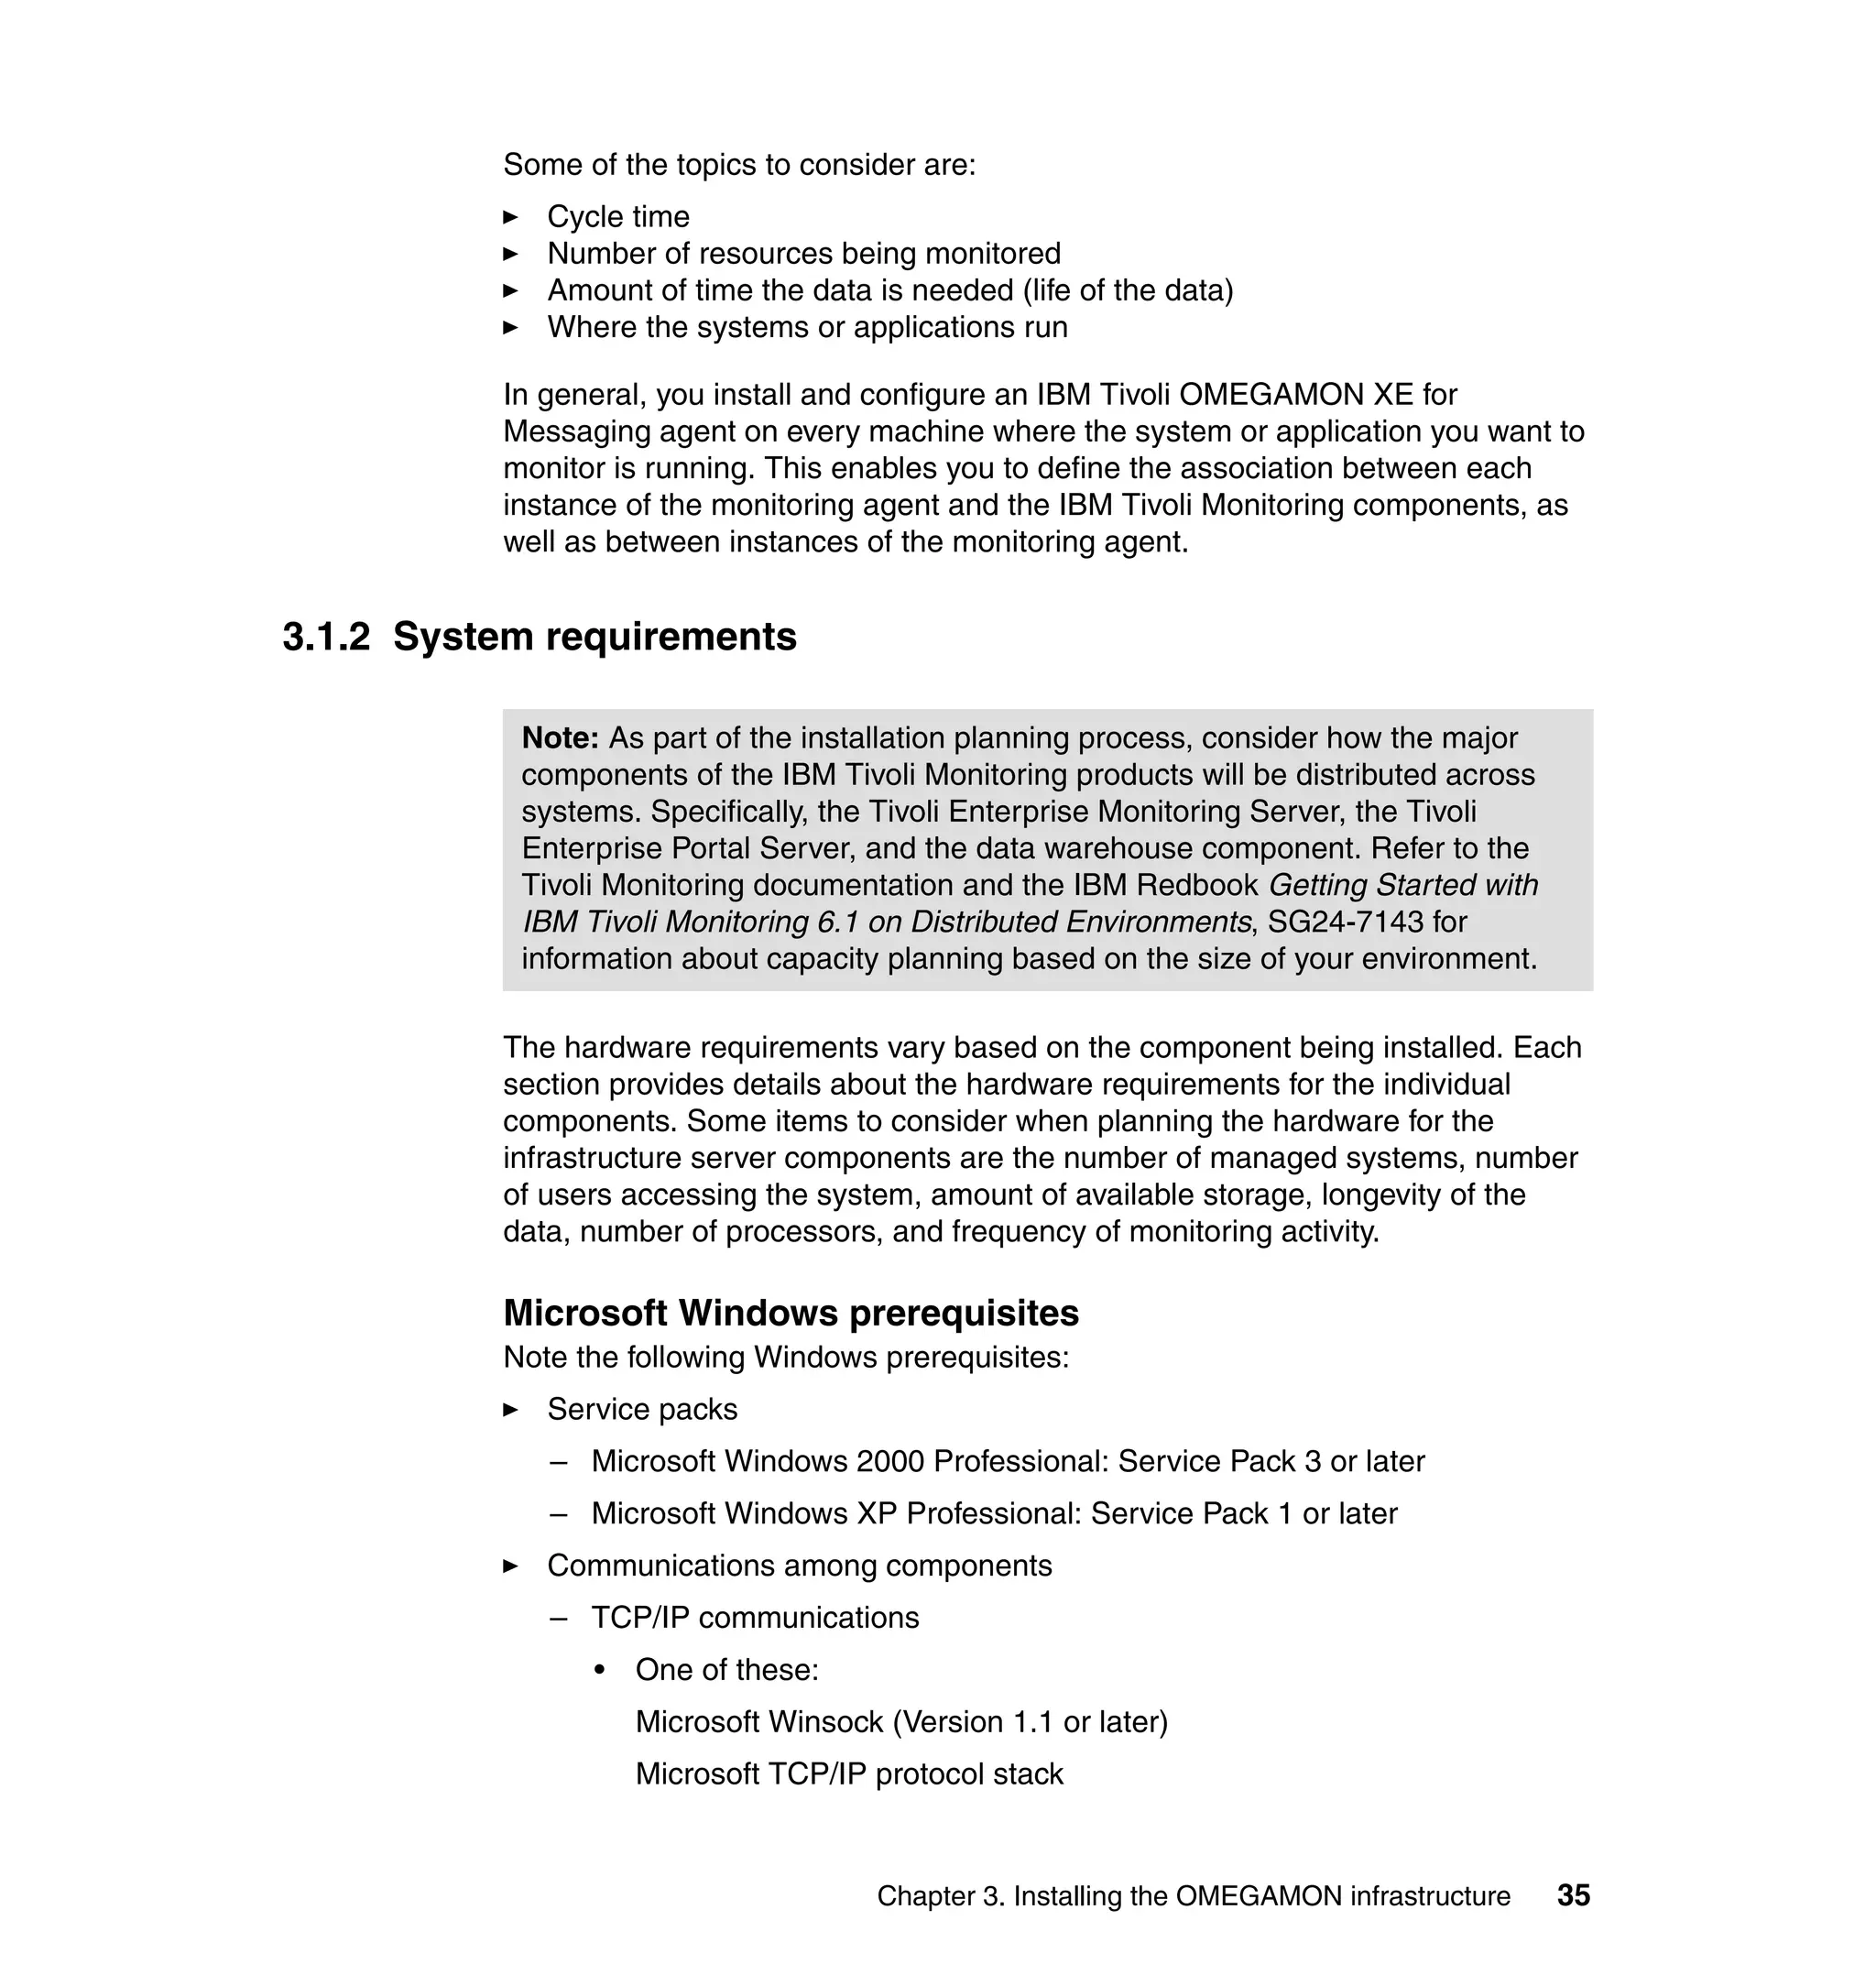
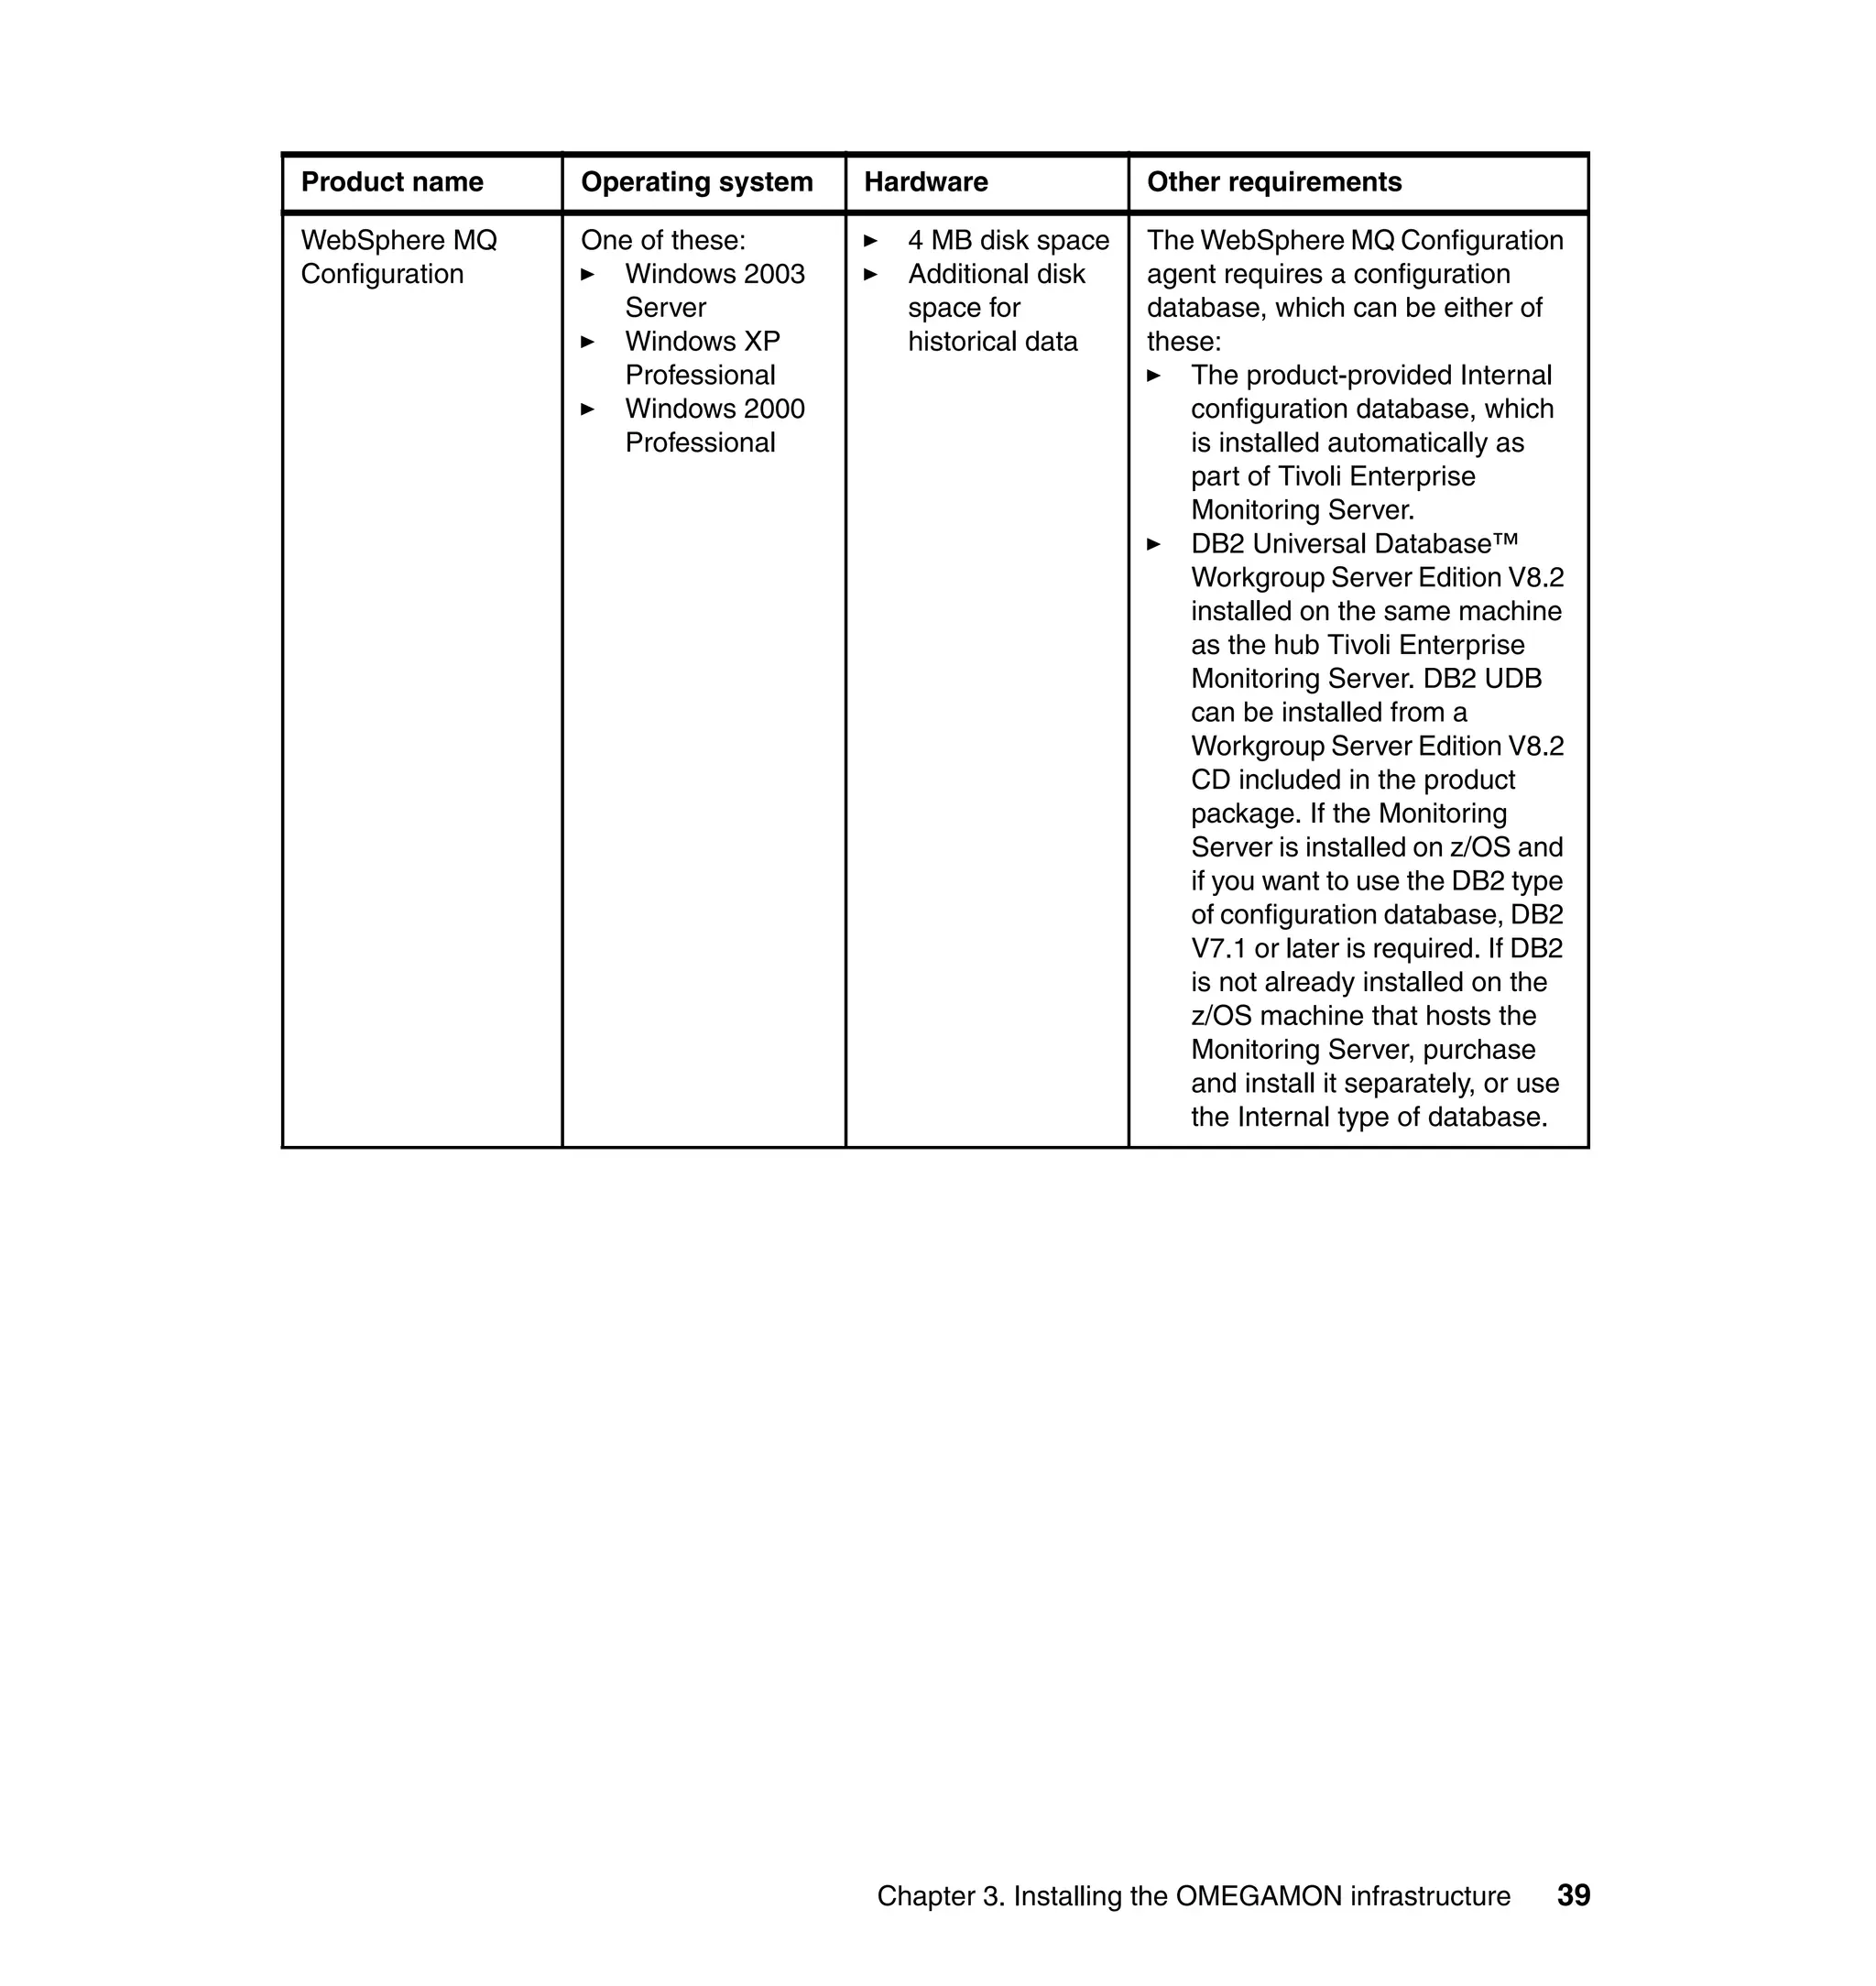
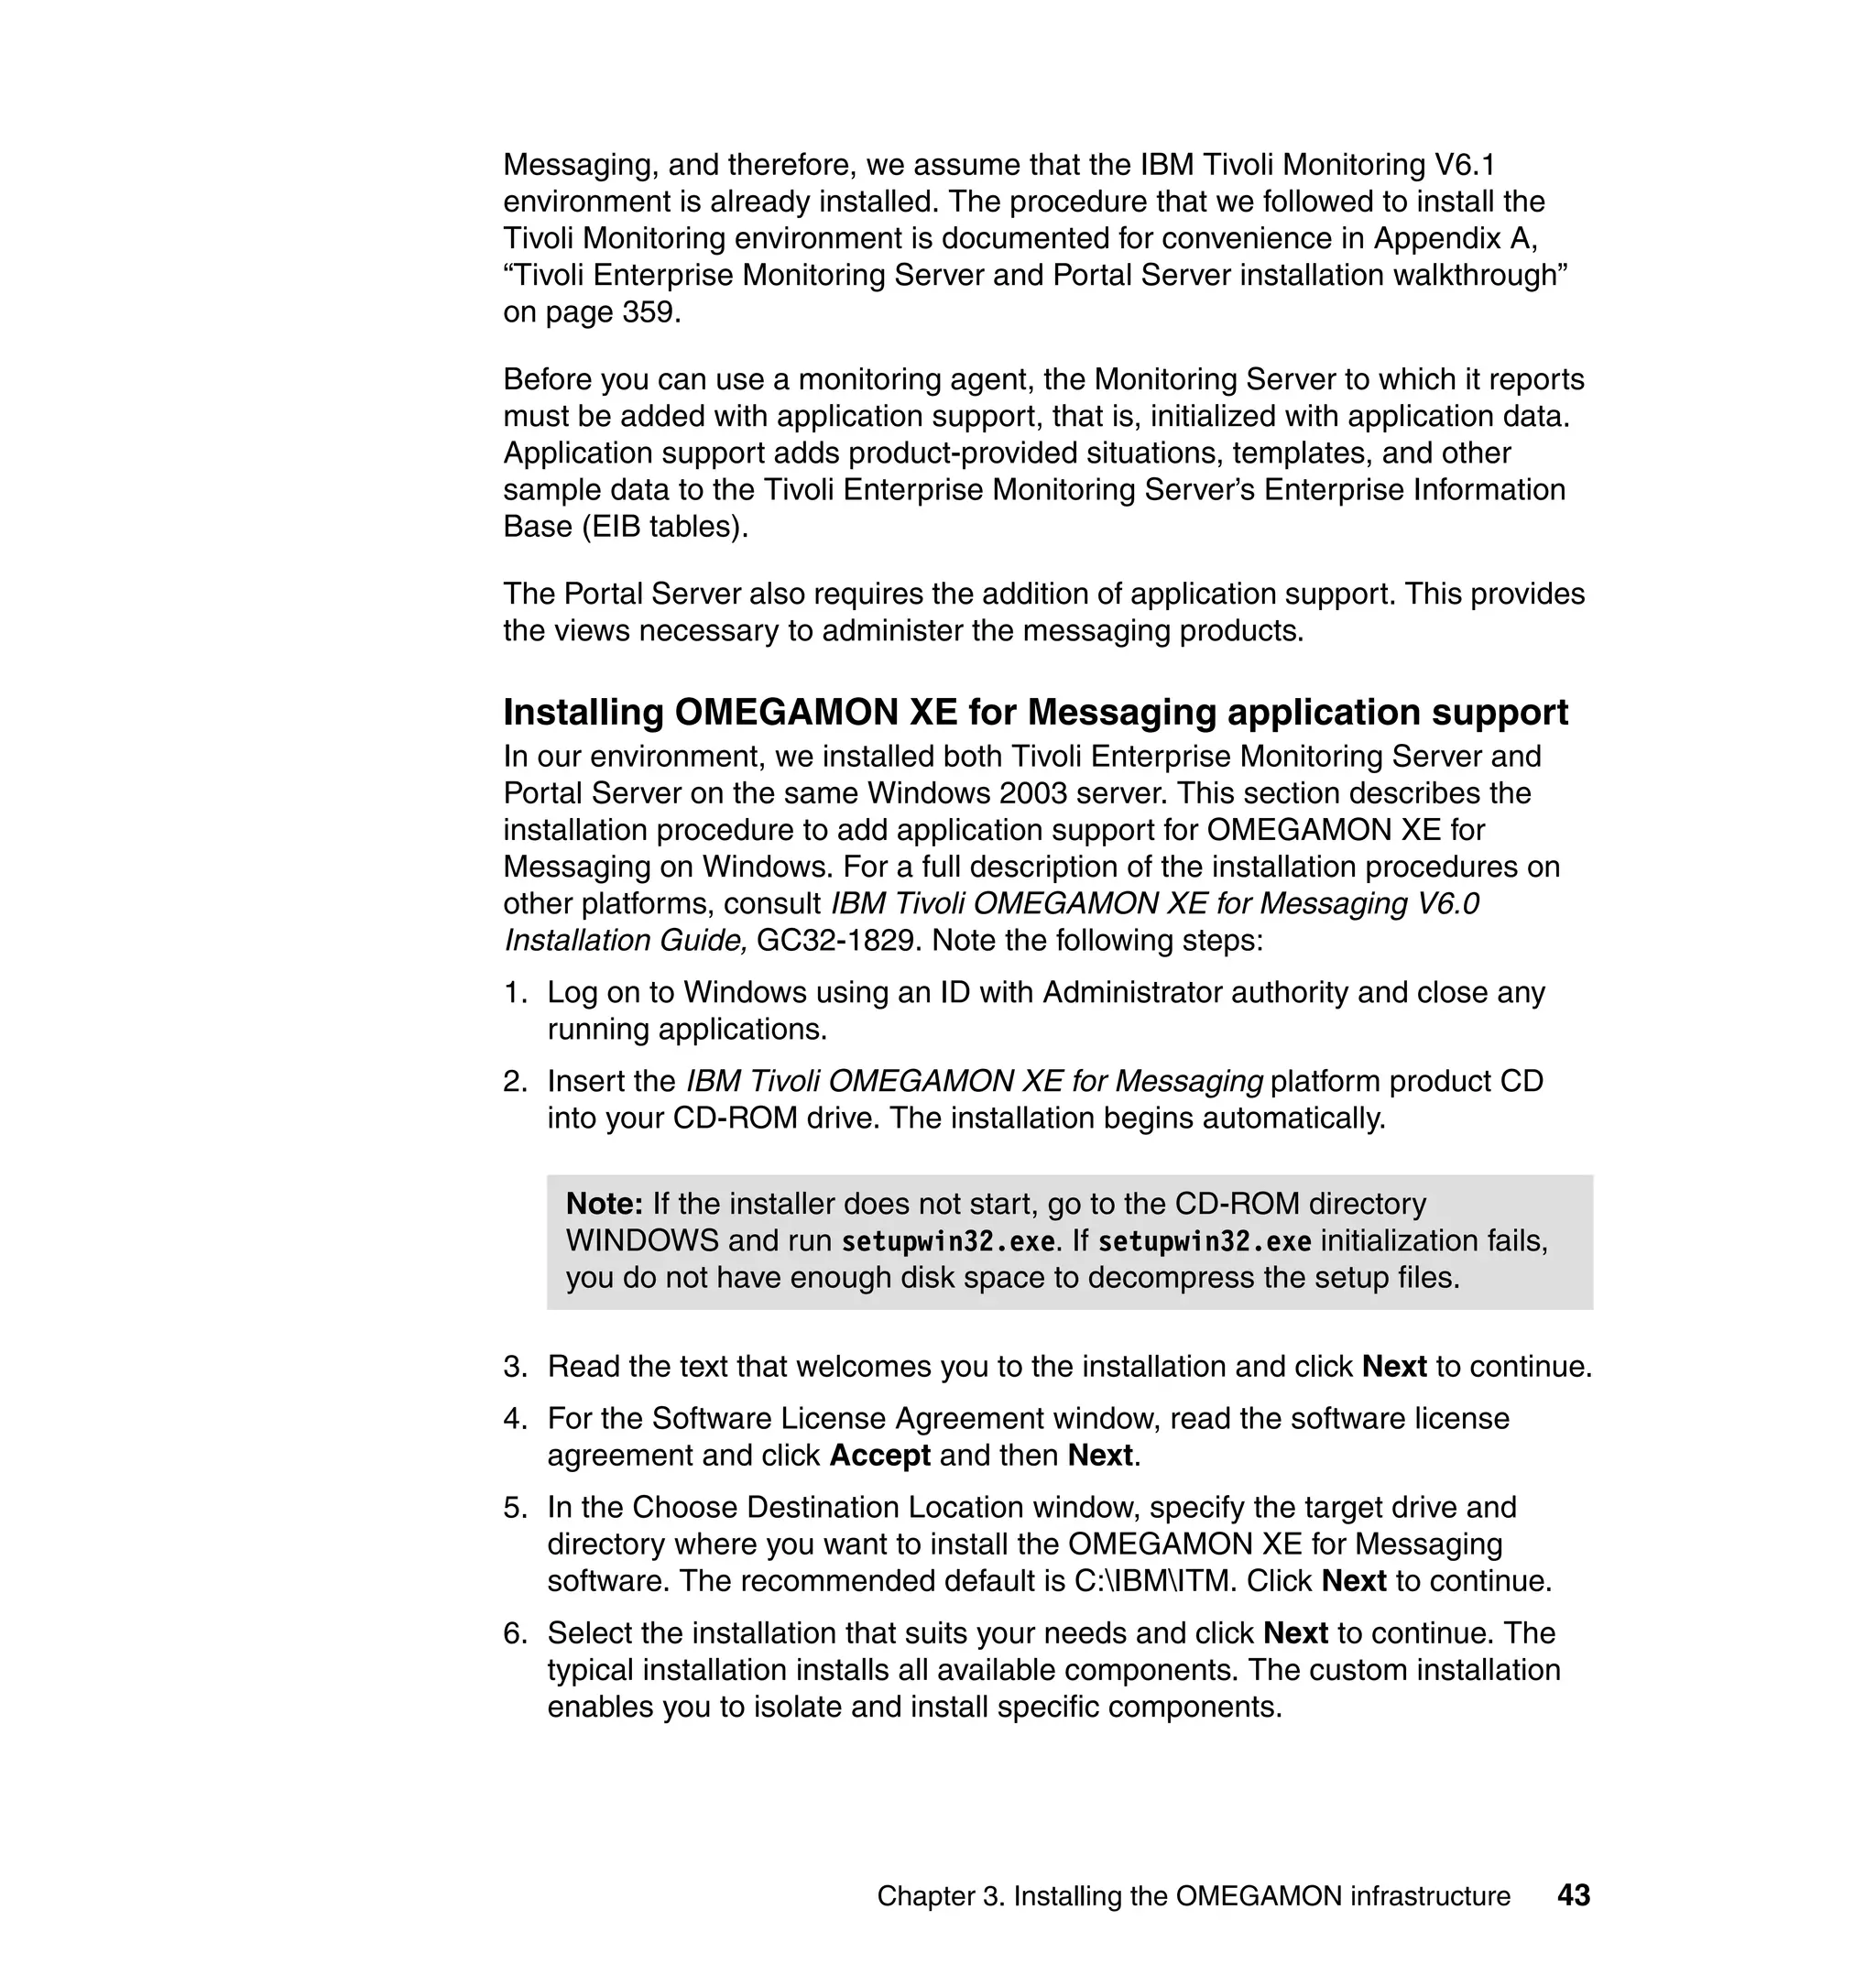
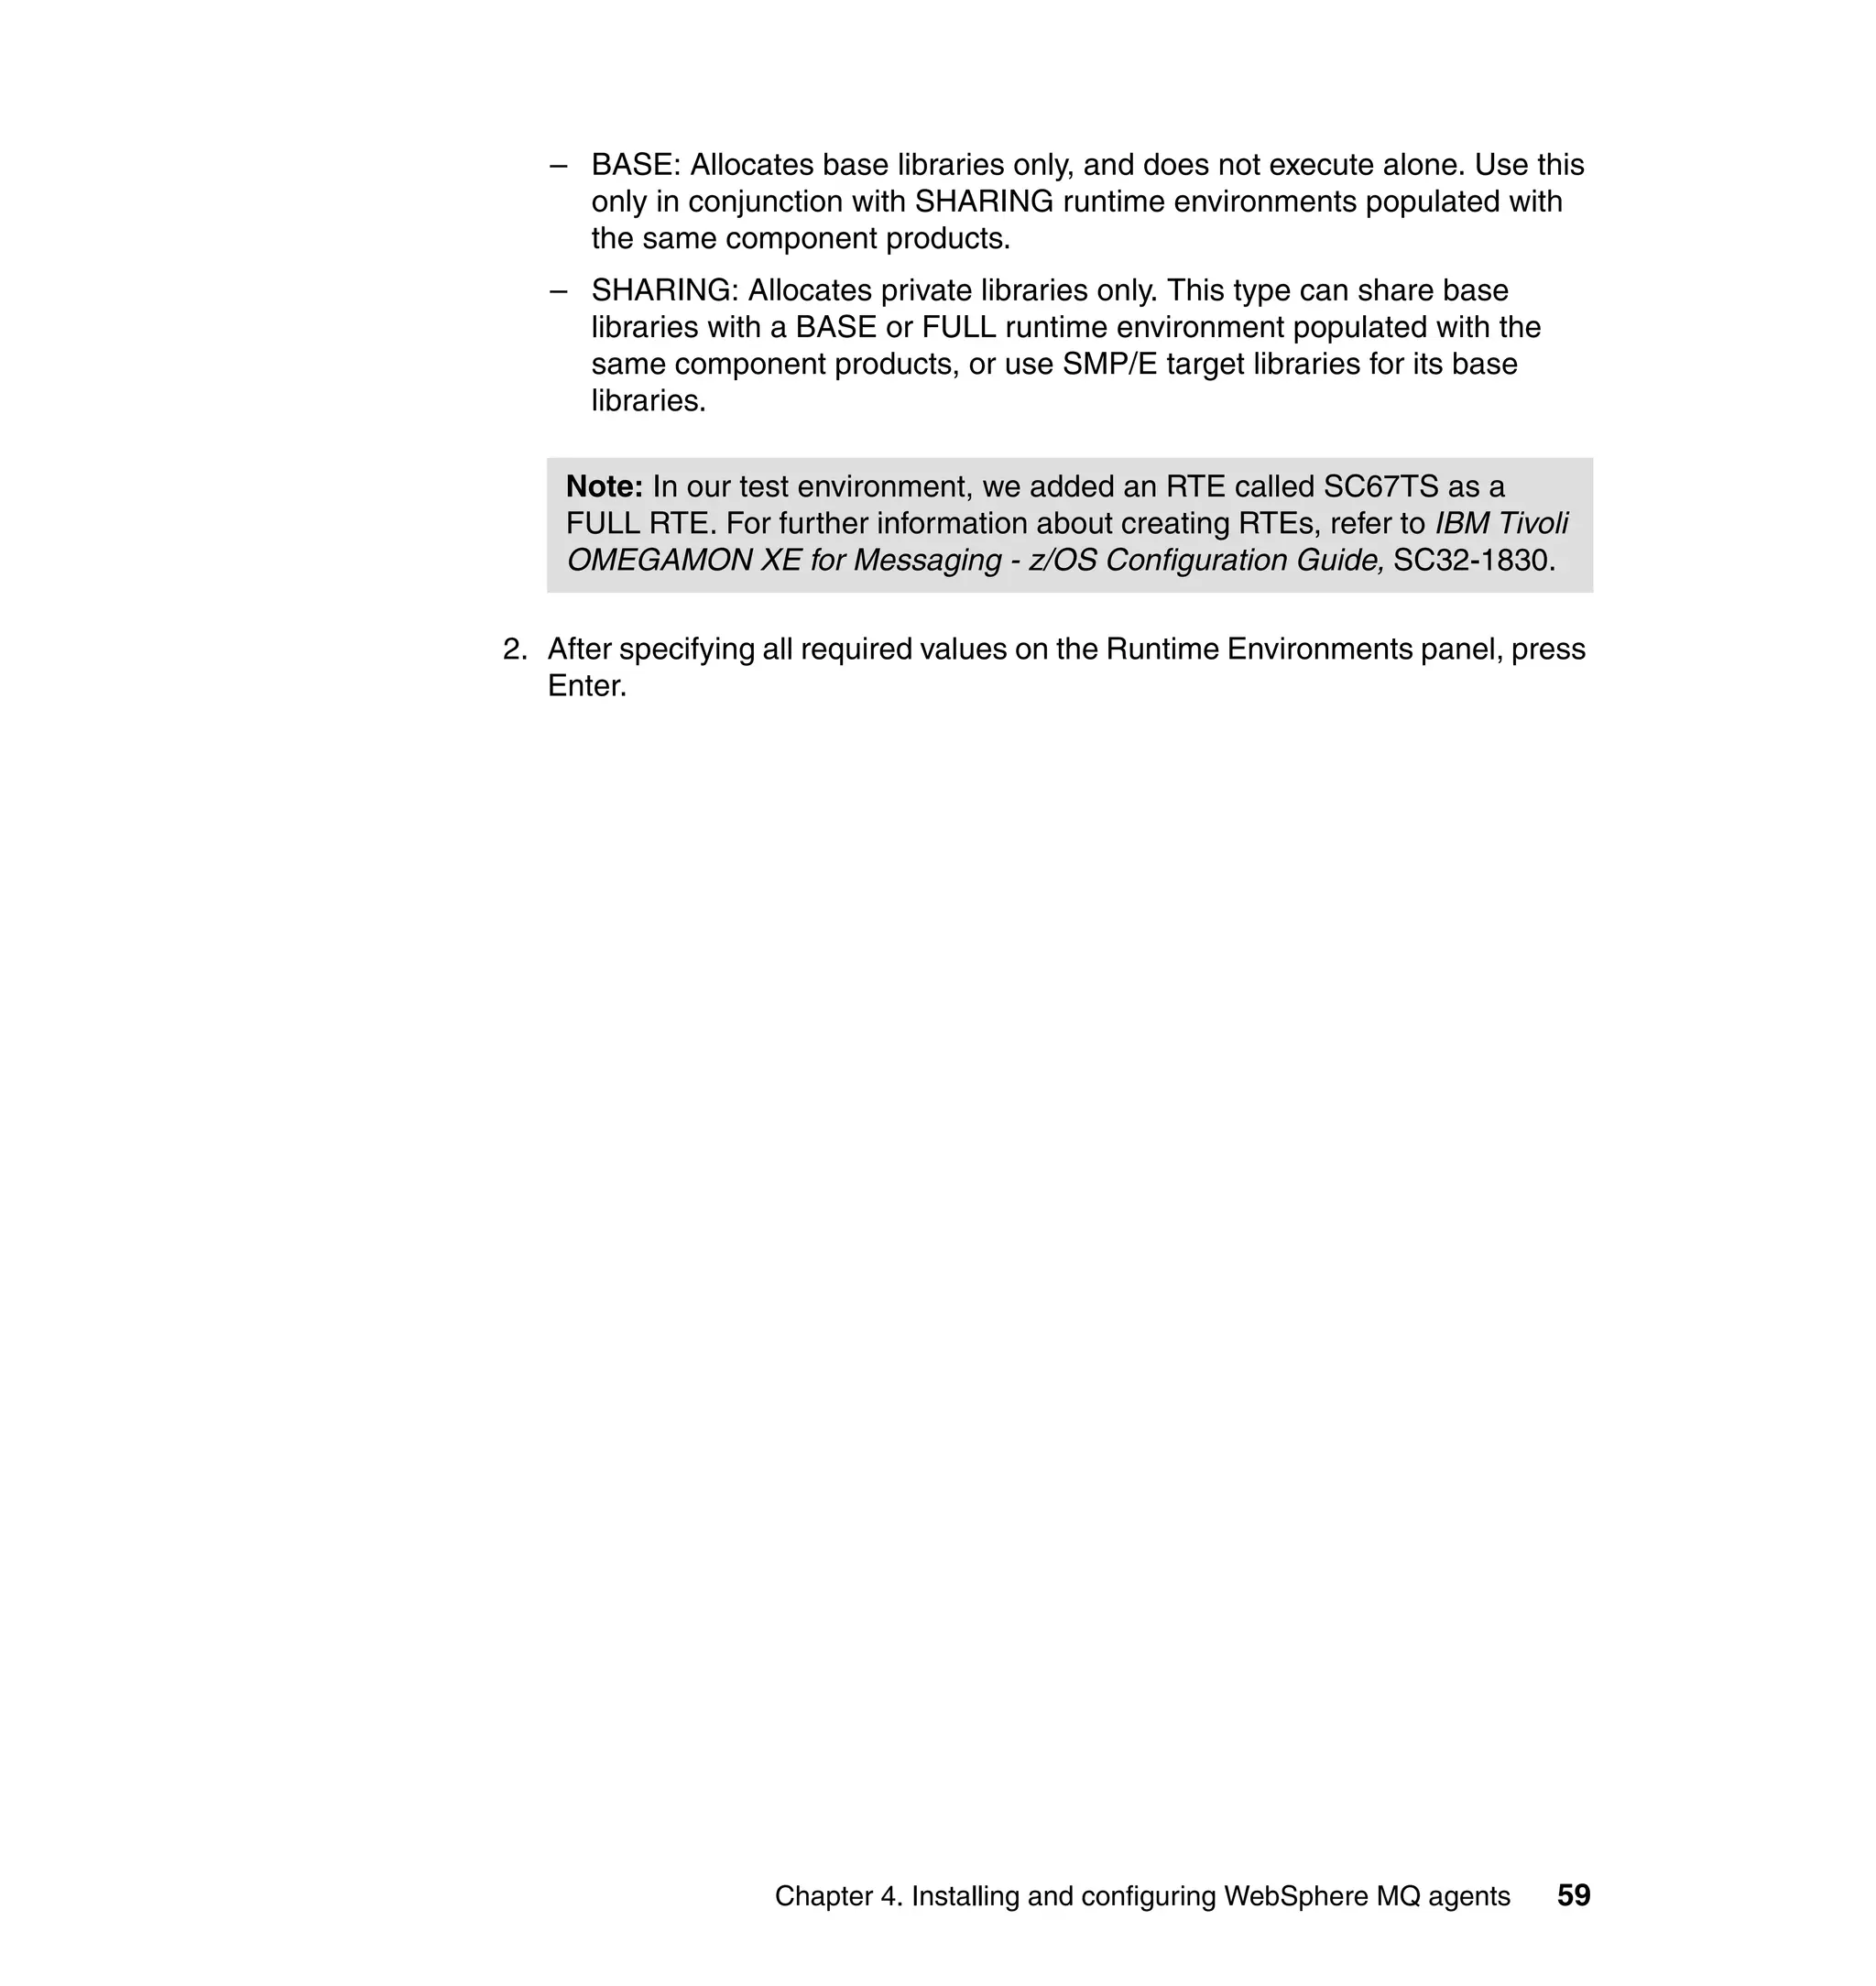
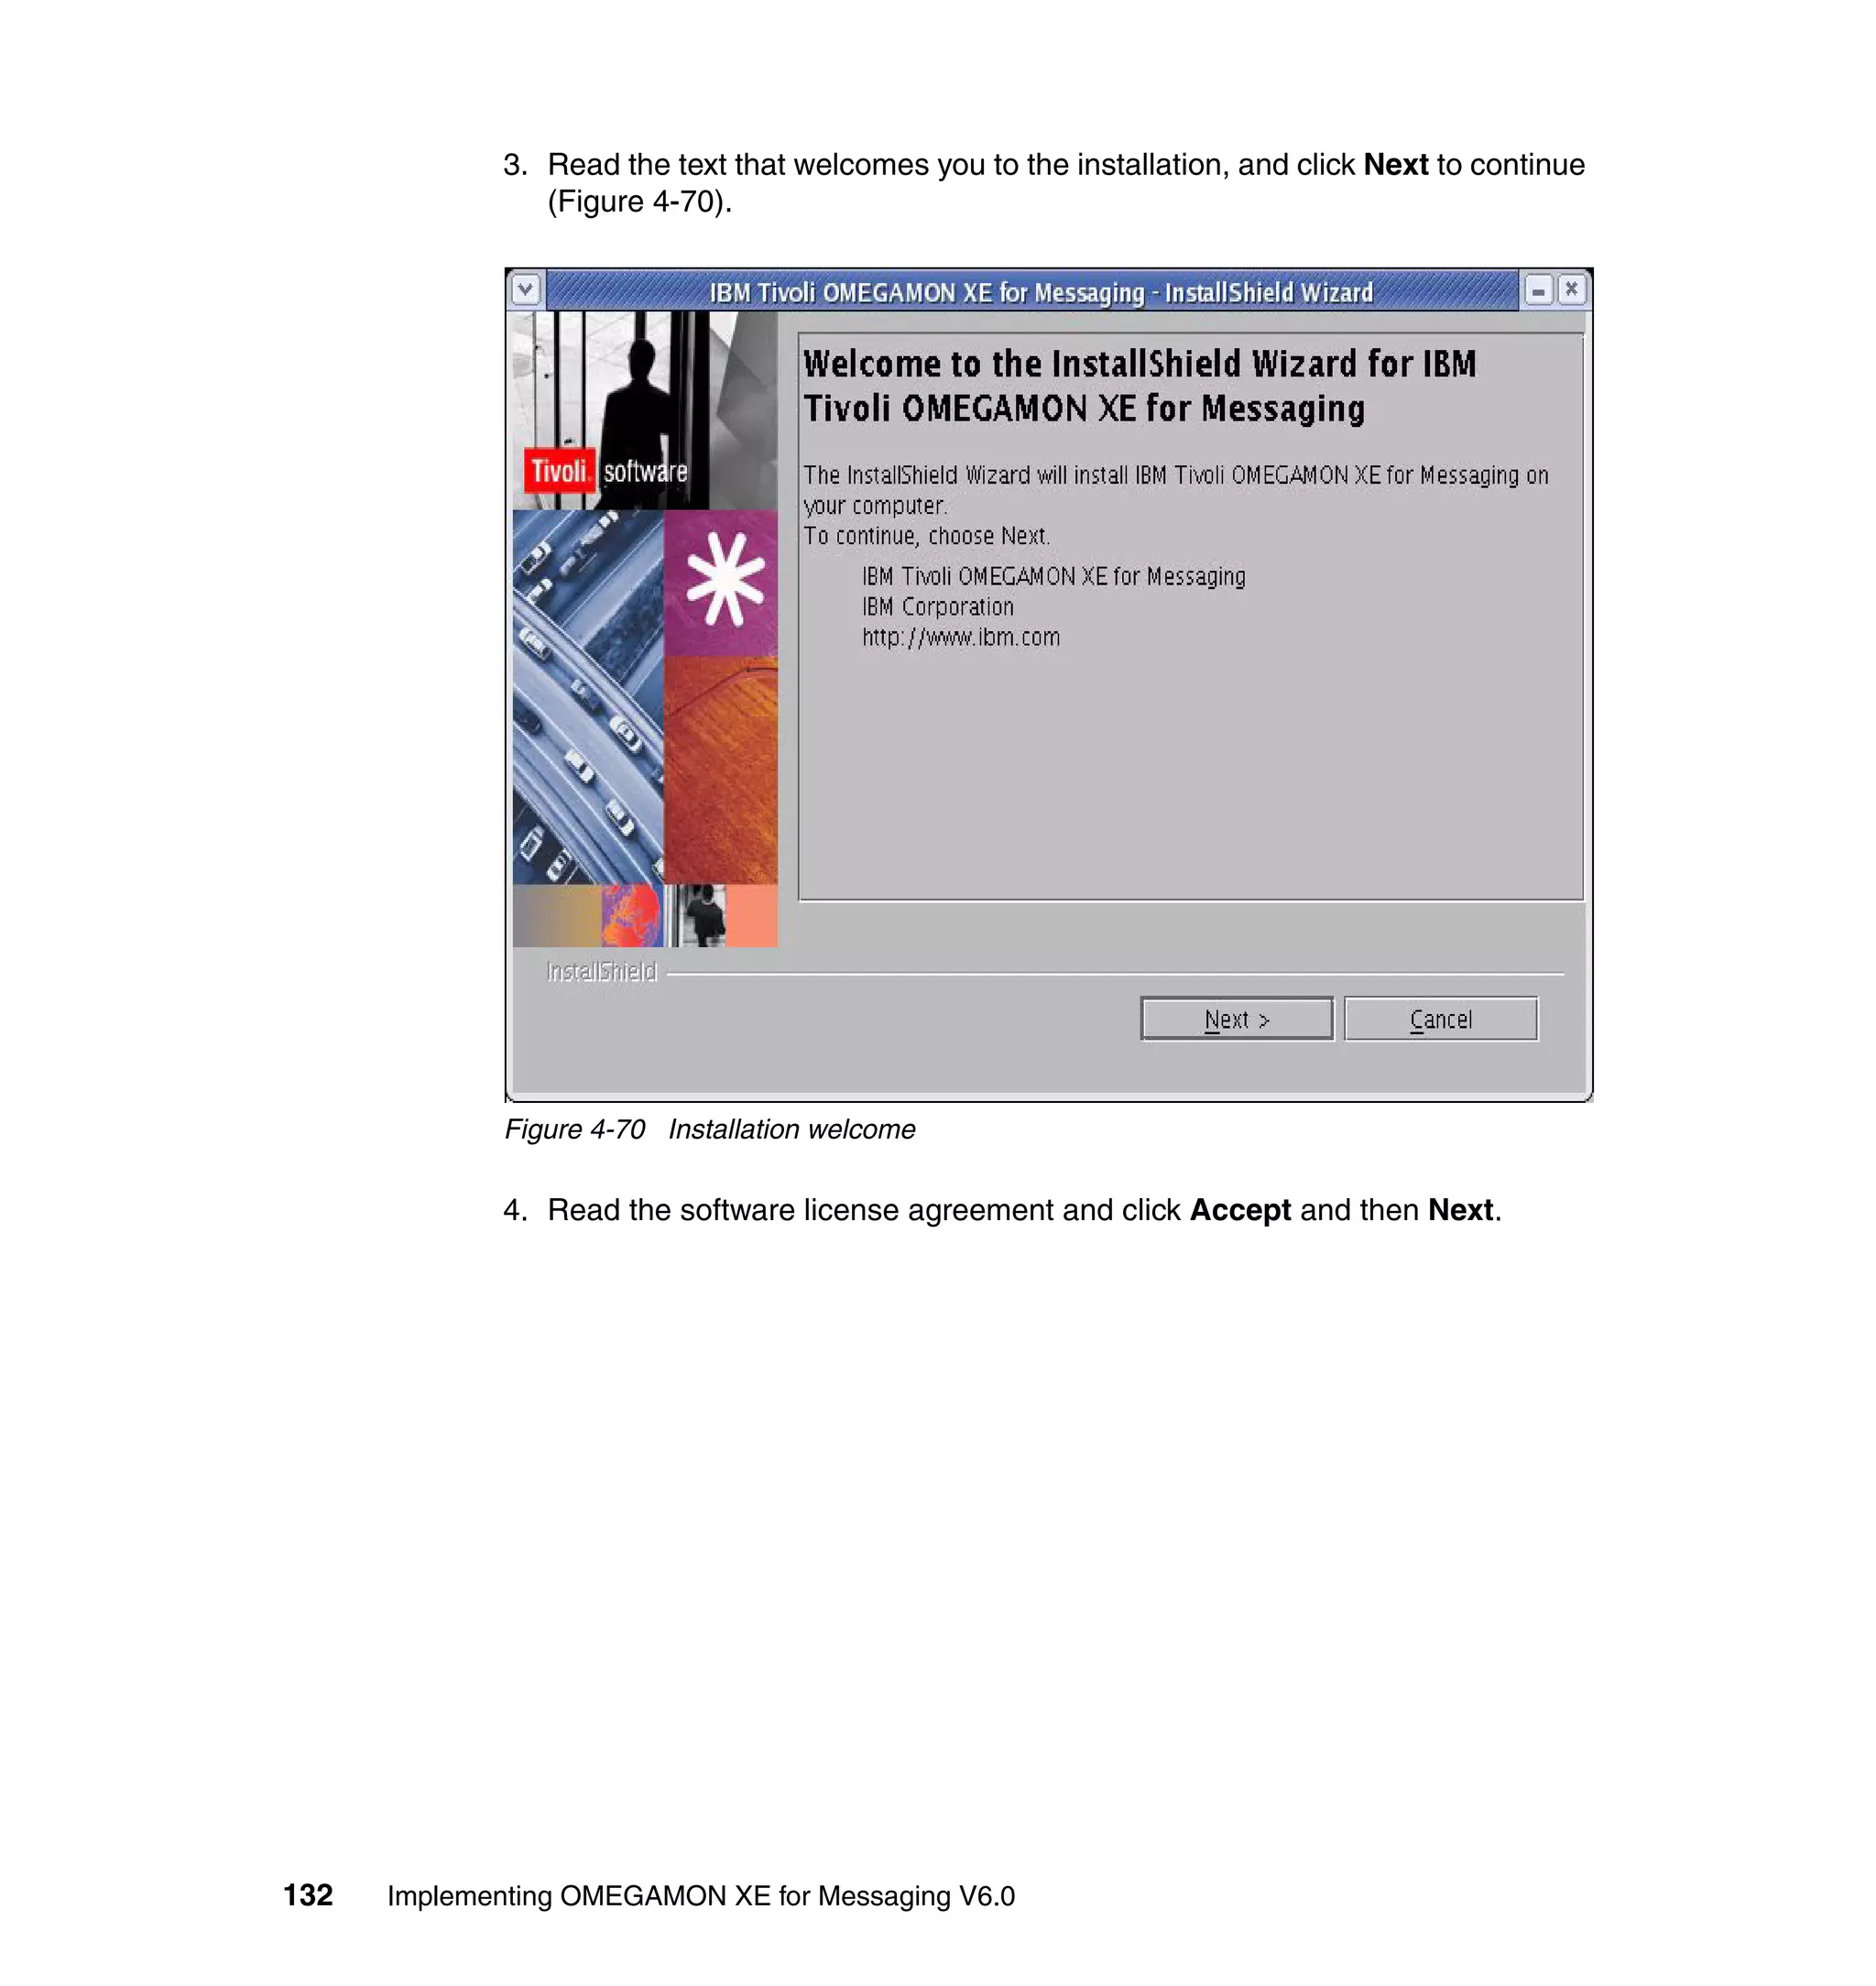
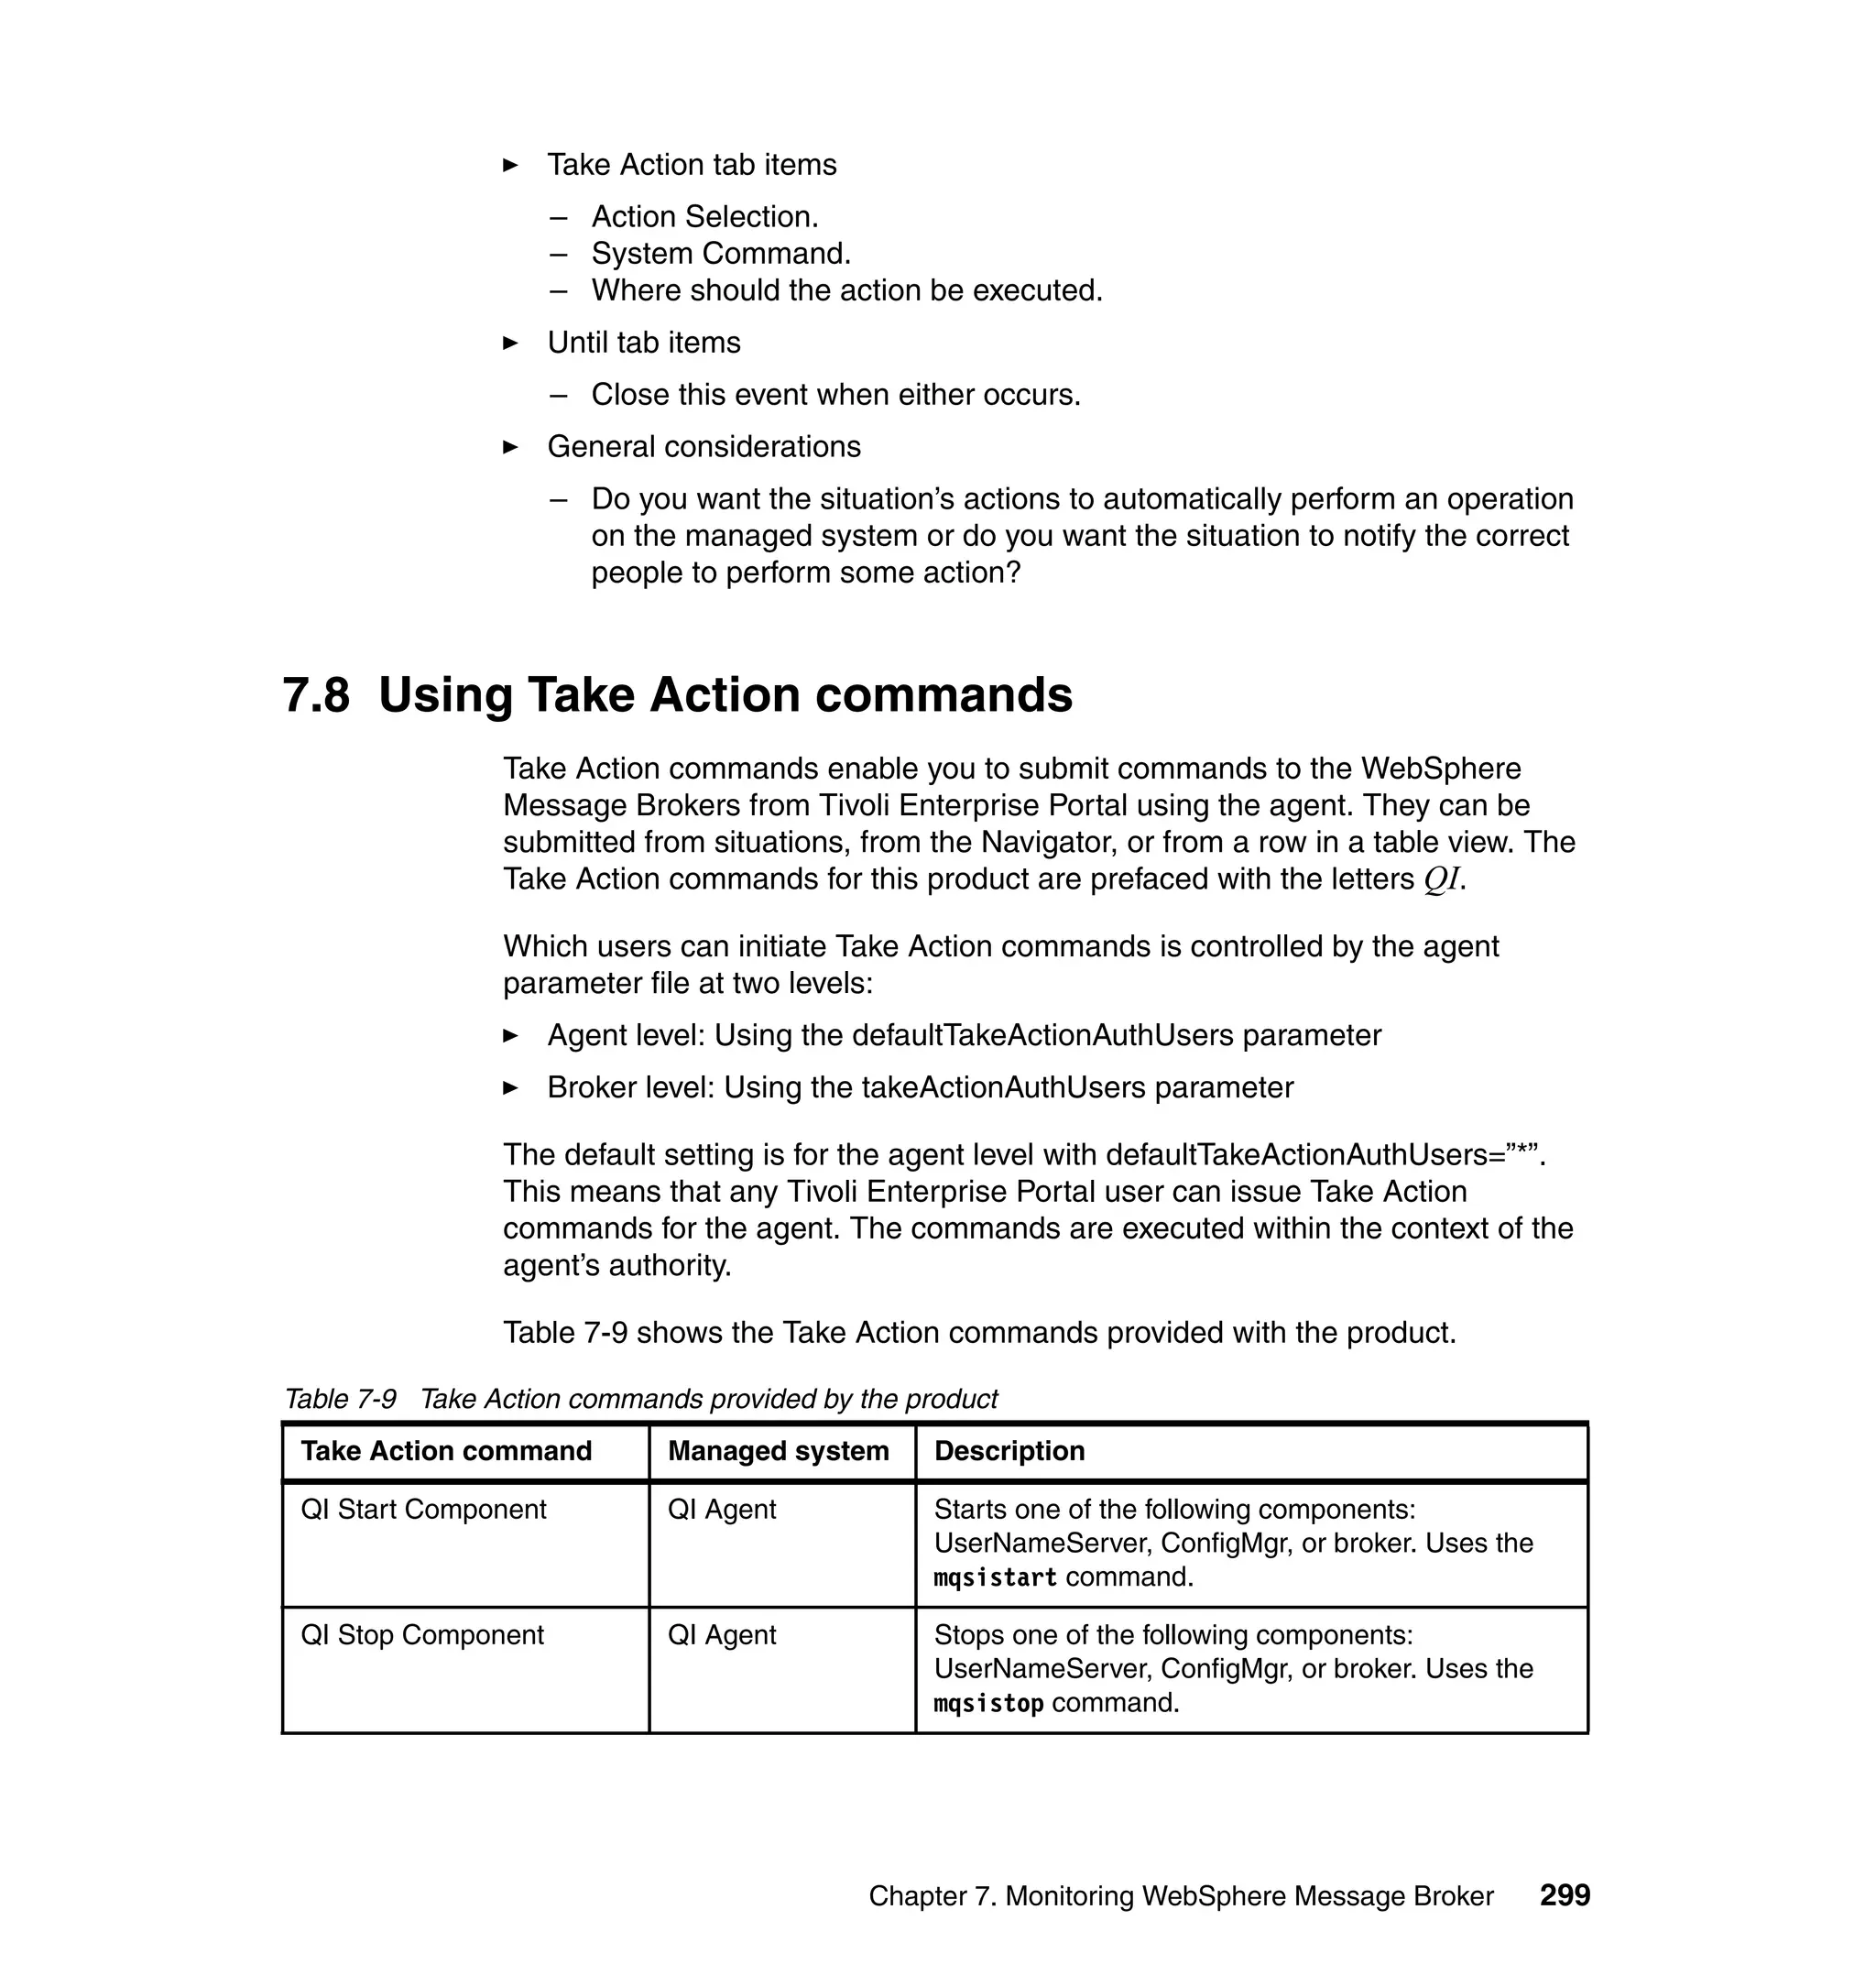
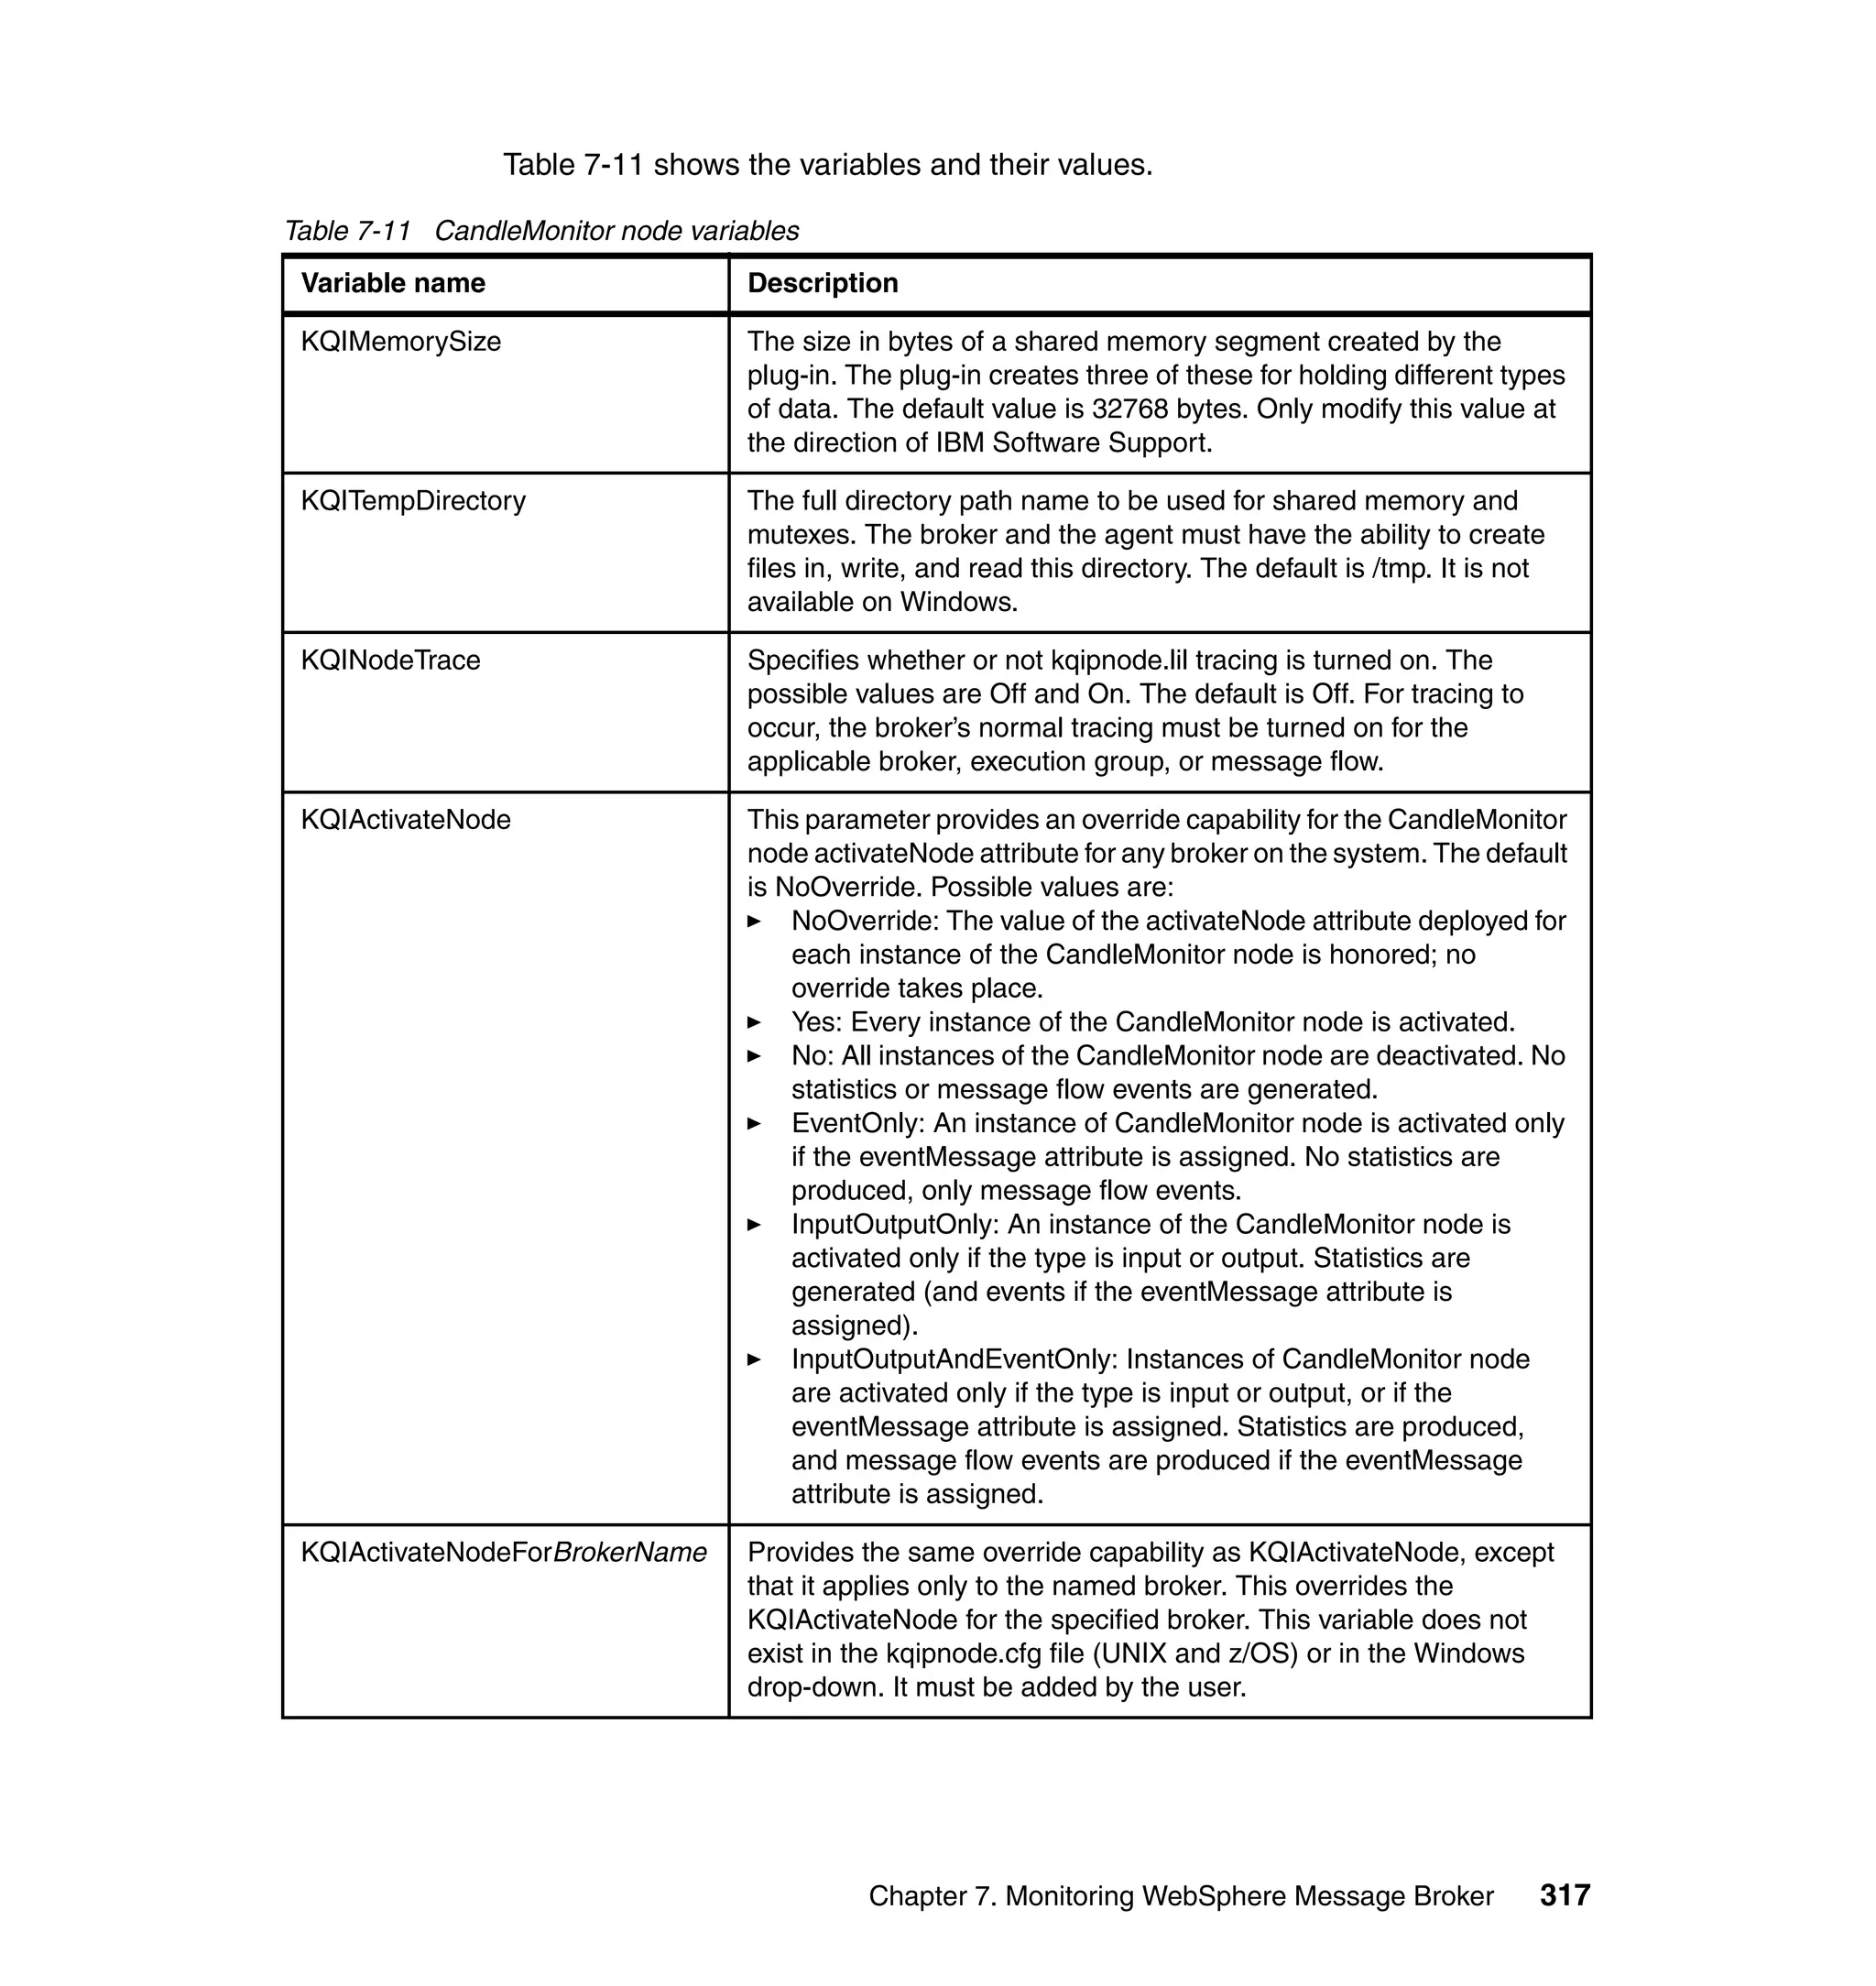
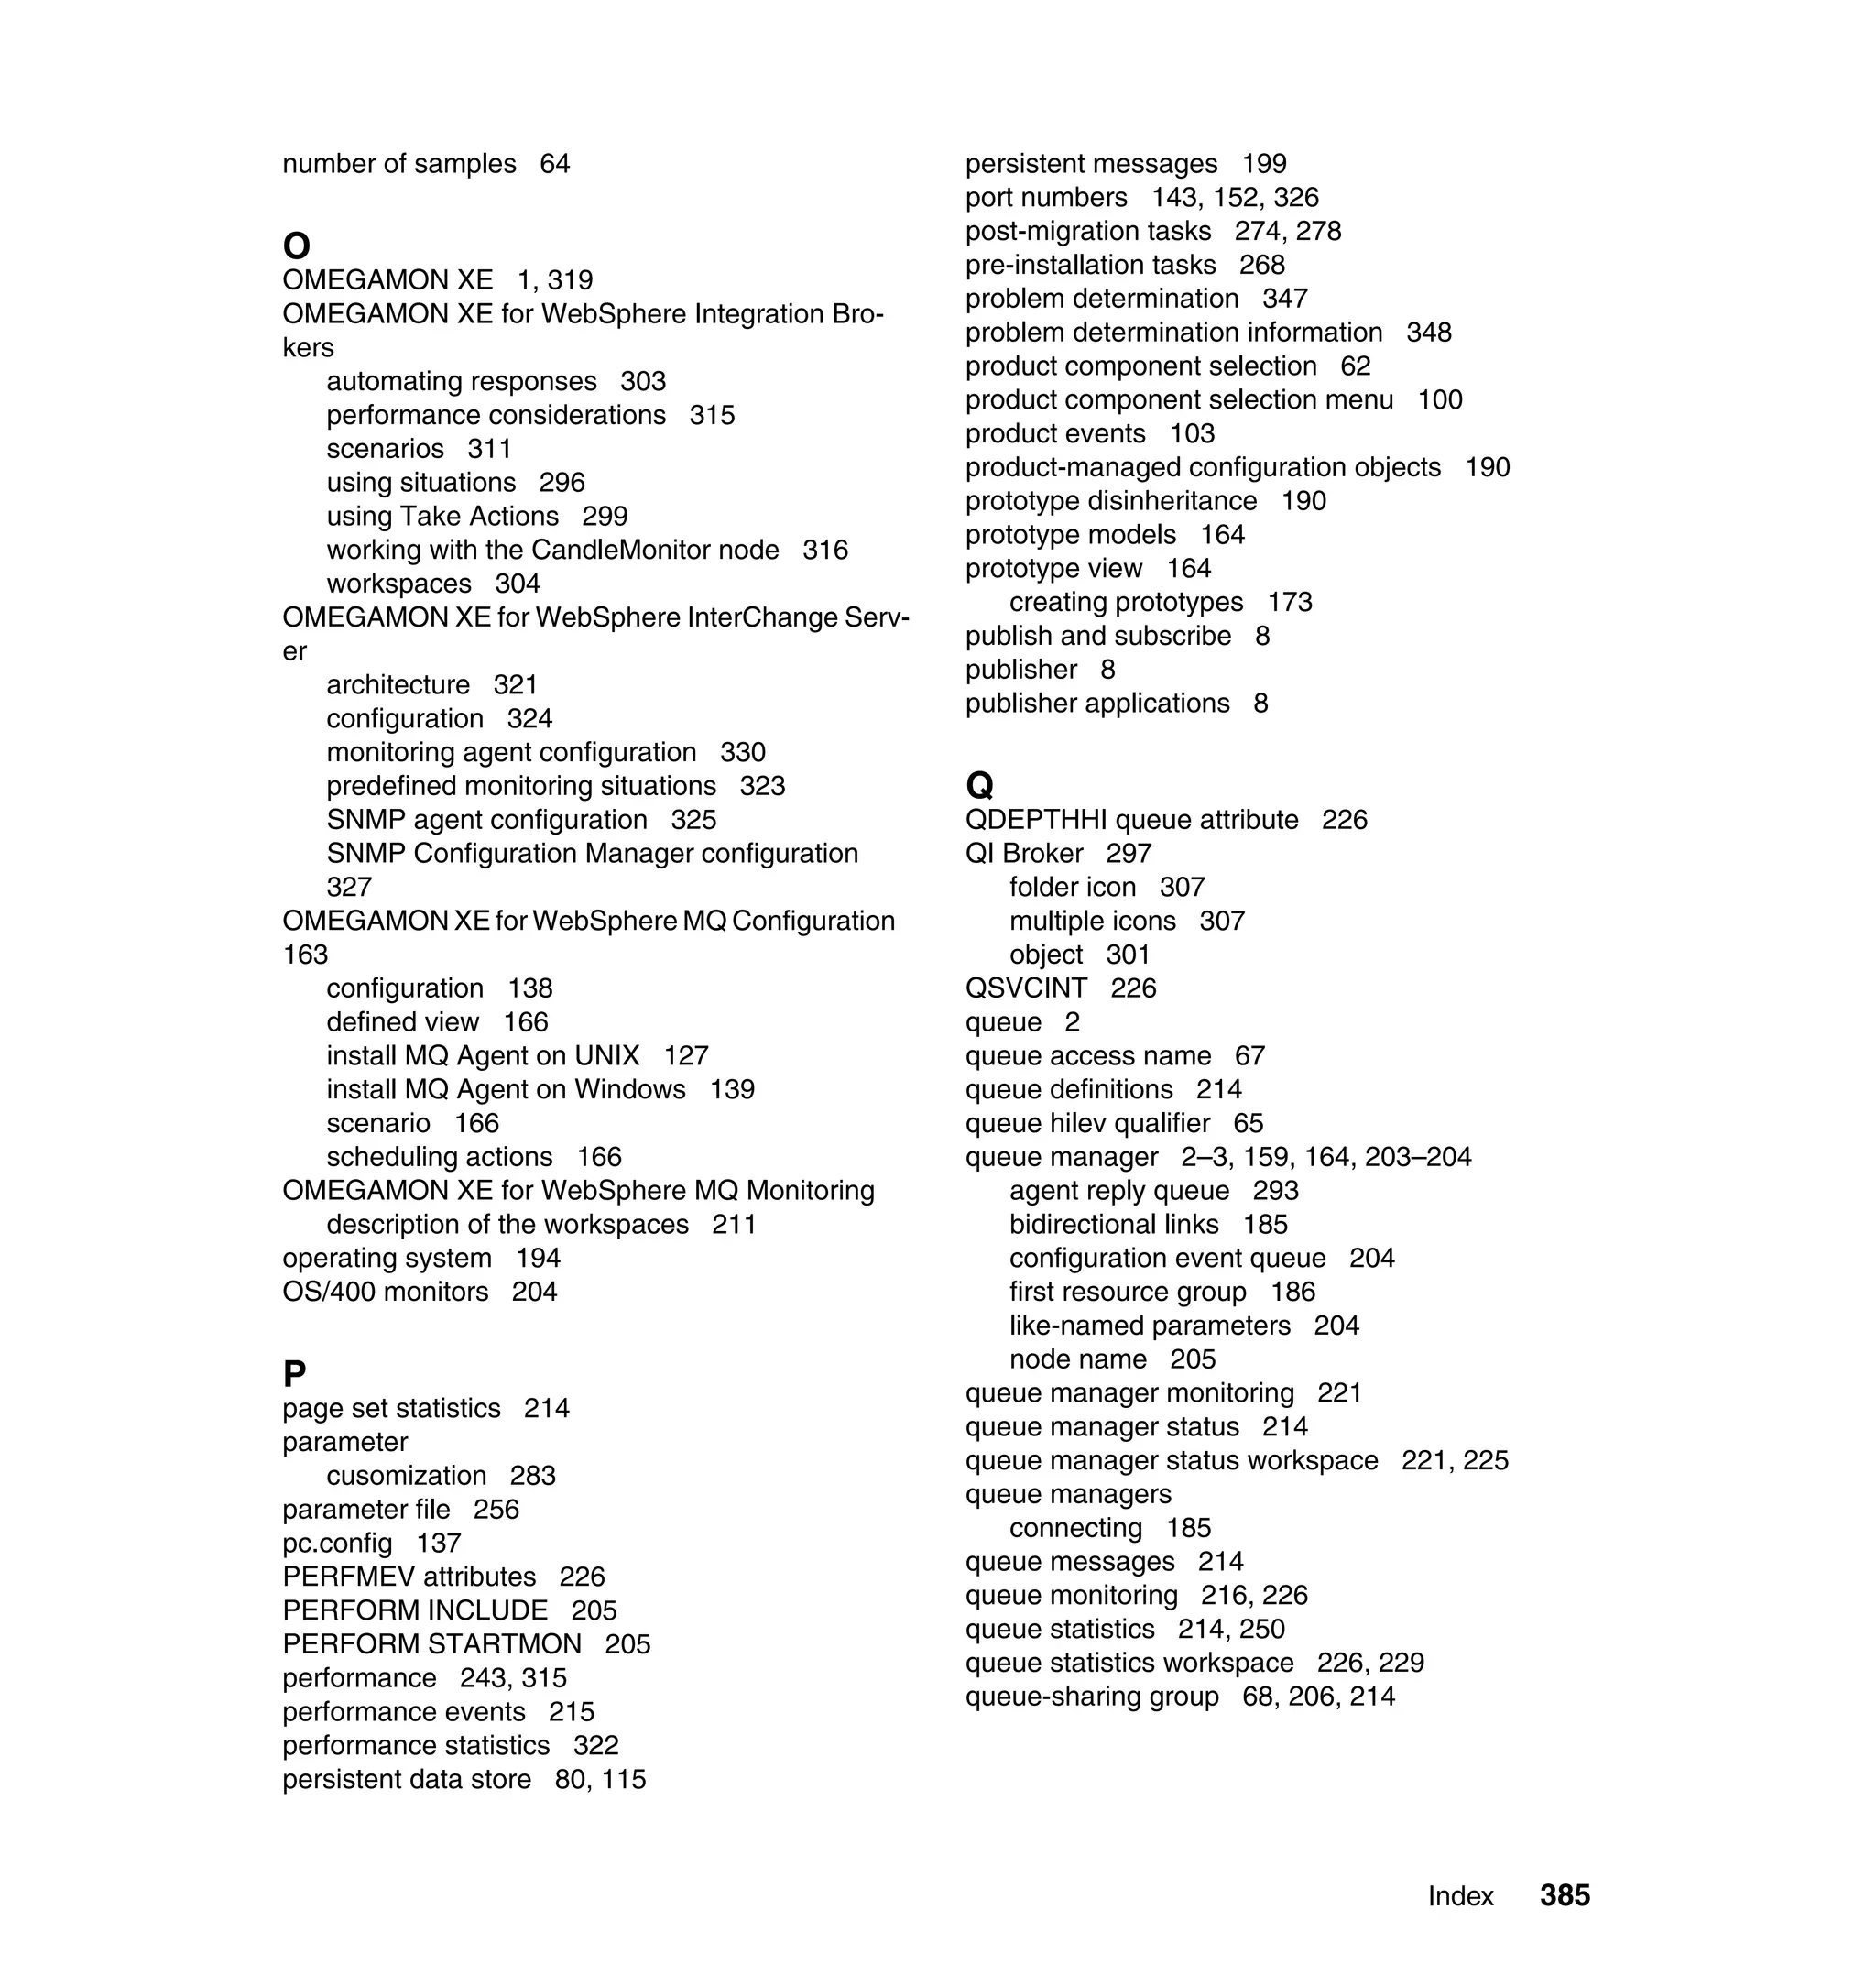
![Table 7-5 SNA communication settings for Tivoli Enterprise Monitoring Servers
Parameter Hub Remote Remote Remote
Monitoring Monitoring Monitoring Monitoring
Server Server 2 Server 3 Server 4
Net Name
LU Name
LOG Mode
2. Create an IBM Tivoli account for installing and maintaining the $install_dir
directory:
a. (GUI installation only) Before starting the GUI installation, set up your
DISPLAY environment variable.
For KSH, use the following command:
export DISPLAY=[Network_Interface_Name]:0.0
Where Network_Interface_Name is the name of the interface card or IP
address.
b. Create an IBM Tivoli account for installing and maintaining the $install_dir
directory. For best performance, follow these guidelines:
• Use any valid name. The name Tivoli is recommended.
• Do not start the installation with the root ID, because it causes
problems with running the product after the installation. However,
certain IBM Tivoli products might require root authority to properly
configure them. In those cases, the installation or configuration
command might prompt for a root user ID and password.
• If you are using NFS or a local file system, establish your $install_dir
directory according to the guidelines used in your environment.
• The Korn shell is recommended; however, use any shell that is shipped
with the UNIX operating system. IBM Tivoli products do not support
third-party vendor shells such as Bash and tcsh.
3. If you are planning to install the product on an AIX 5L machine, you need to
issue the following command to check if the default language setting of the
system is English:
locale
If LANG is not set to C, issue the following command:
export LANG=C
Chapter 7. Monitoring WebSphere Message Broker 269](https://image.slidesharecdn.com/implementingomegamonxeformessagingv6-0sg247357-120524195829-phpapp02/75/Implementing-omegamon-xe-for-messaging-v6-0-sg247357-291-2048.jpg)
![4. (If necessary) Use FTP to transfer files to your UNIX system.
If your UNIX system does not have a CD-ROM drive from which it can directly
access the files from the installation CD, or if your UNIX system cannot
access the NFS to which the installation CD's contents were copied, you must
transfer files from a machine with a CD-ROM drive to your UNIX system.
a. Log on to the machine on which you have loaded the IBM Tivoli
OMEGAMON XE for Messaging installation CD.
b. Go to the root directory of the CD-ROM drive:
E:
cd
Or:
mount device mount_point
cd mount_point
Where device is the device driver for the CD-ROM and mount_point is the
directory where the device will be mounted.
The installation CD conforms to ISO 9660 standards. The mount
command might require additional options based on the operating system
you are running. IBM Tivoli does not document basic operating systems
commands that are the responsibility of your system administrator to
oversee. Consult the man pages or your operating system documentation
if necessary.
c. FTP from that window to your UNIX machine:
ftp [unix_machine_name]
d. Enter your user ID and password. FTP places you in your home directory
on the receiving machine.
e. Create a receiving directory in your home directory:
mkdir itmimage
f. Change to the receiving directory:
cd itmimage
g. Print the full path name of the current directory:
pwd
h. Note the location displayed; you need this information when logging onto
the UNIX machine.
i. Make a unix directory under the current directory:
mkdir unix
270 Implementing OMEGAMON XE for Messaging V6.0](https://image.slidesharecdn.com/implementingomegamonxeformessagingv6-0sg247357-120524195829-phpapp02/75/Implementing-omegamon-xe-for-messaging-v6-0-sg247357-292-2048.jpg)

![brokername is the name of the broker entry you want to remove.
agentID is the entry you want to remove.
7.5.9 Configuring the agent from the command line
To configure the agent from a command line, use the itmcmd config script. The
itmcmd config script is in $install_dir/bin. Execute itmcmd config as follows:
cd /$install_dir/bin
./itmcmd config -A [-h $install_dir] [-a $arch] qi
Where arch is the IBM Tivoli architecture code for the operating system on which
you installed the agent.
For more information about the itmcmd config script, see the IBM Tivoli
Monitoring Installing and Setup Guide.
7.5.10 Starting or stopping multiple agents using itmcmd agent
When using the itmcmd agent command from the command line, optionally
specify the broker name. Use the -o option to give a broker name and the -p
option to specify an agent ID (four or fewer characters) so that you can use
multiple WebSphere Message Broker Monitoring Agents on the same system to
monitor different brokers.
For example:
./itmcmd agent -o brokername -p agentID start | stop qi
The [Hostname]_qi_[brokername]_##_[agentID].xml file is created automatically
when using this option.
To run a single monitoring agent on the system, using the default monitoring
parameters in kqi.xml, run itmcmd agent as follows:
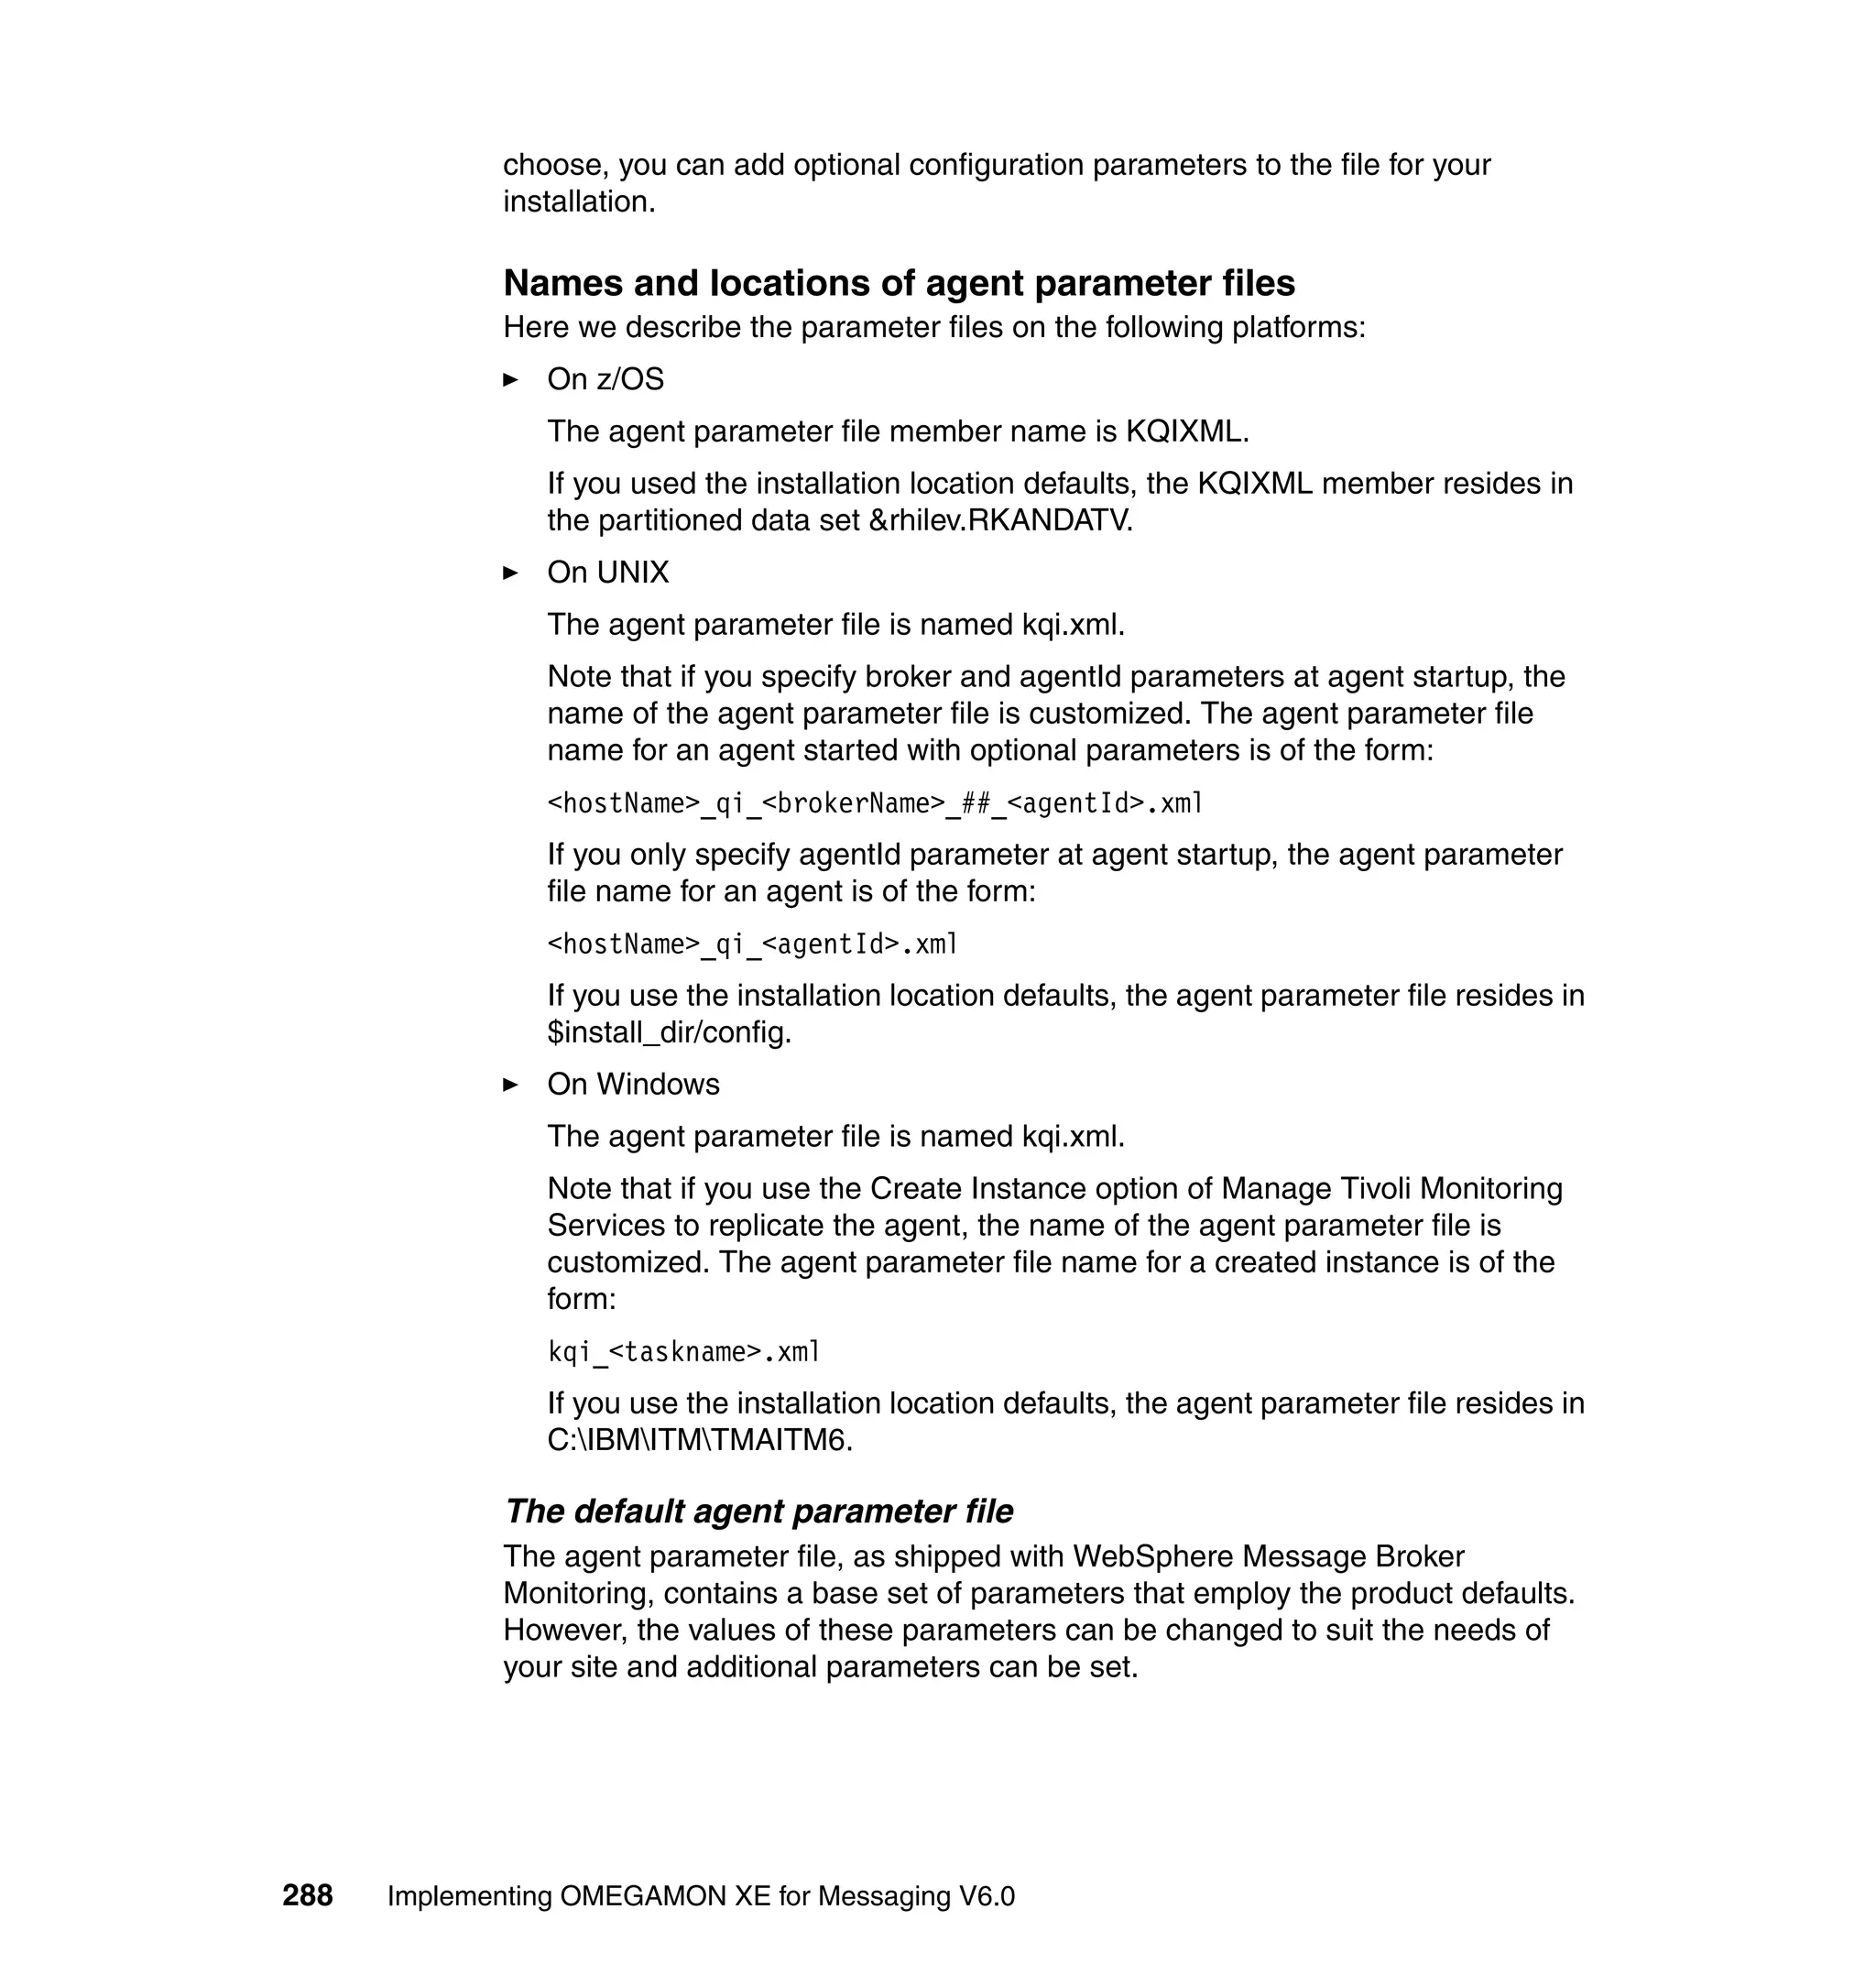
./itmcmd agent start | stop qi
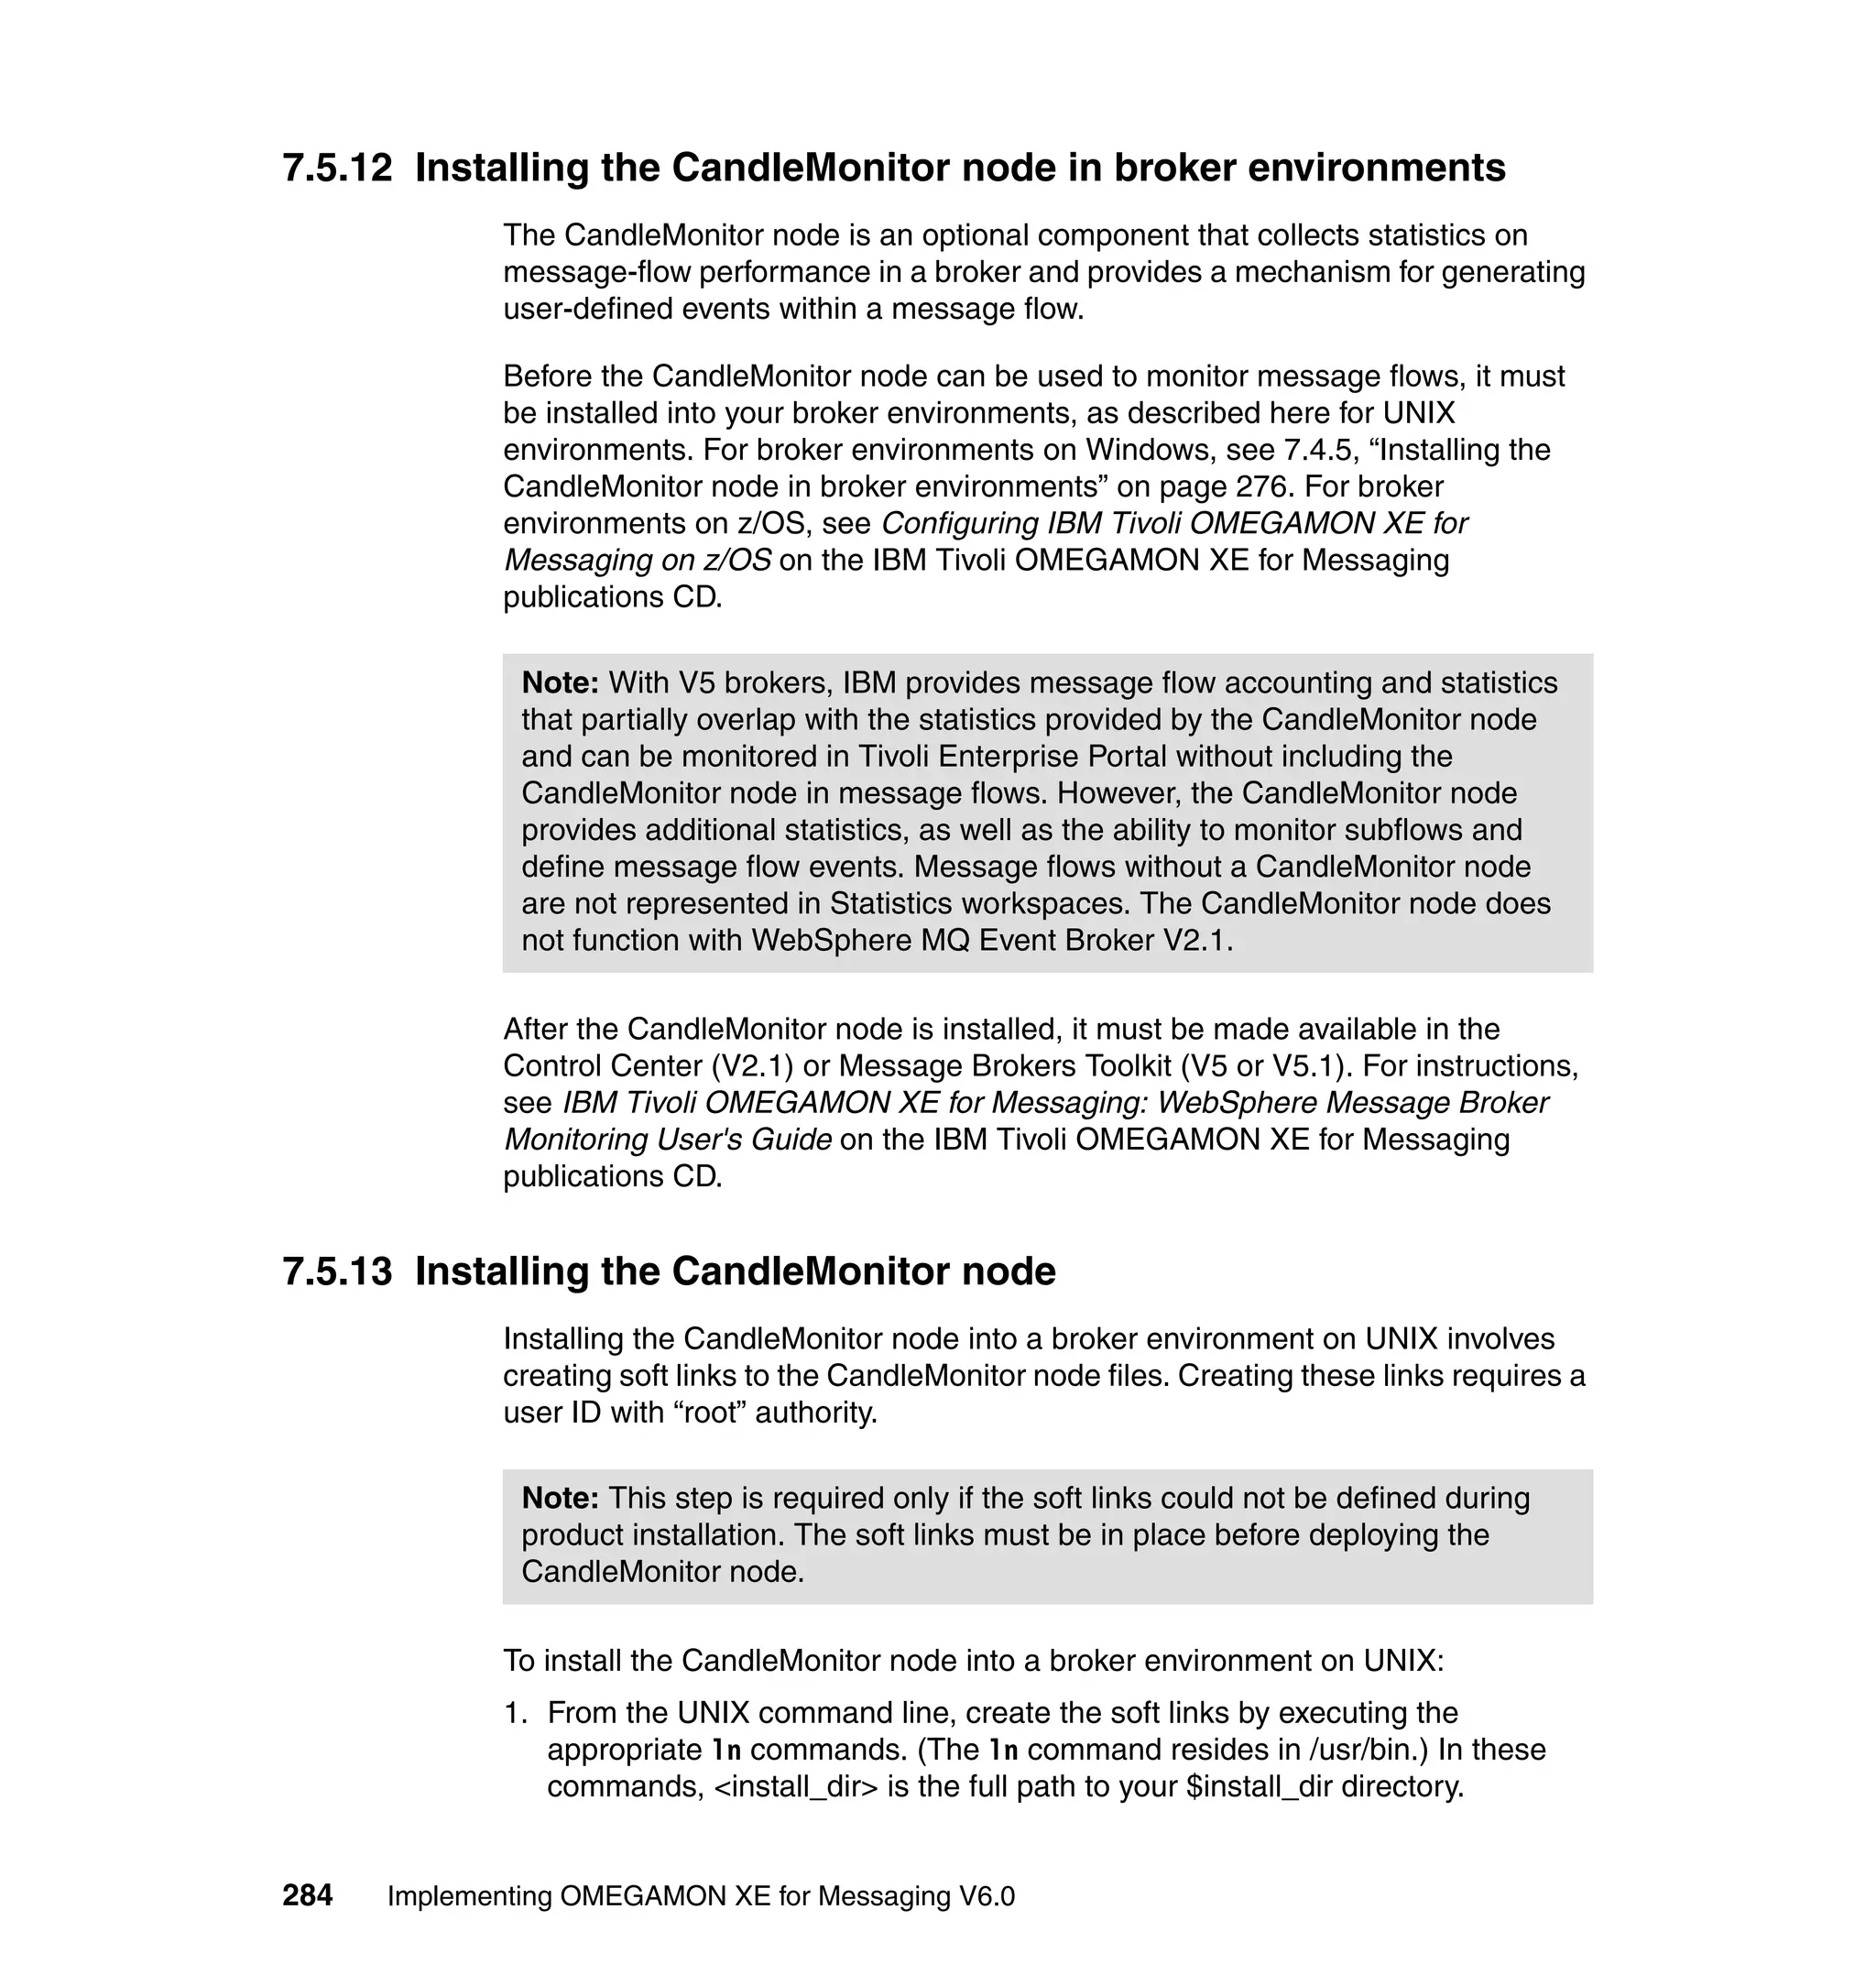
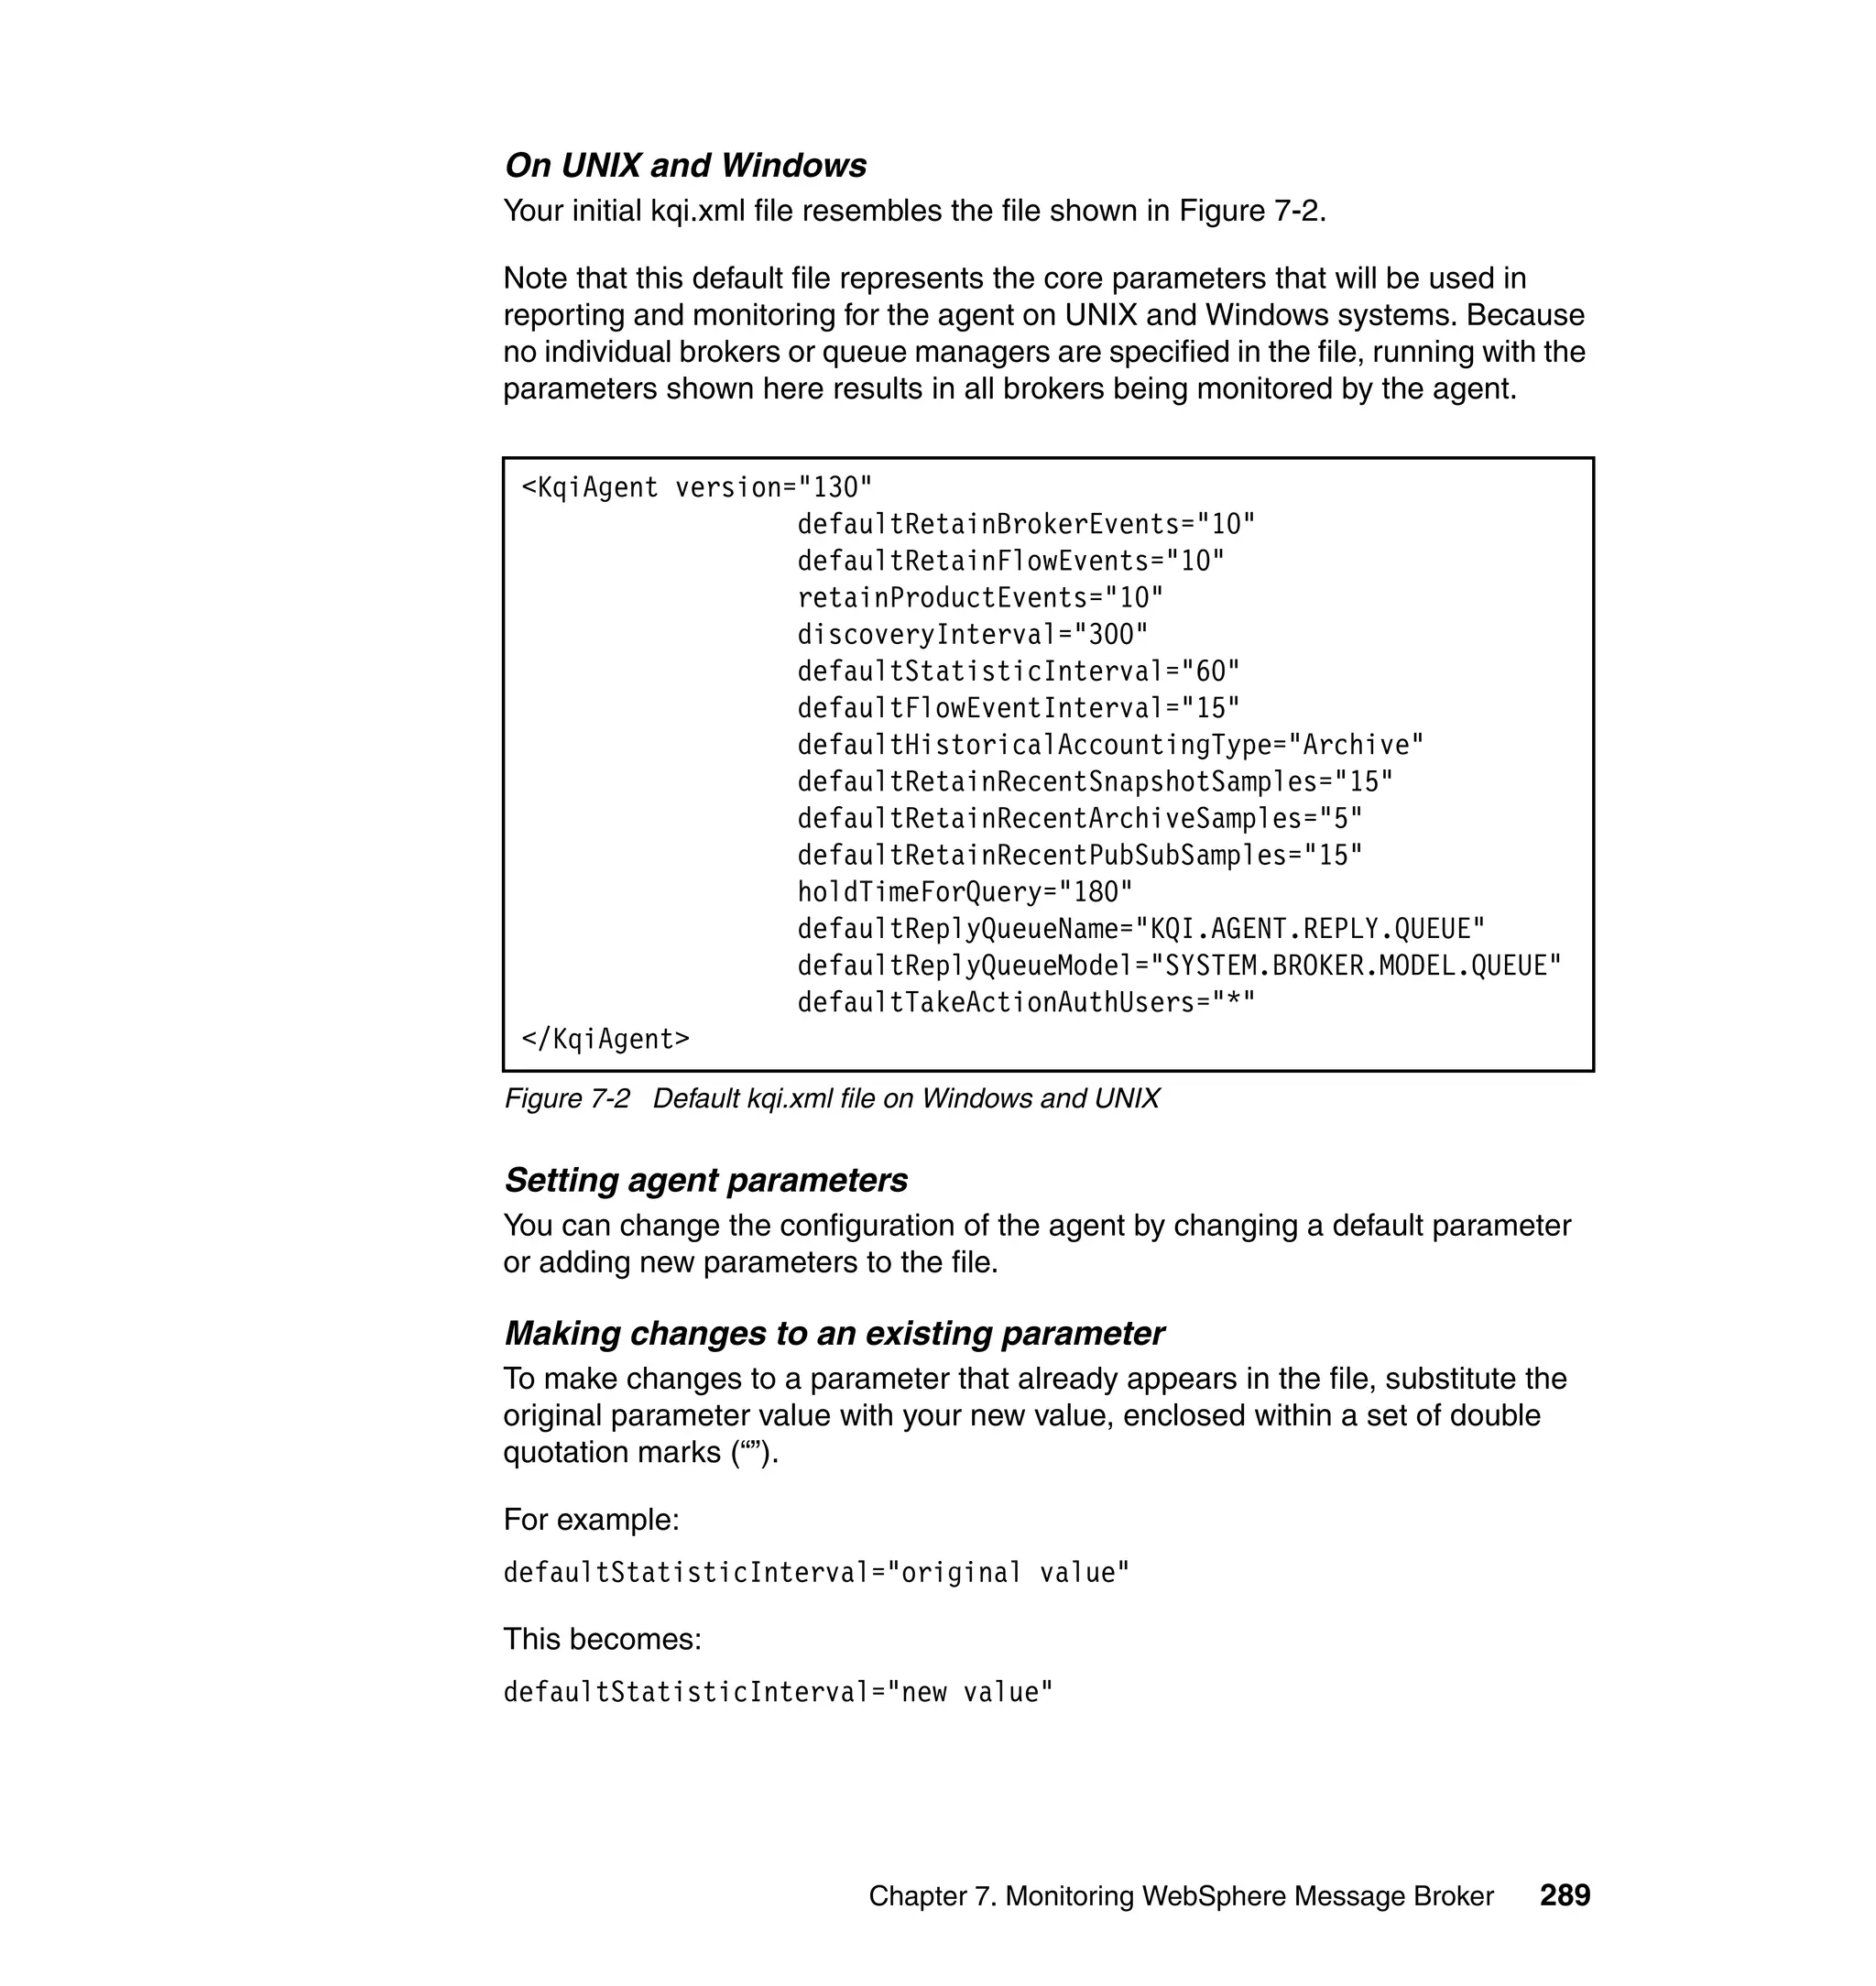
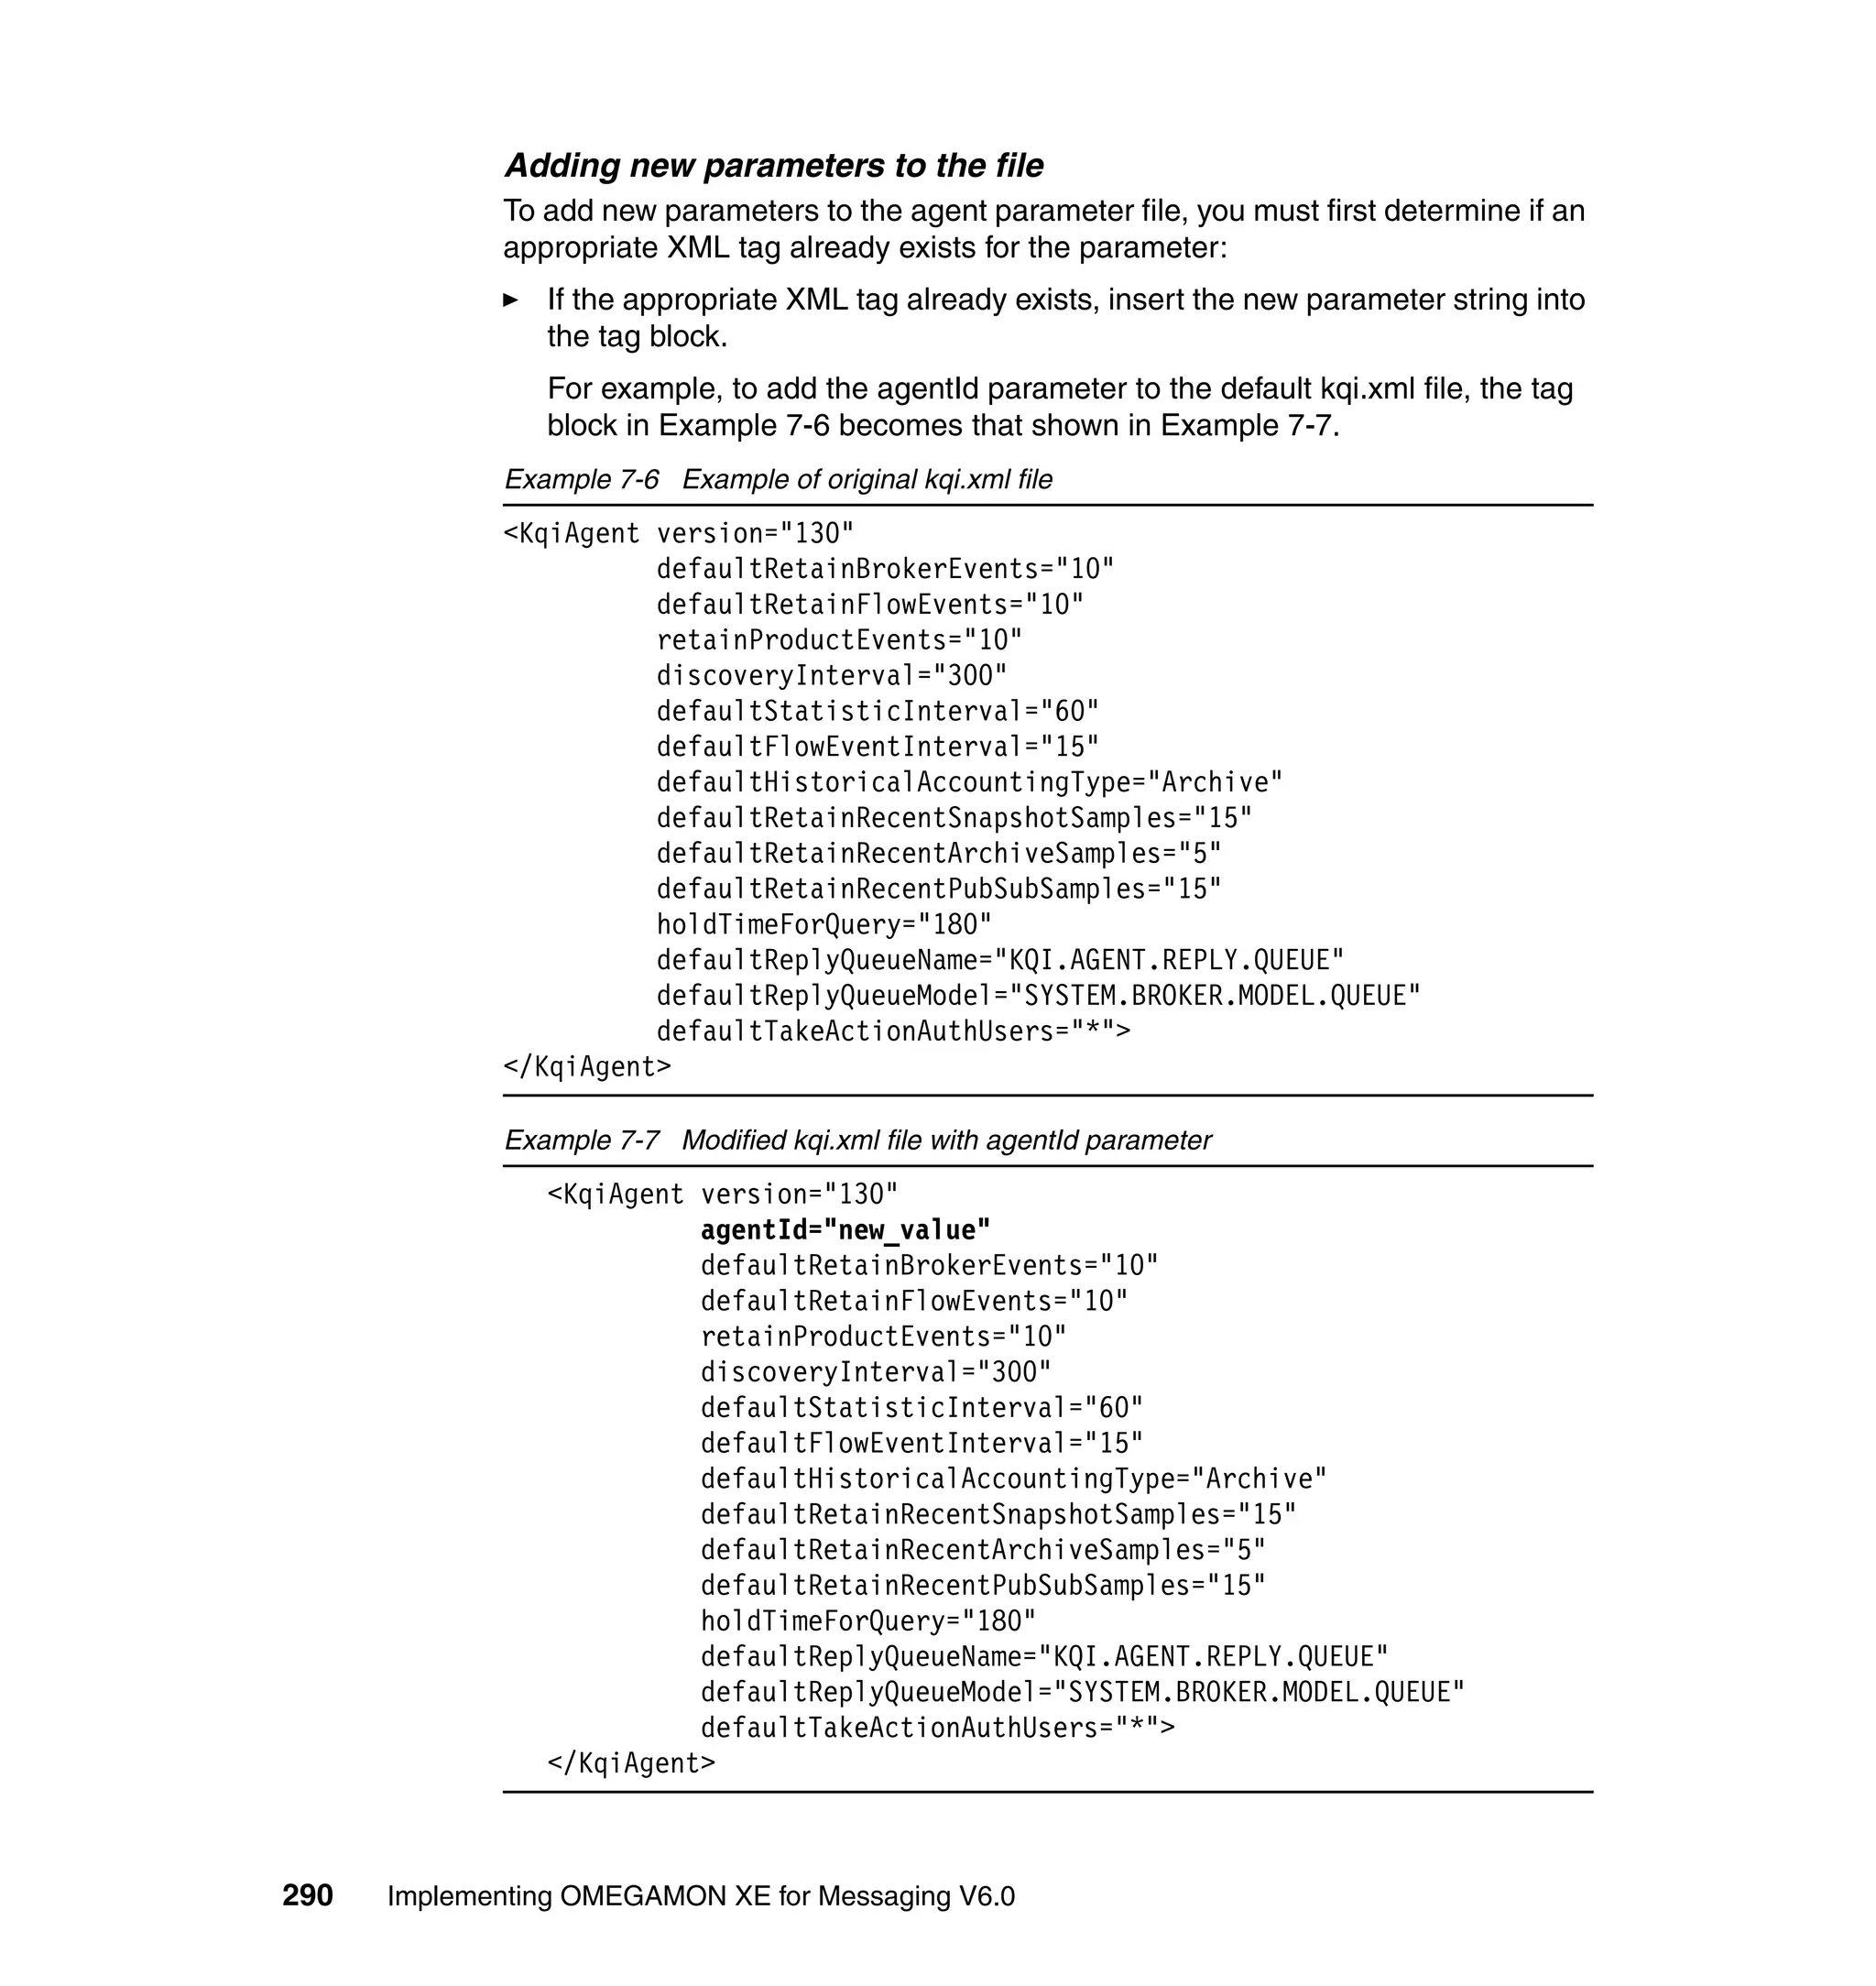
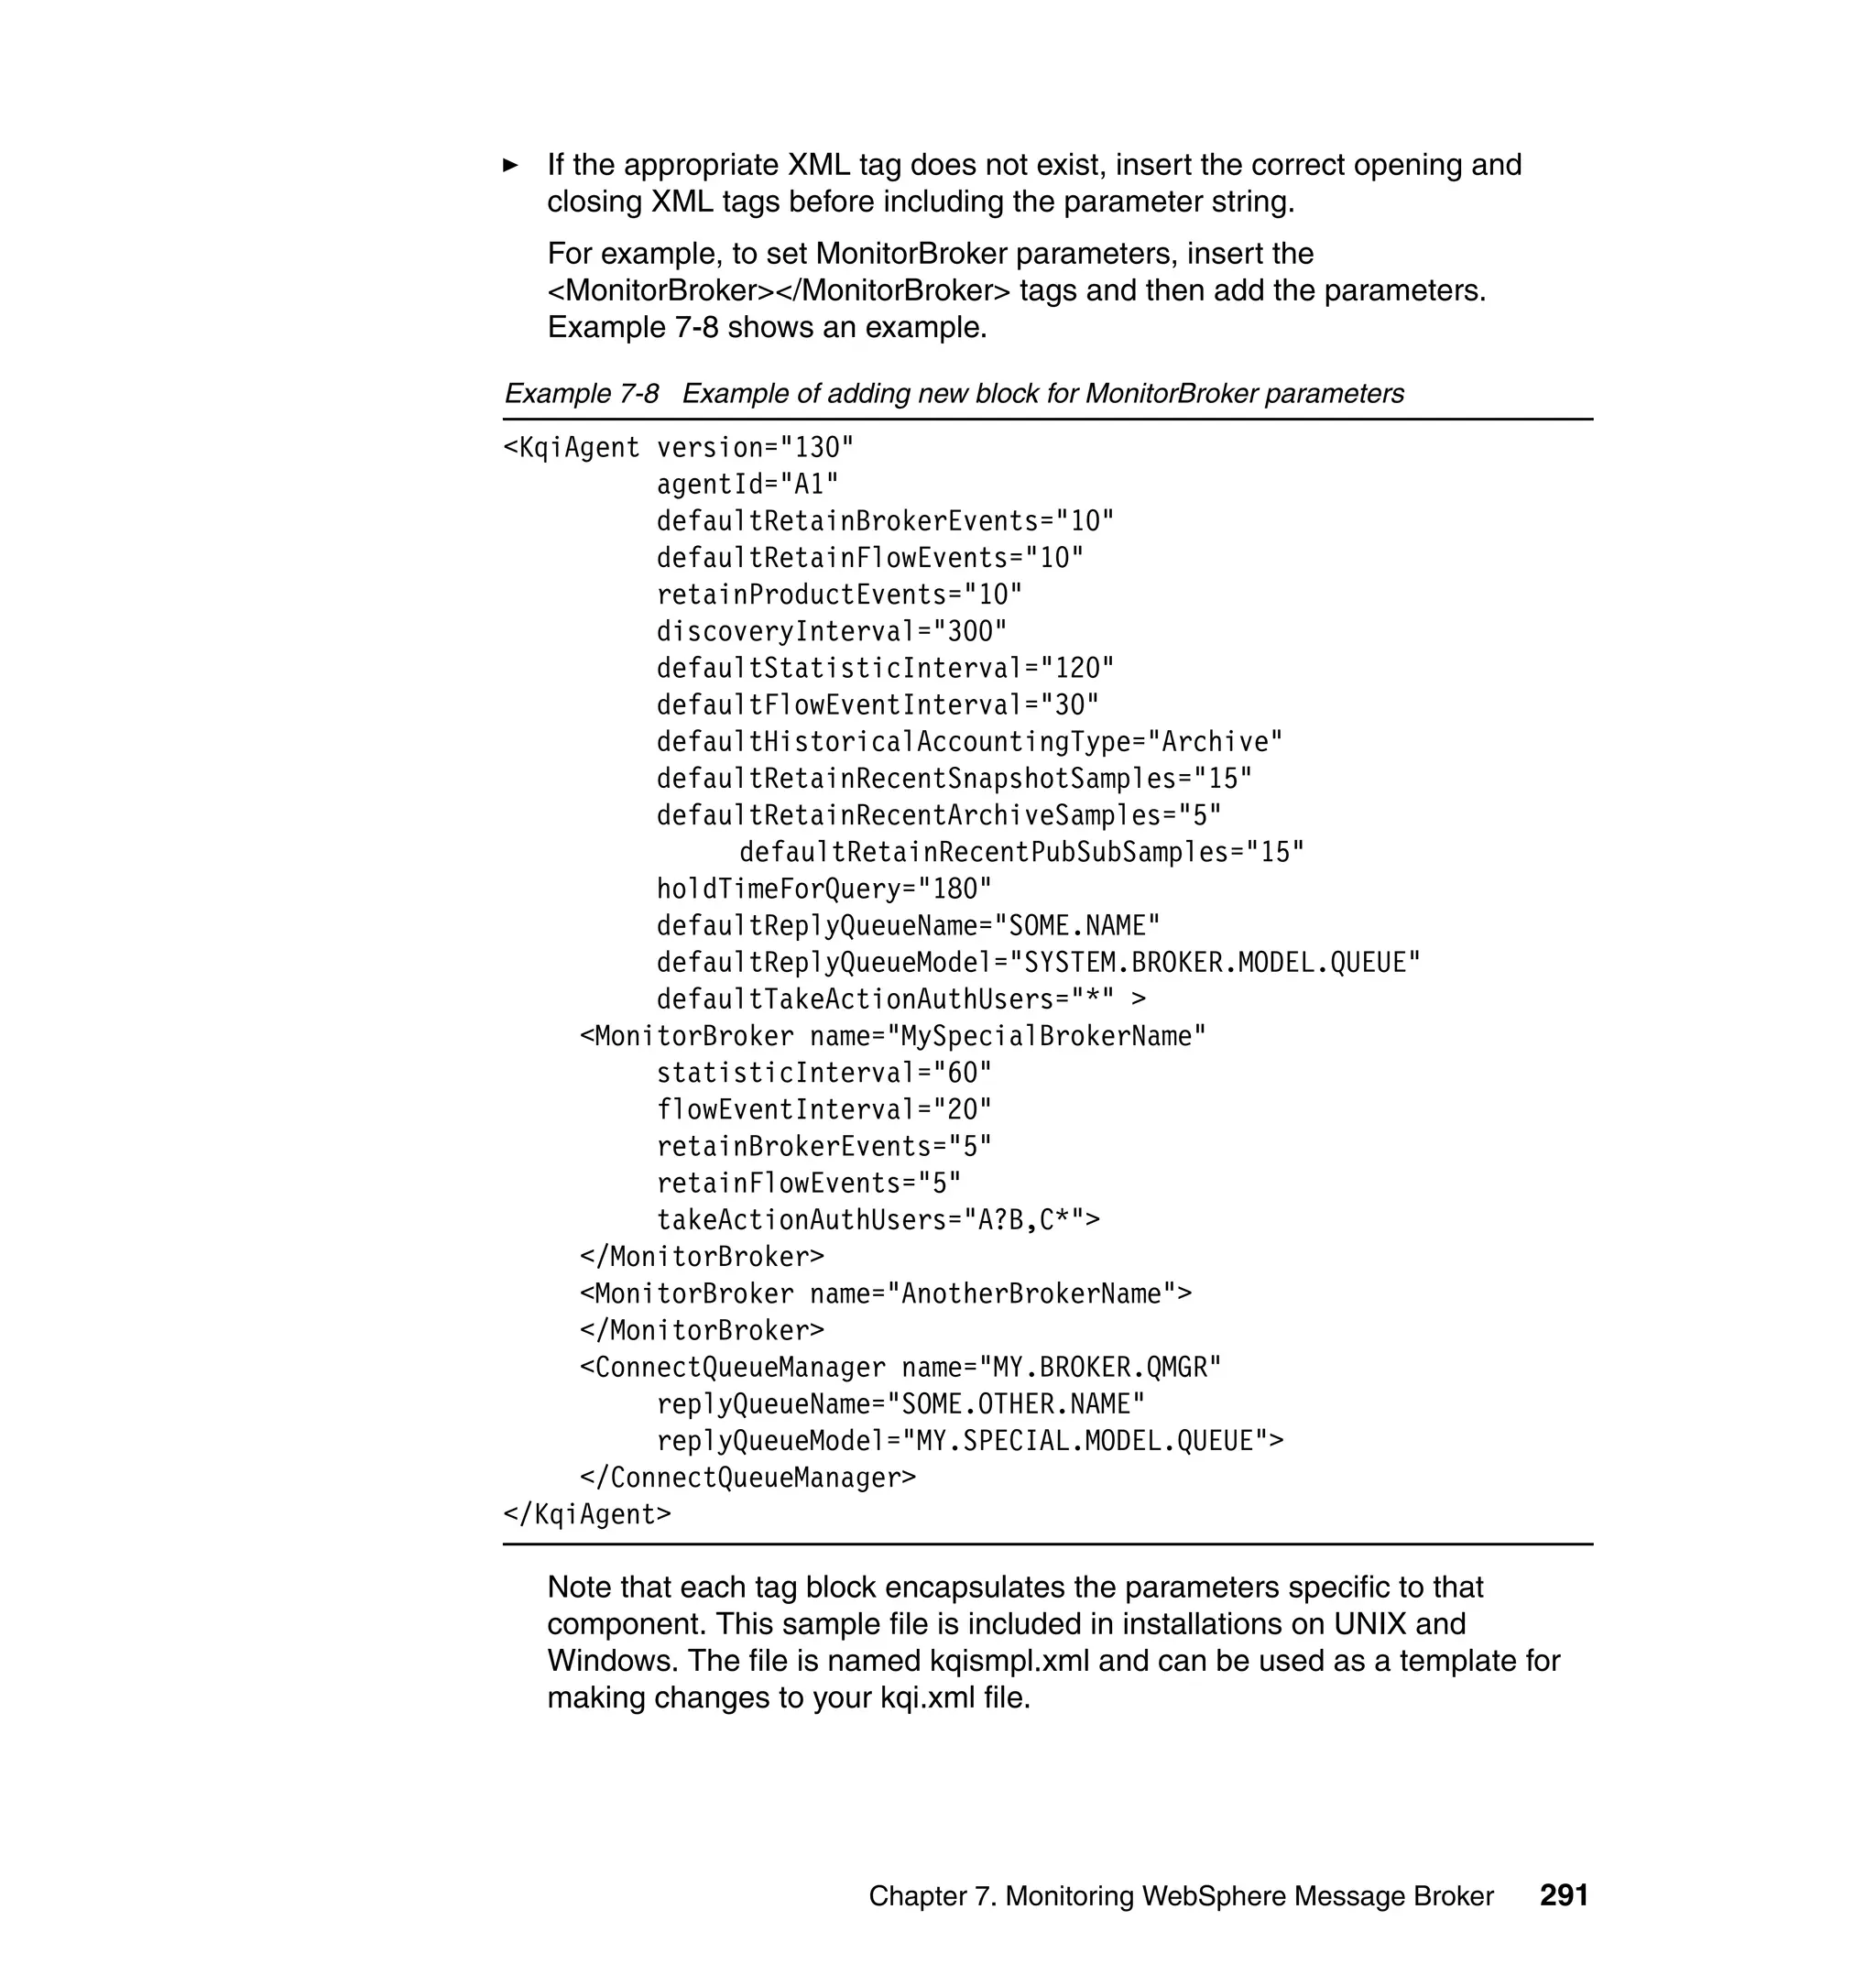
7.5.11 Customizing parameters
The parameters that determine the operational and monitoring characteristics of
WebSphere Message Broker Monitoring reside in an XML file created during
product installation. If desired, customize these parameters. For information and
instructions, see IBM Tivoli OMEGAMON XE for Messaging: WebSphere
Message Broker Monitoring User's Guide.
Chapter 7. Monitoring WebSphere Message Broker 283](https://image.slidesharecdn.com/implementingomegamonxeformessagingv6-0sg247357-120524195829-phpapp02/75/Implementing-omegamon-xe-for-messaging-v6-0-sg247357-305-2048.jpg)

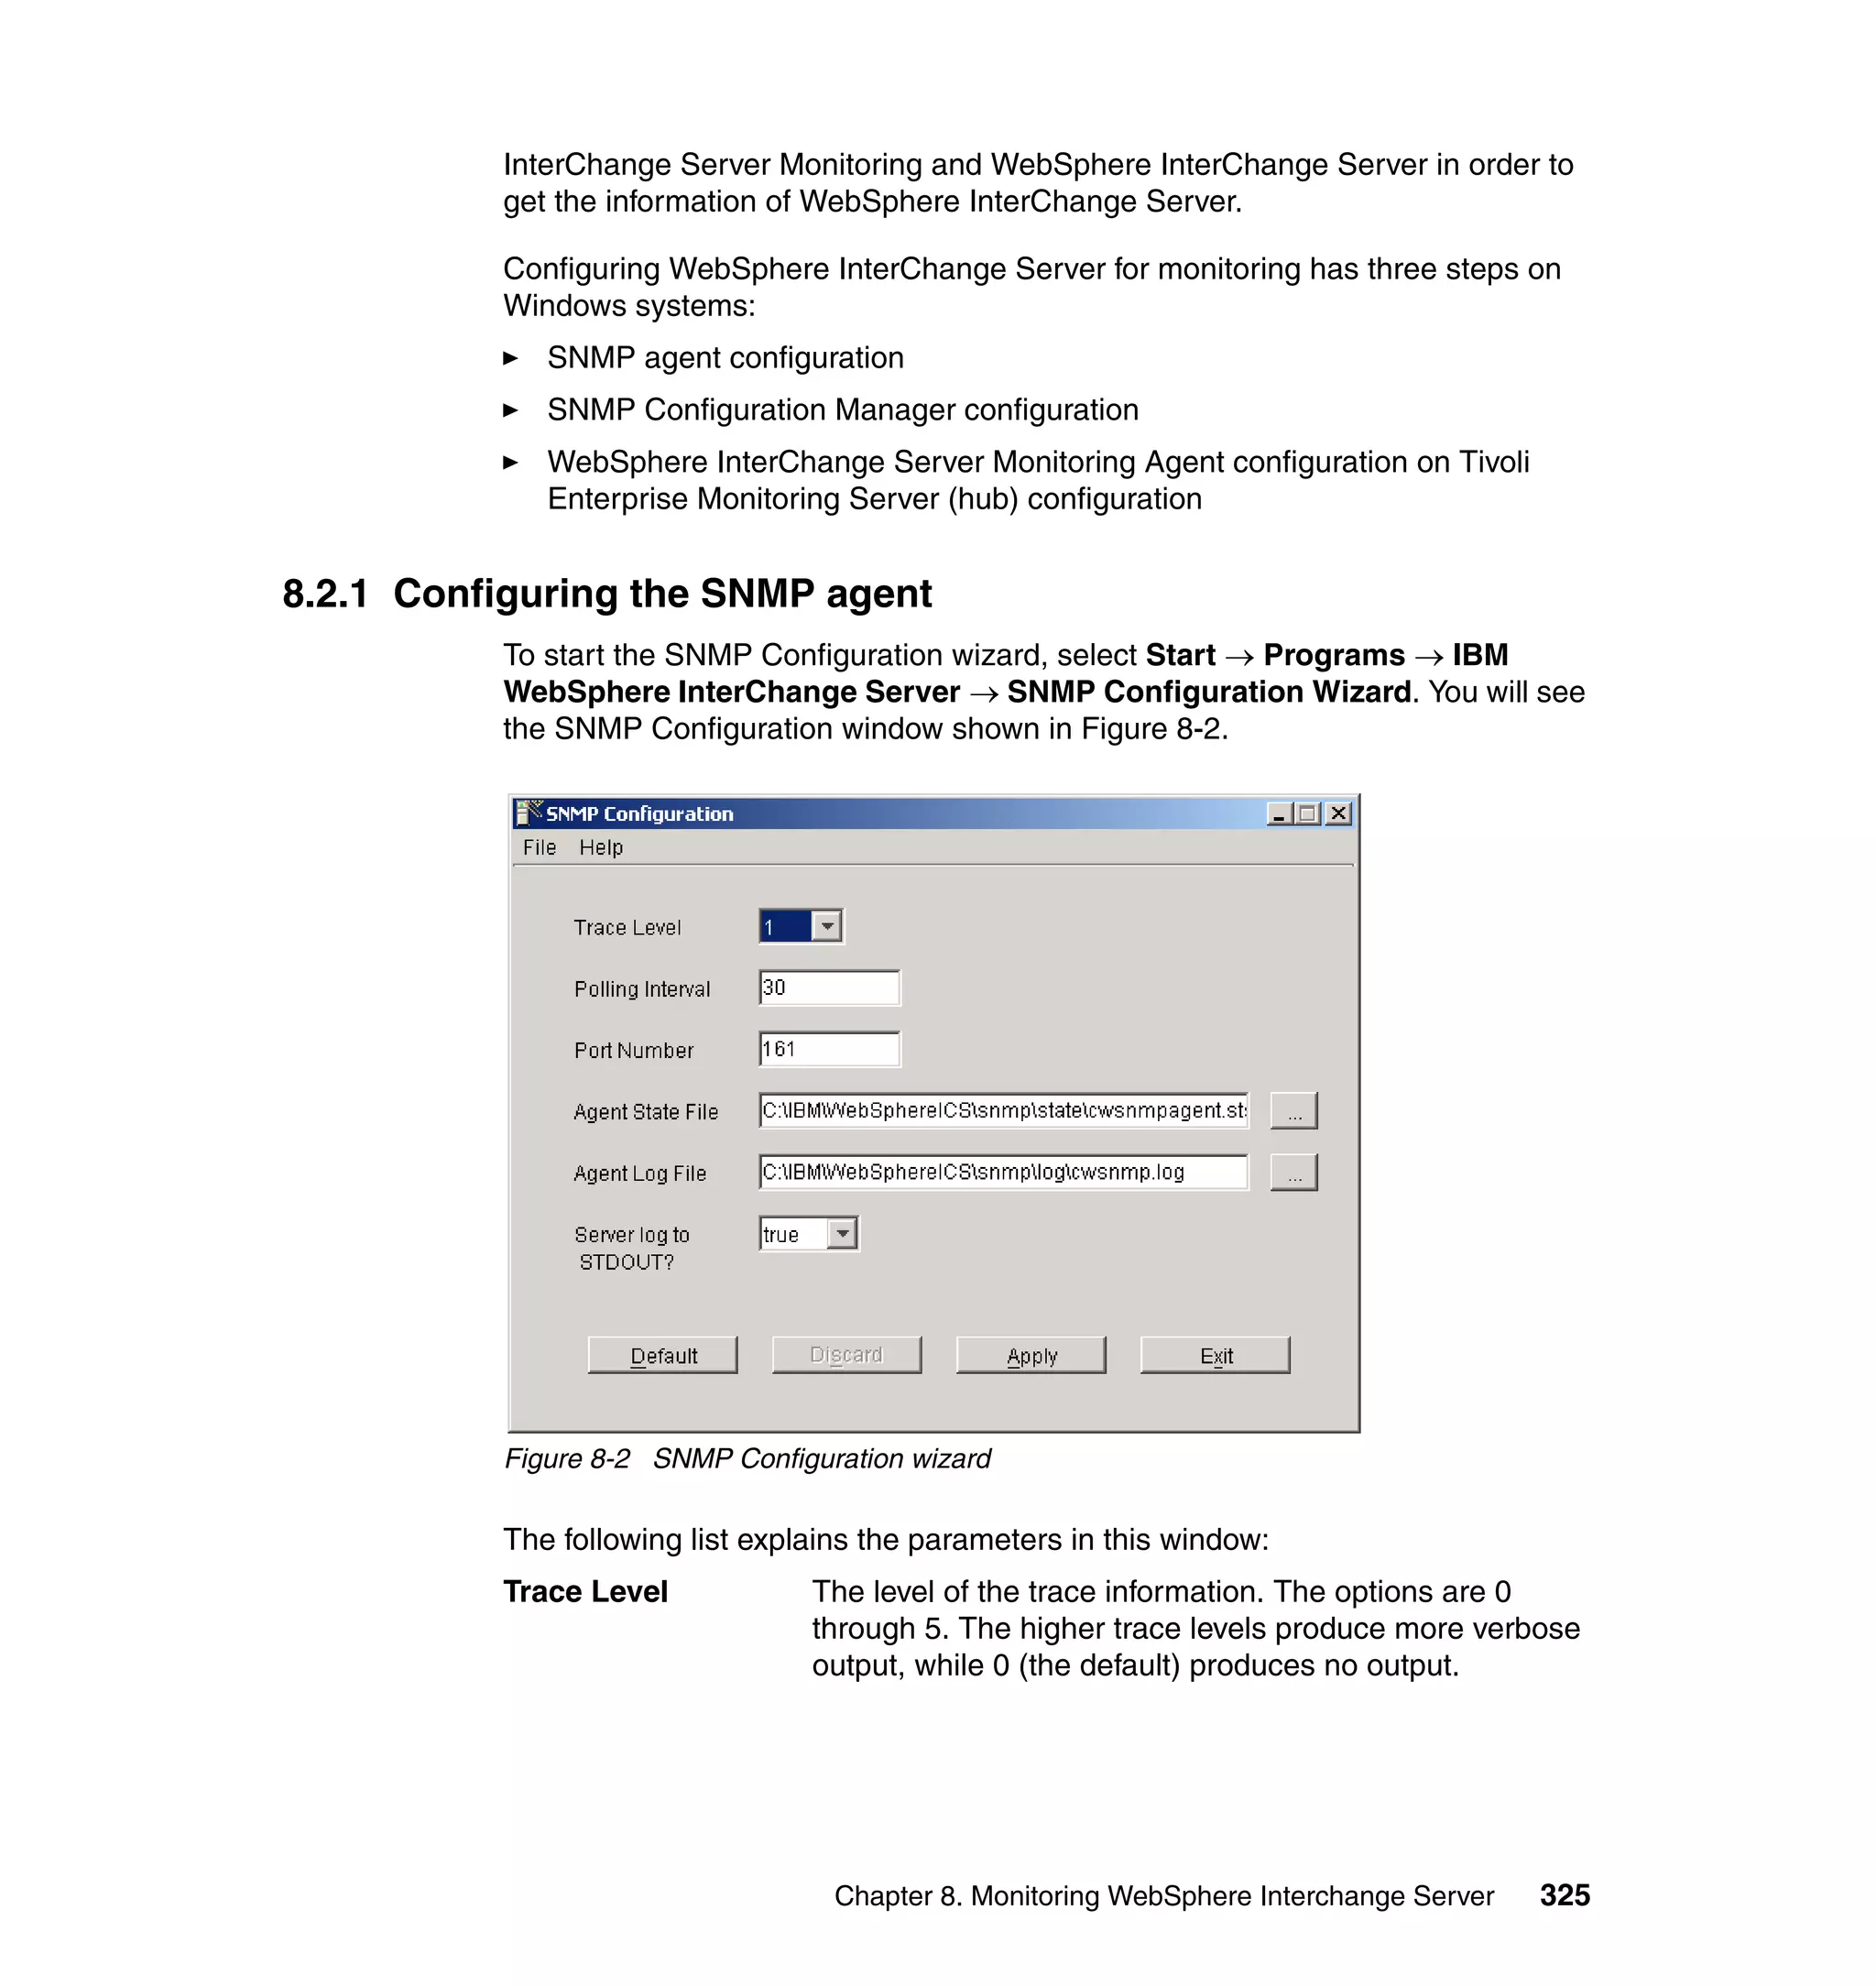
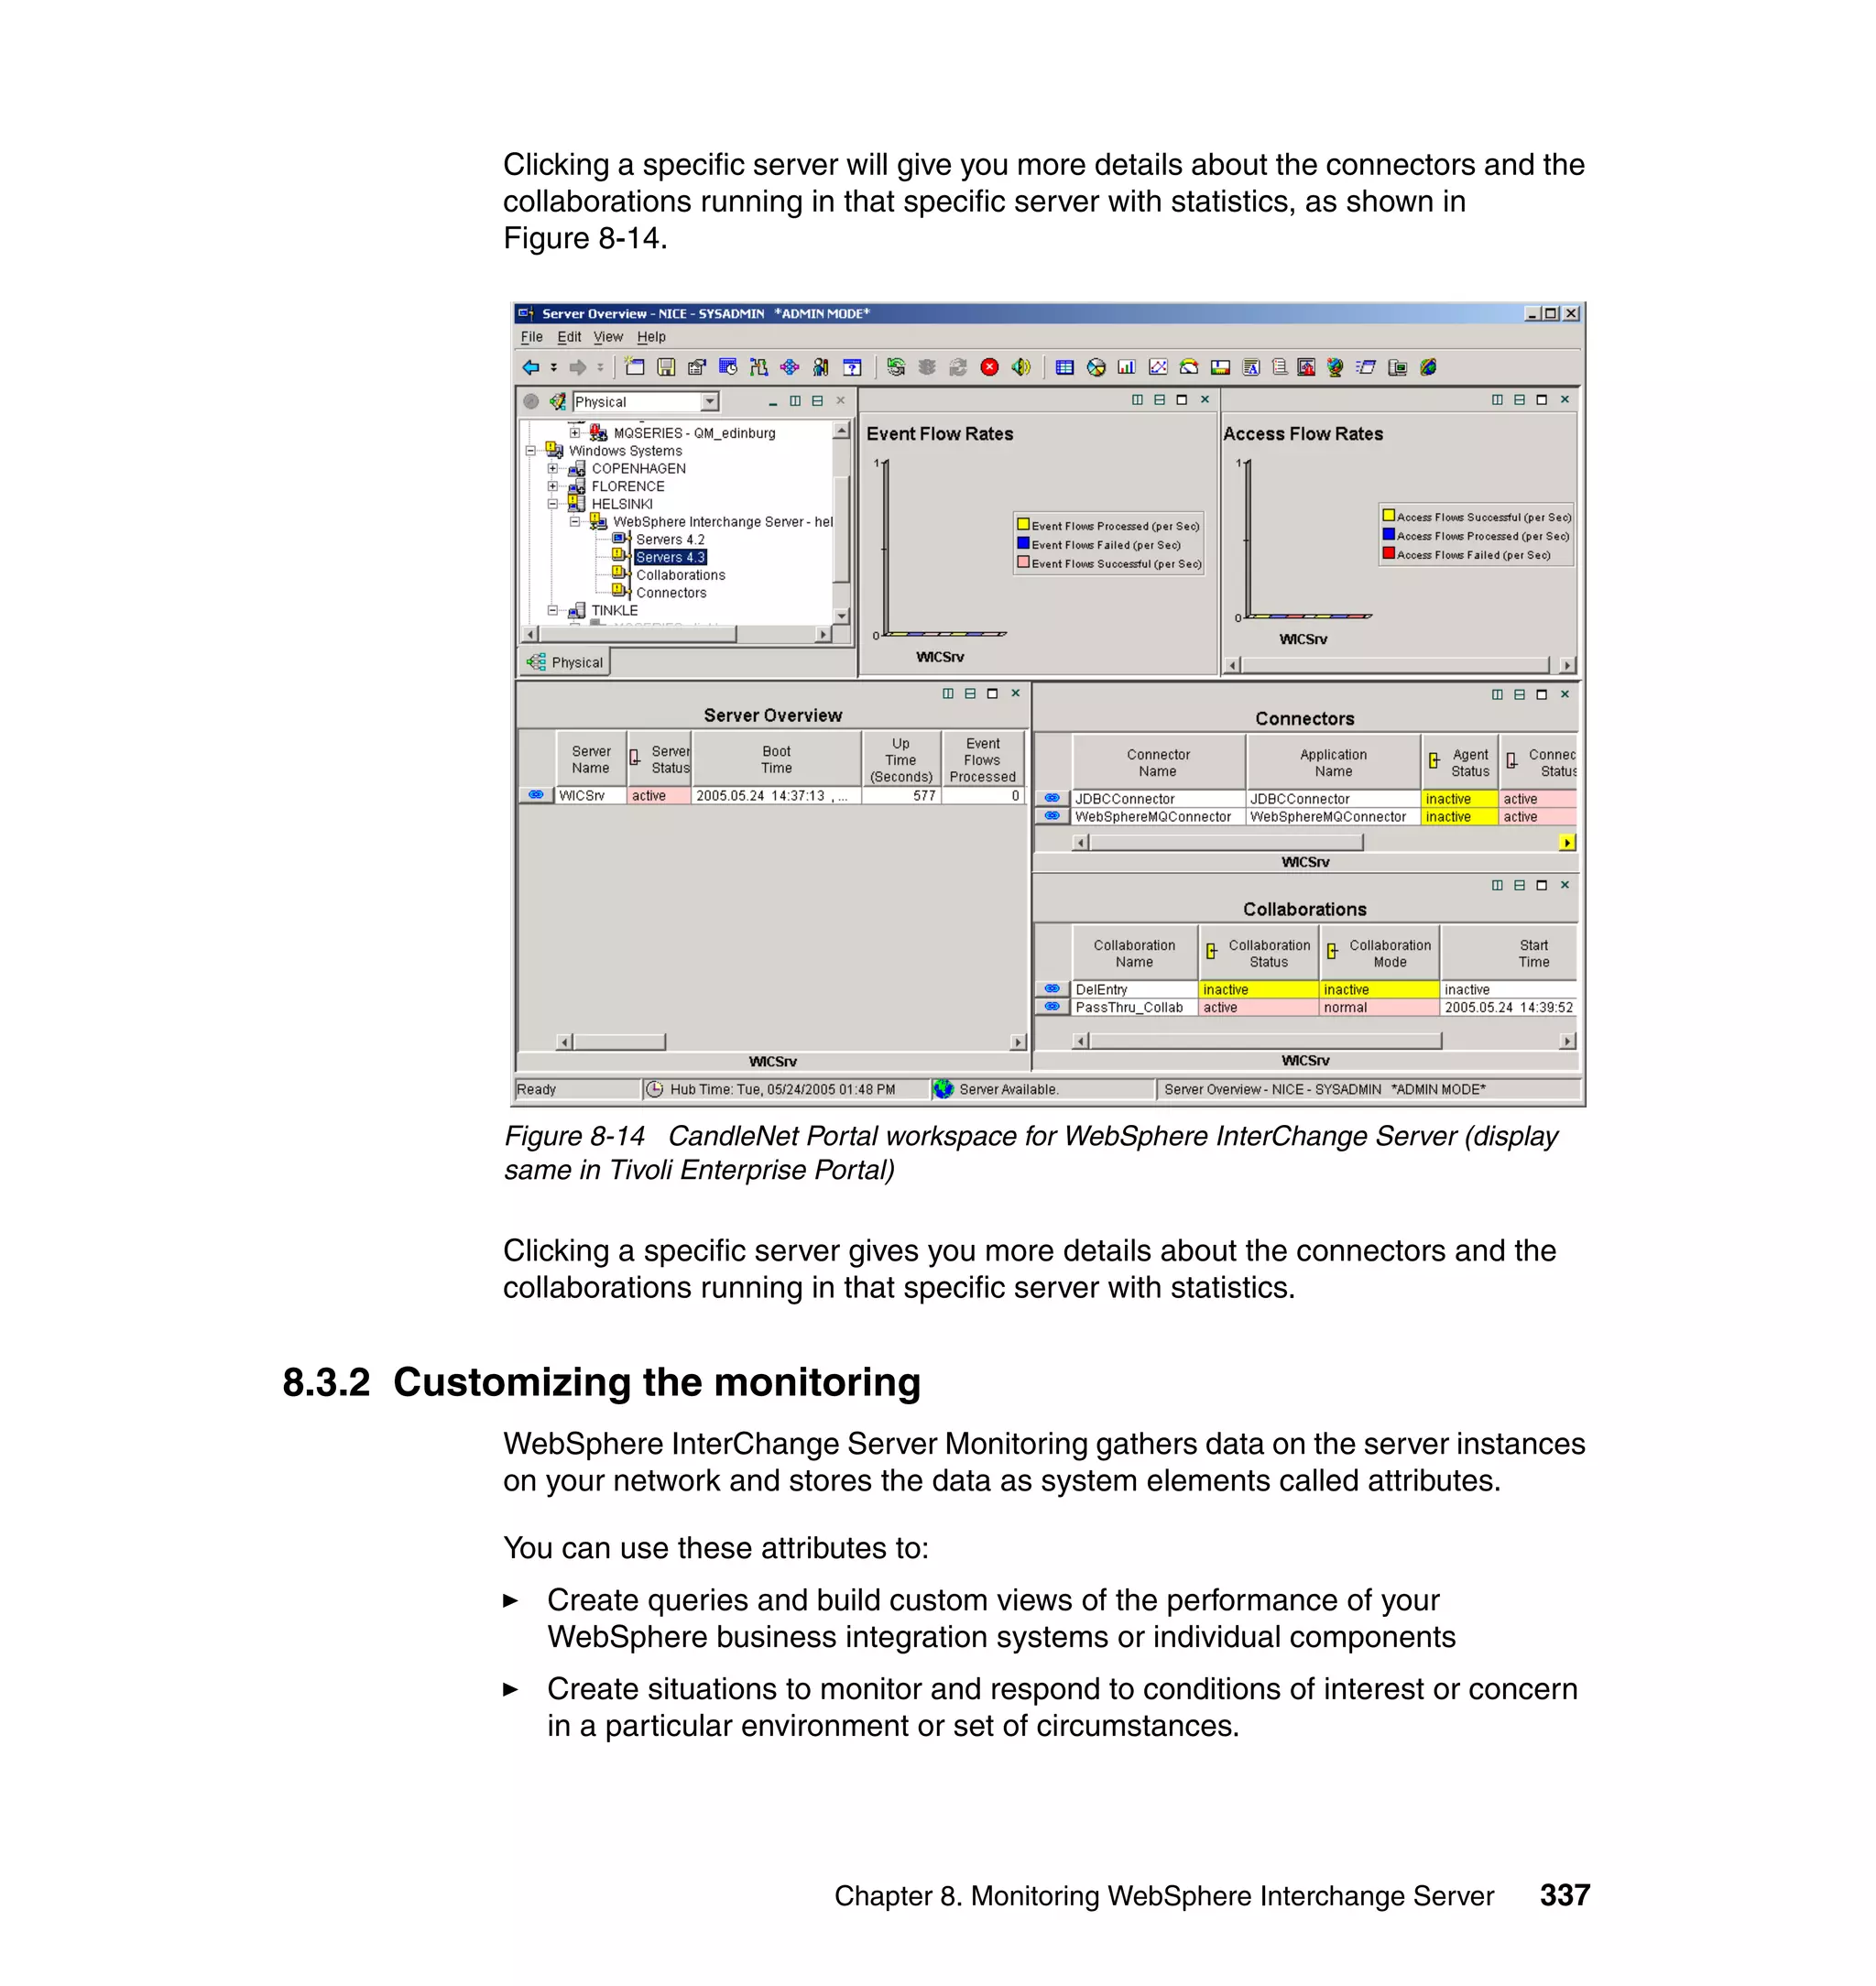
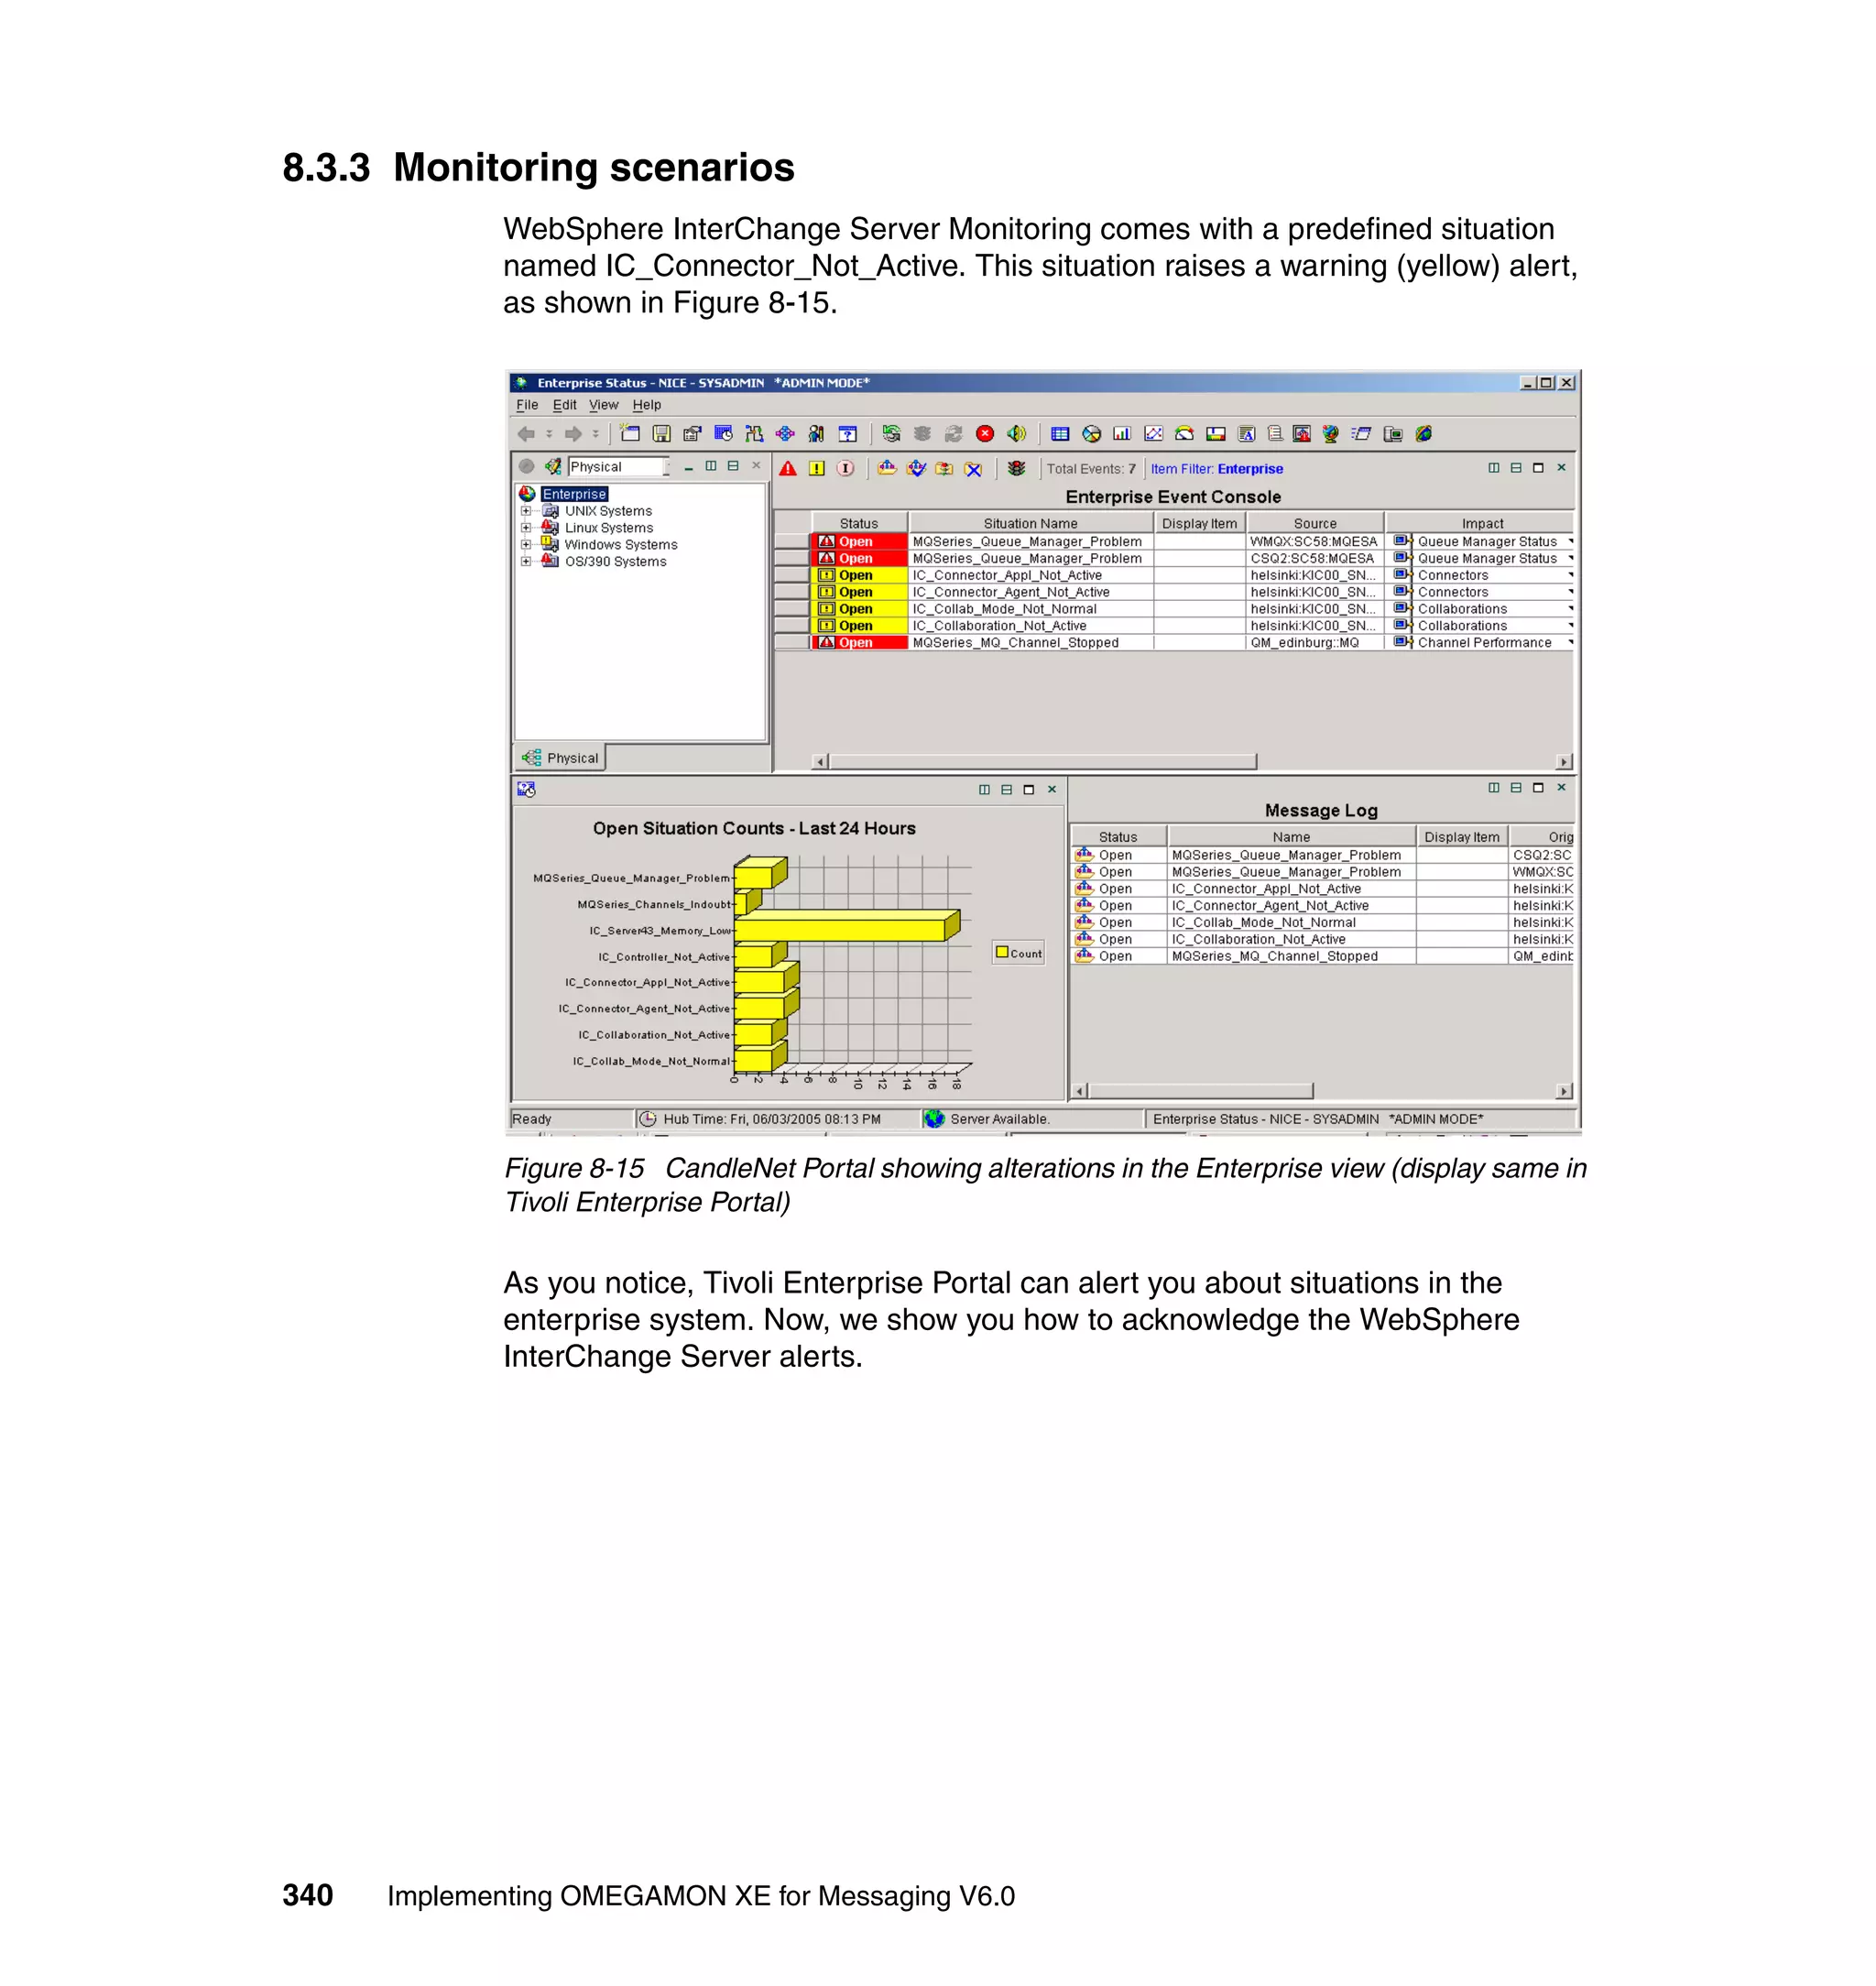
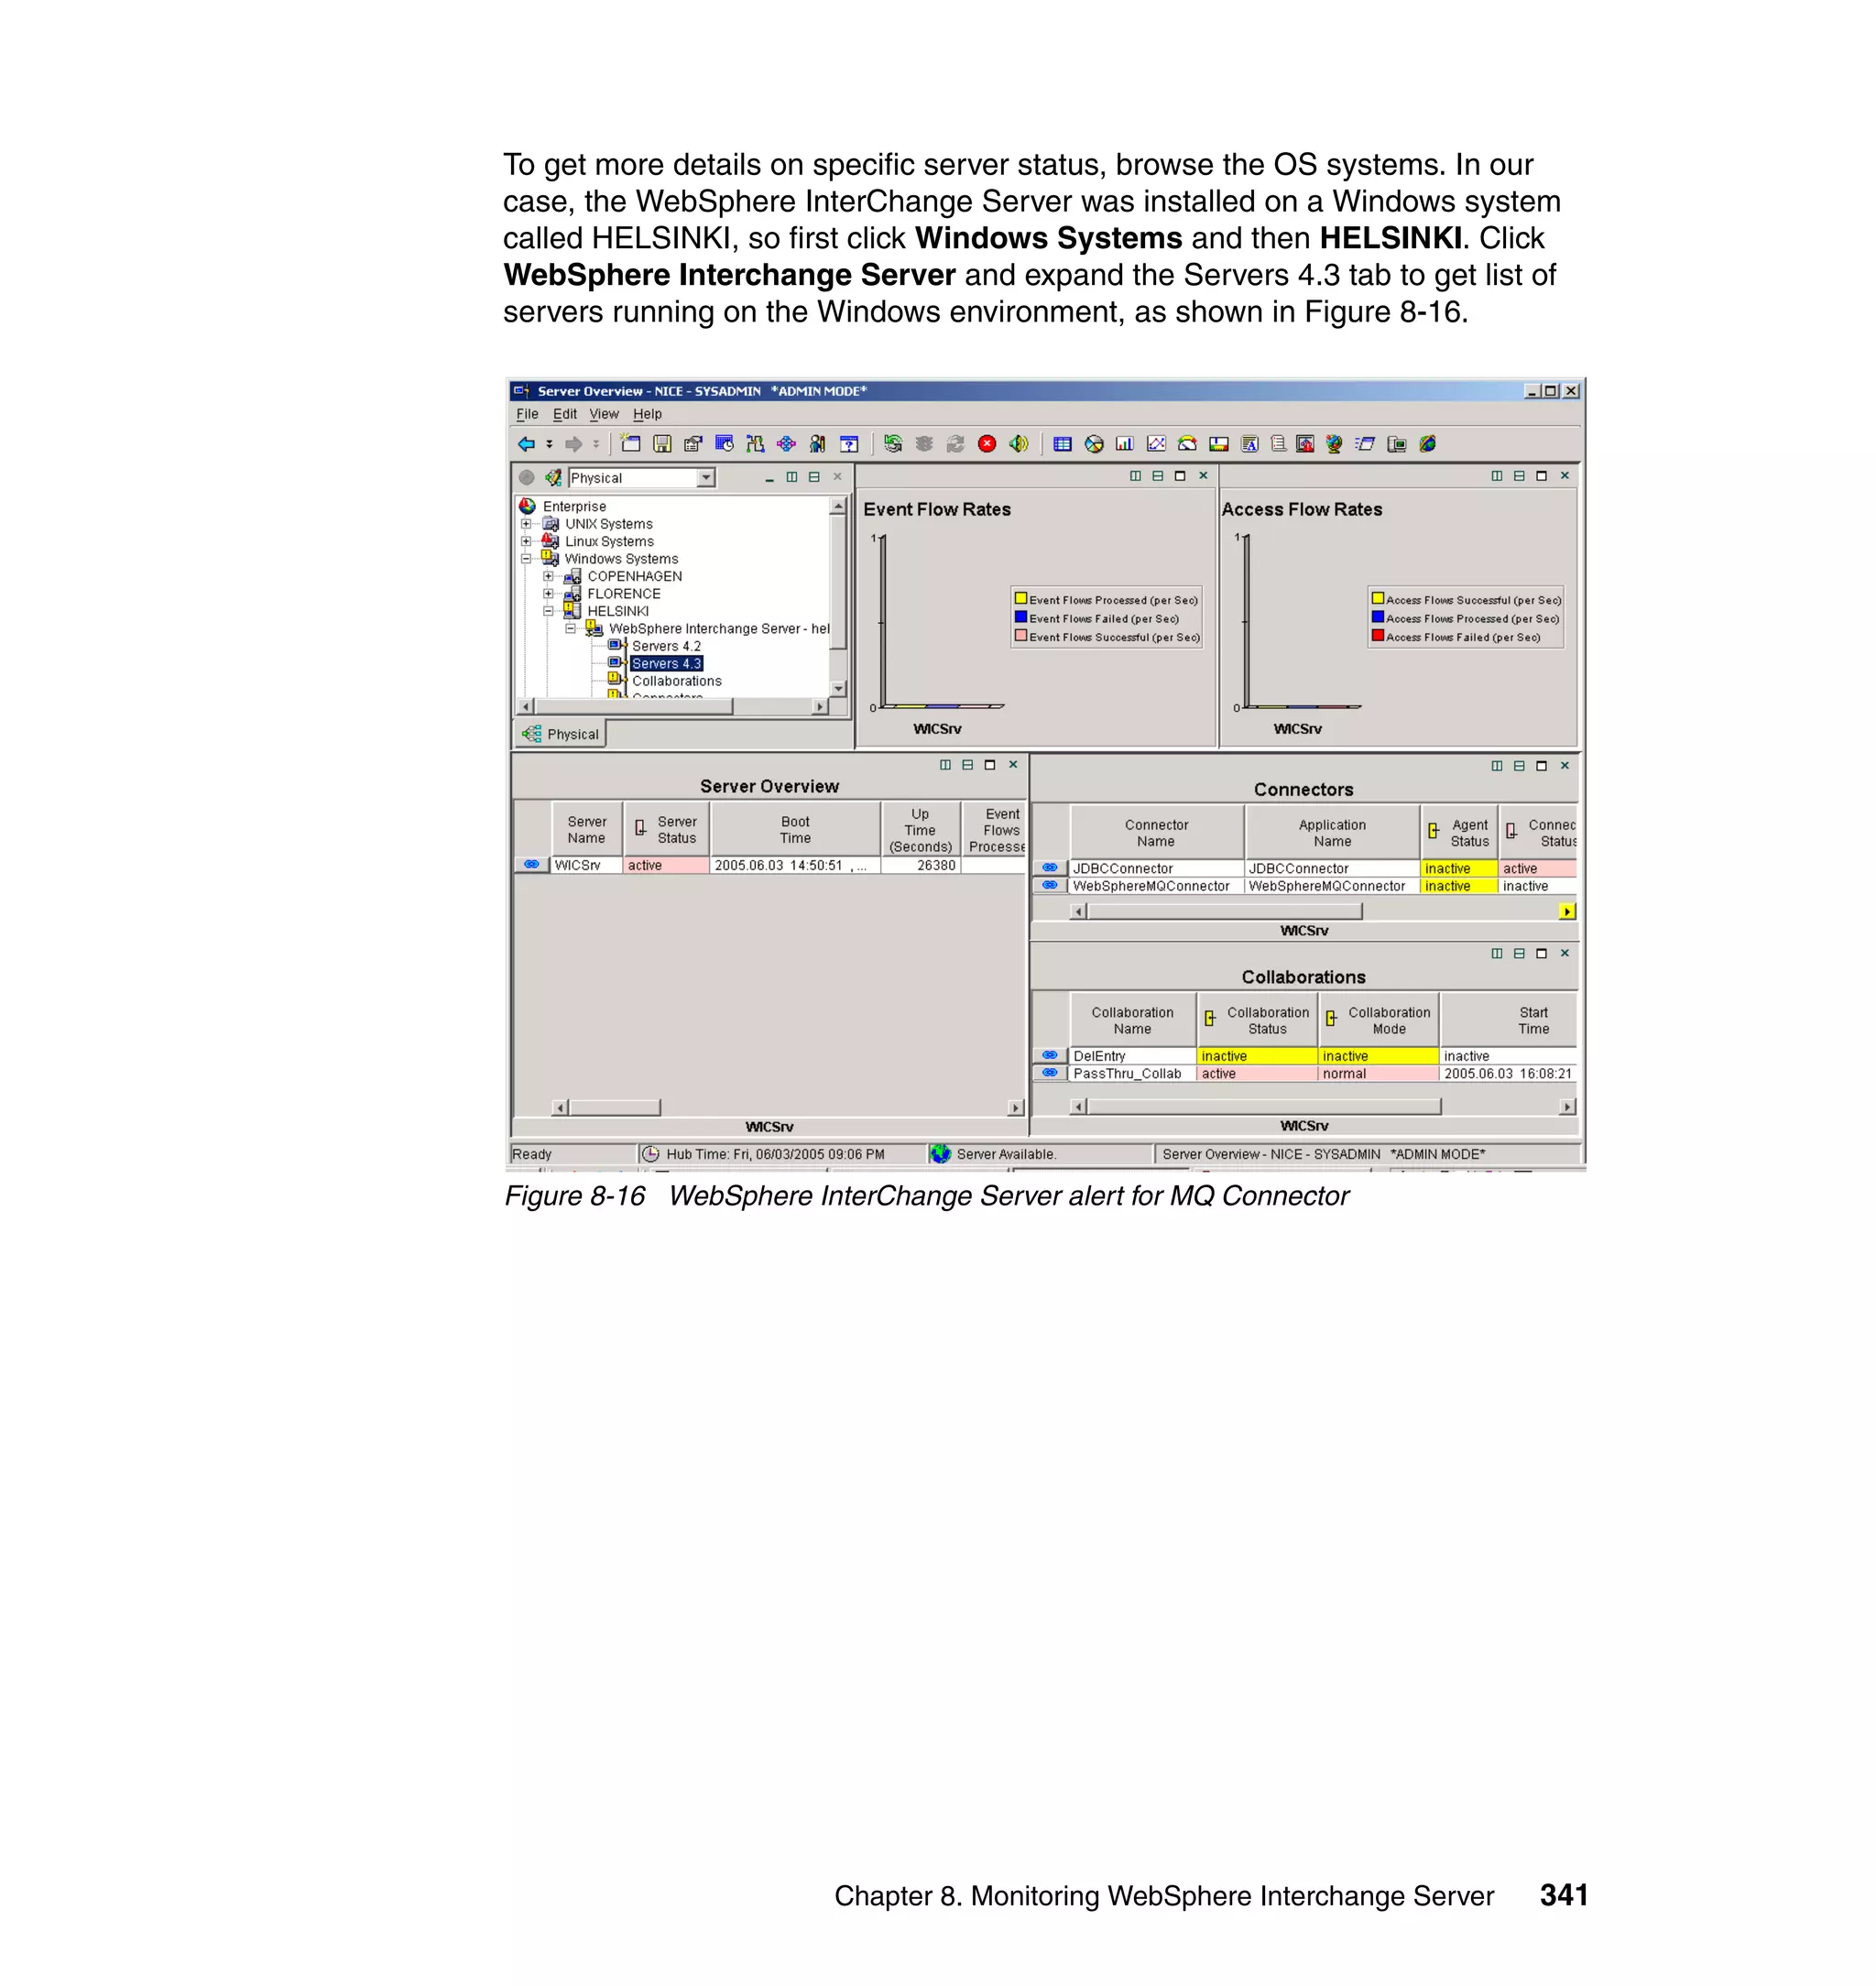
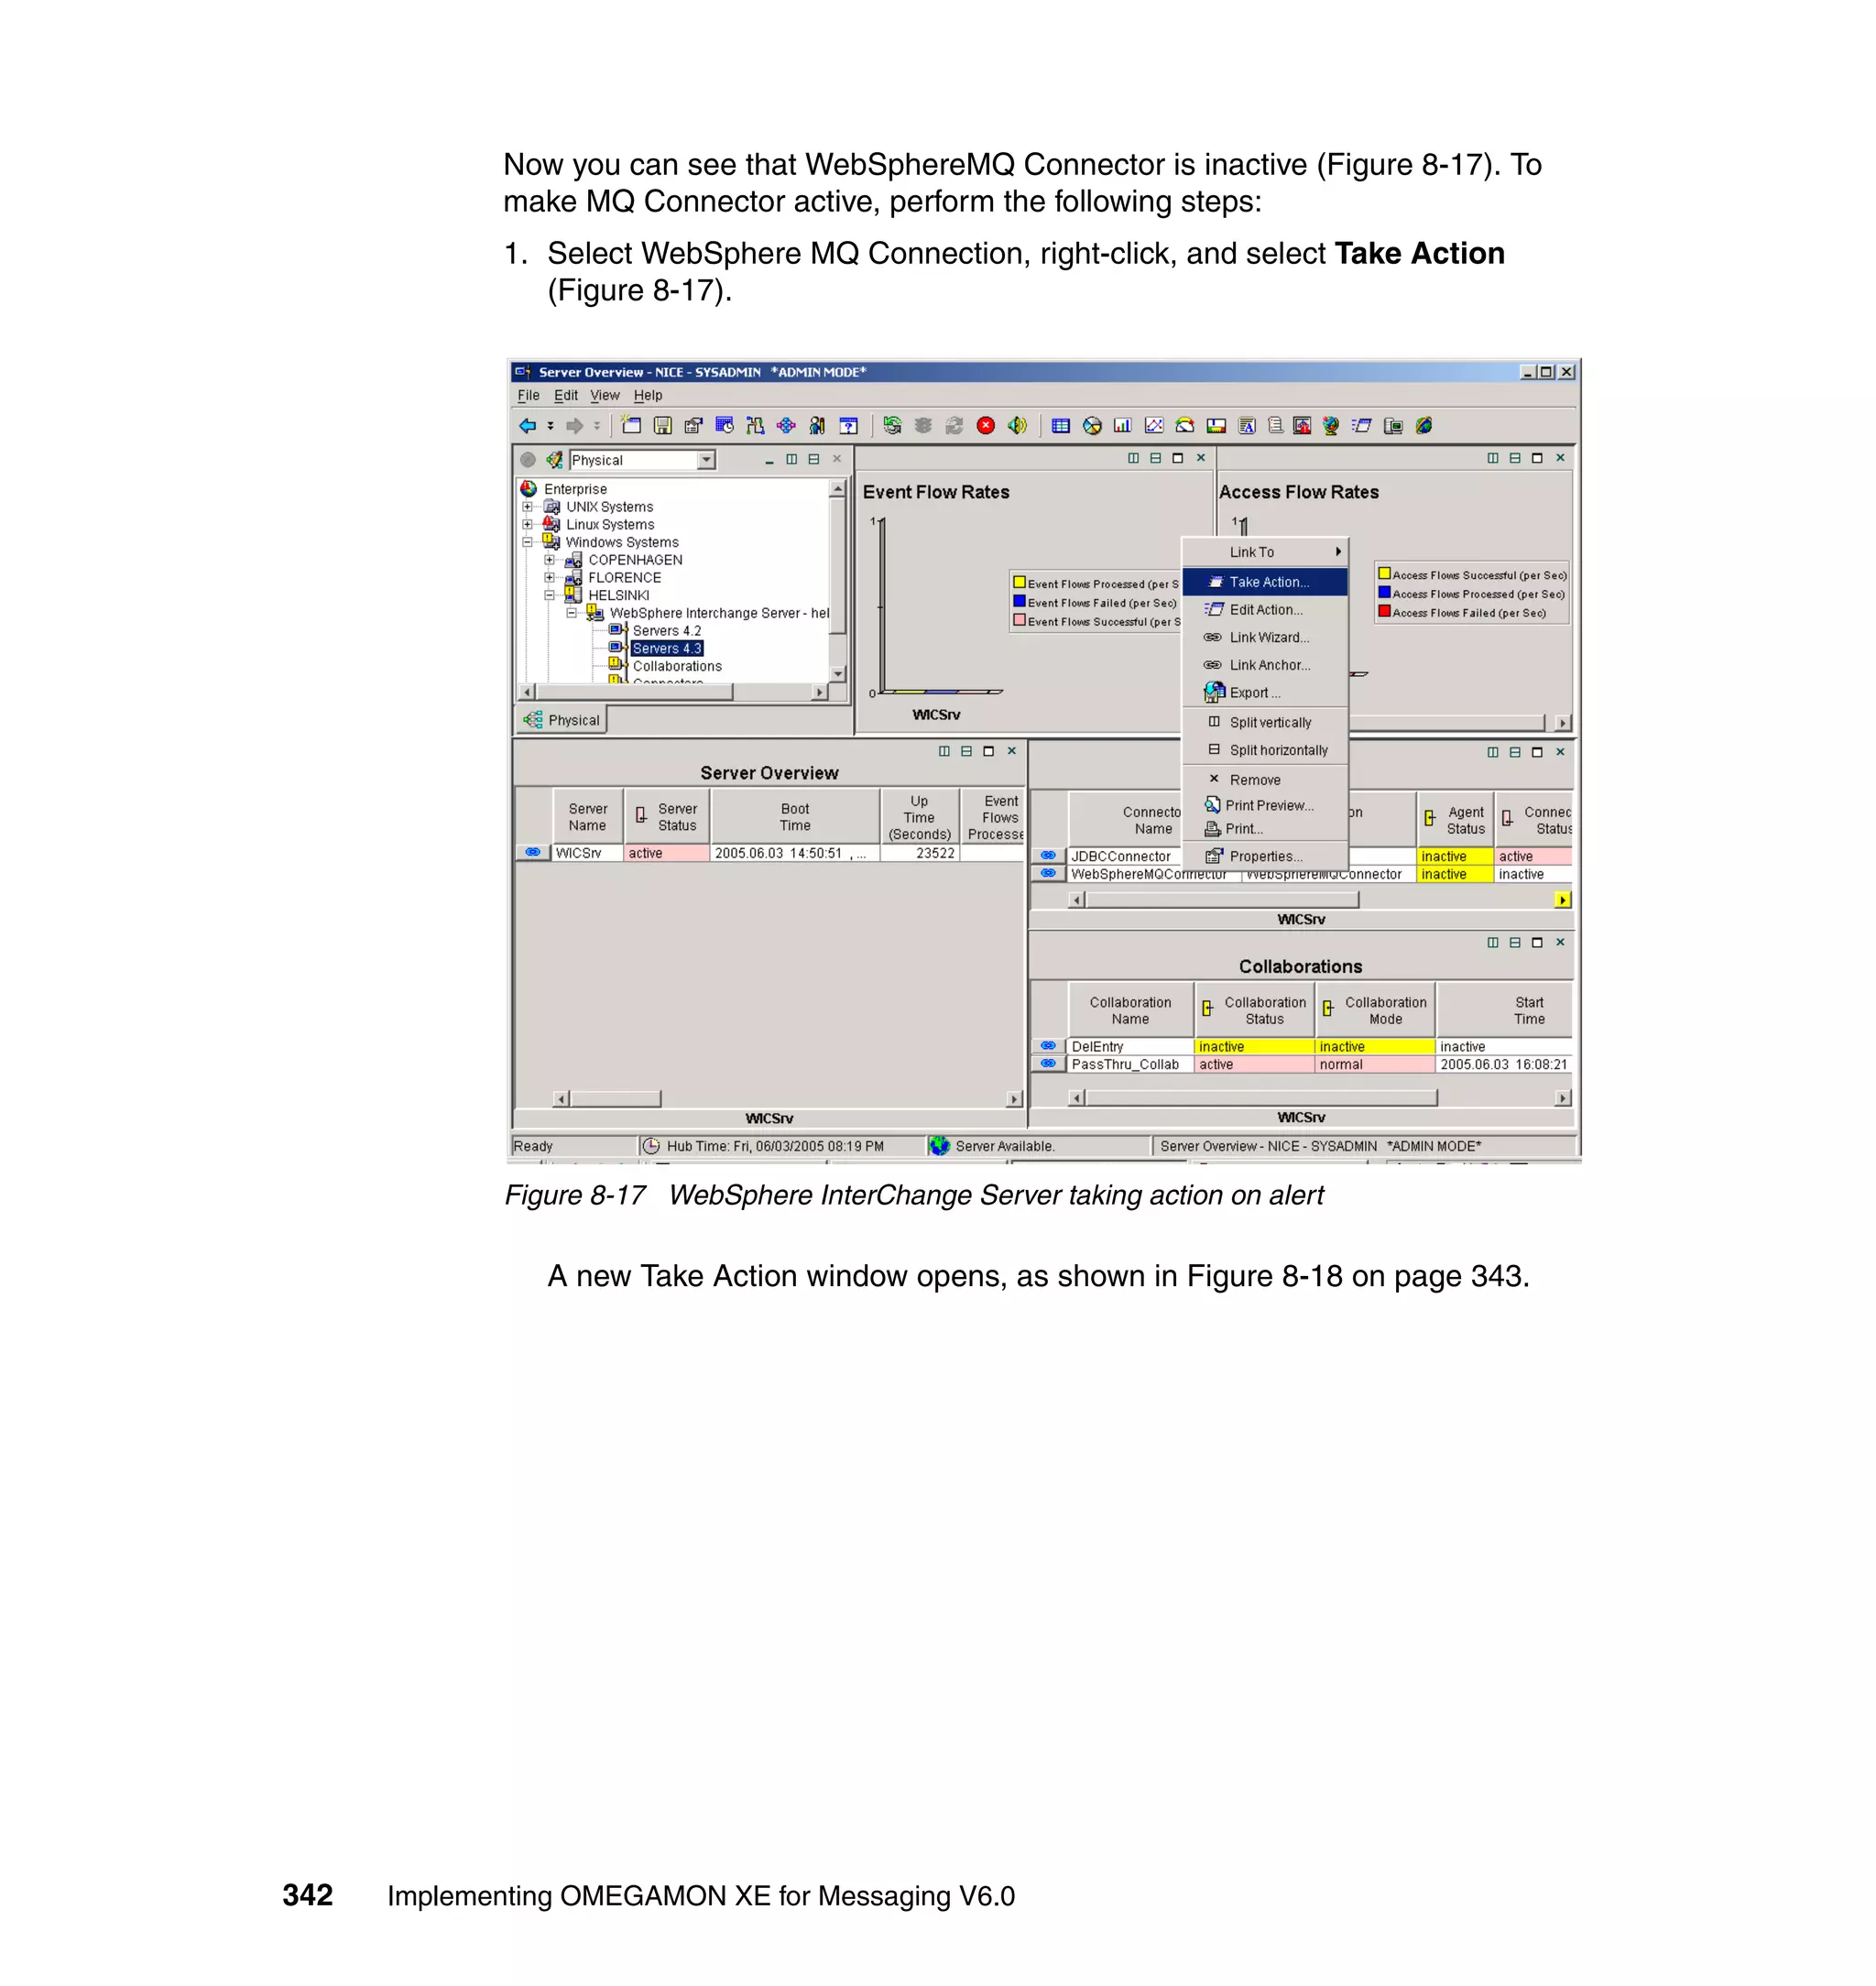
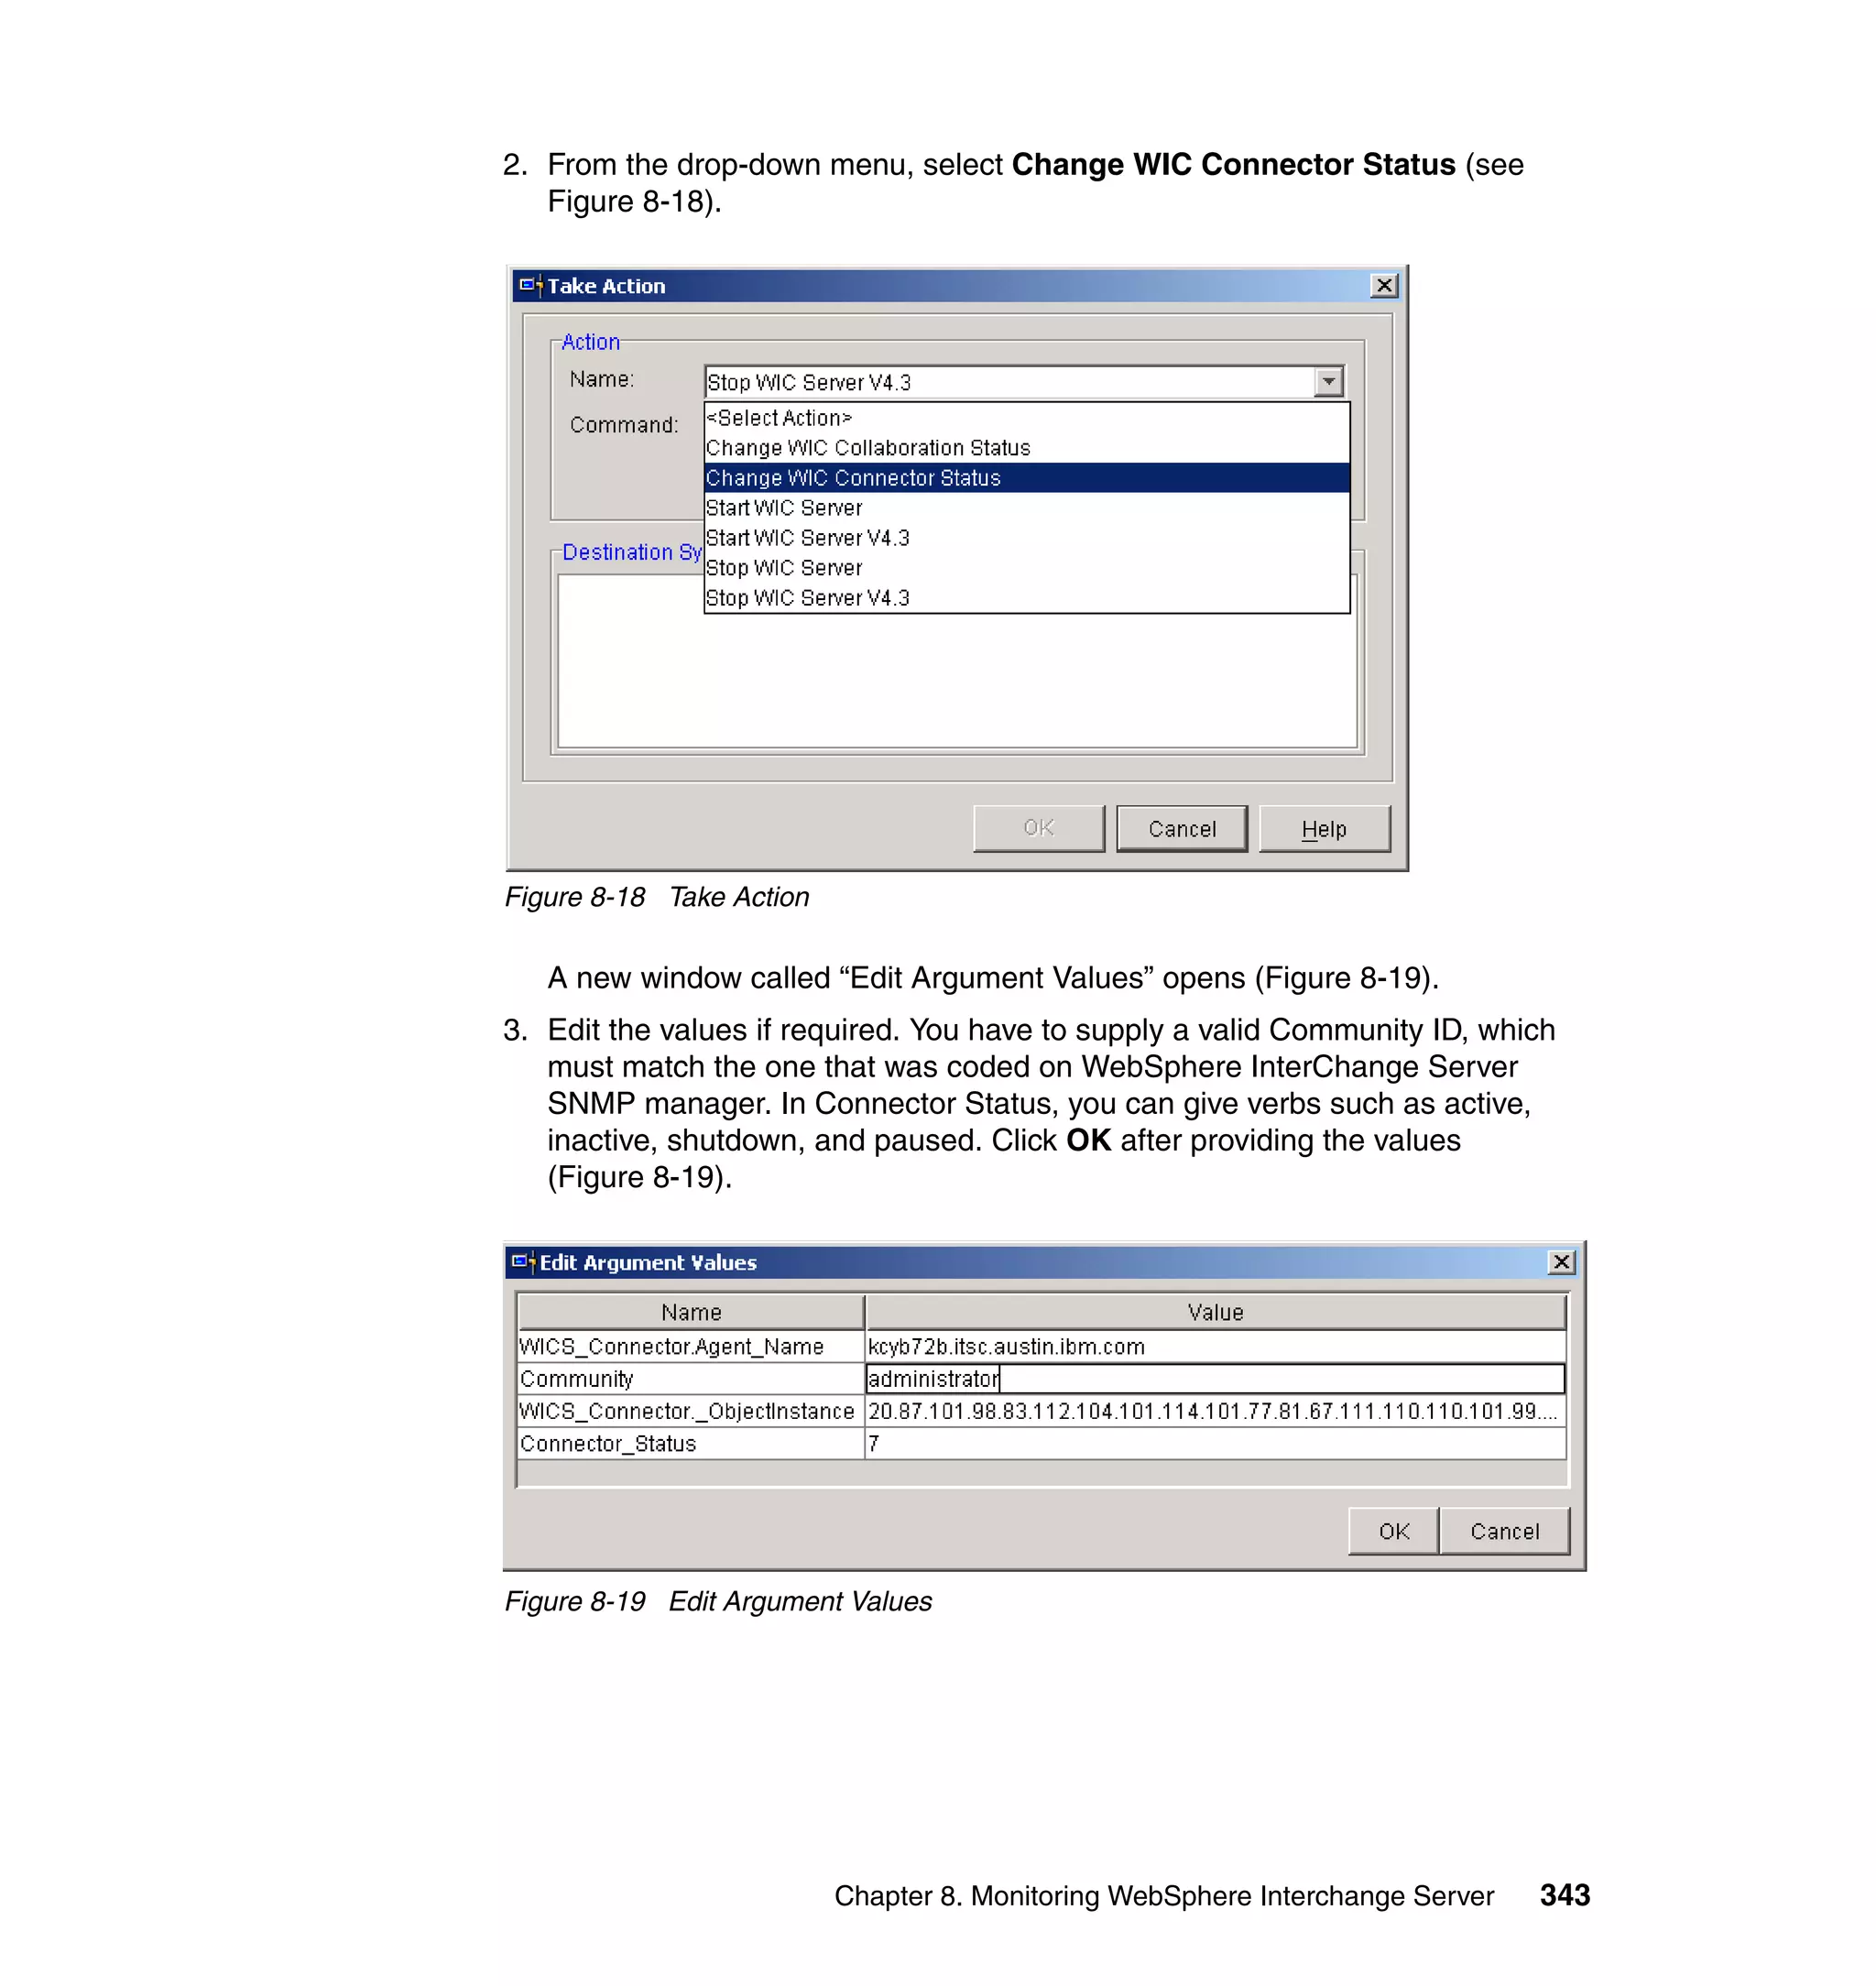
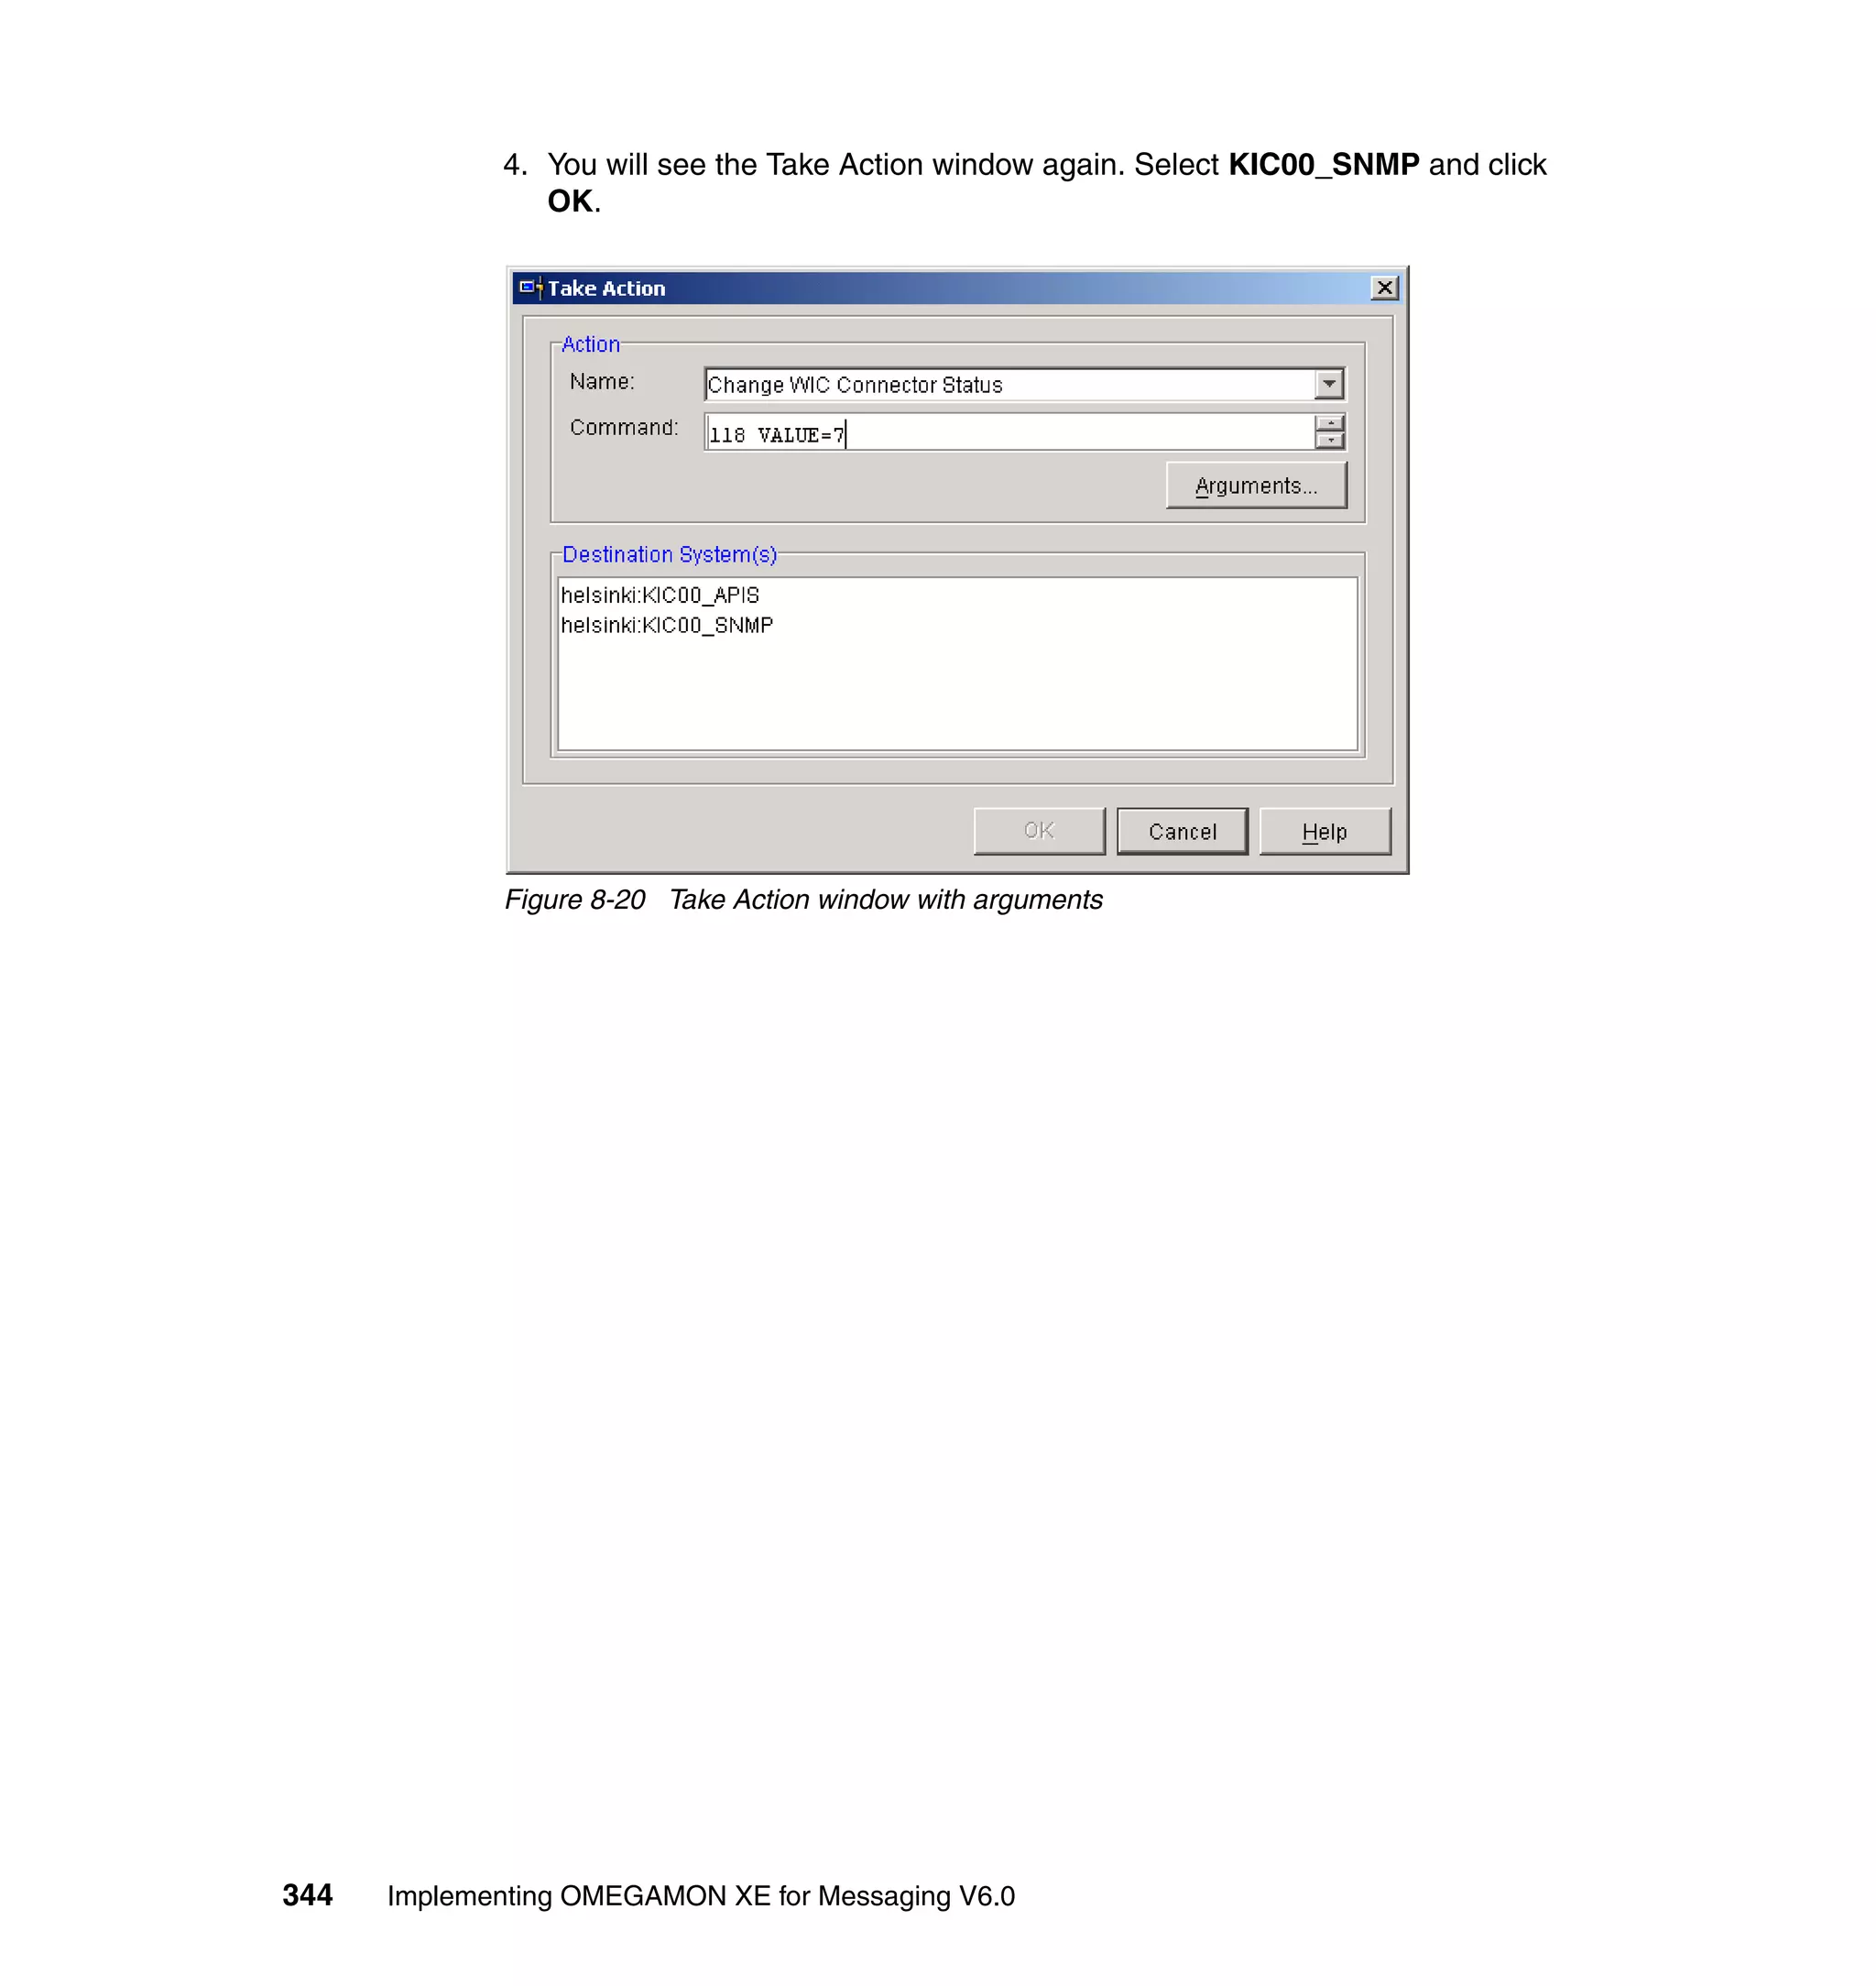

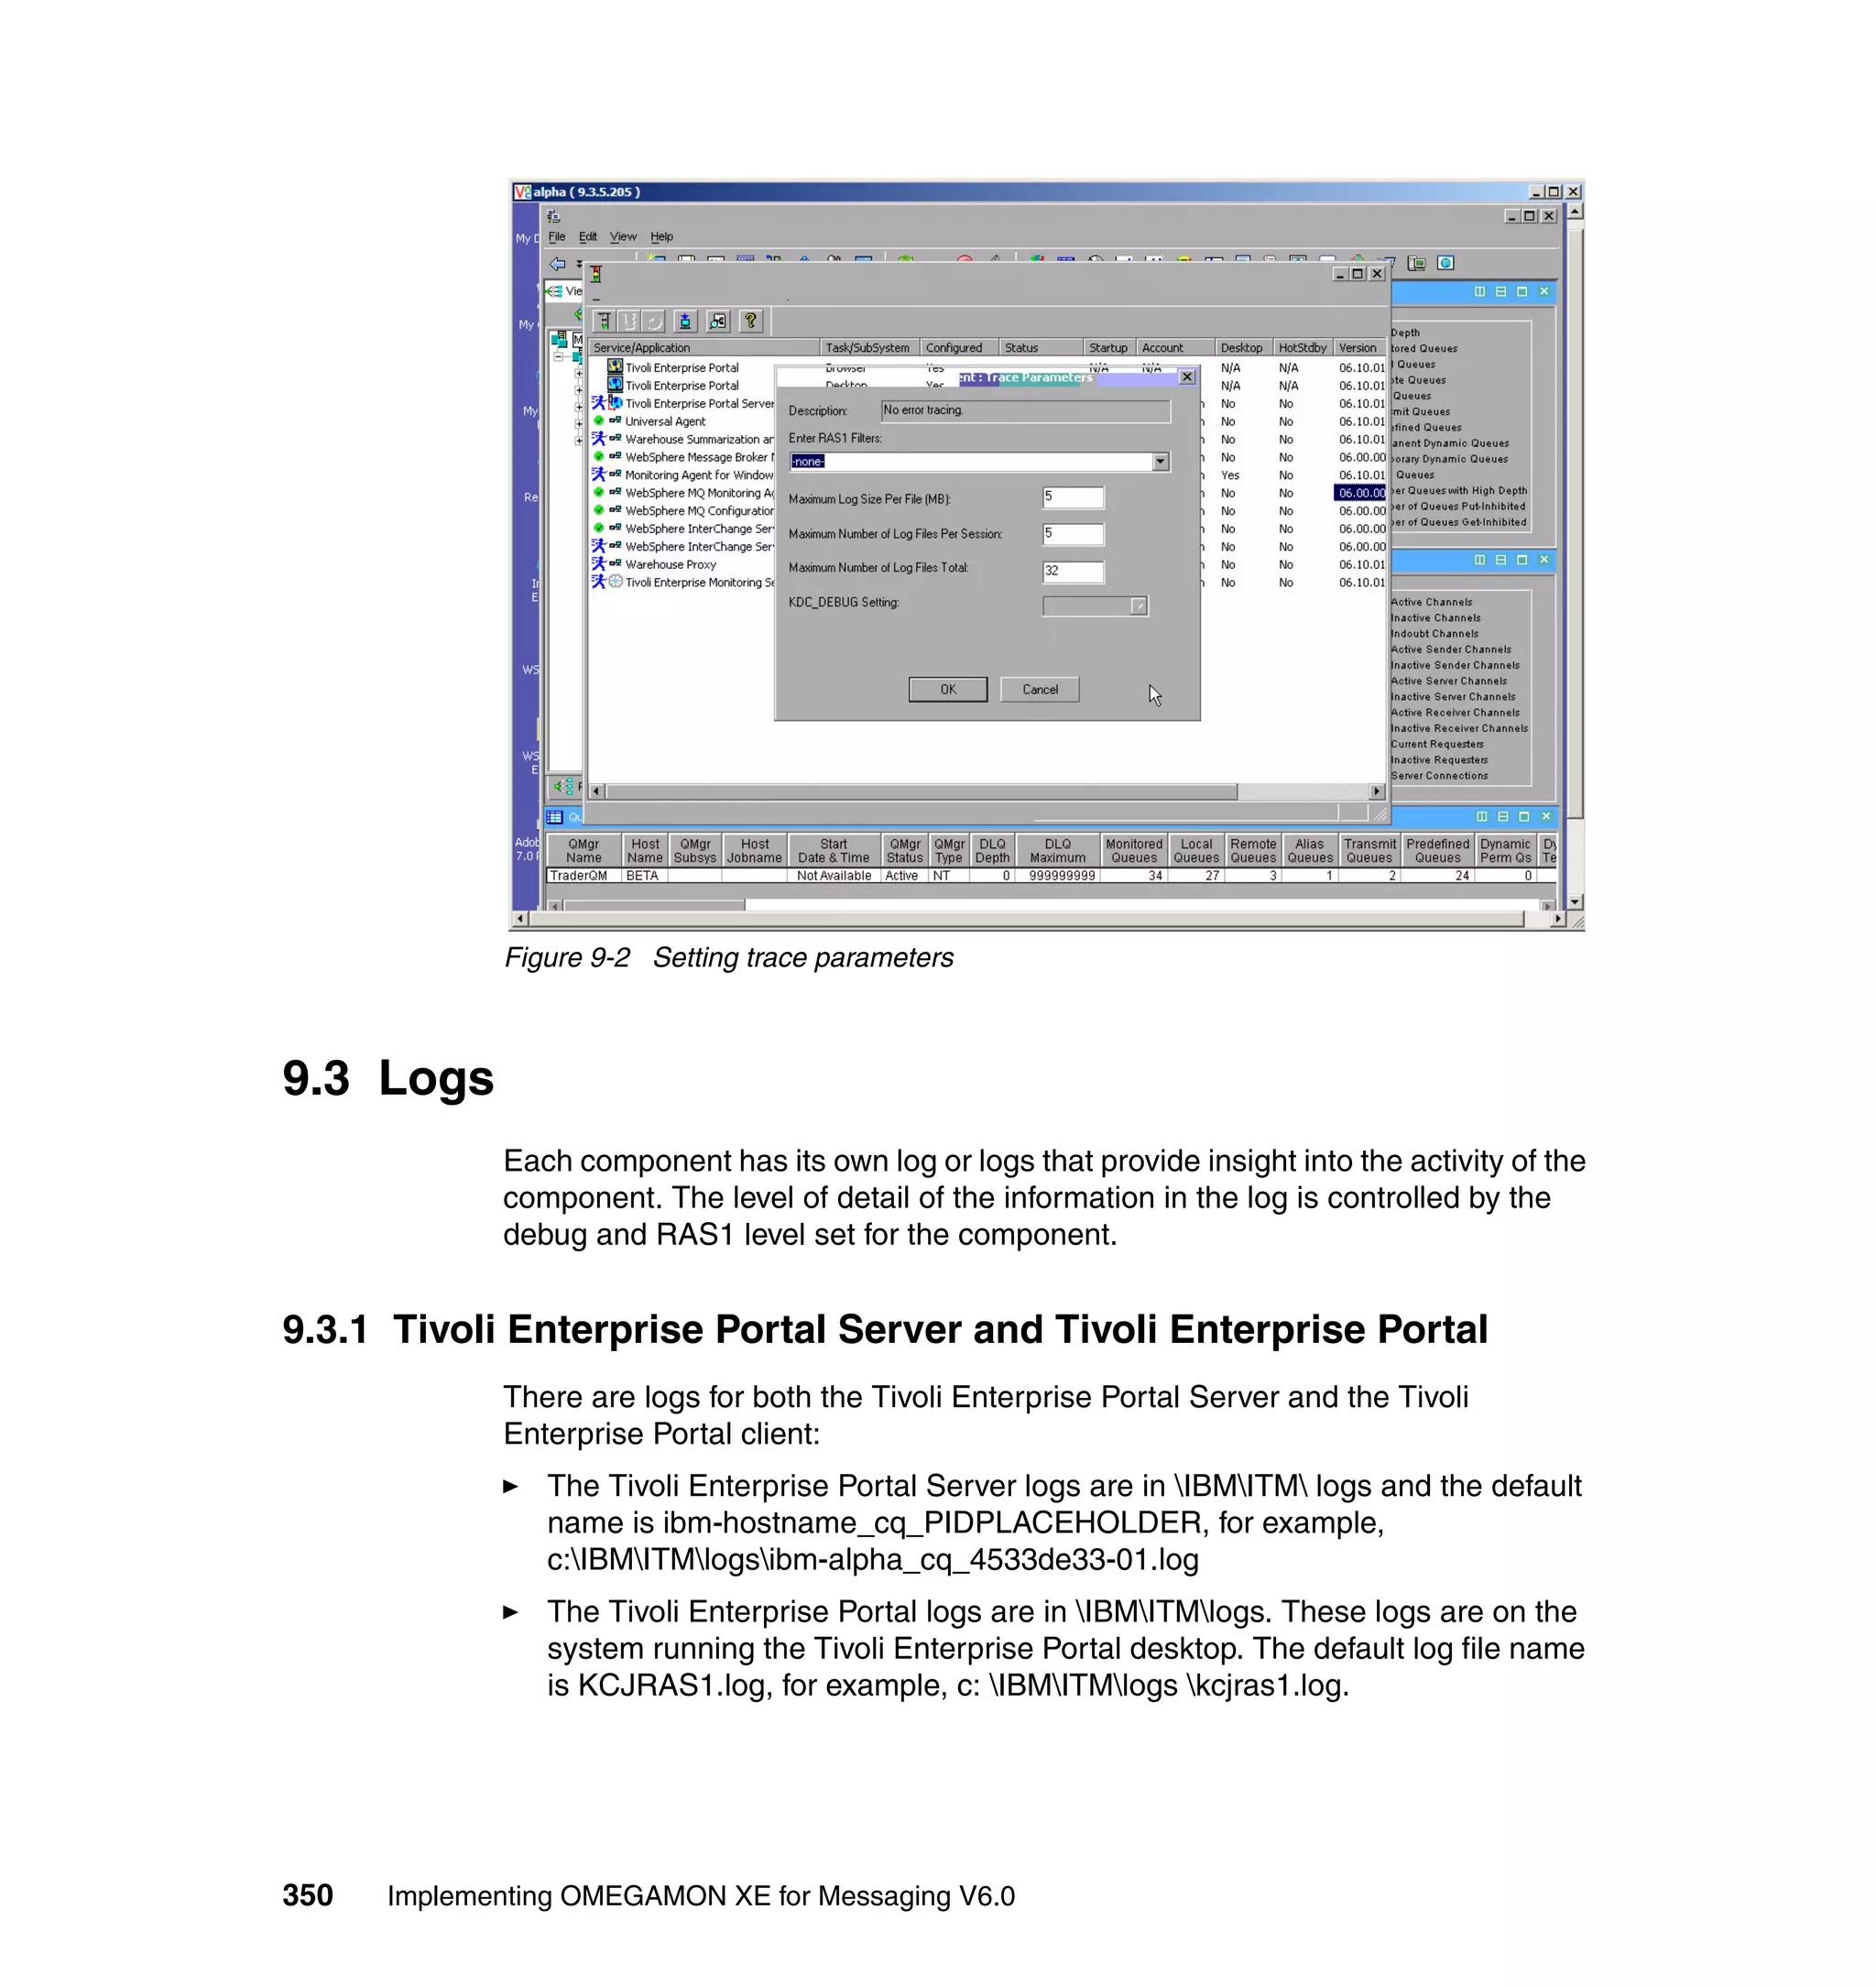


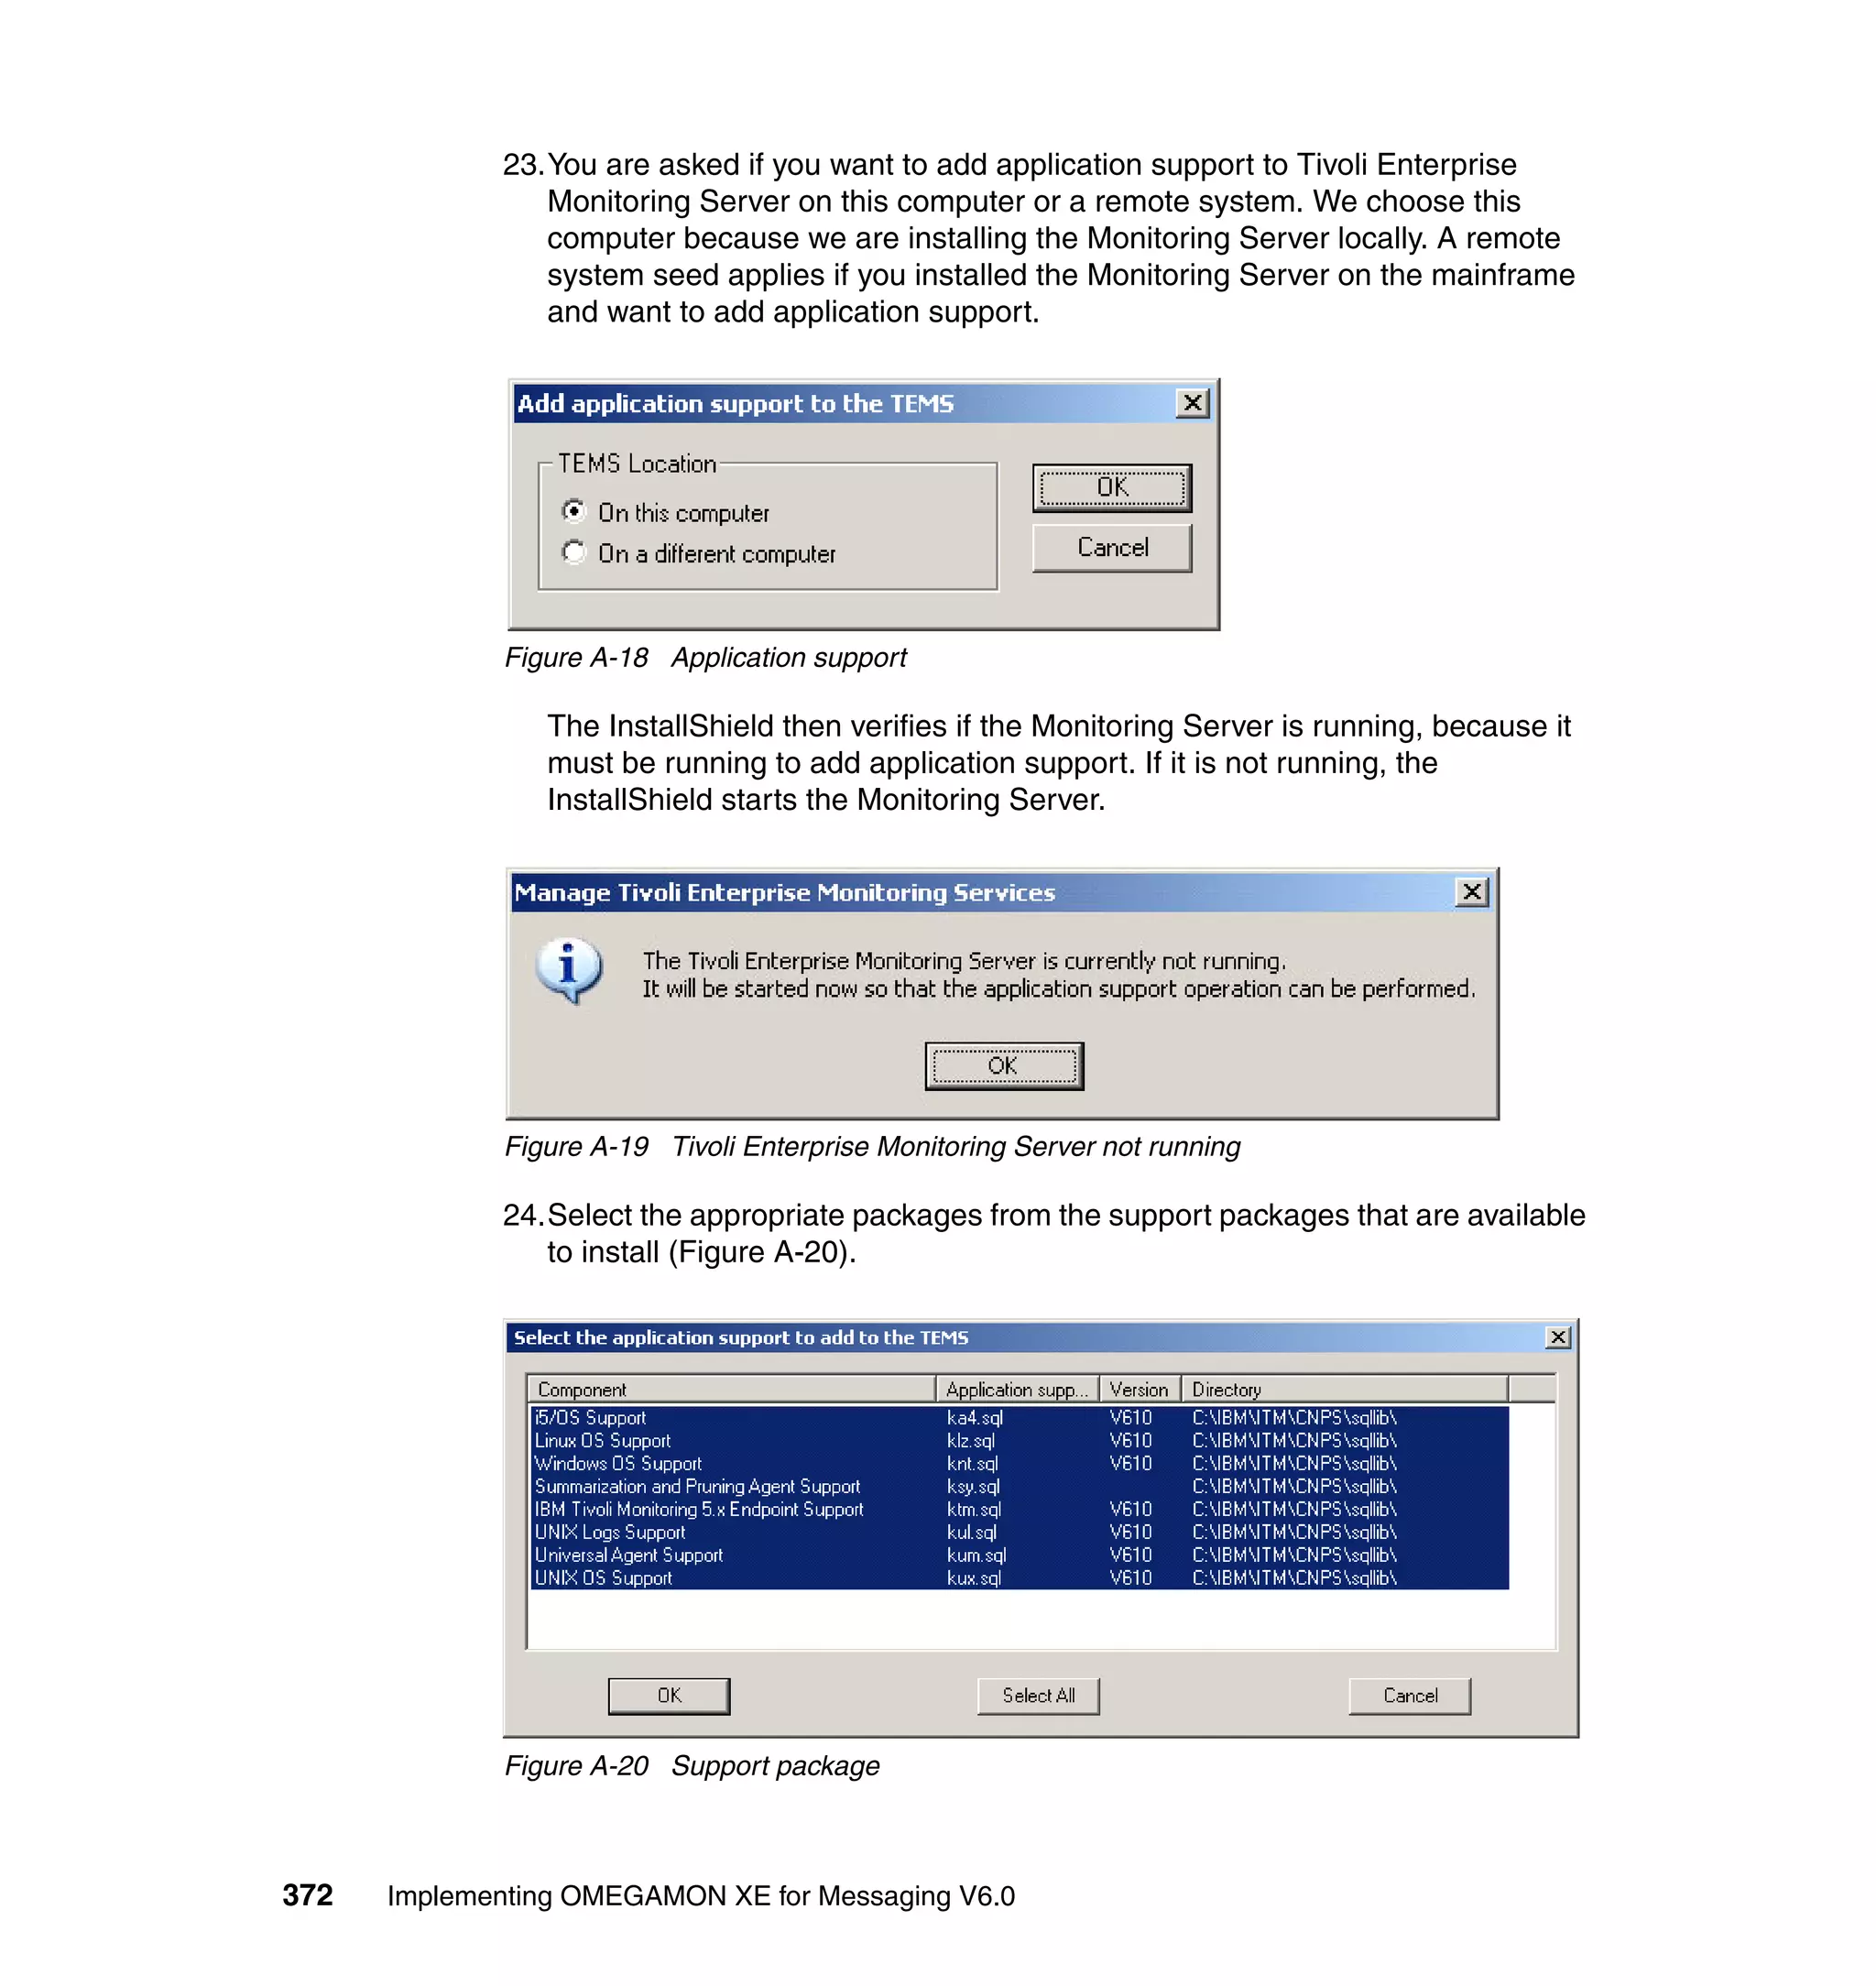
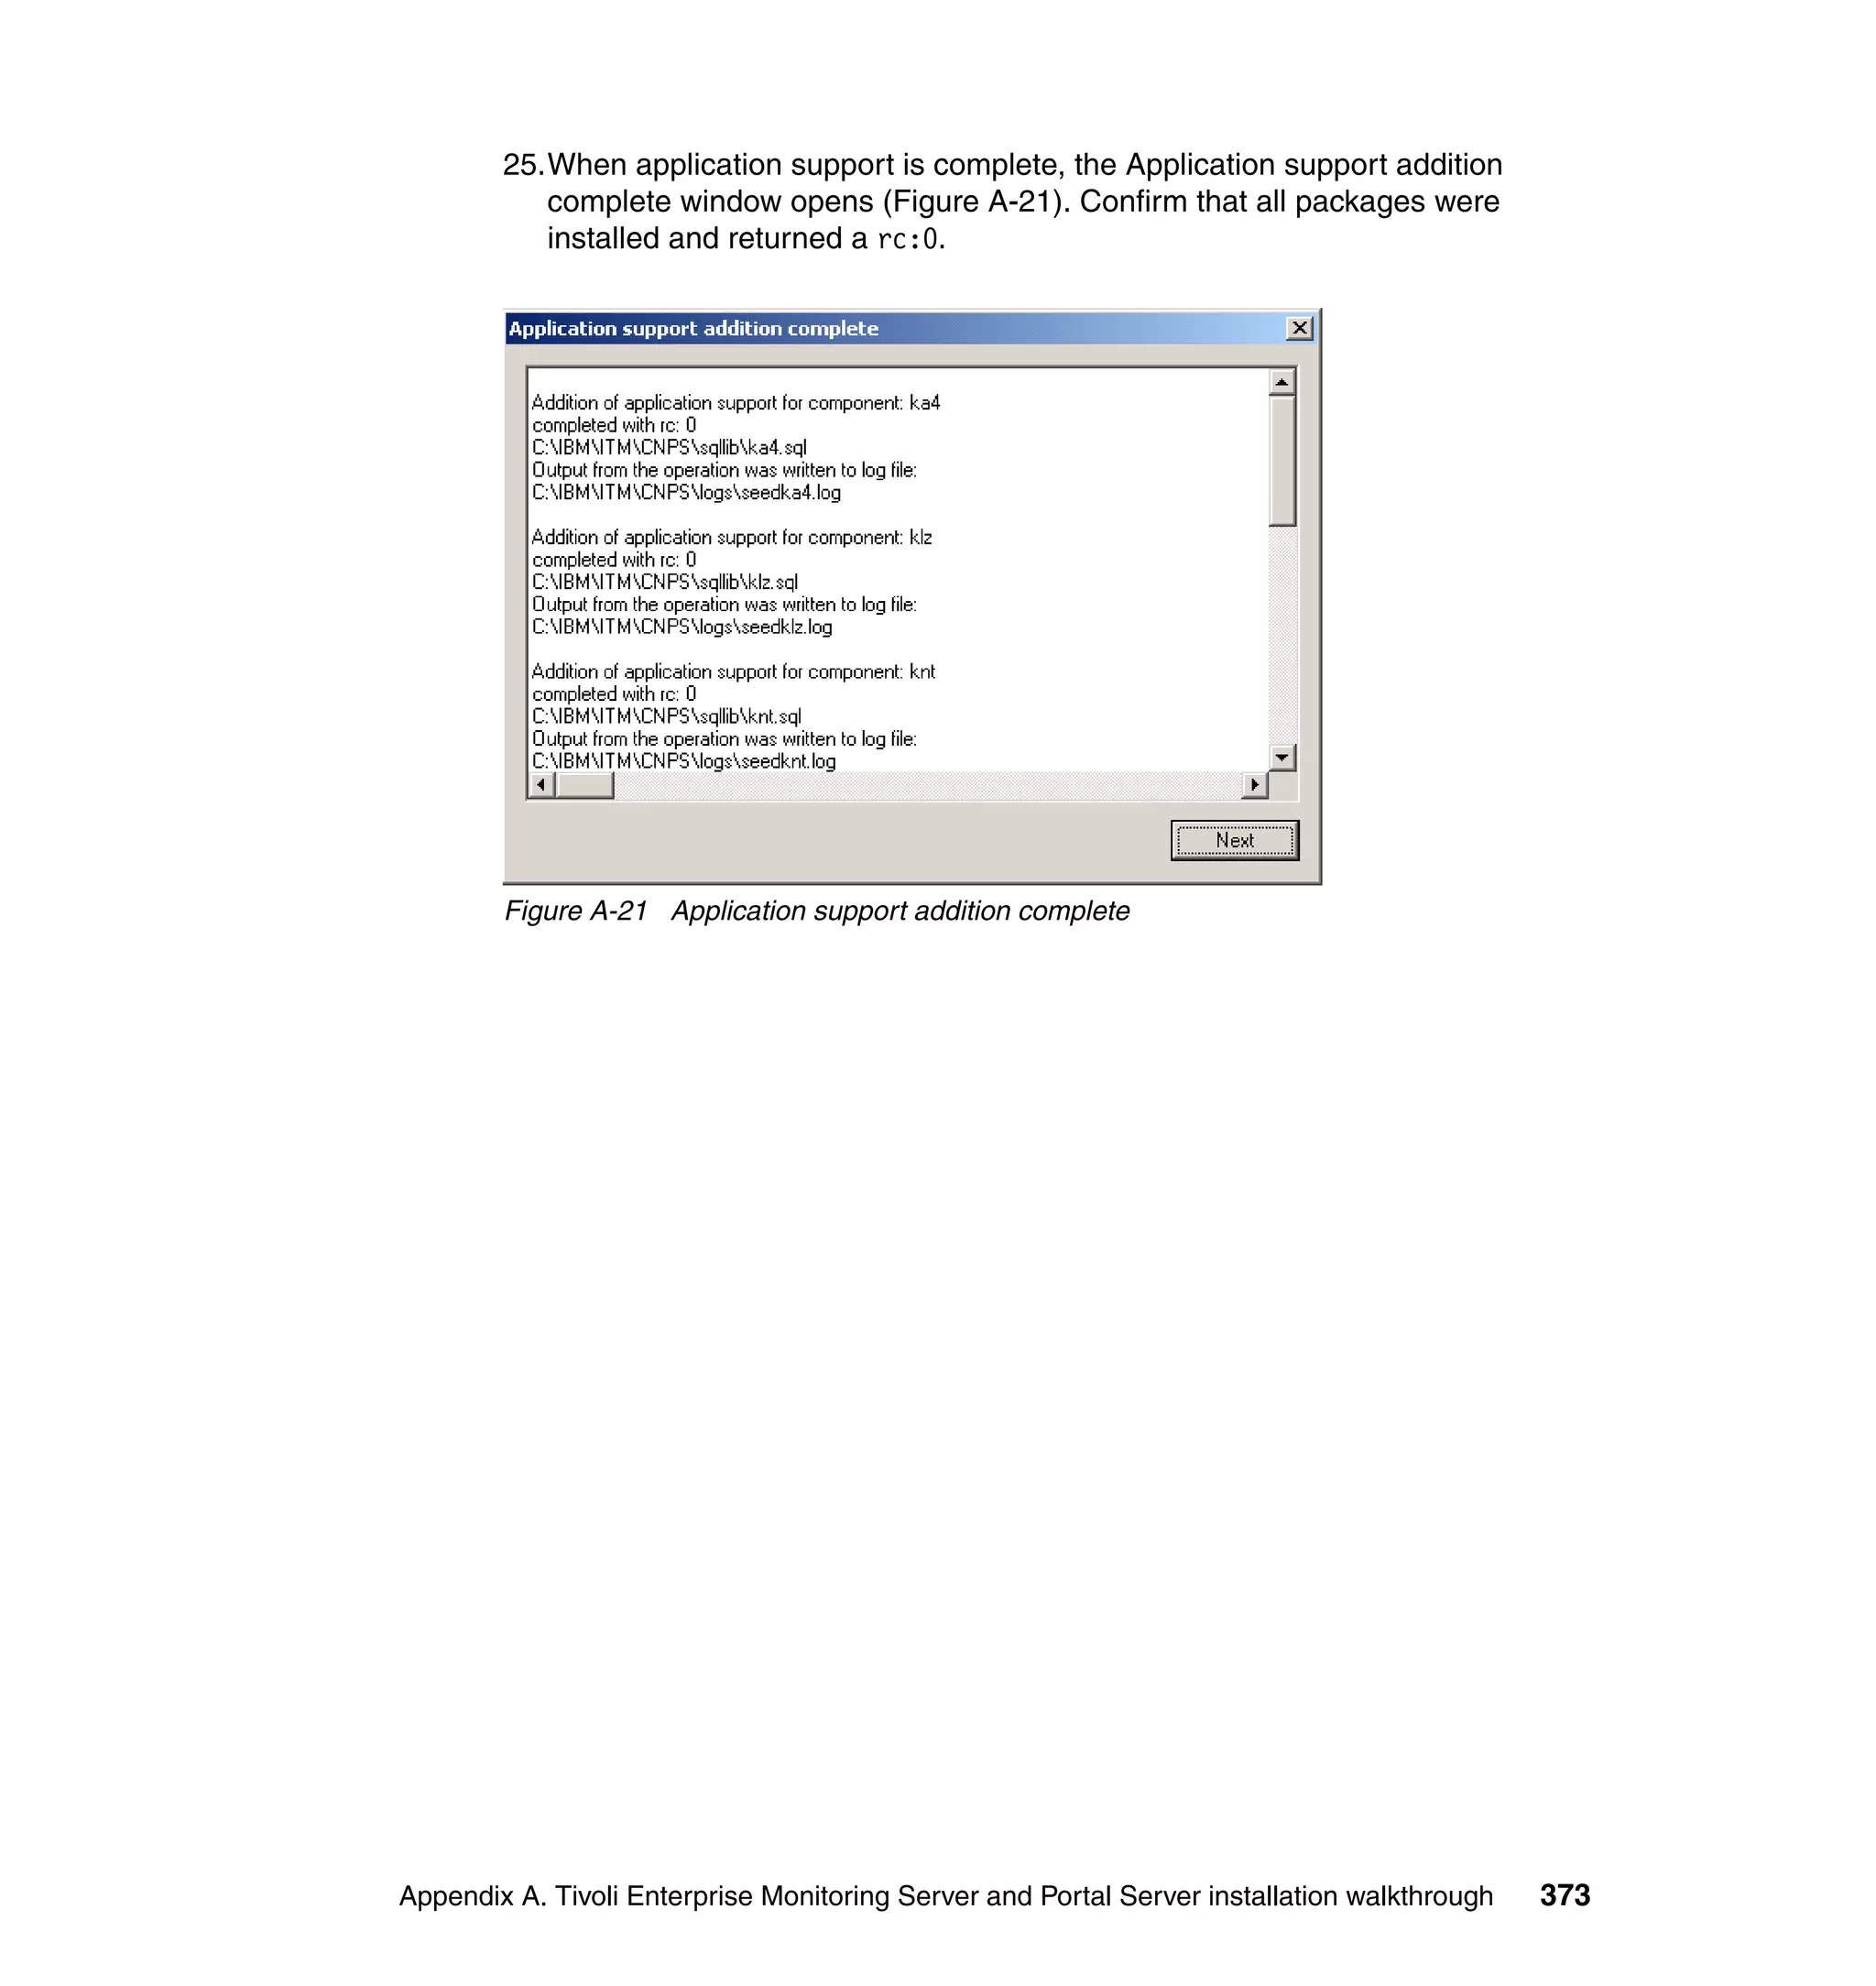
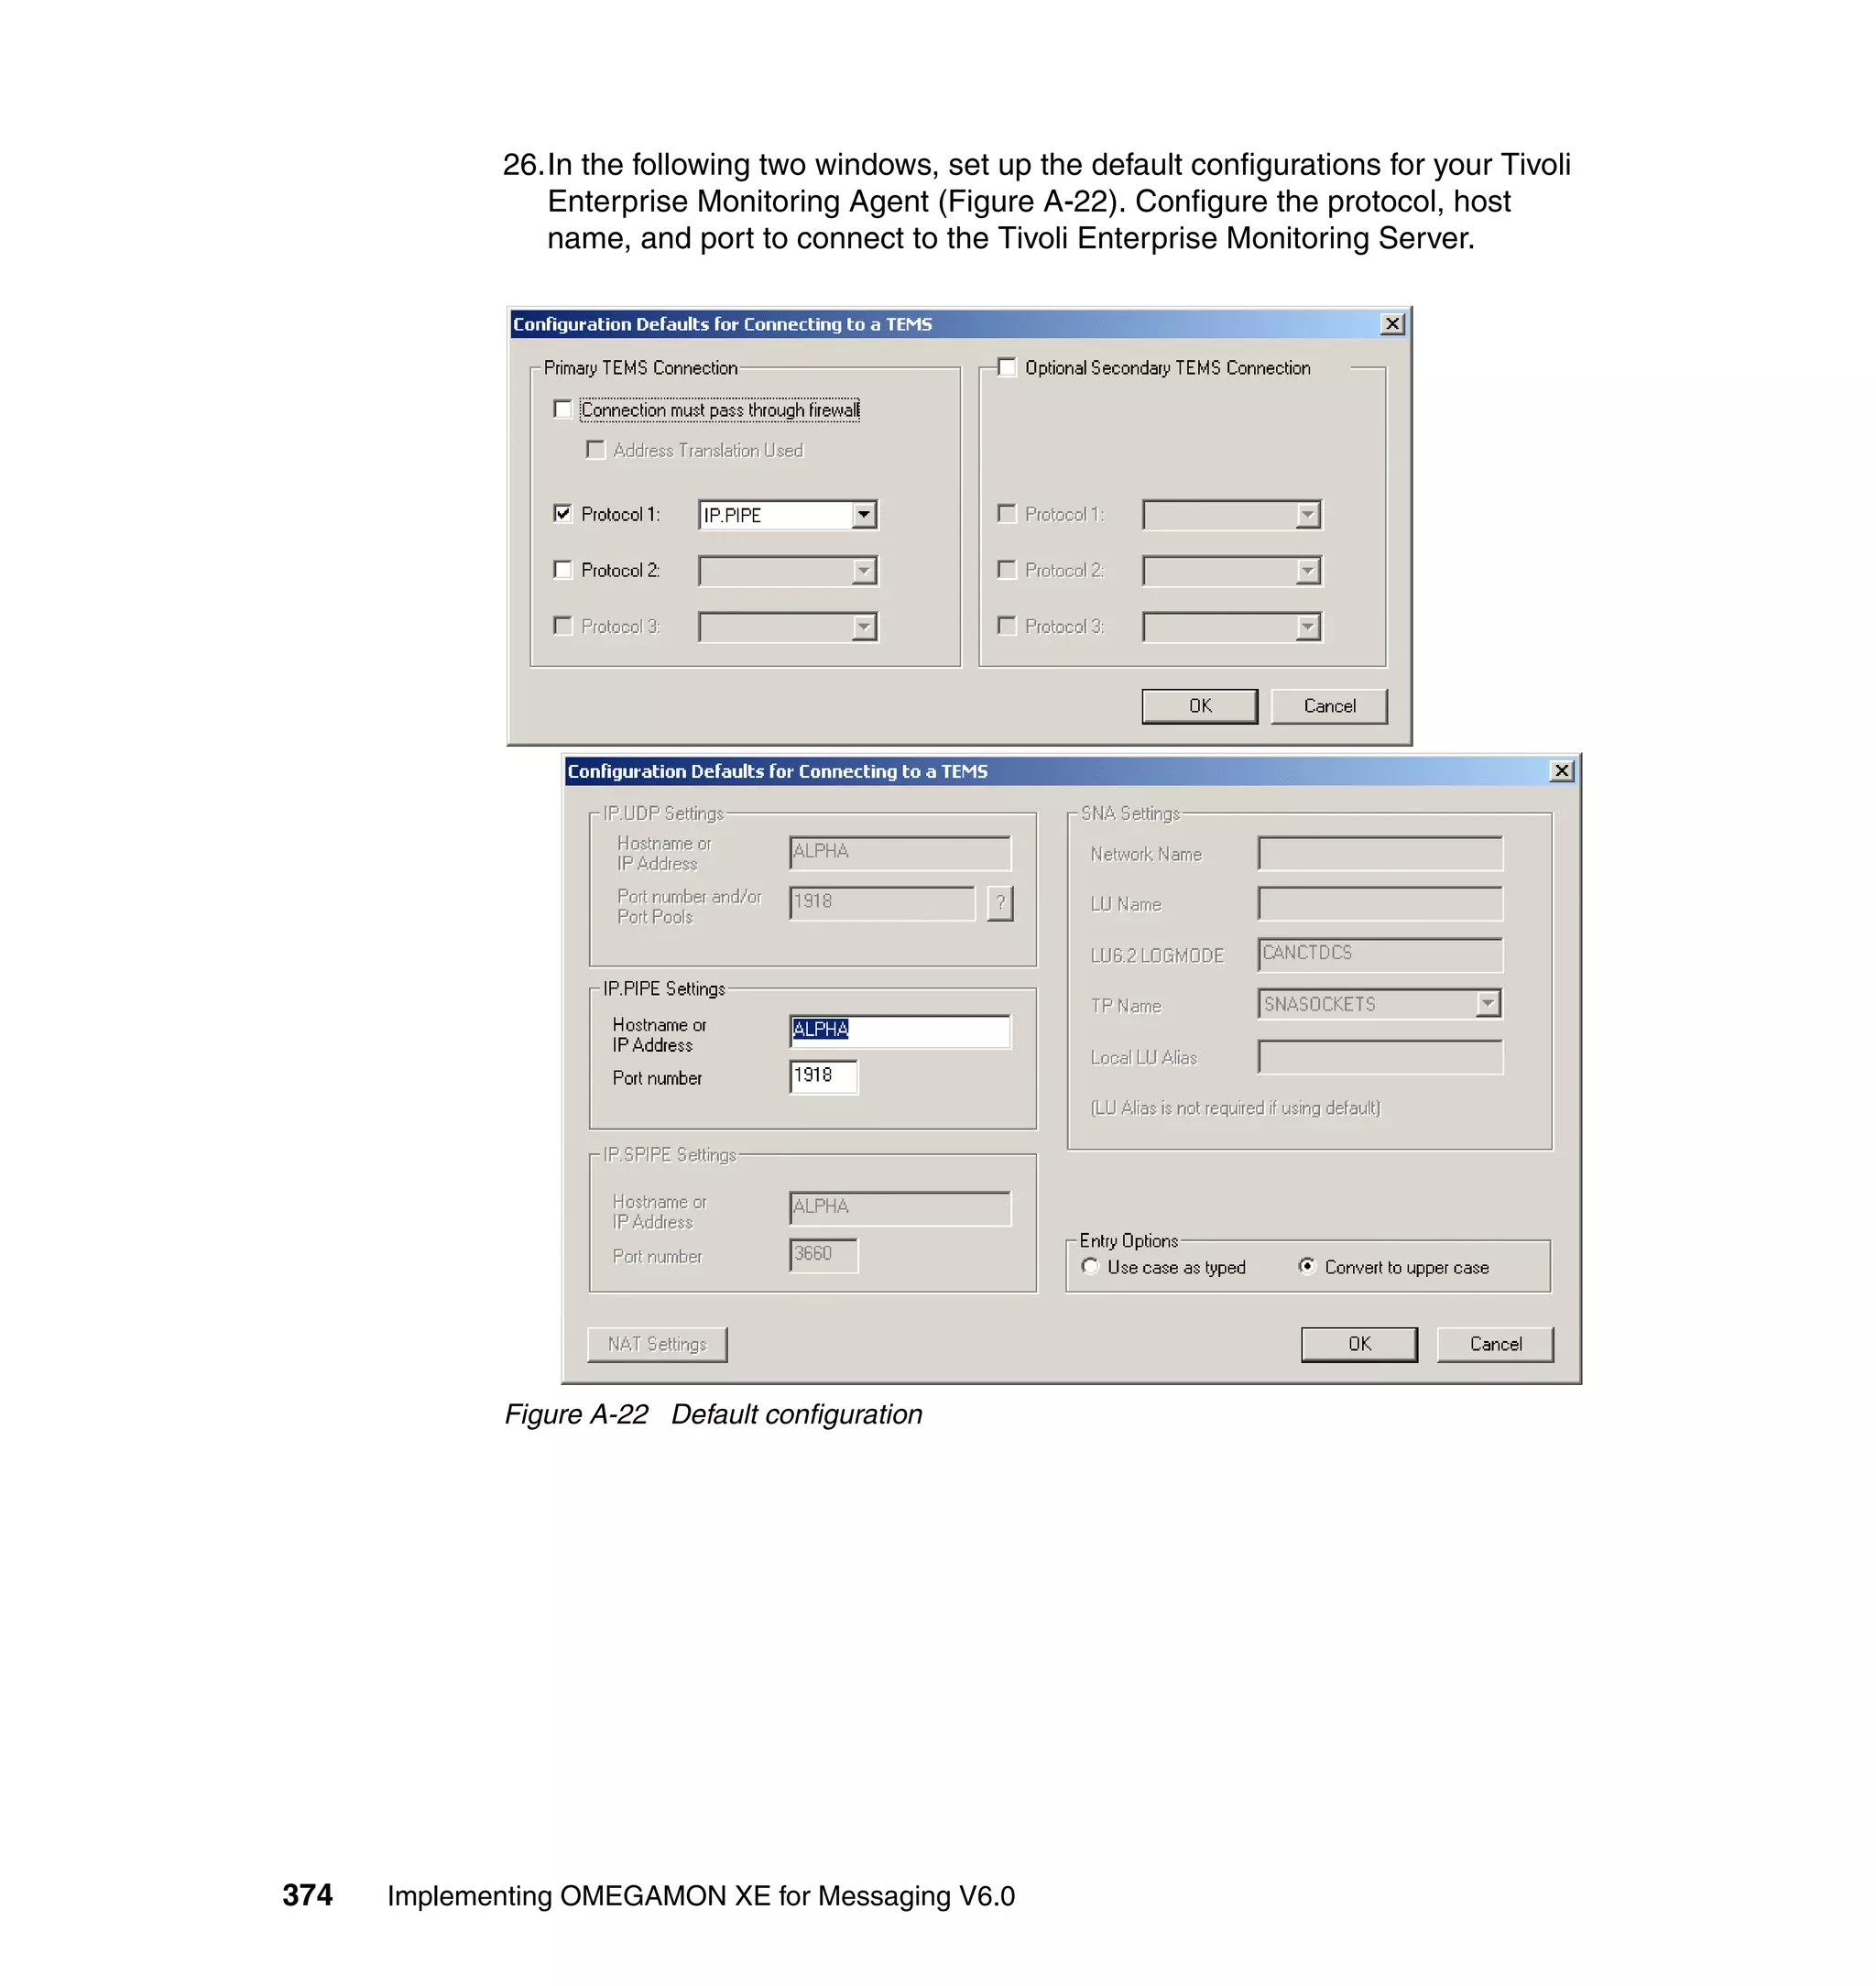
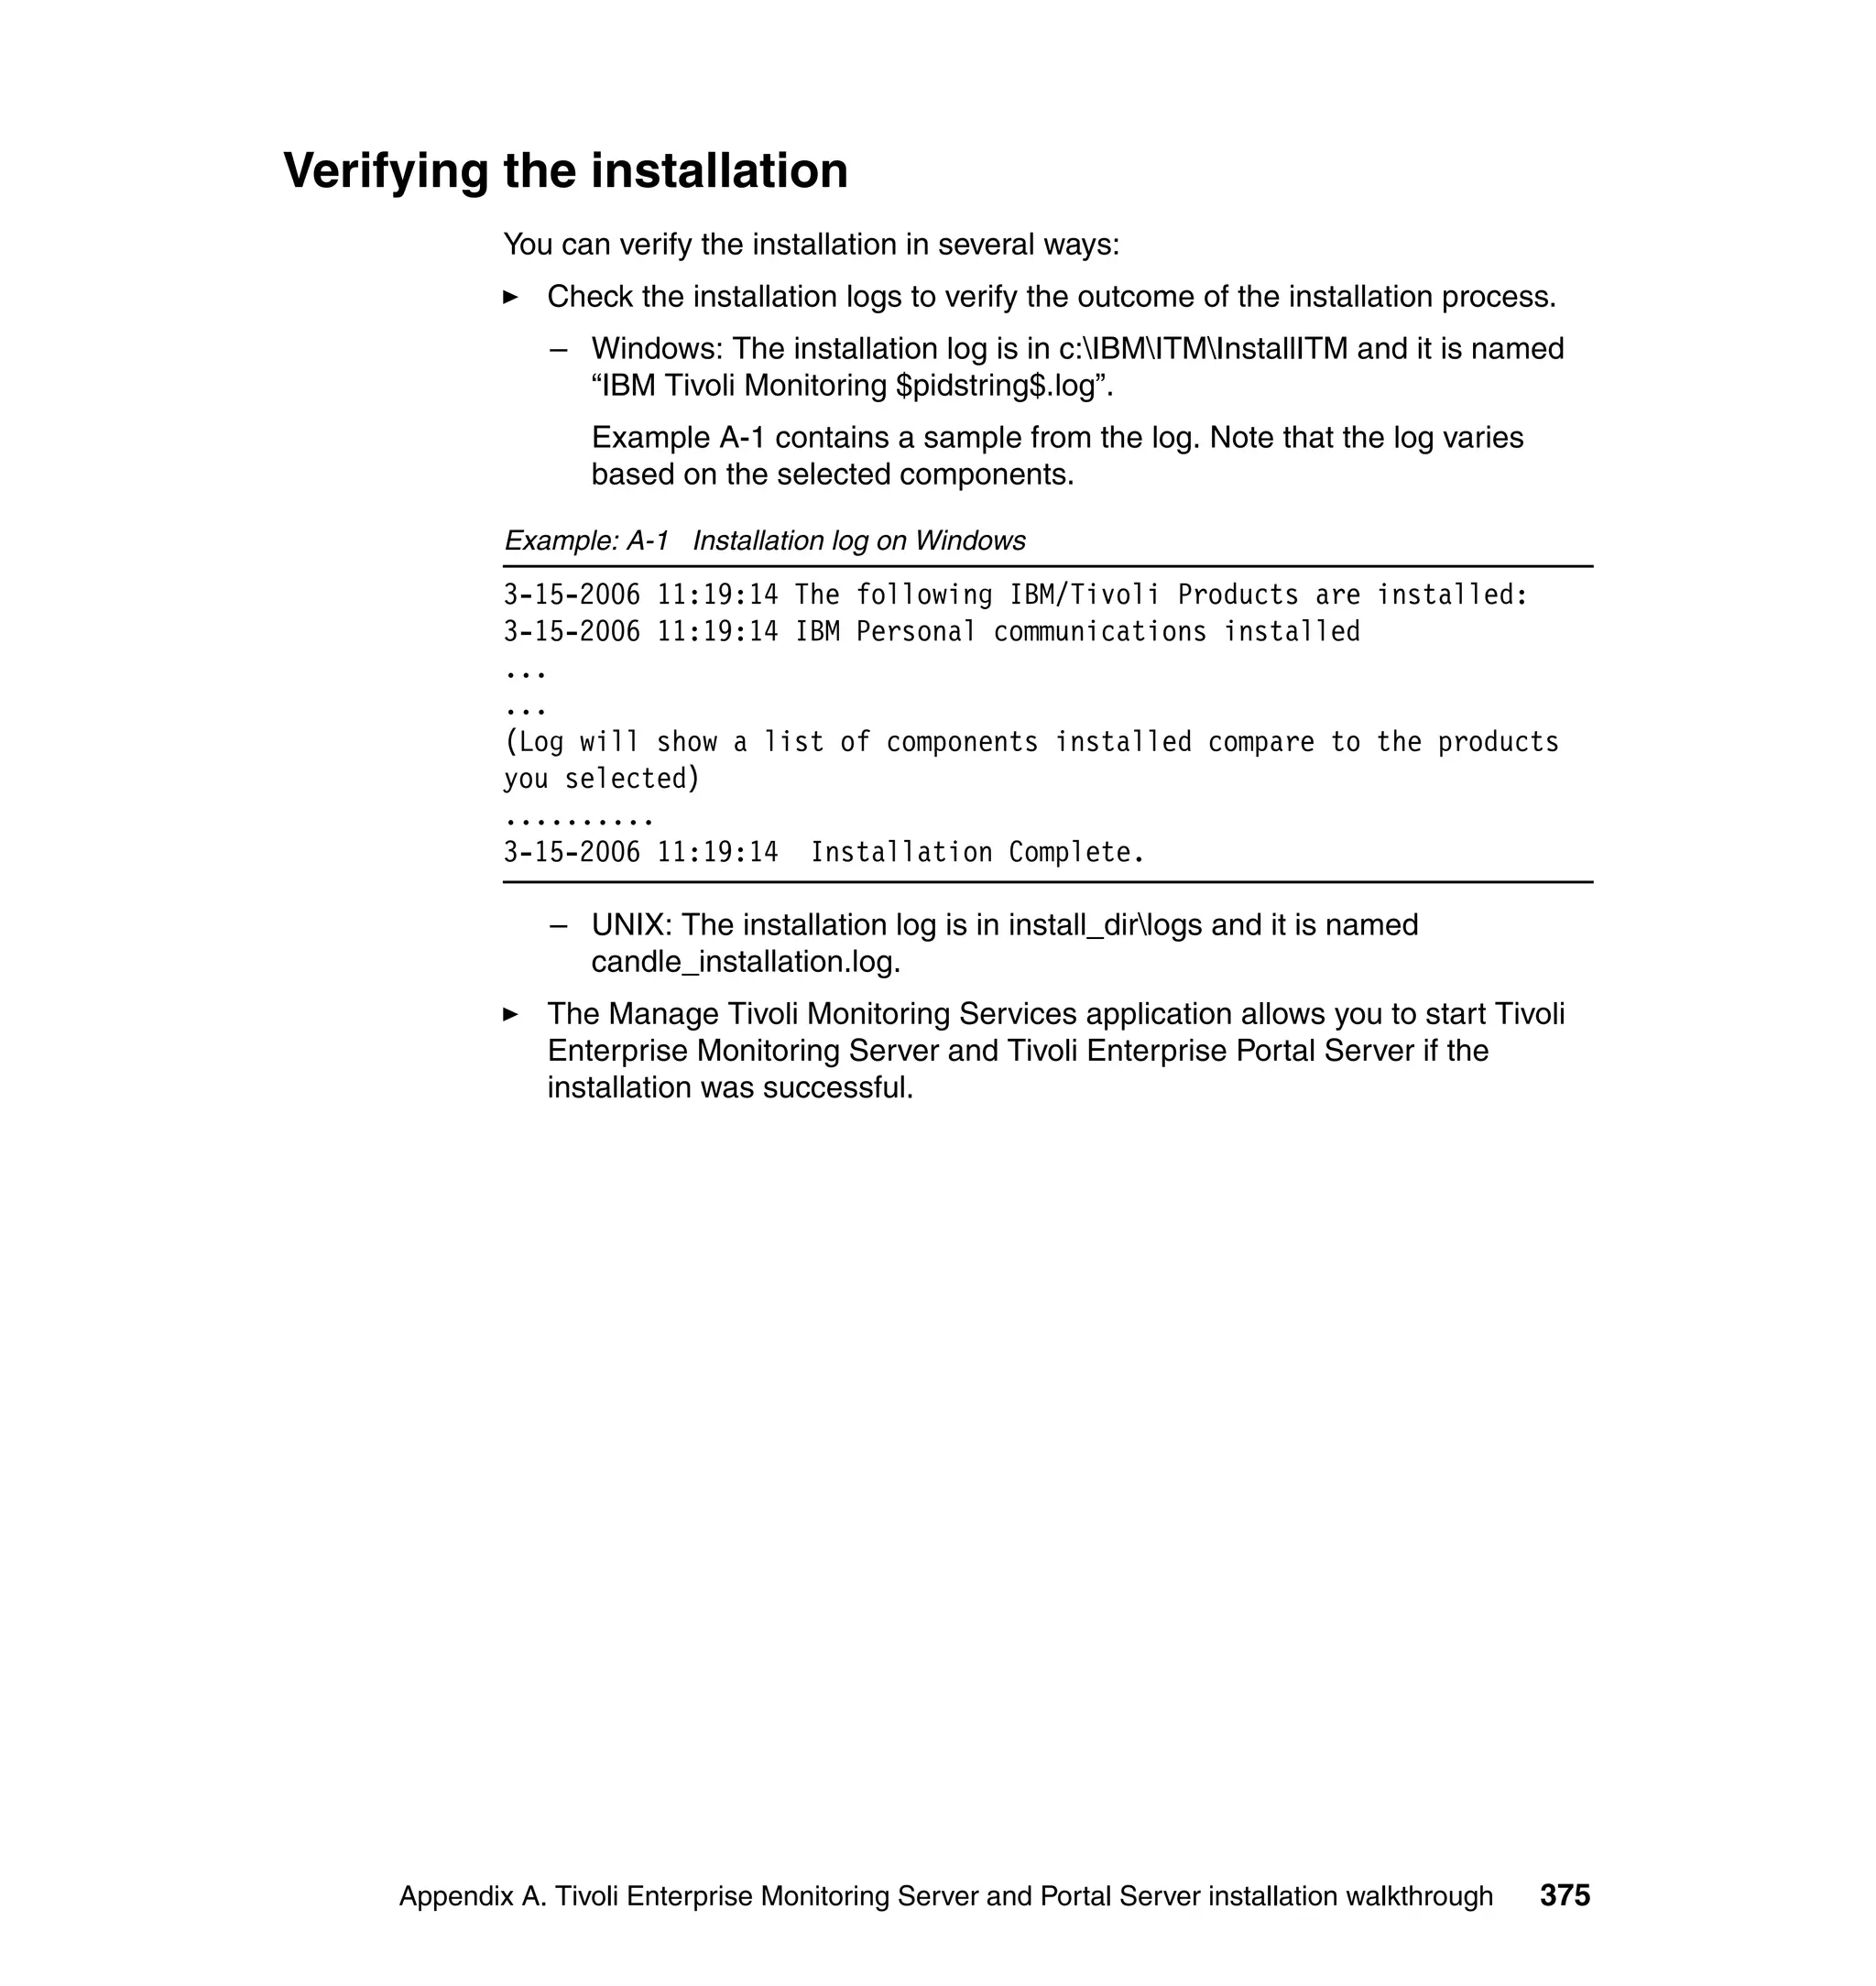


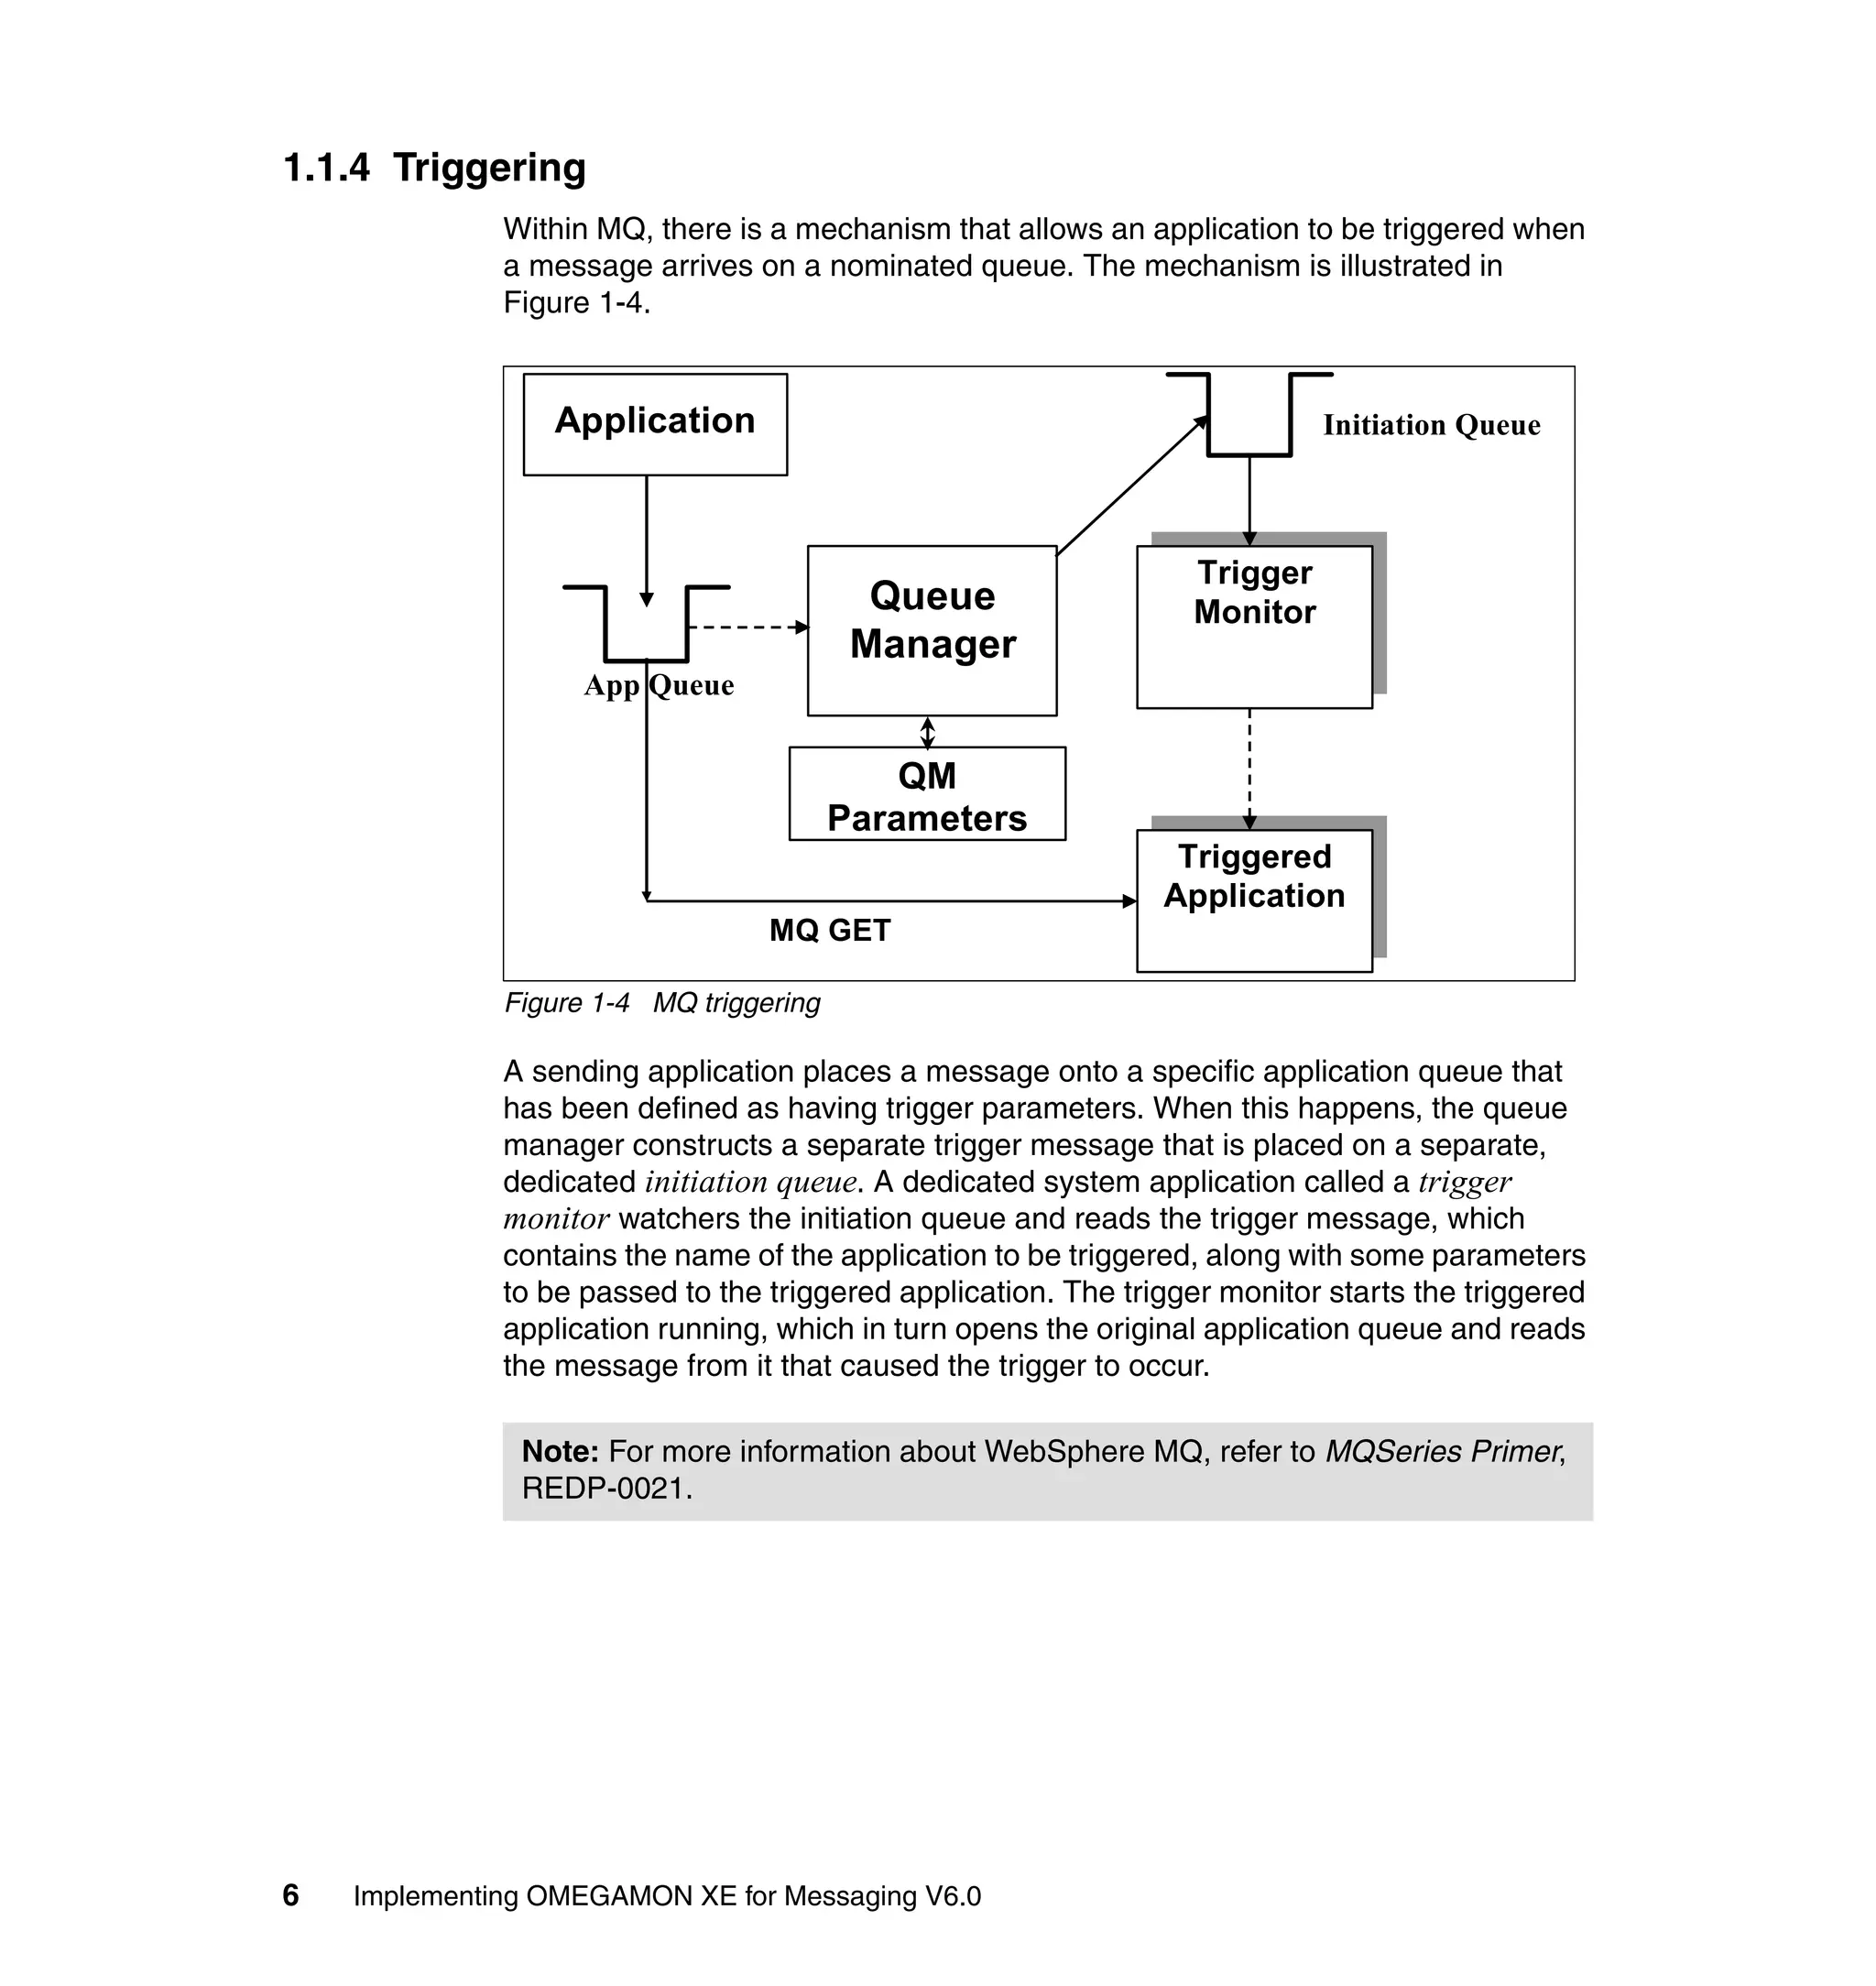
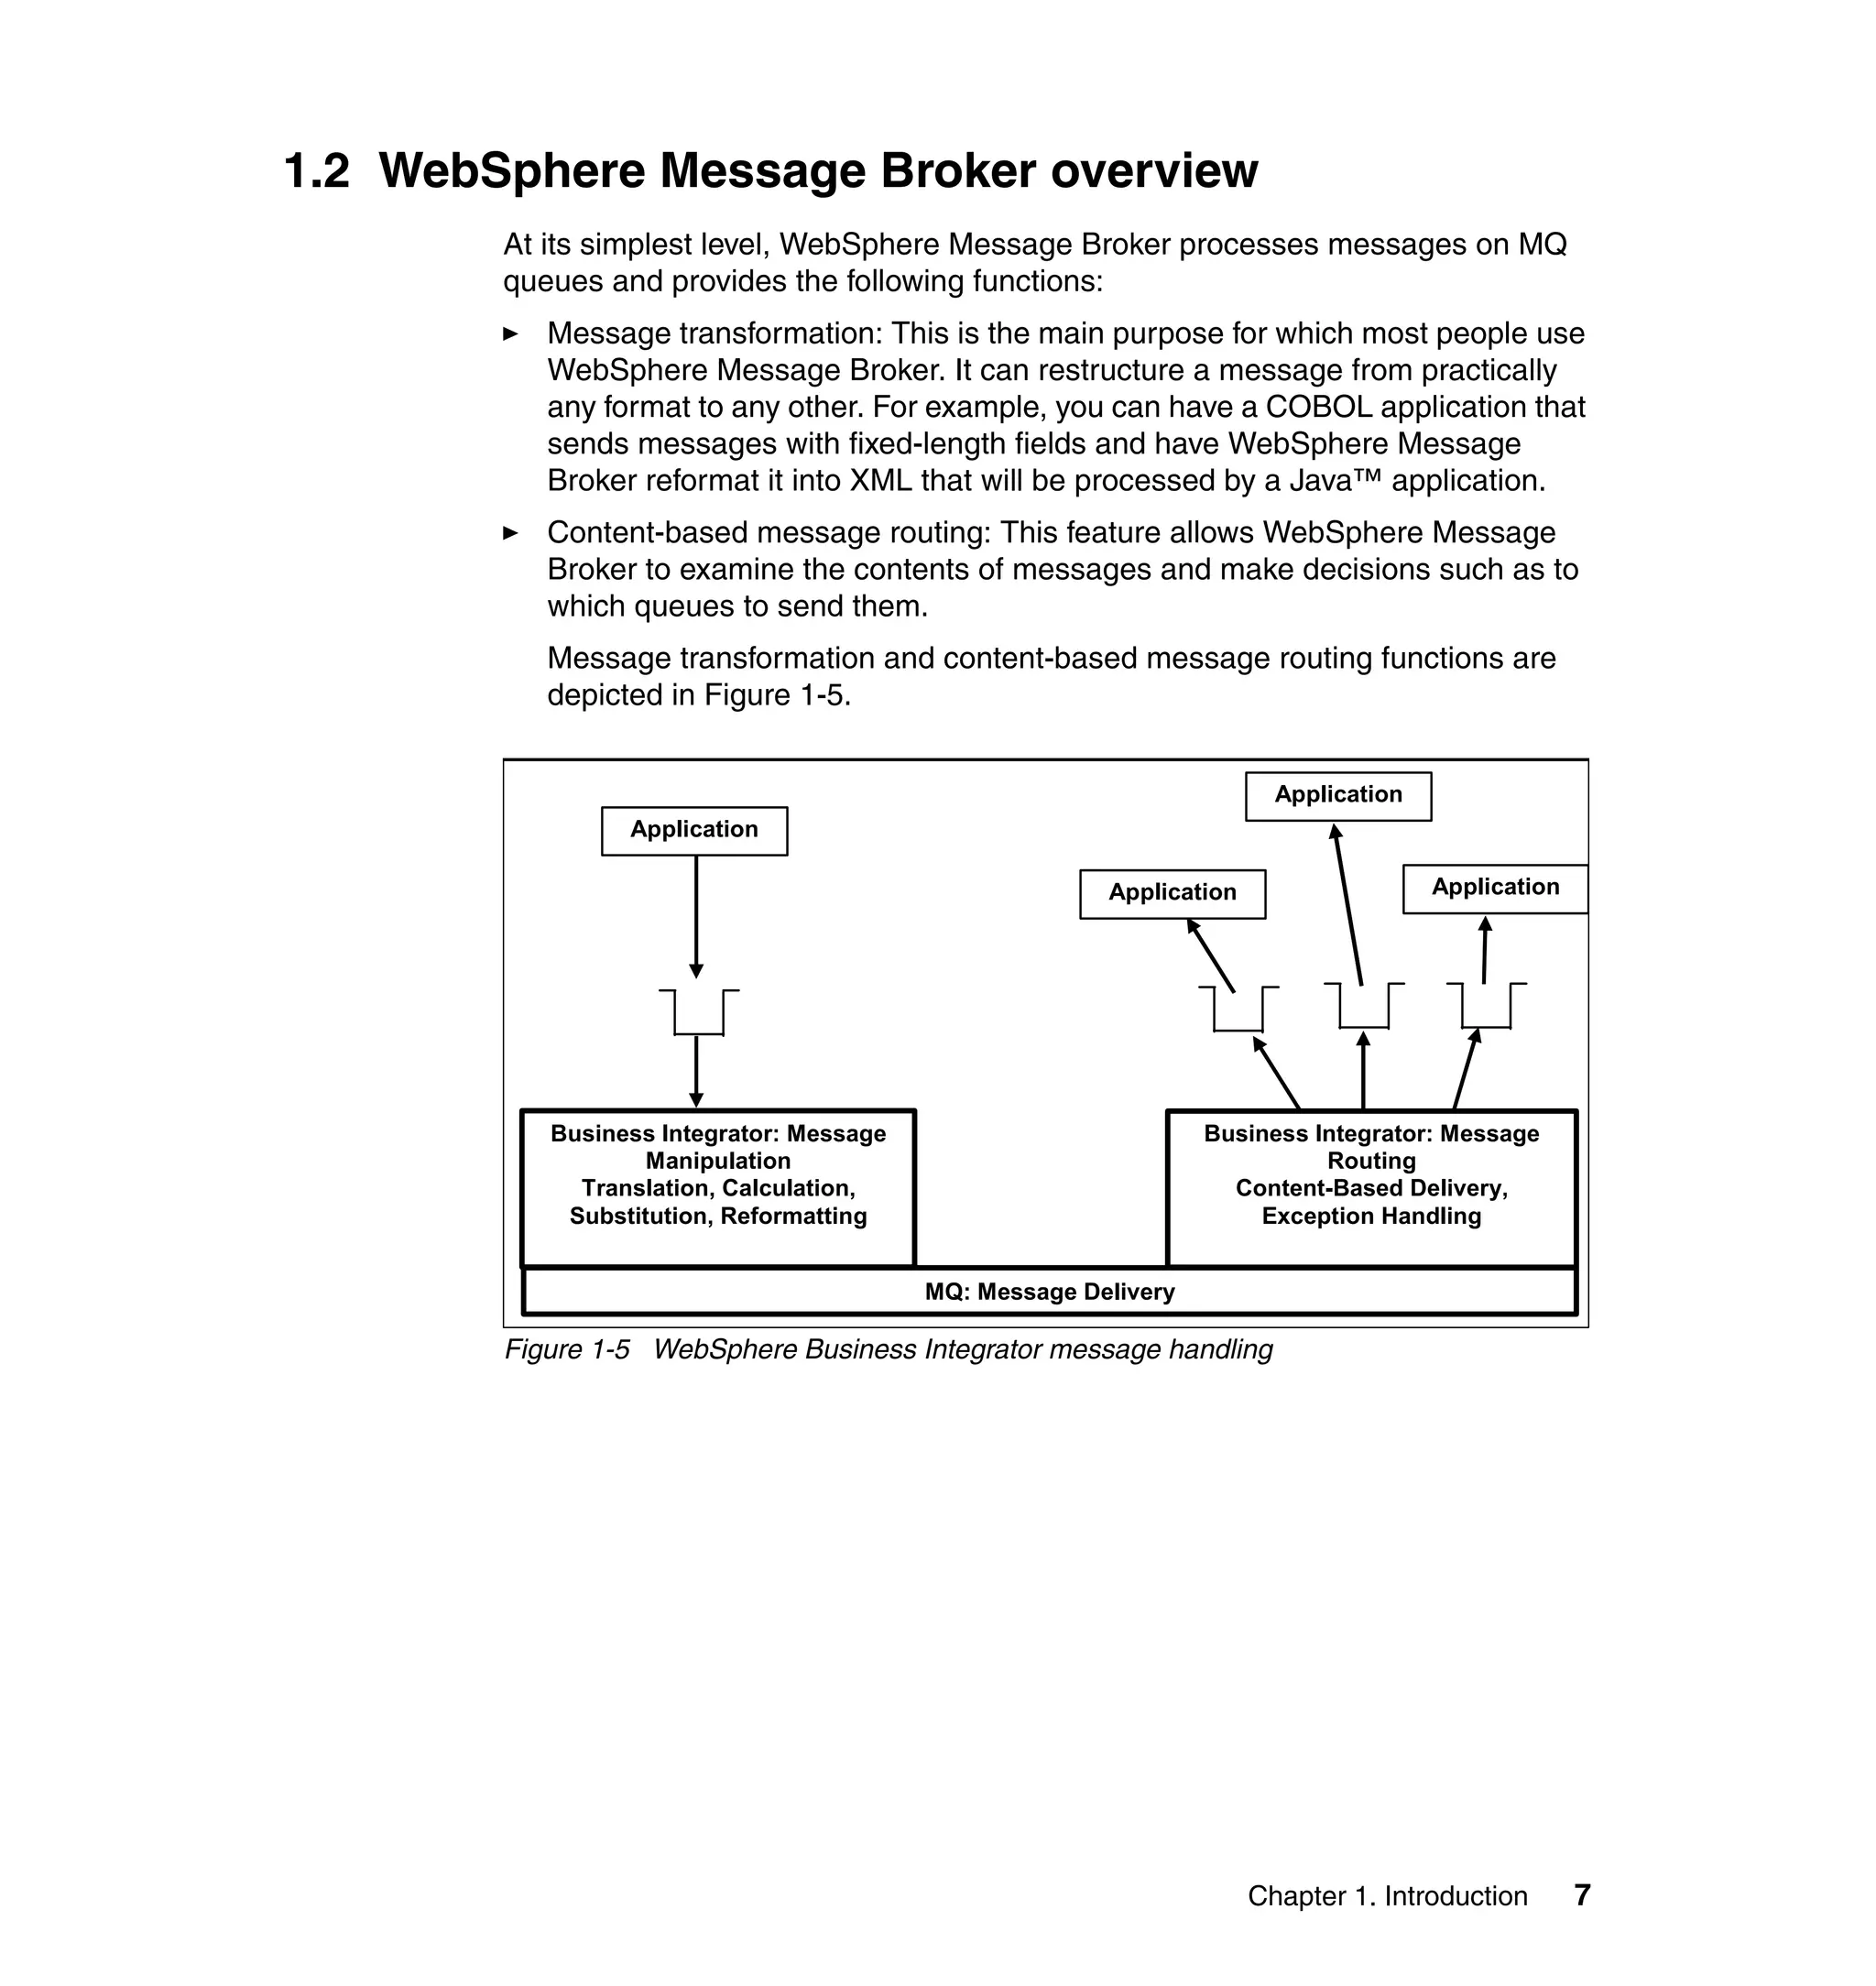
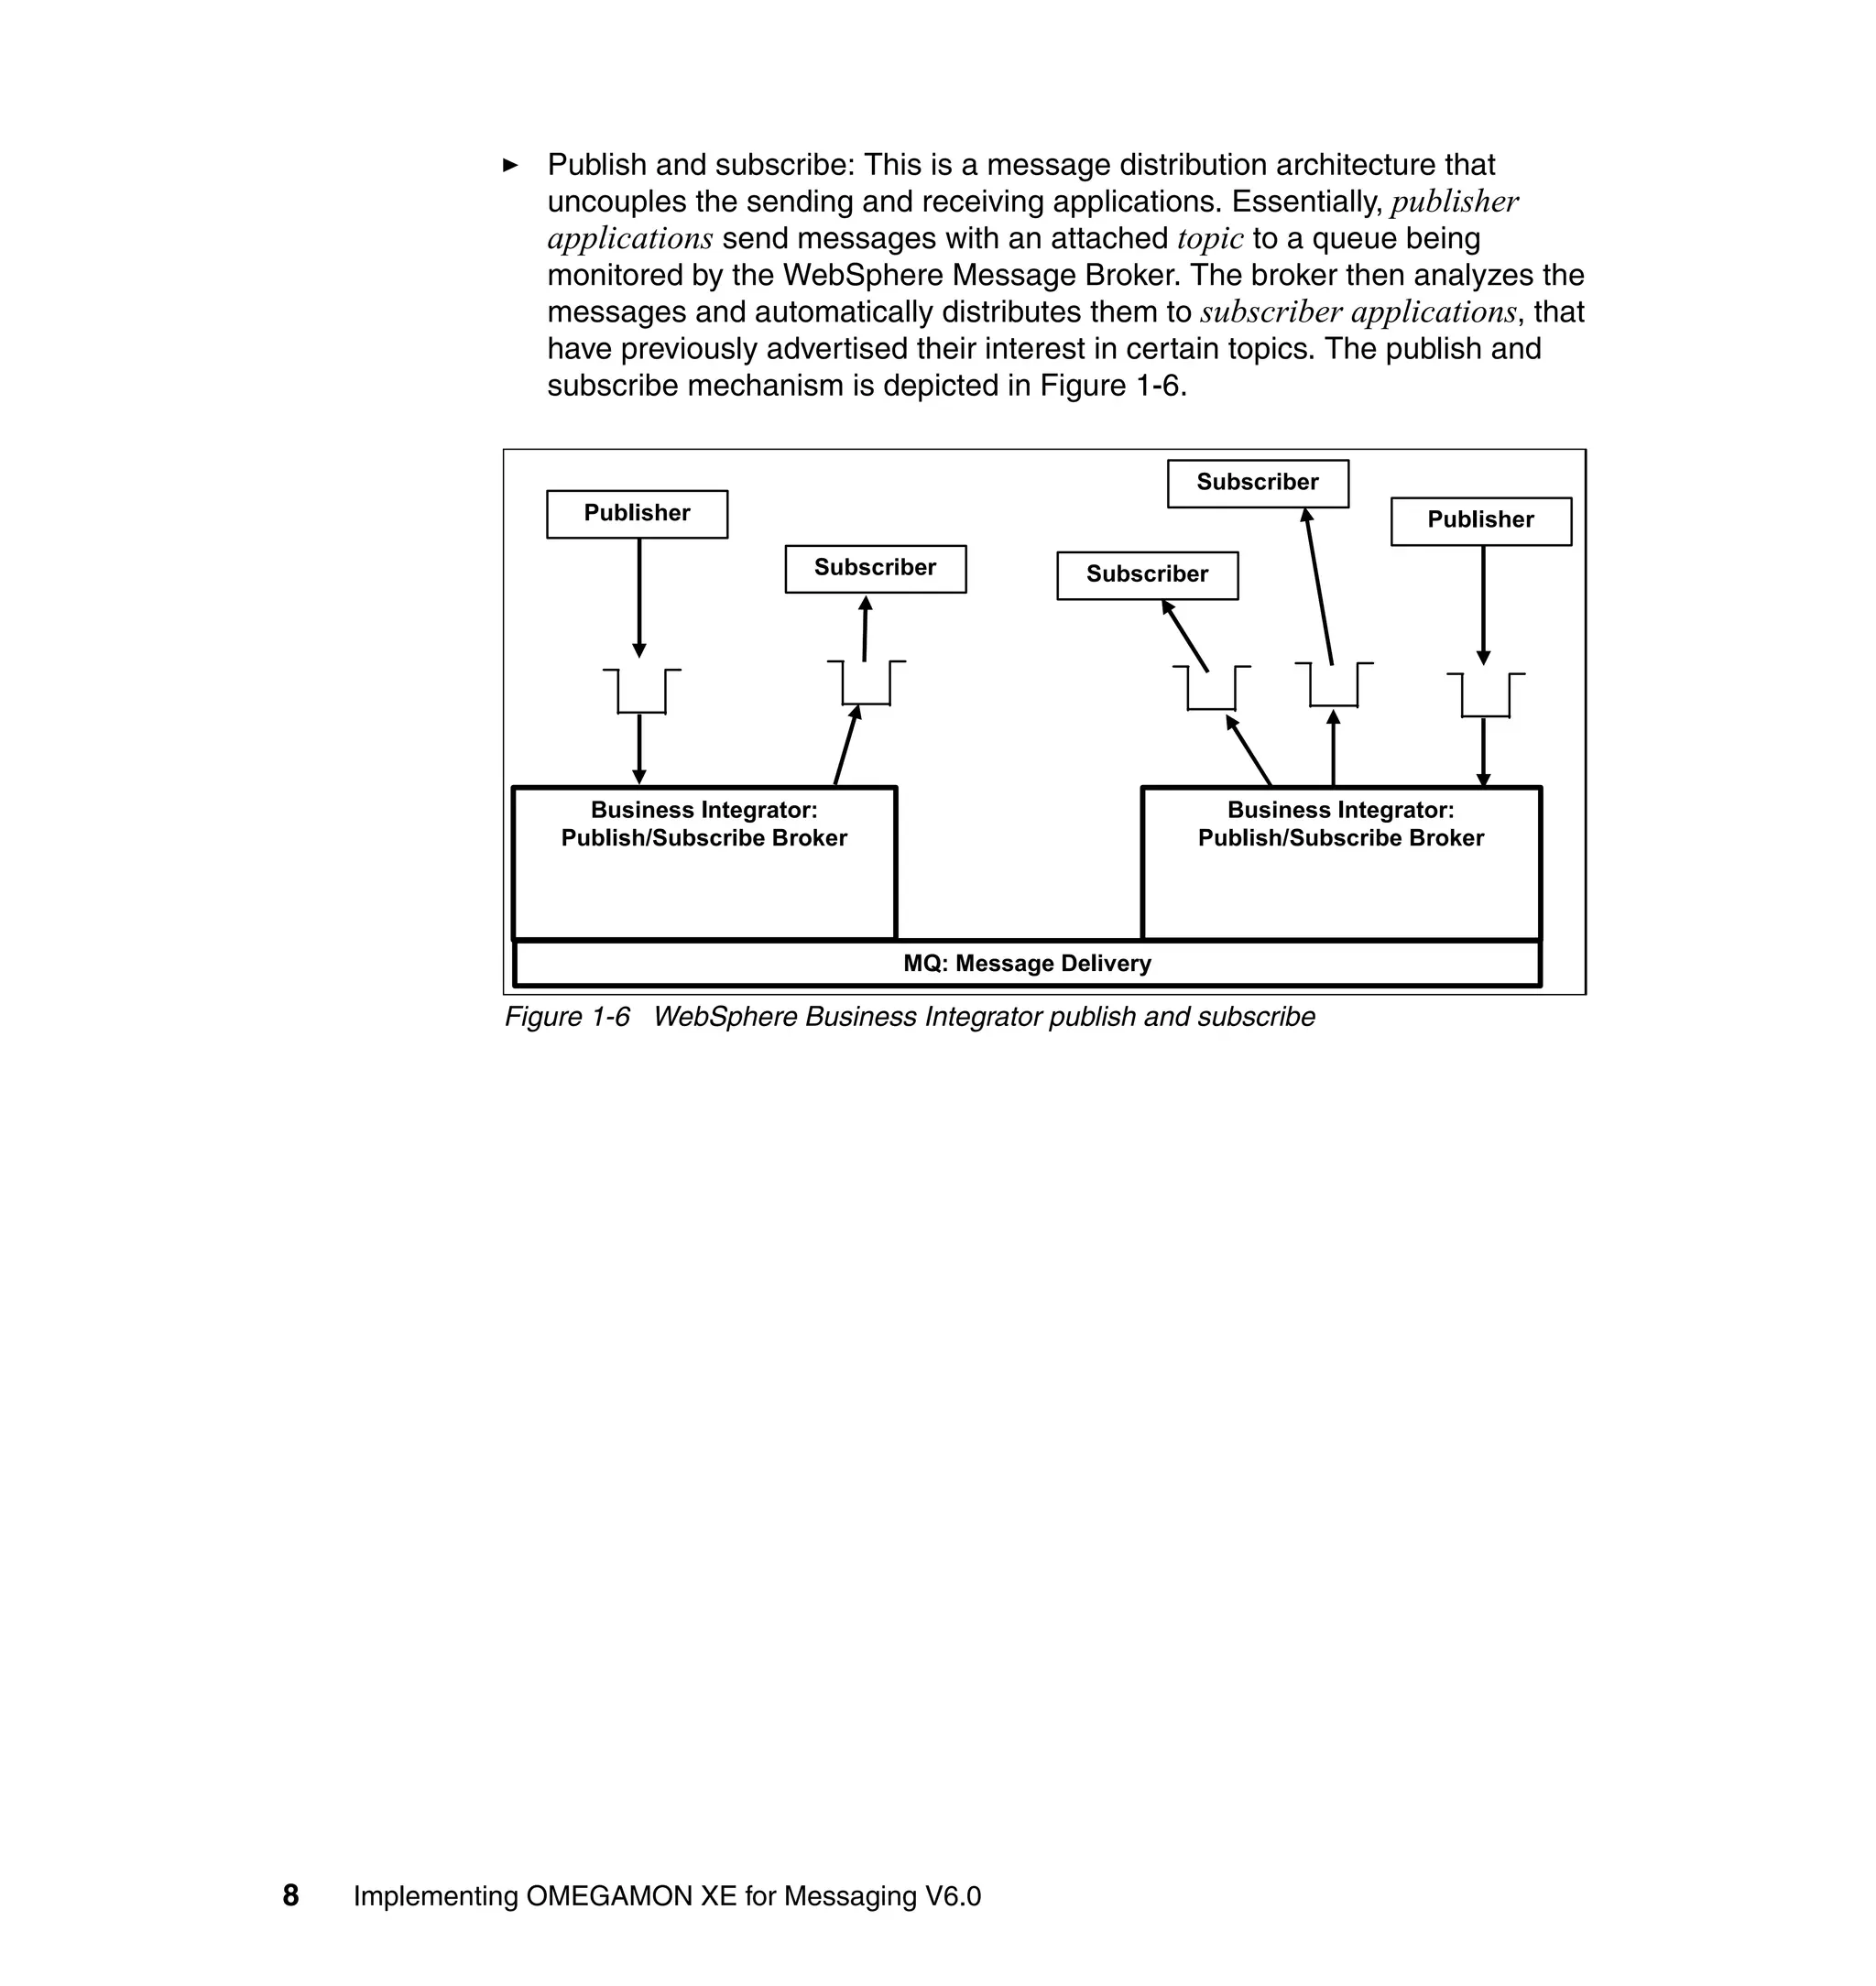
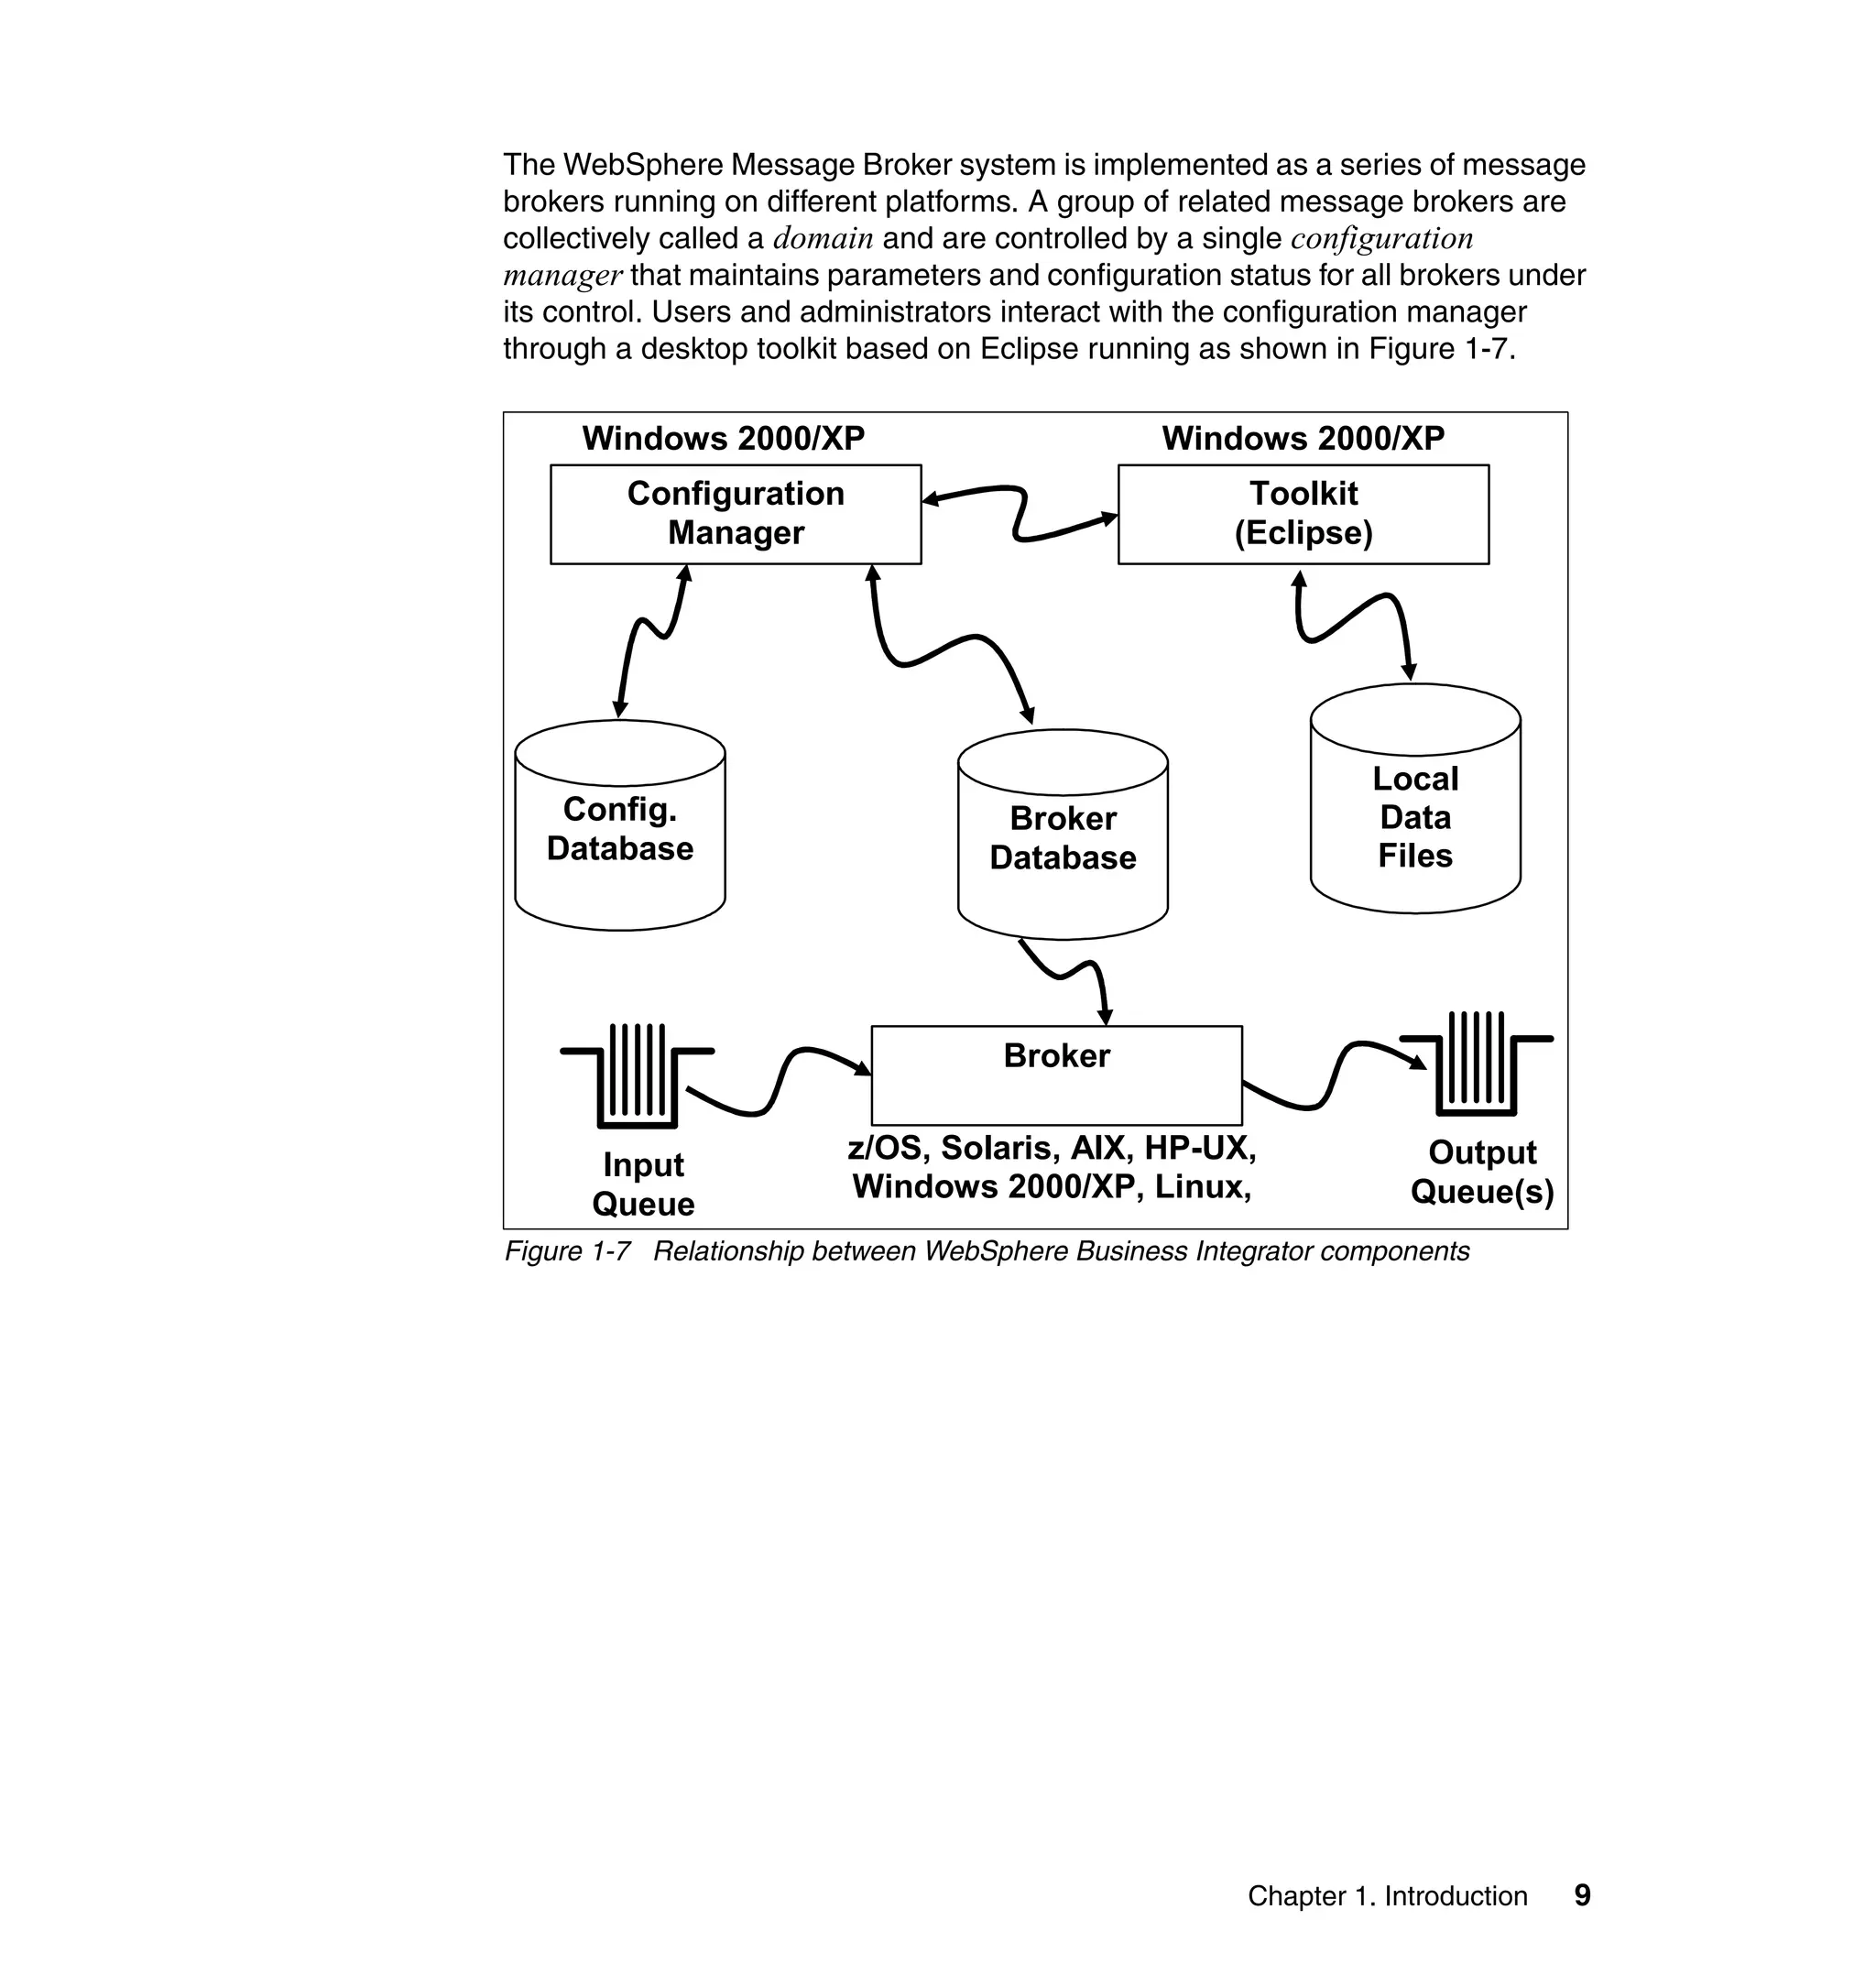
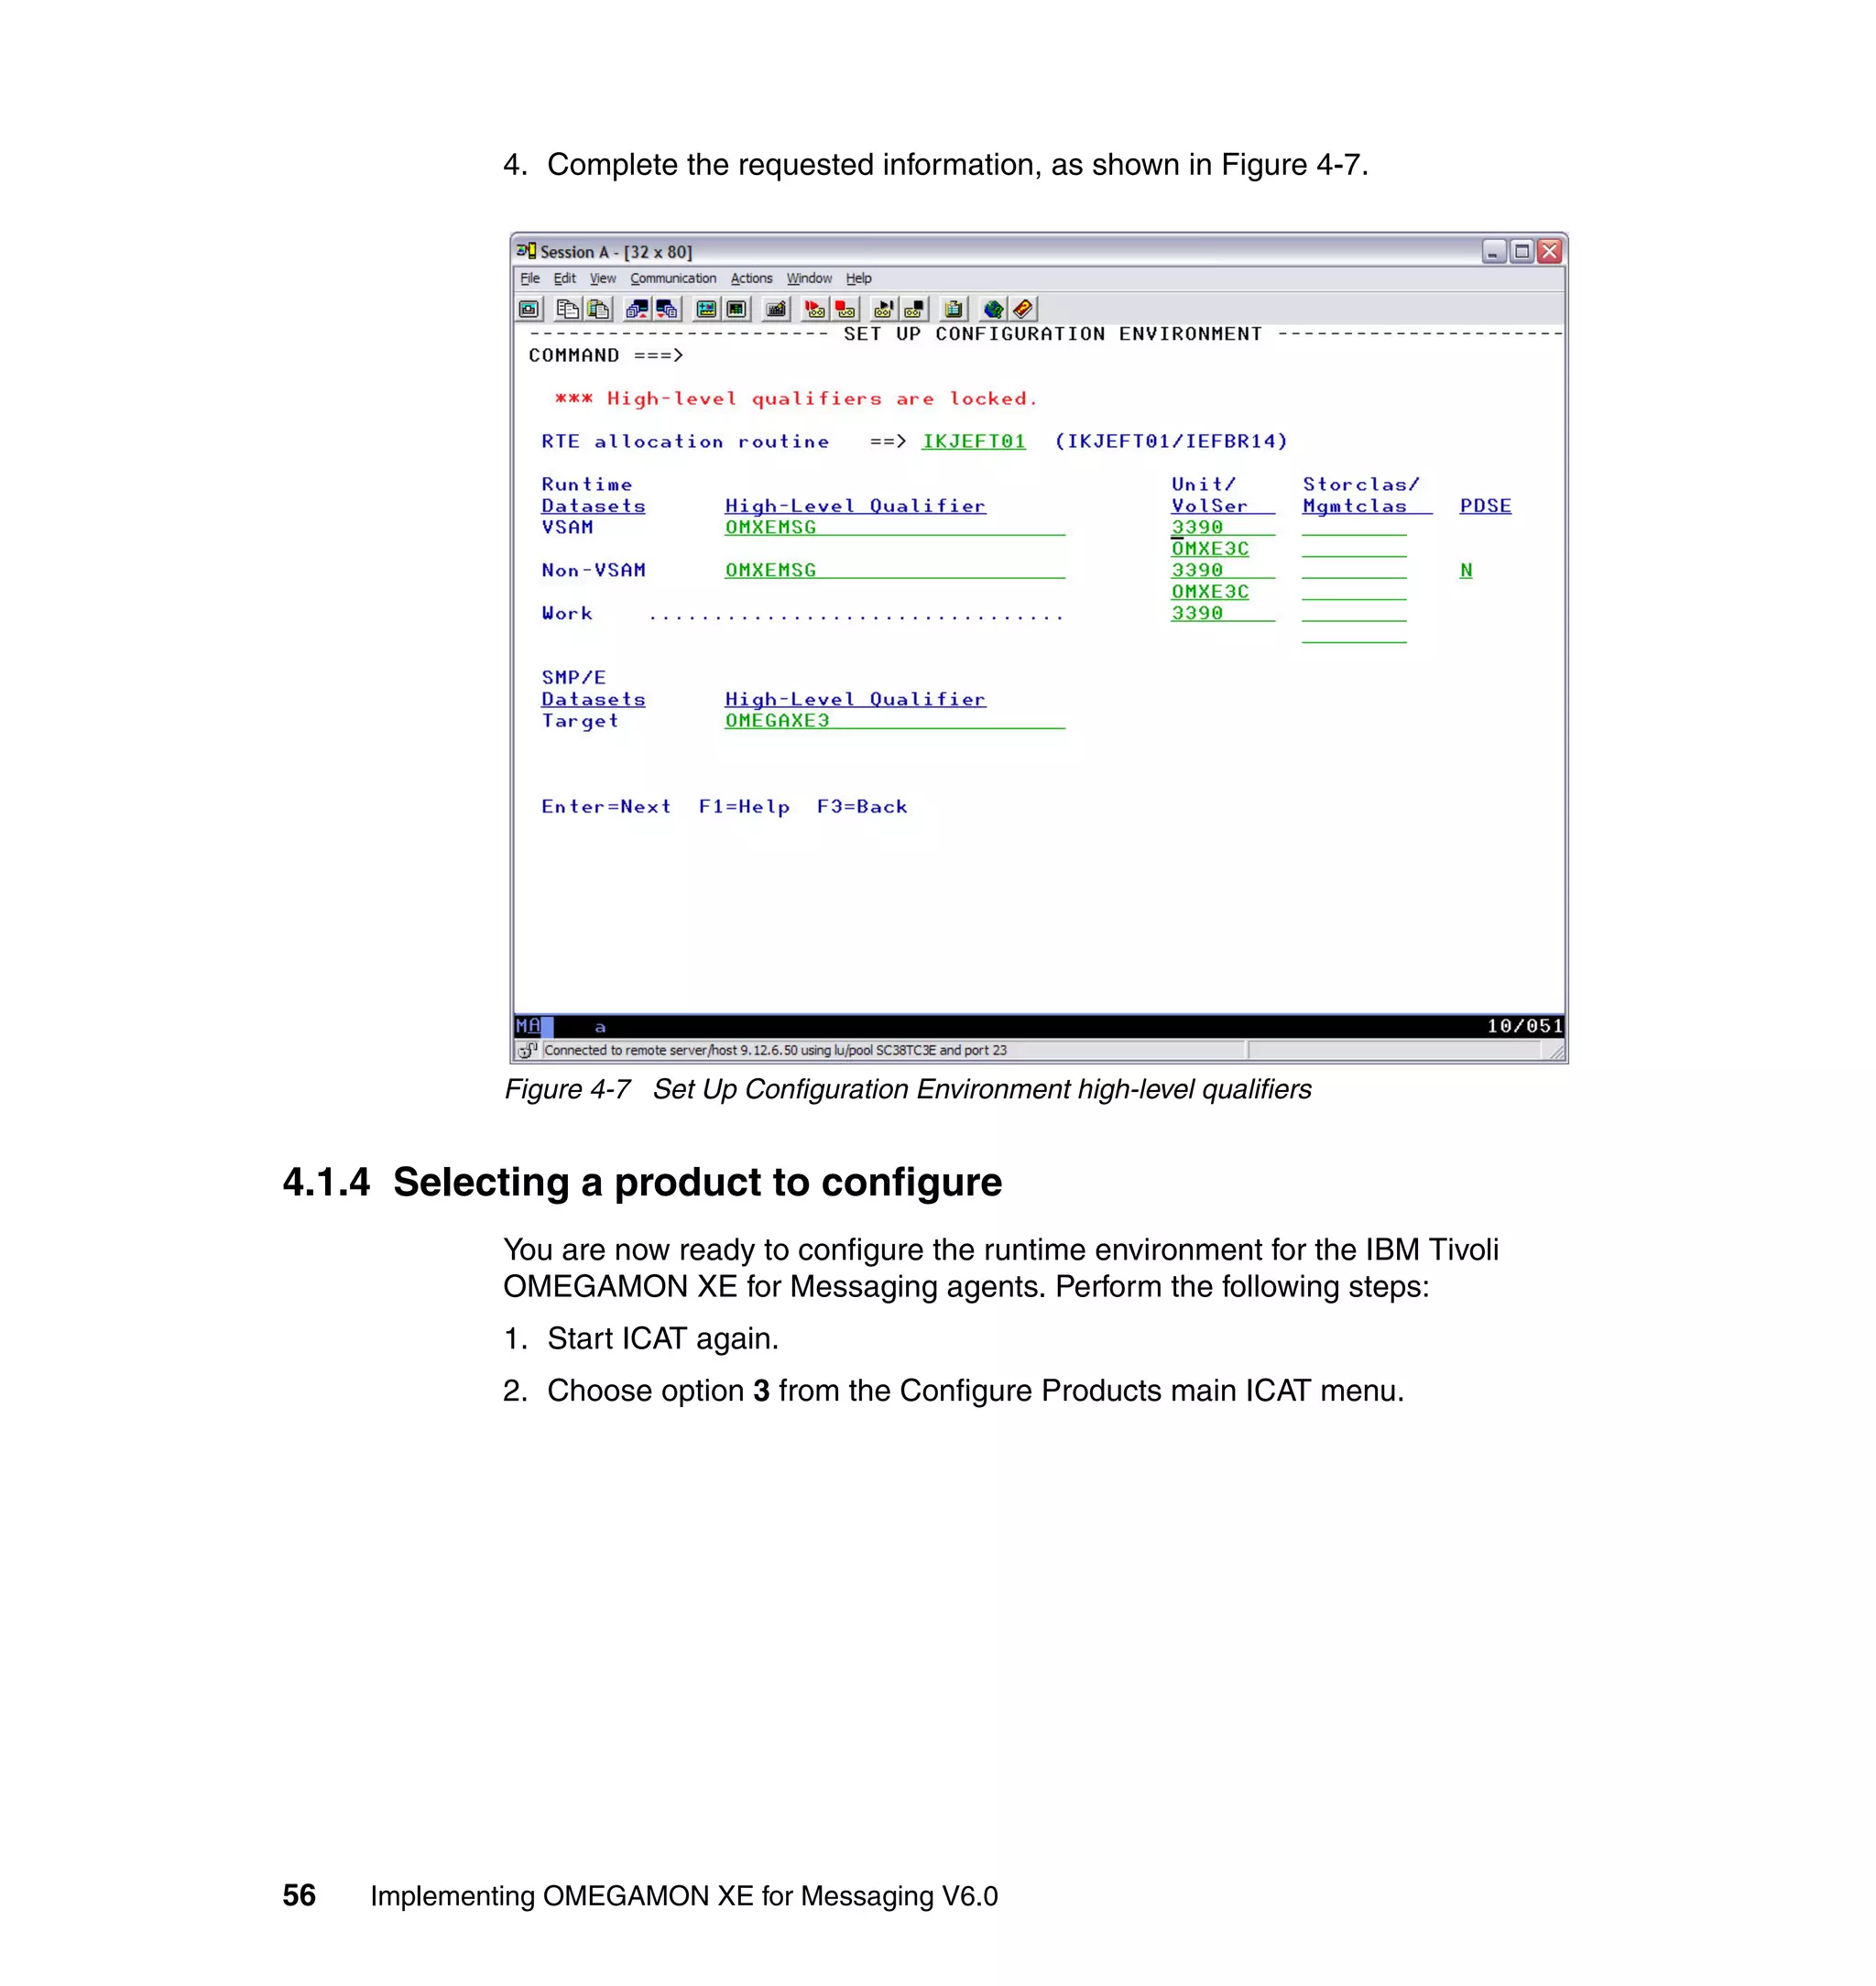
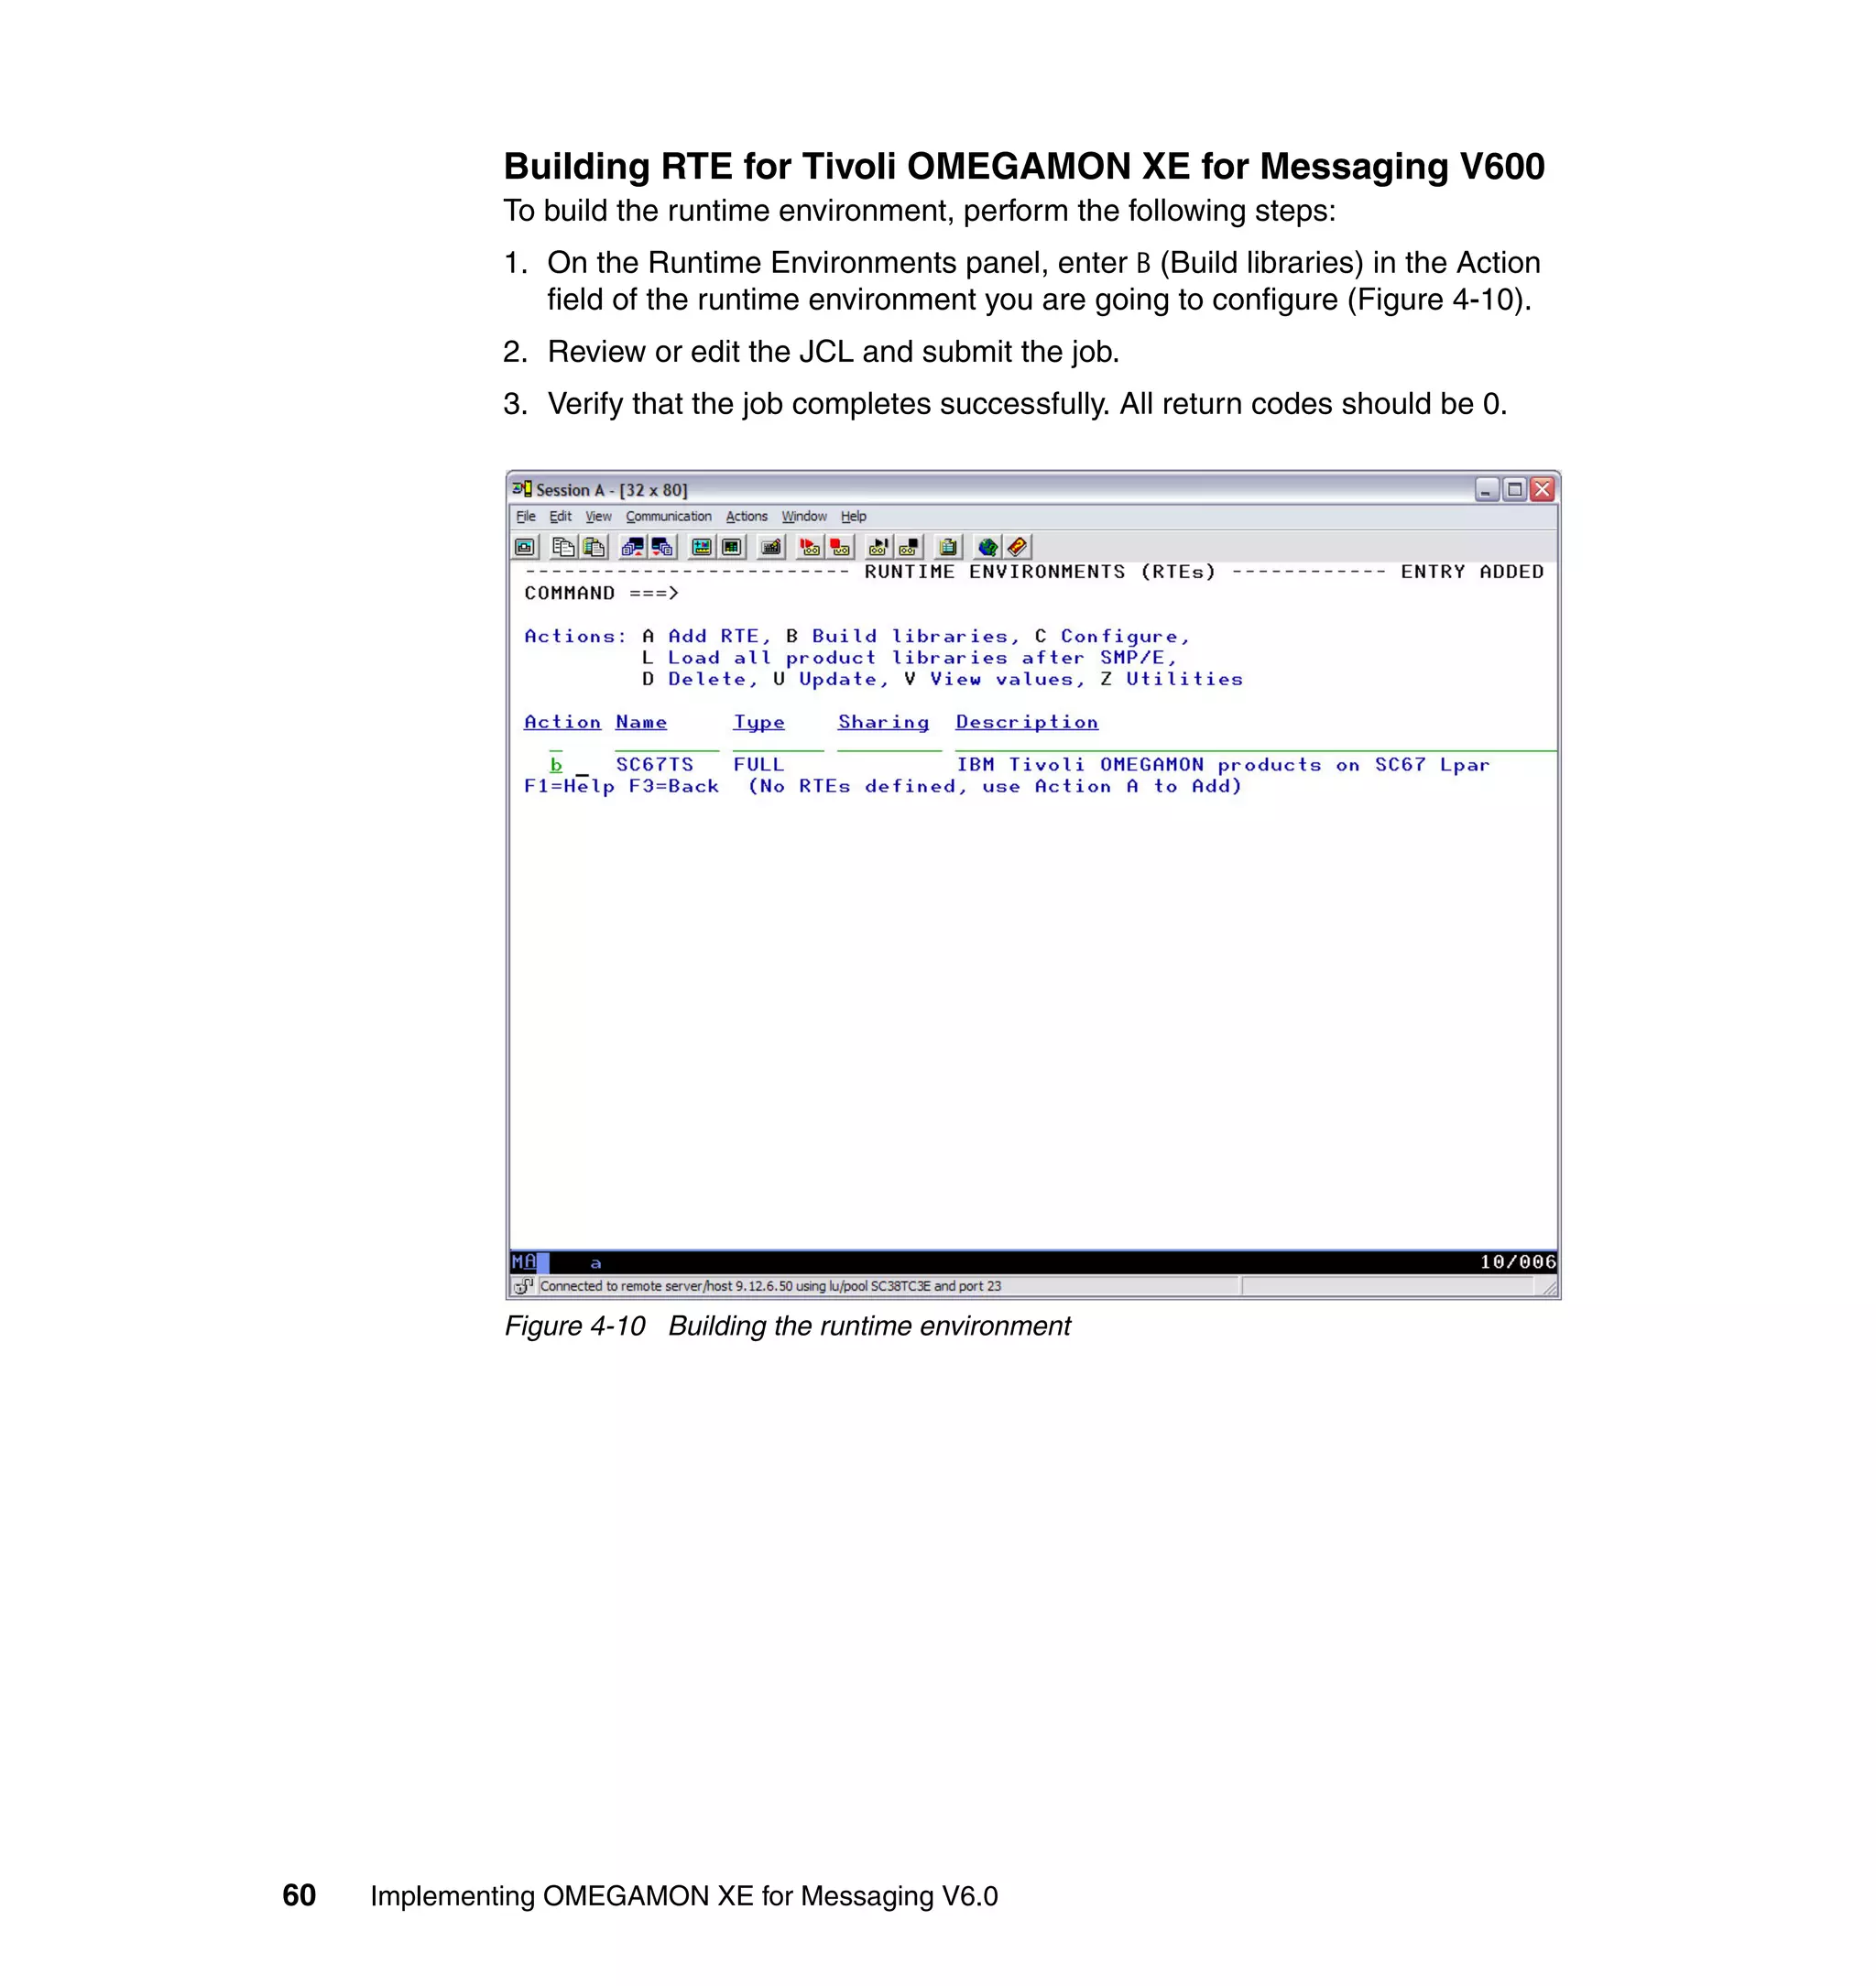
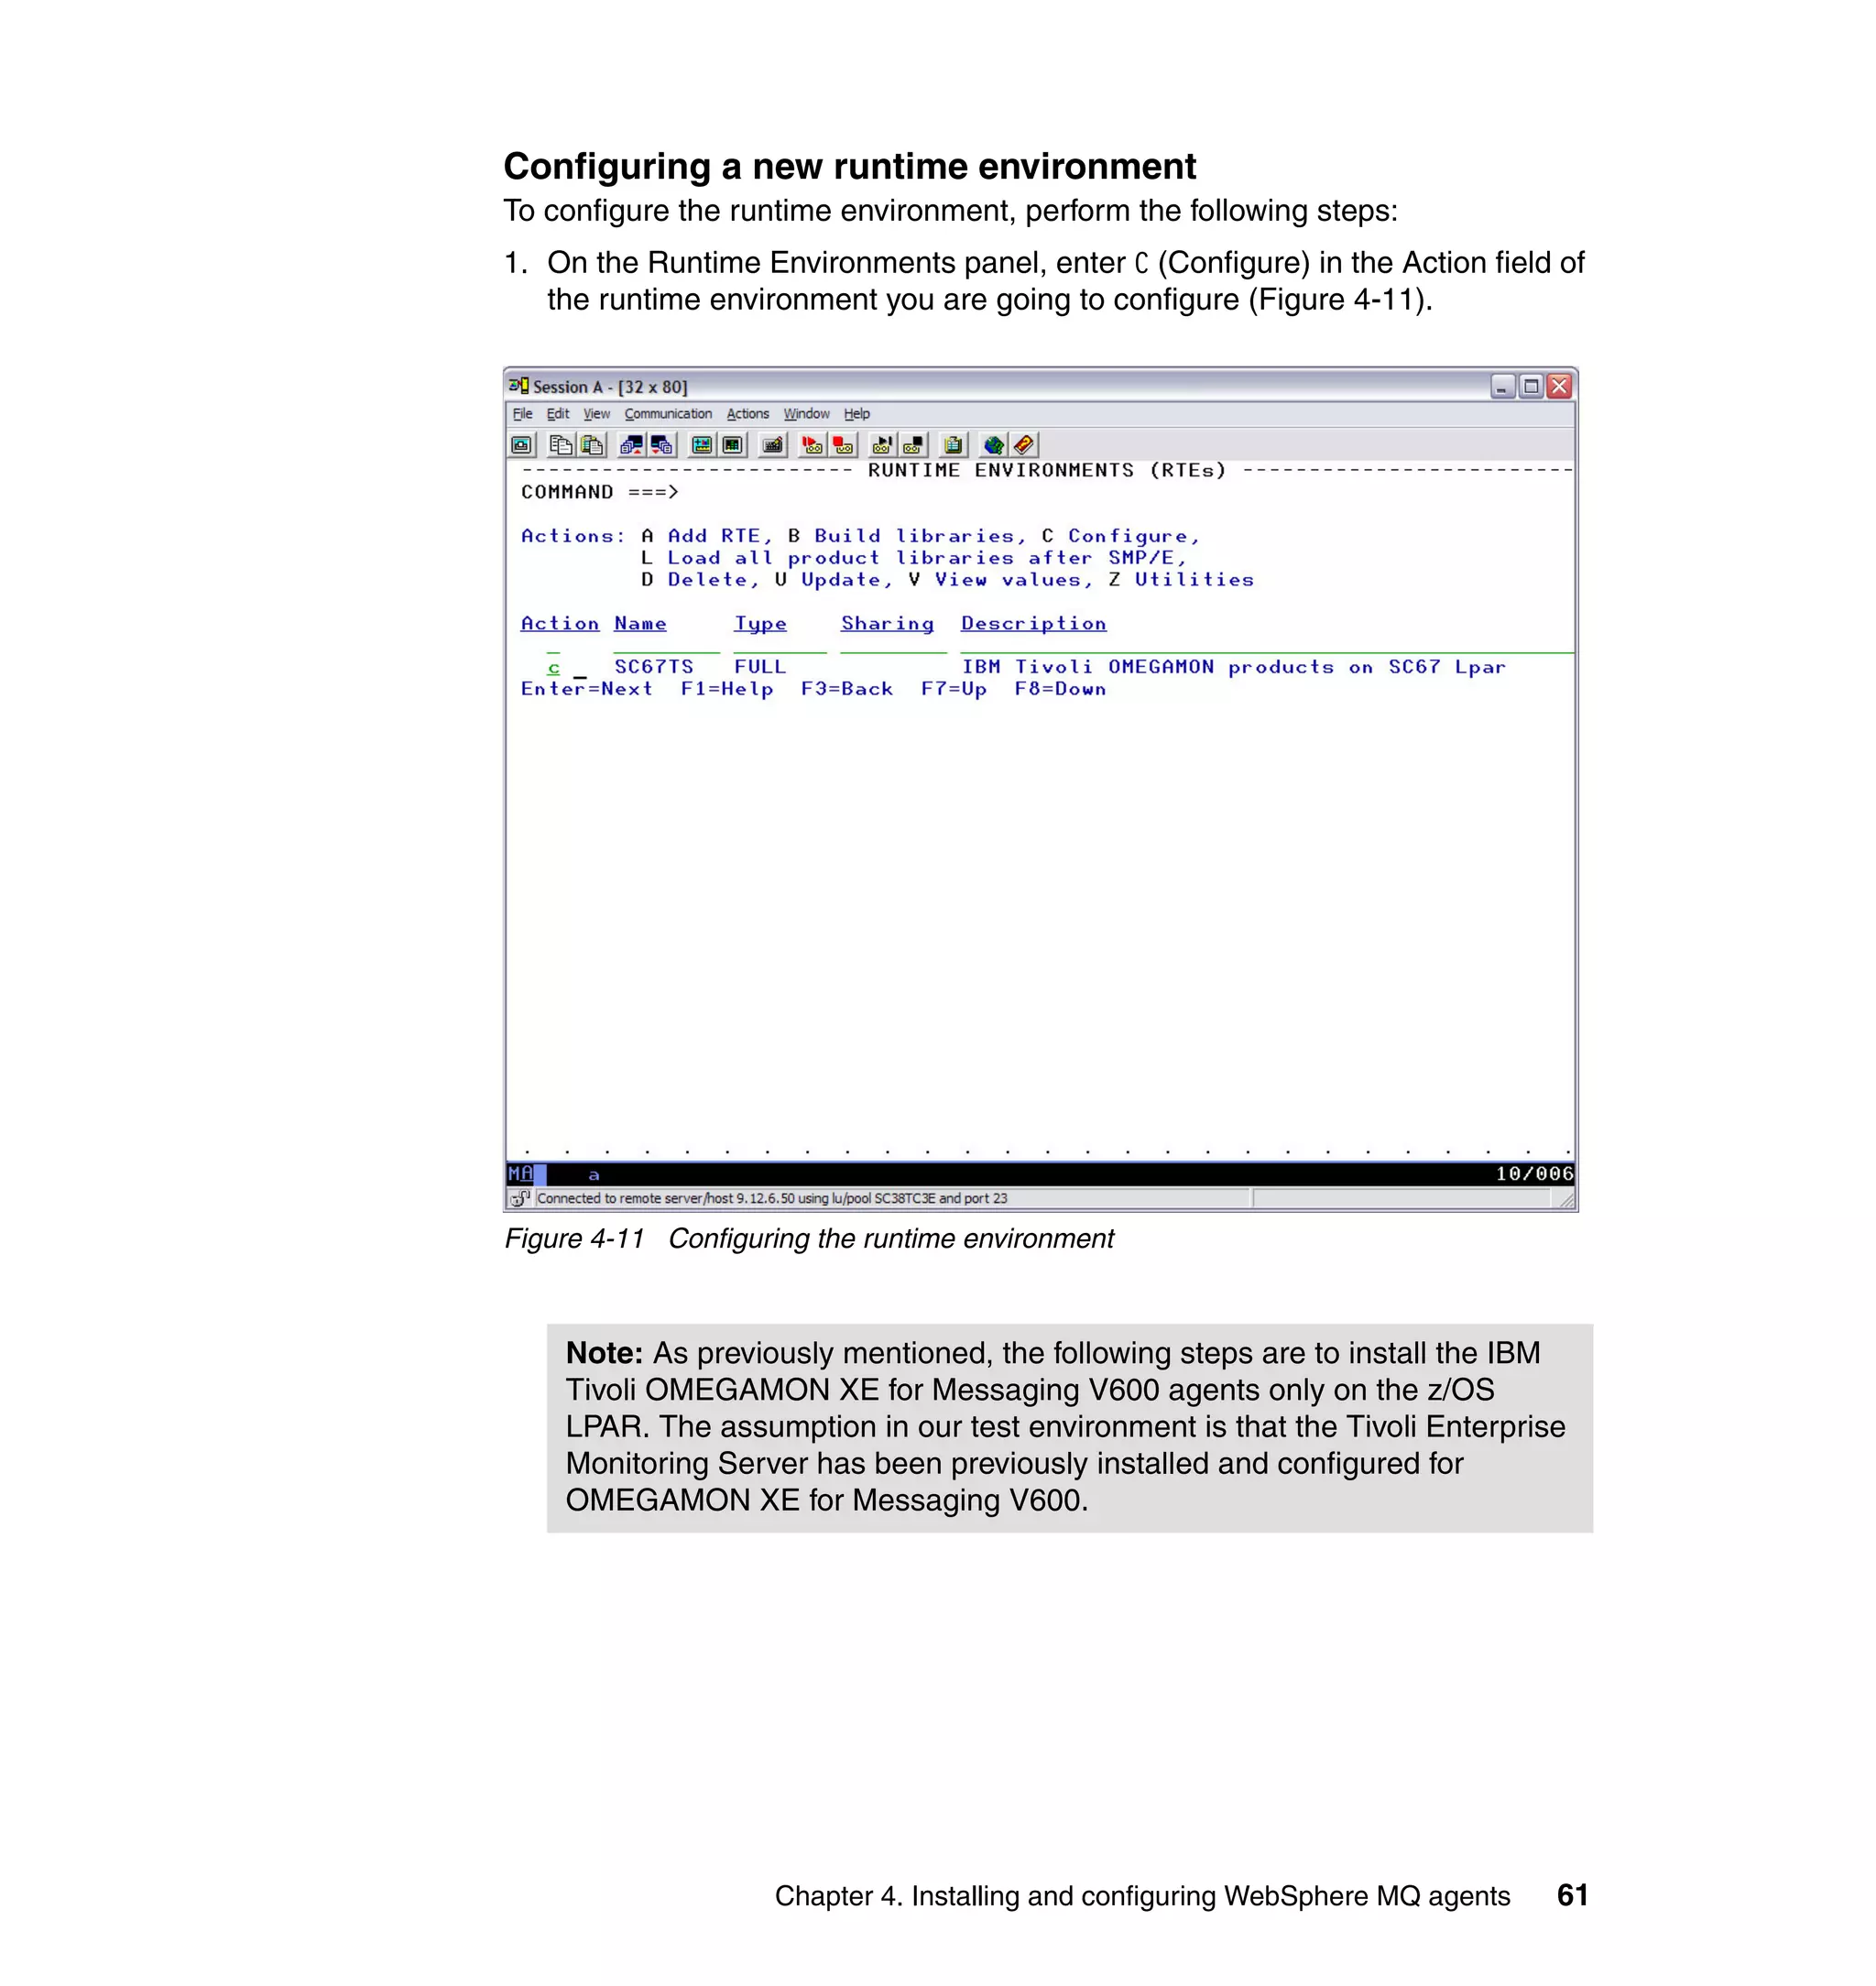
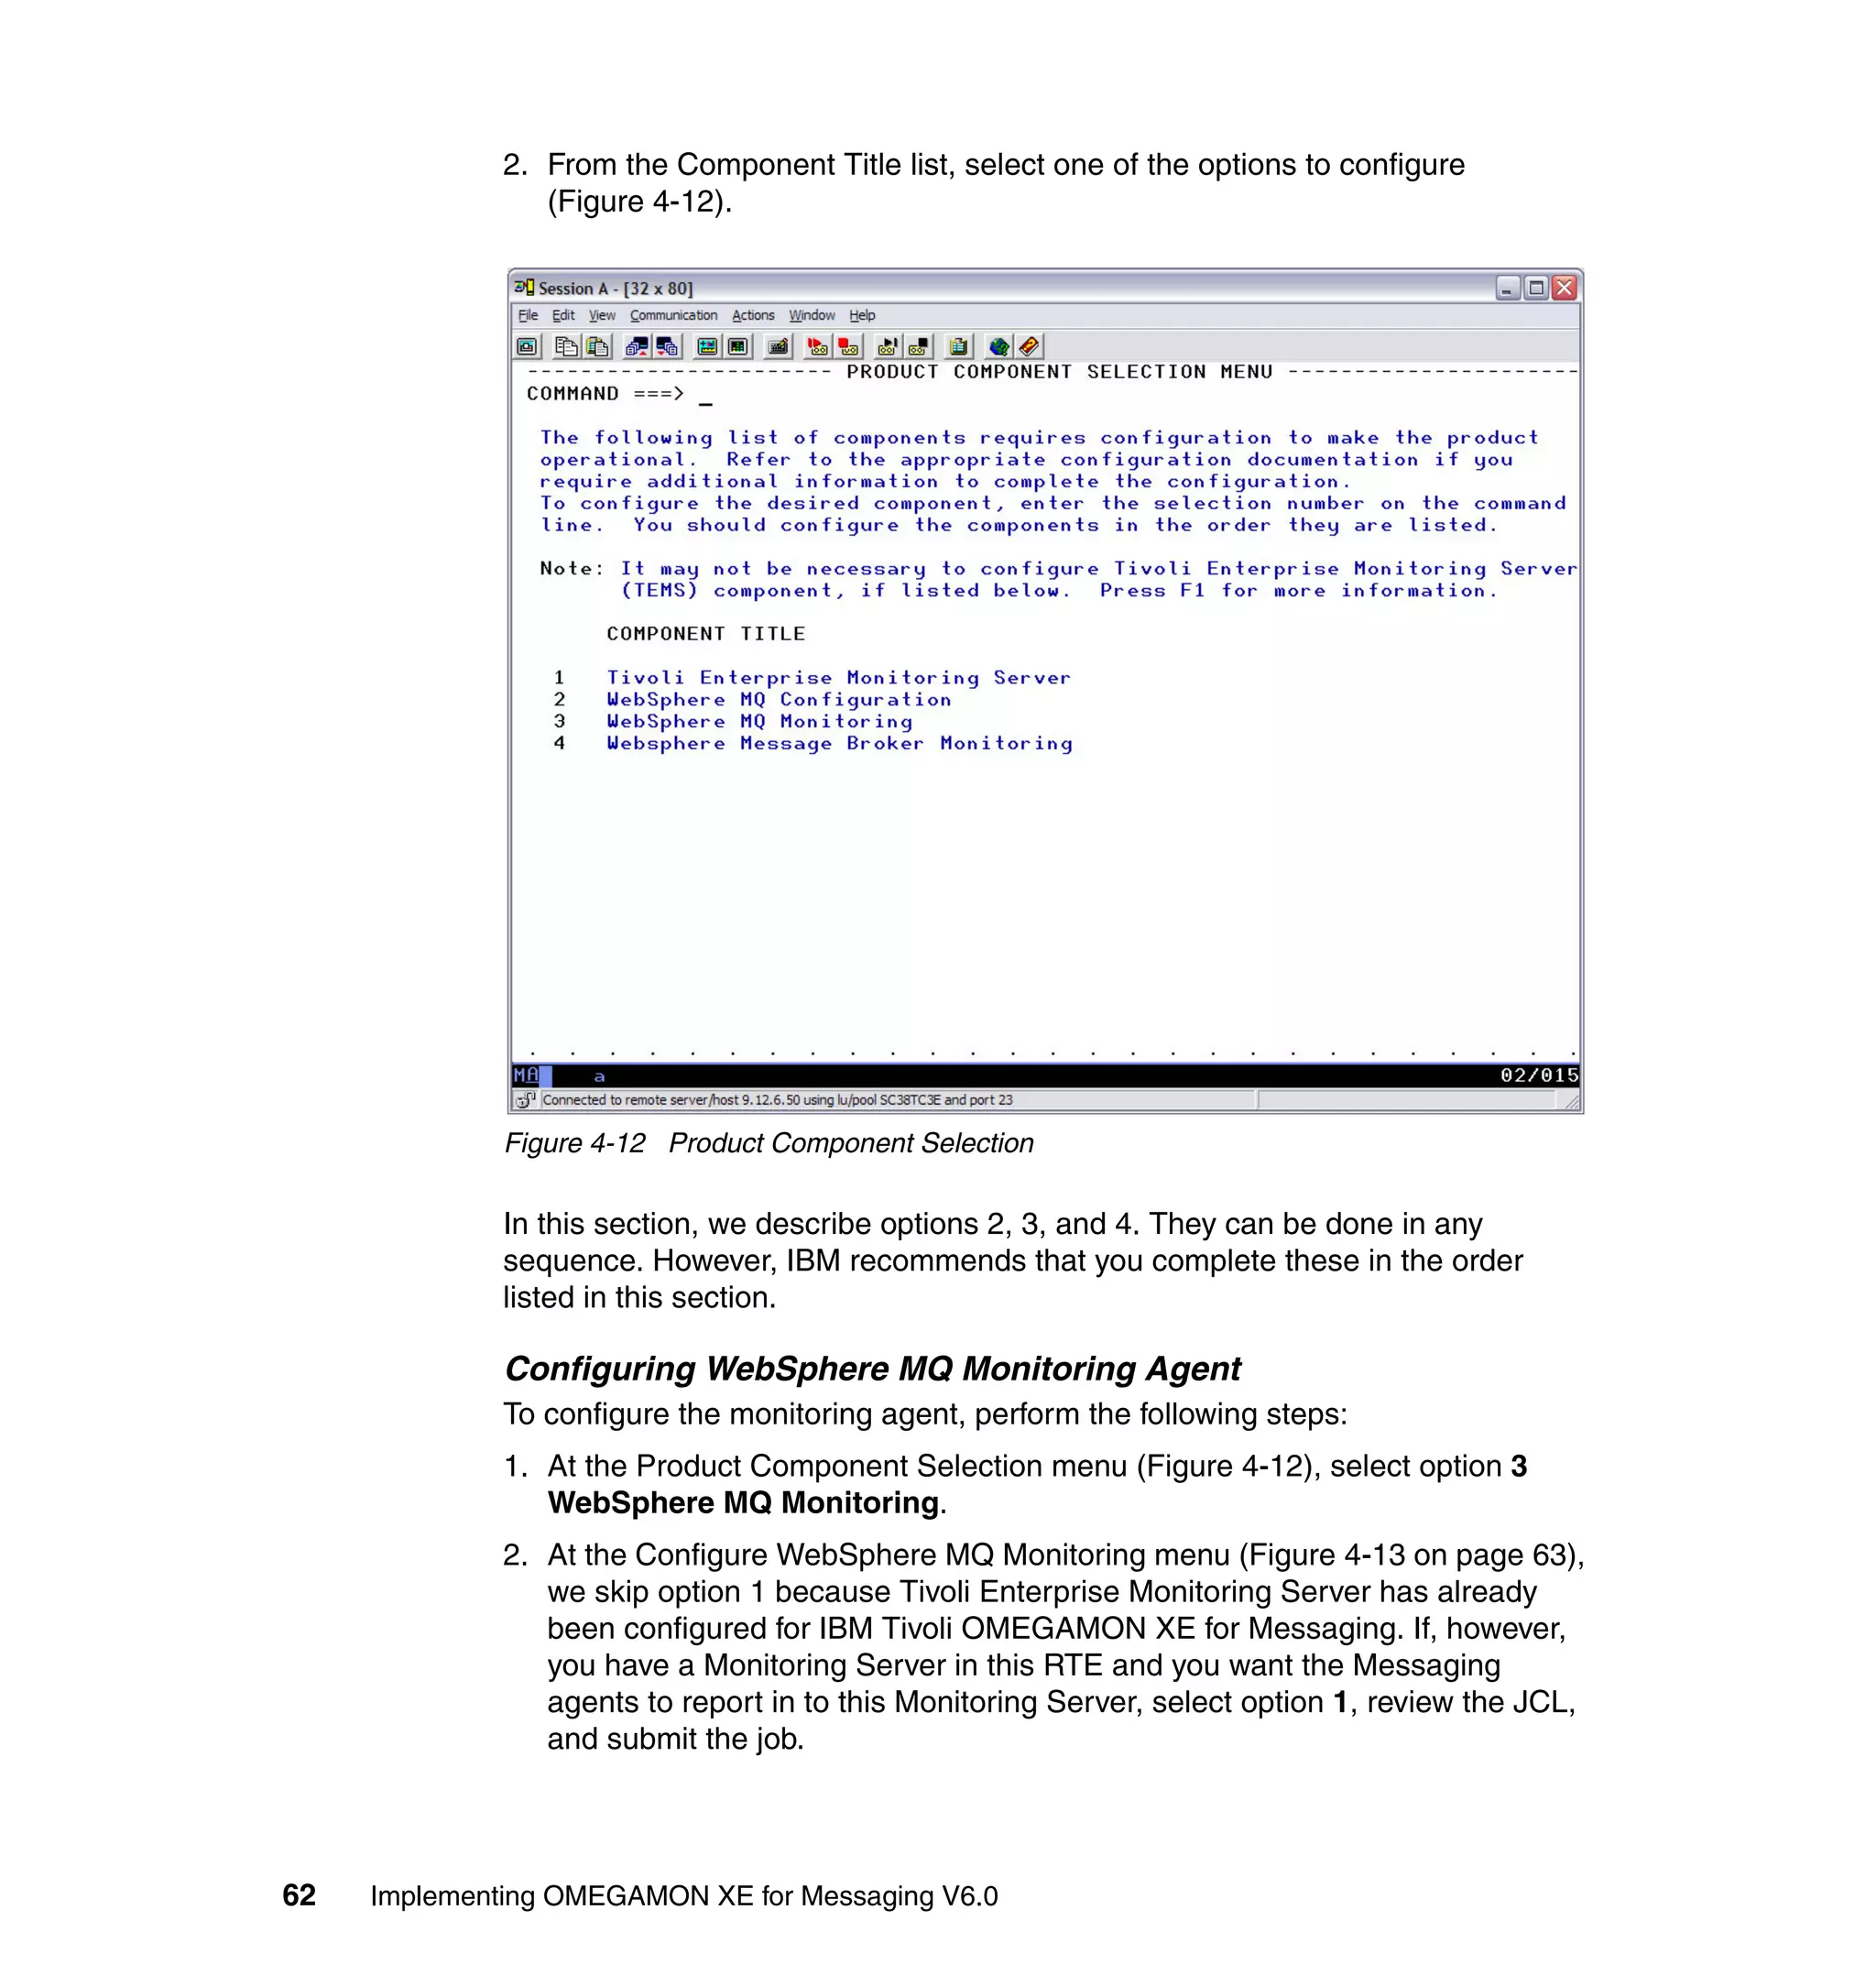
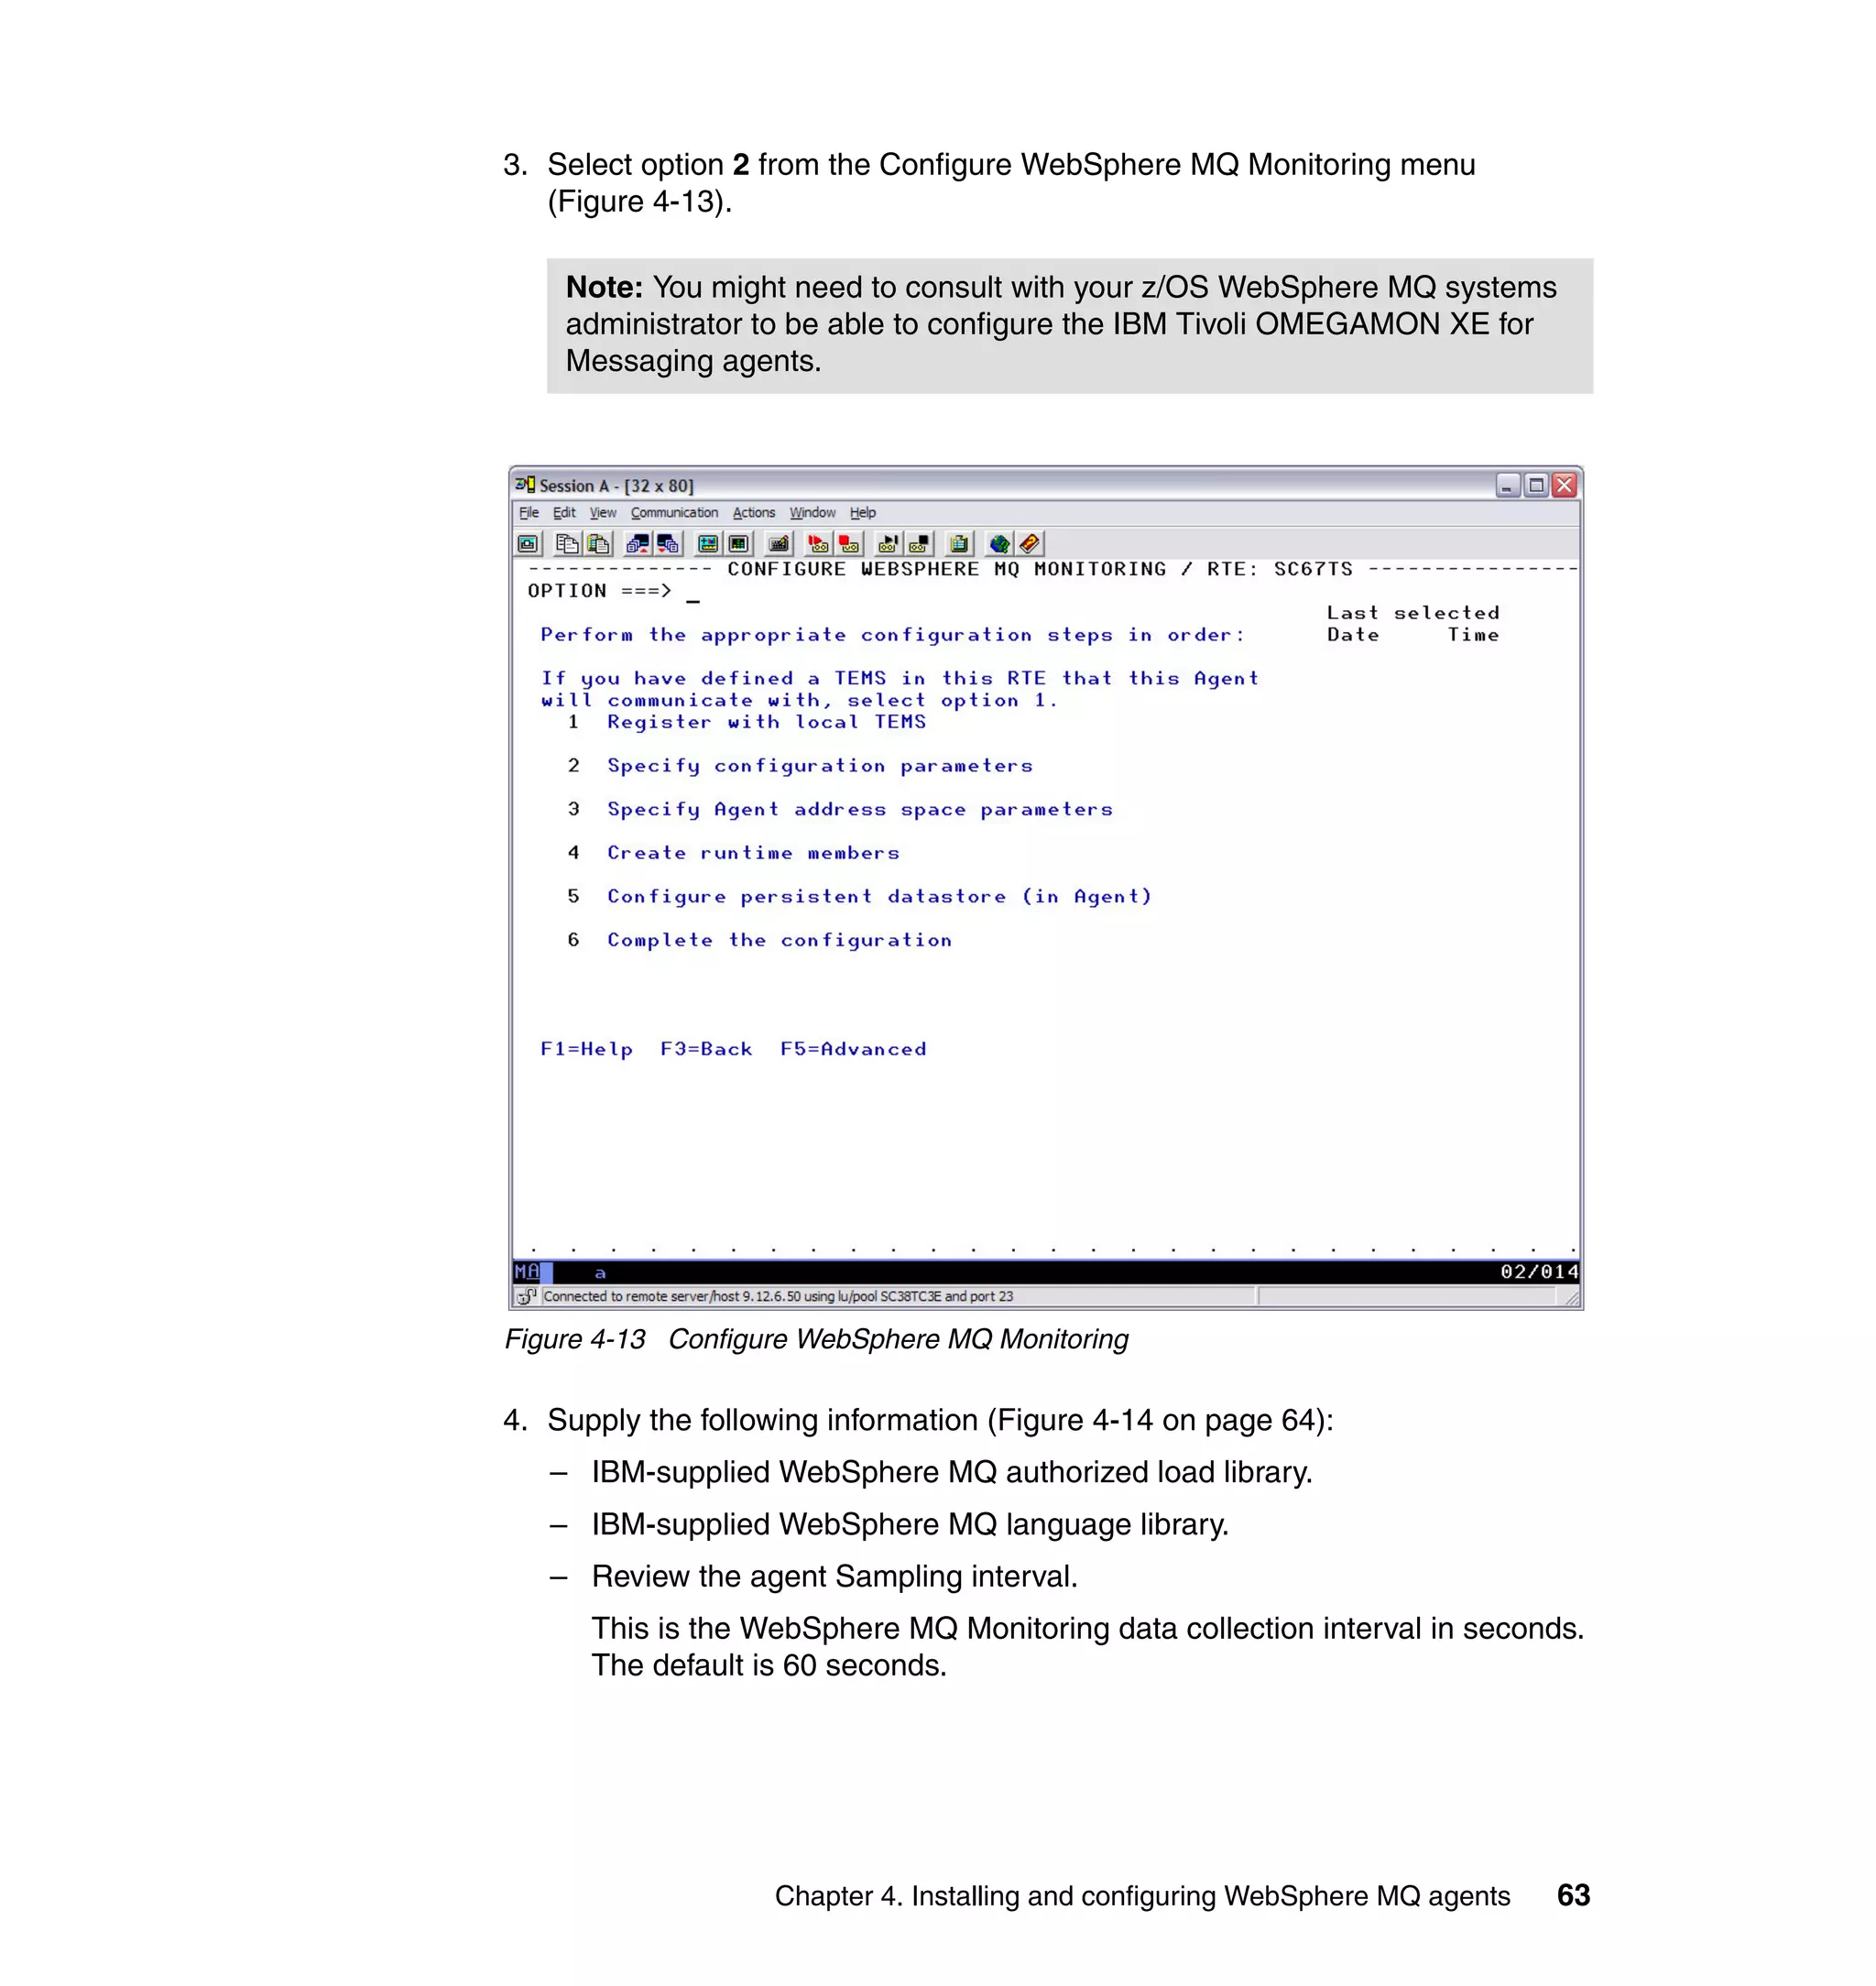
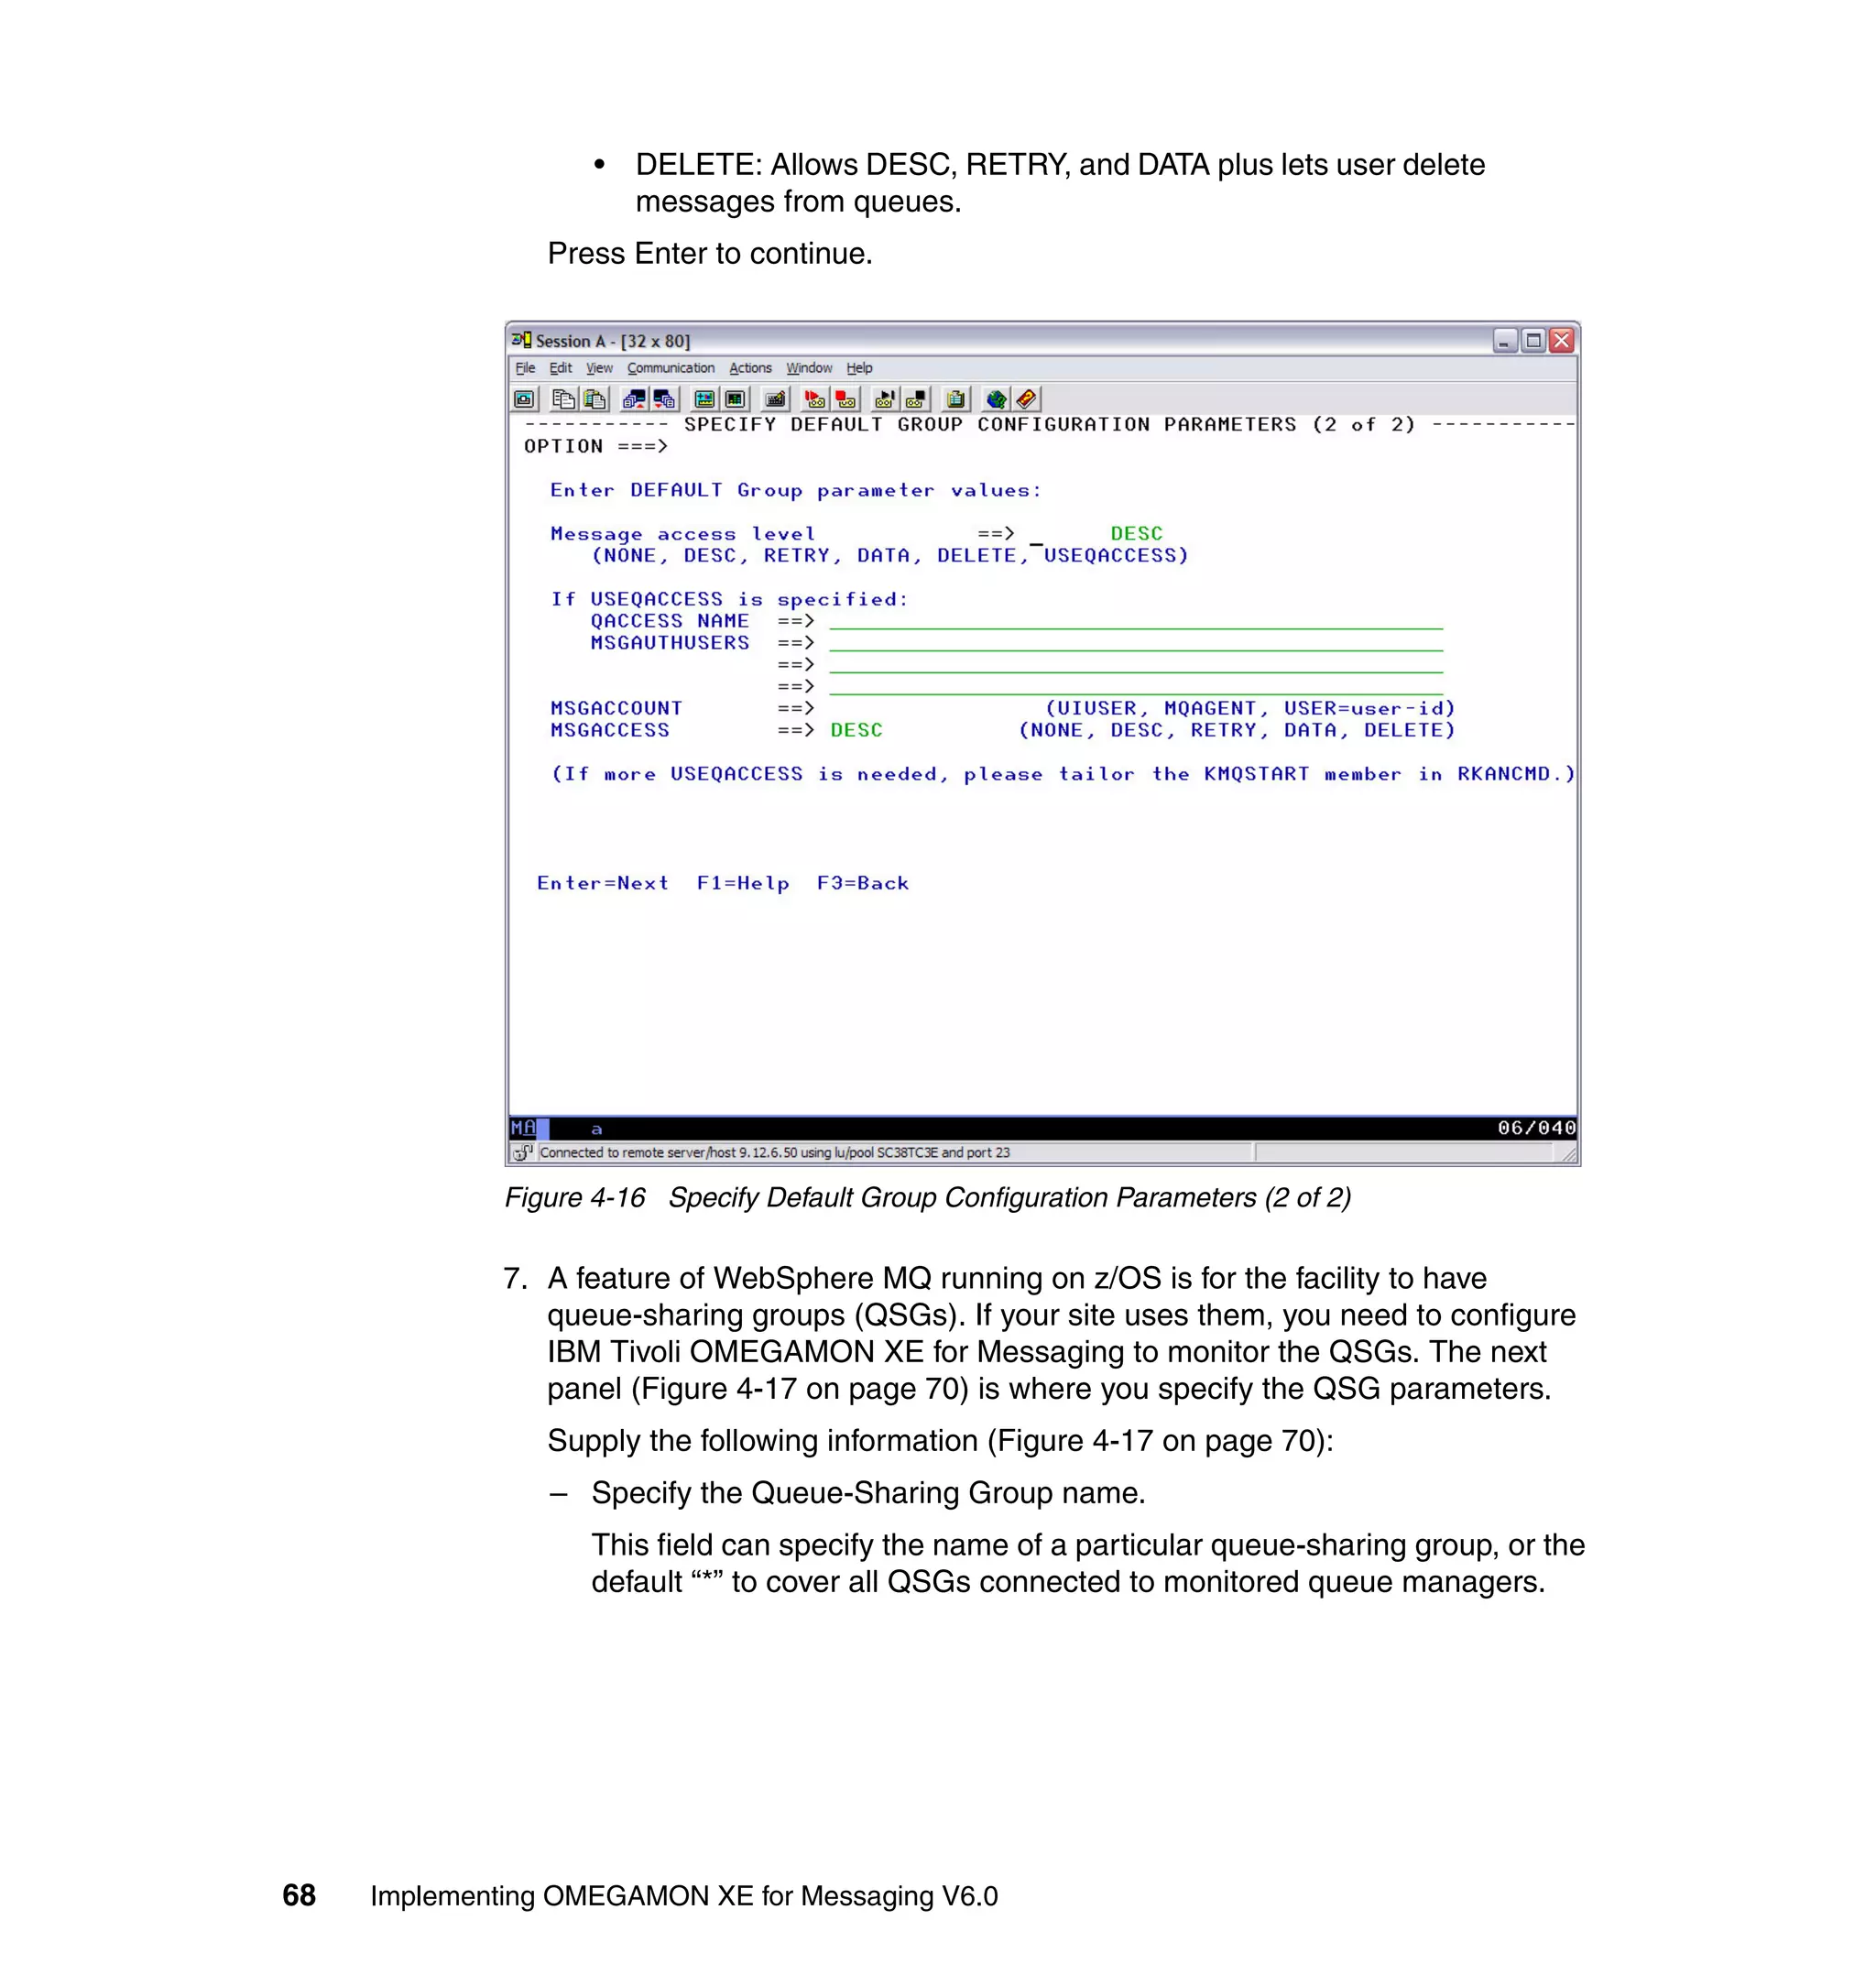
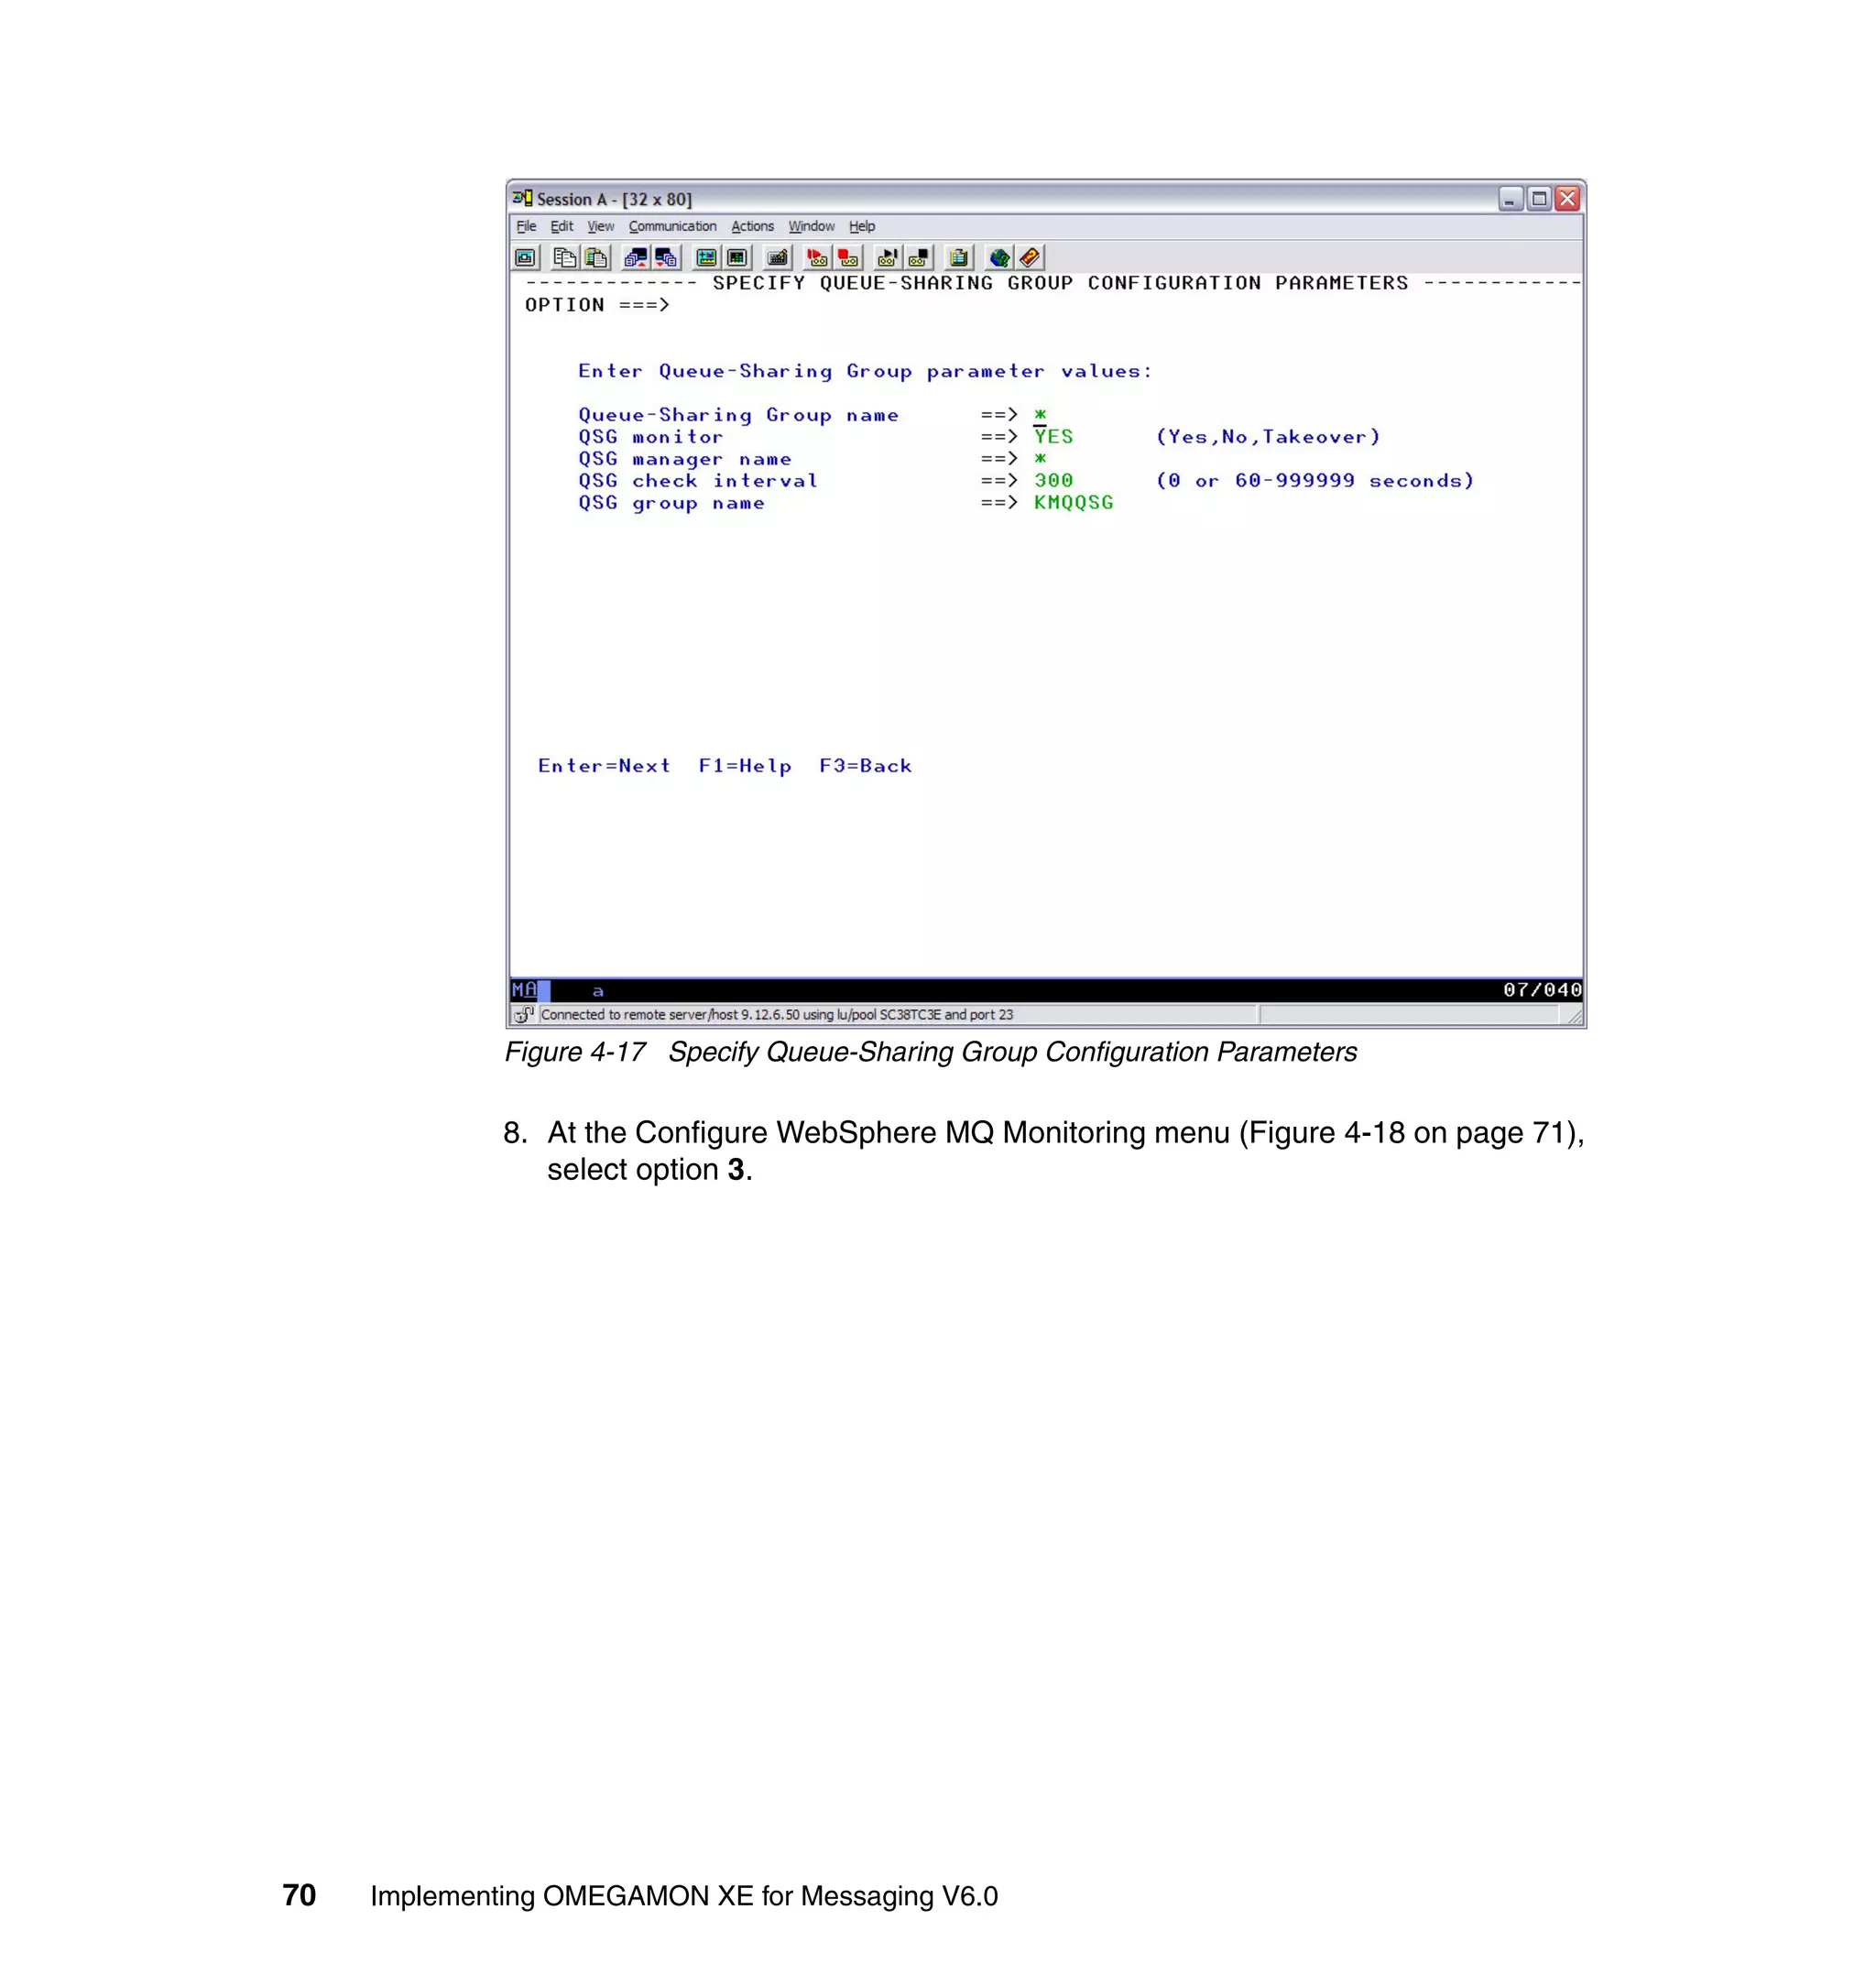
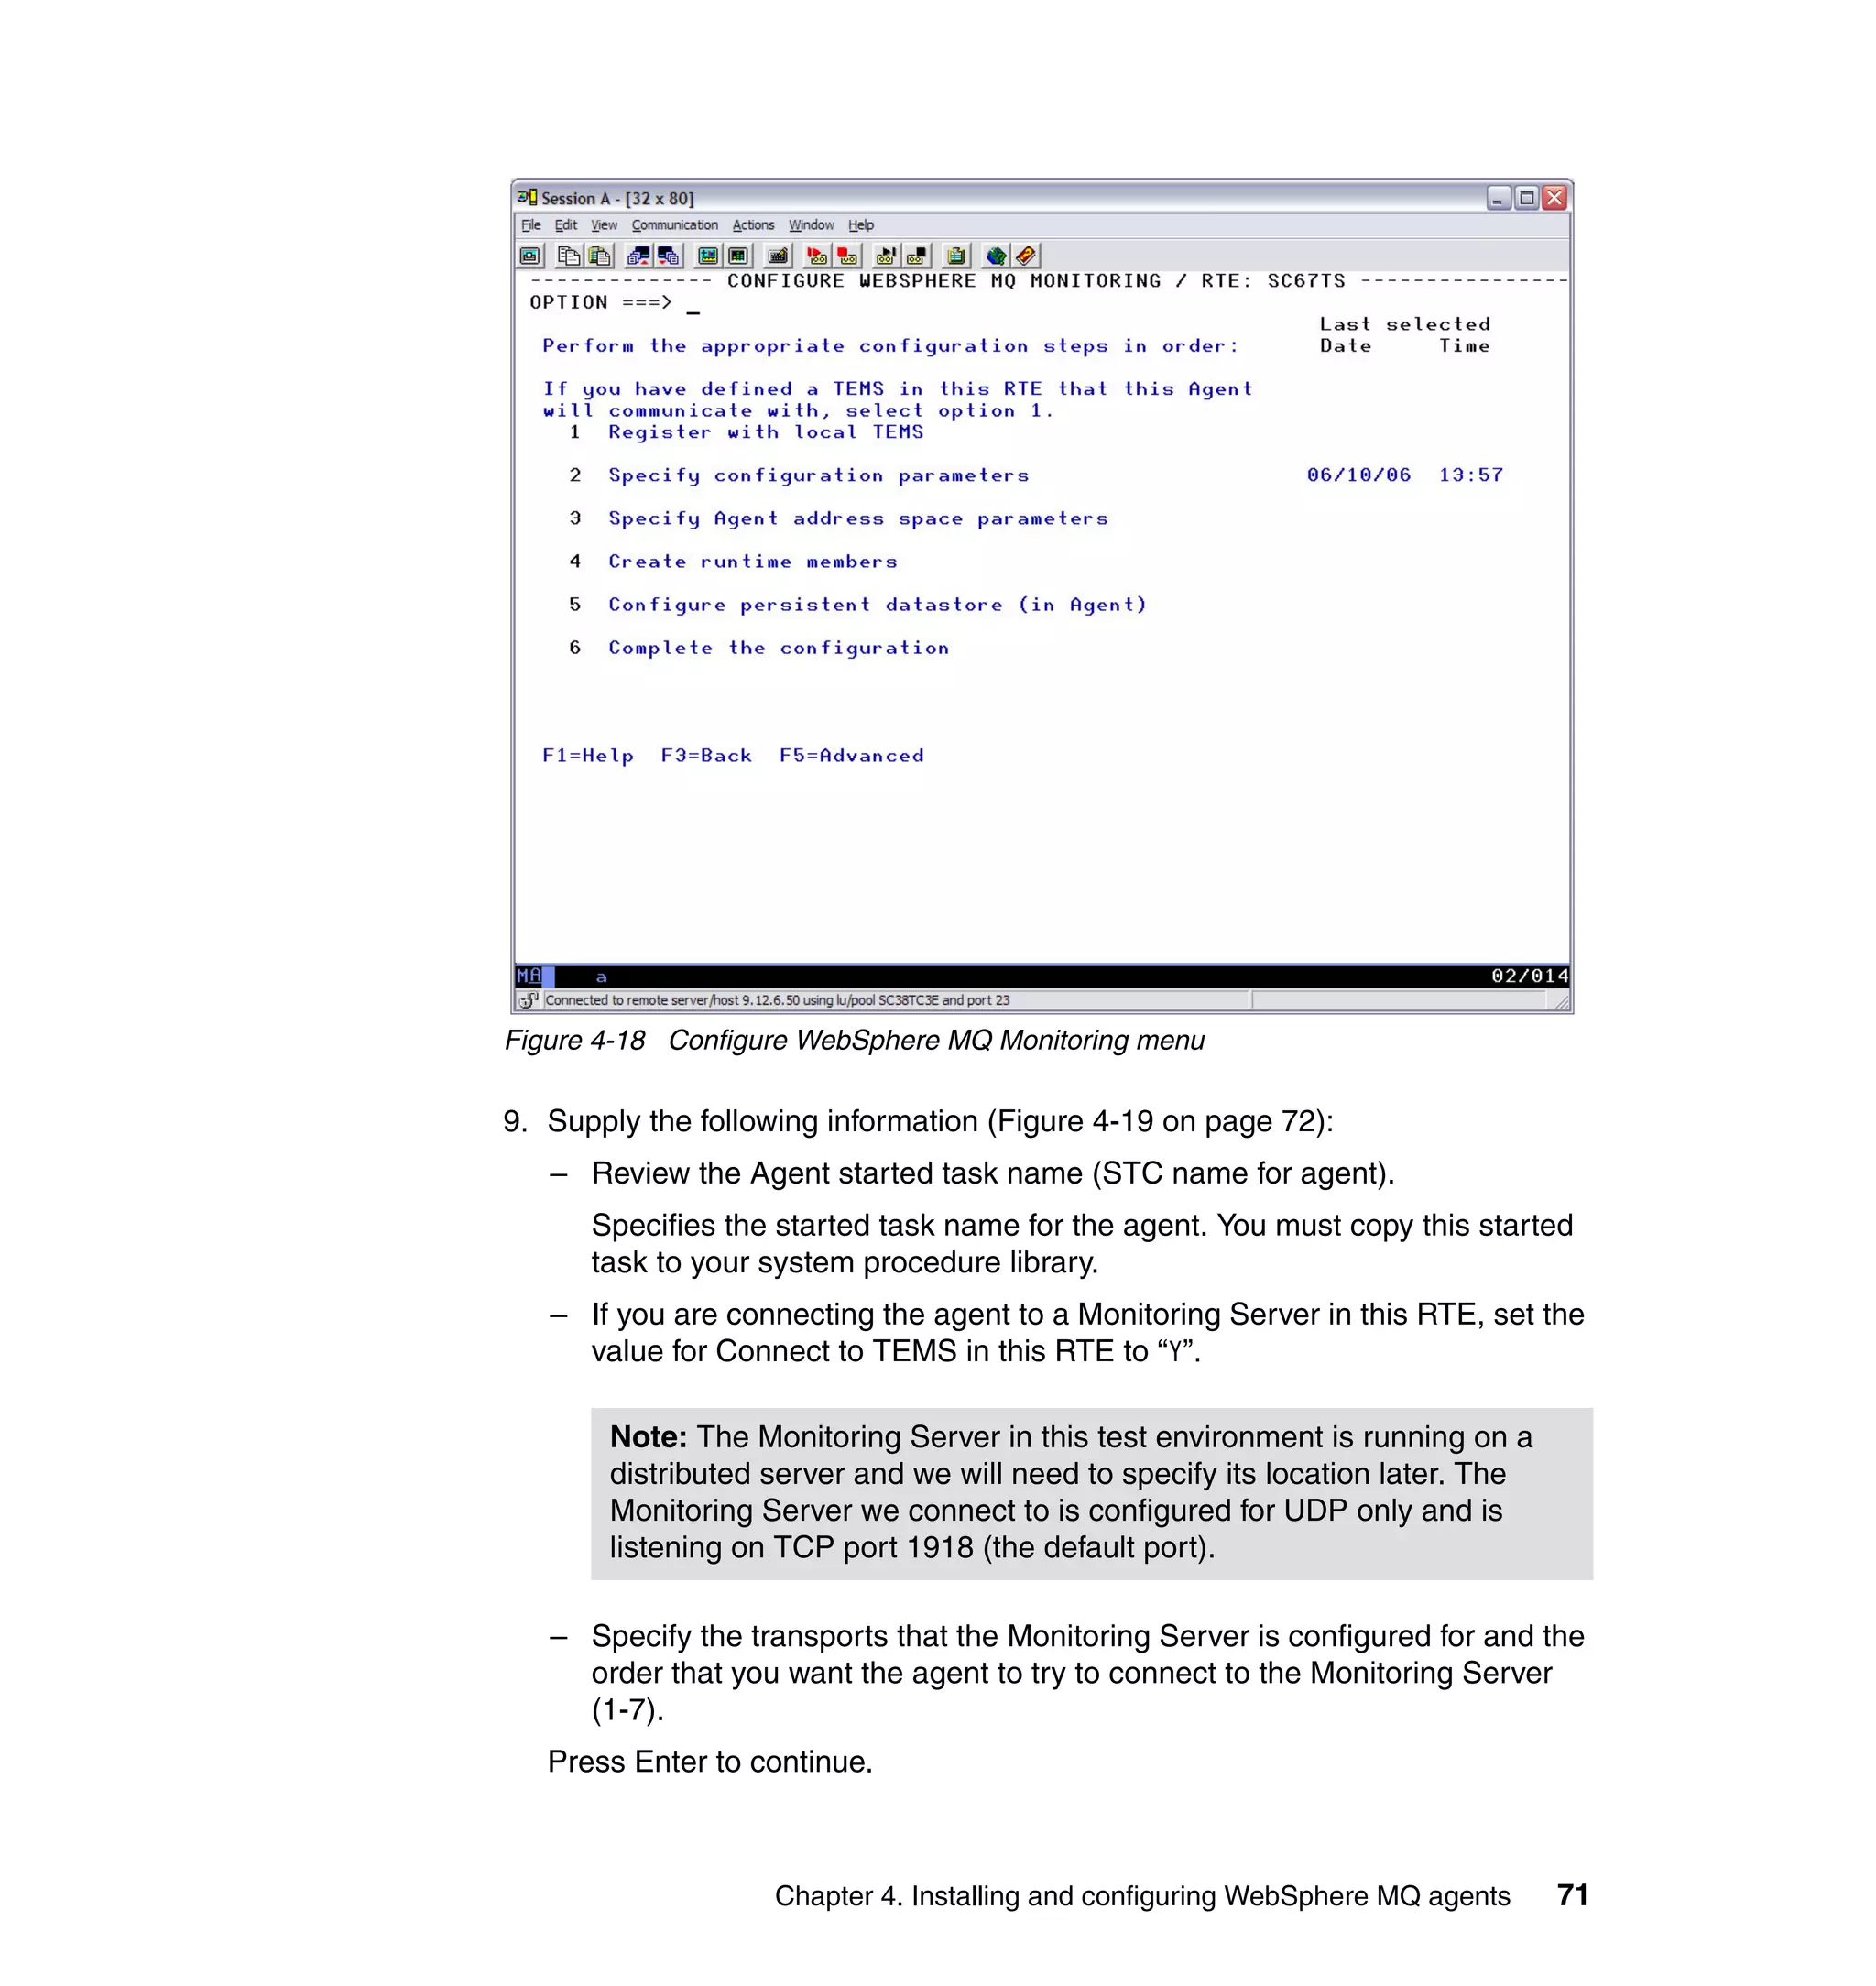
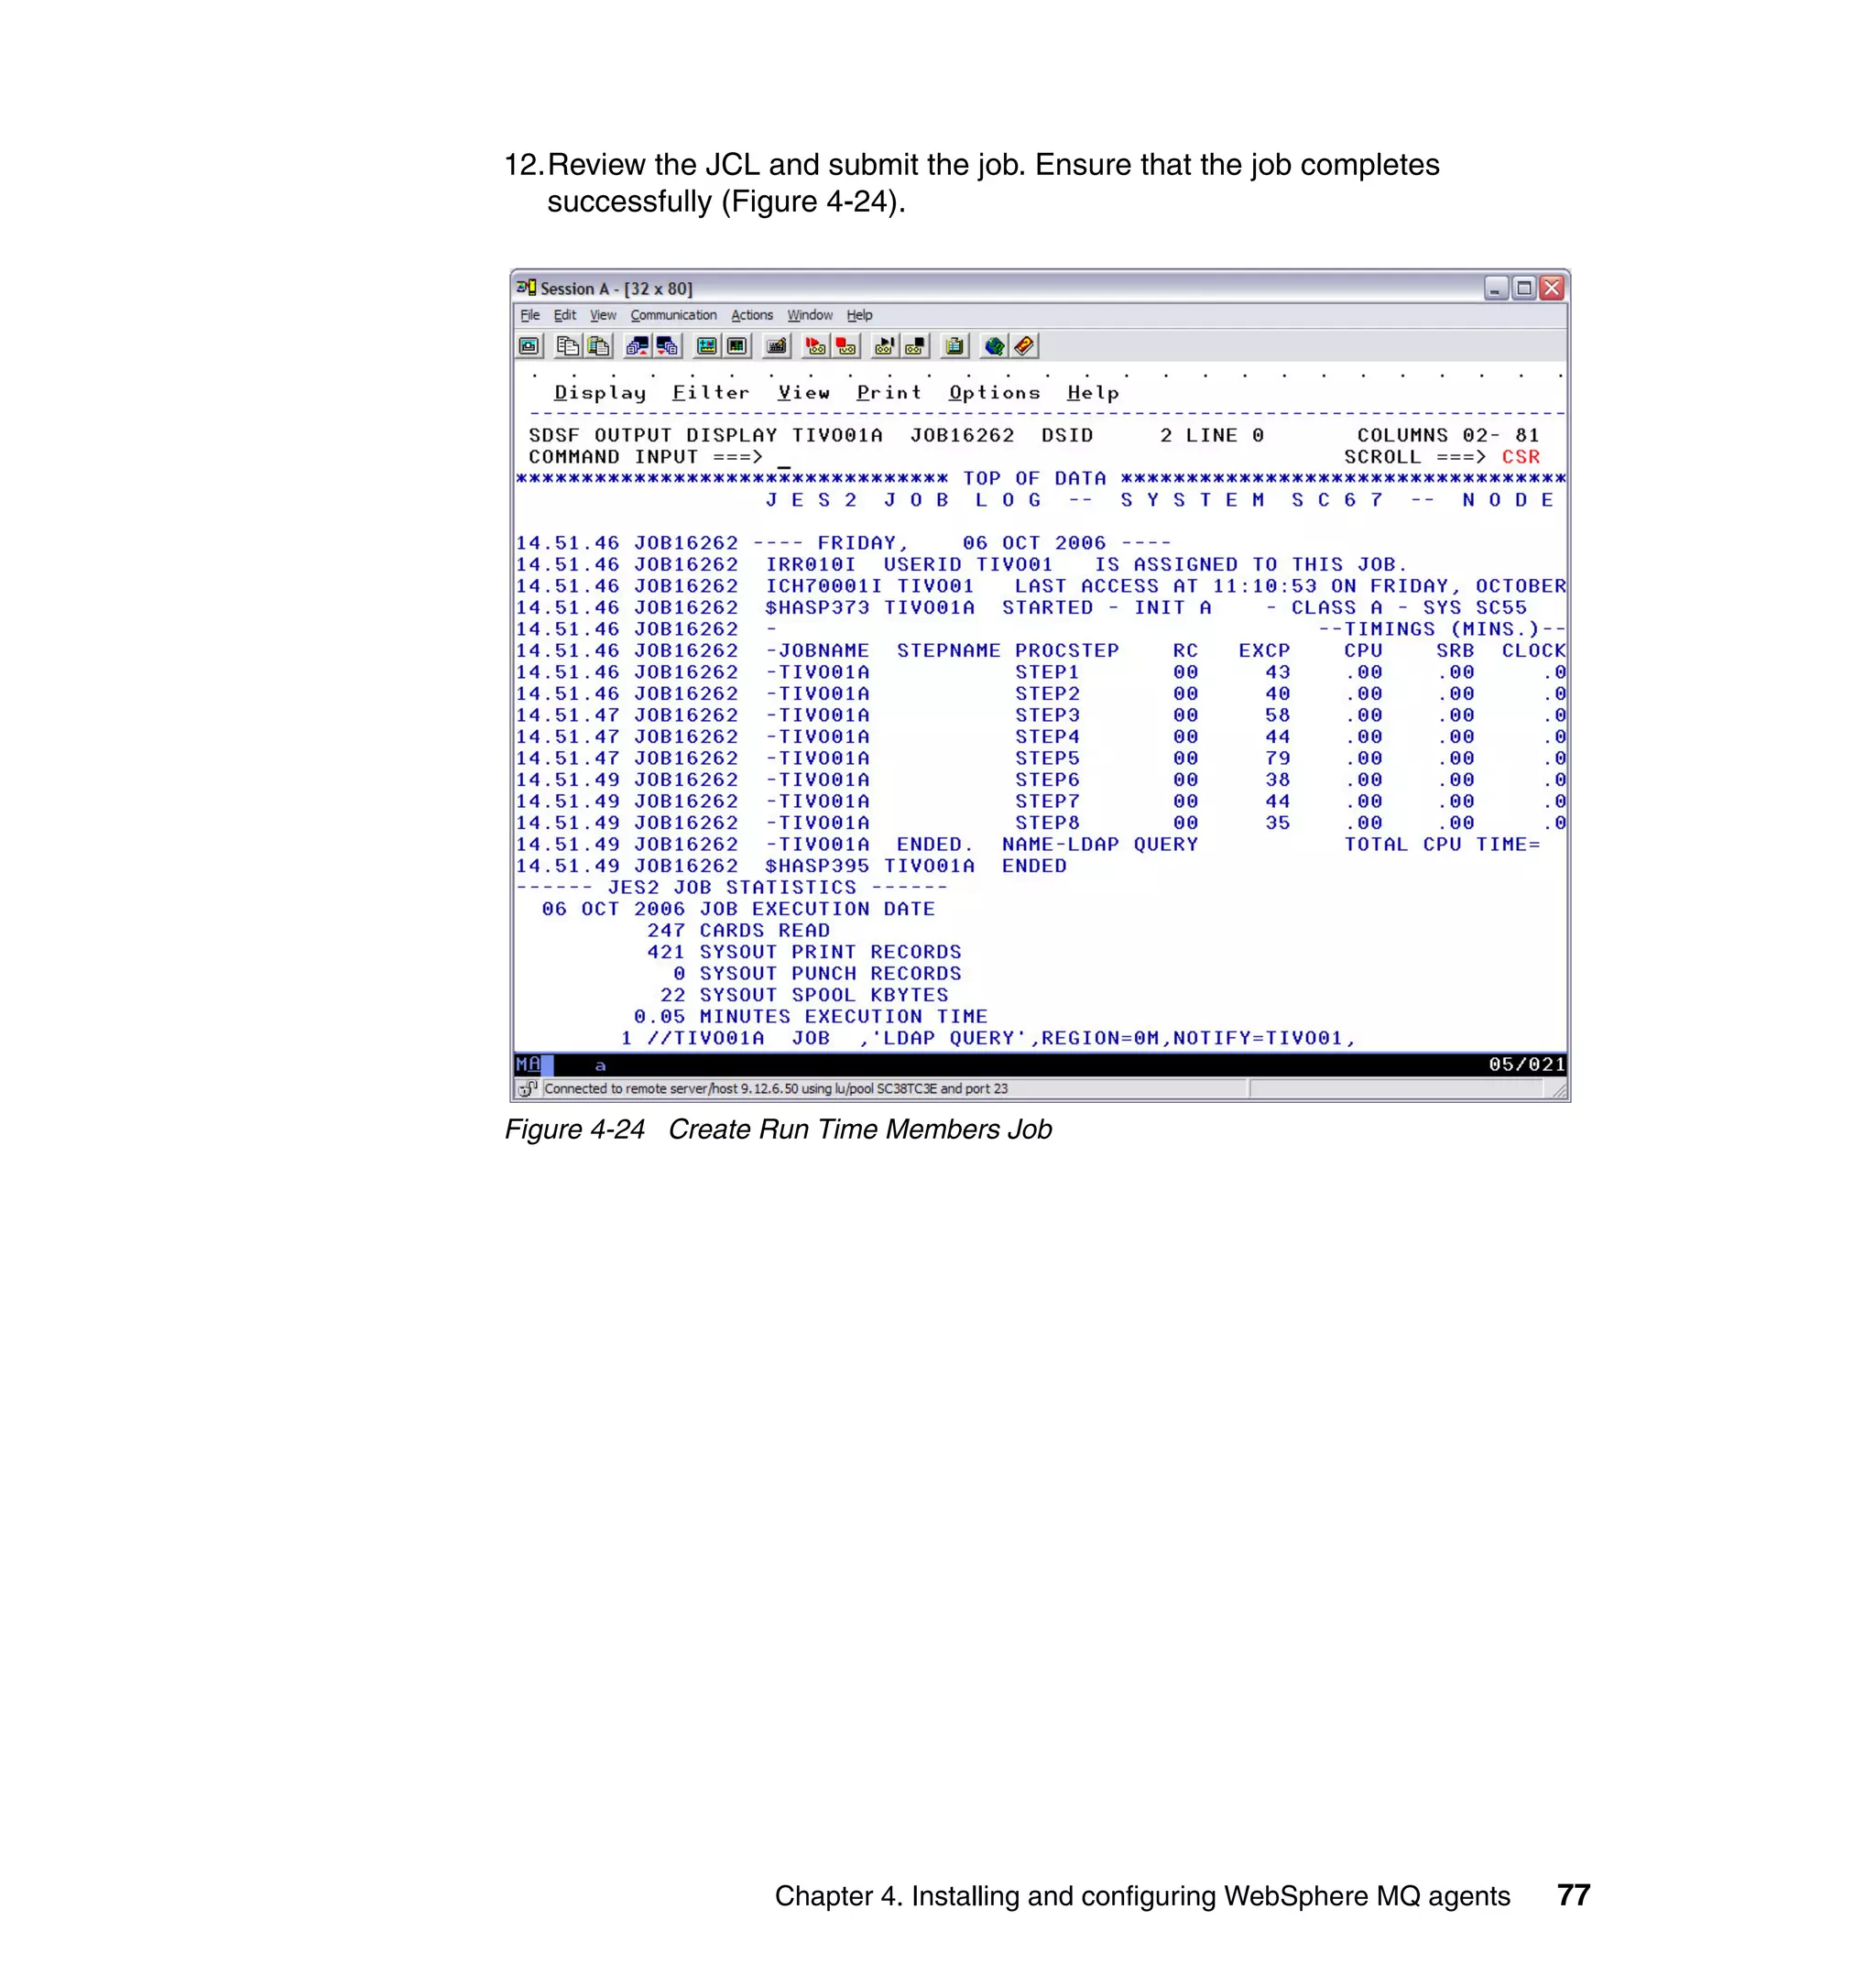
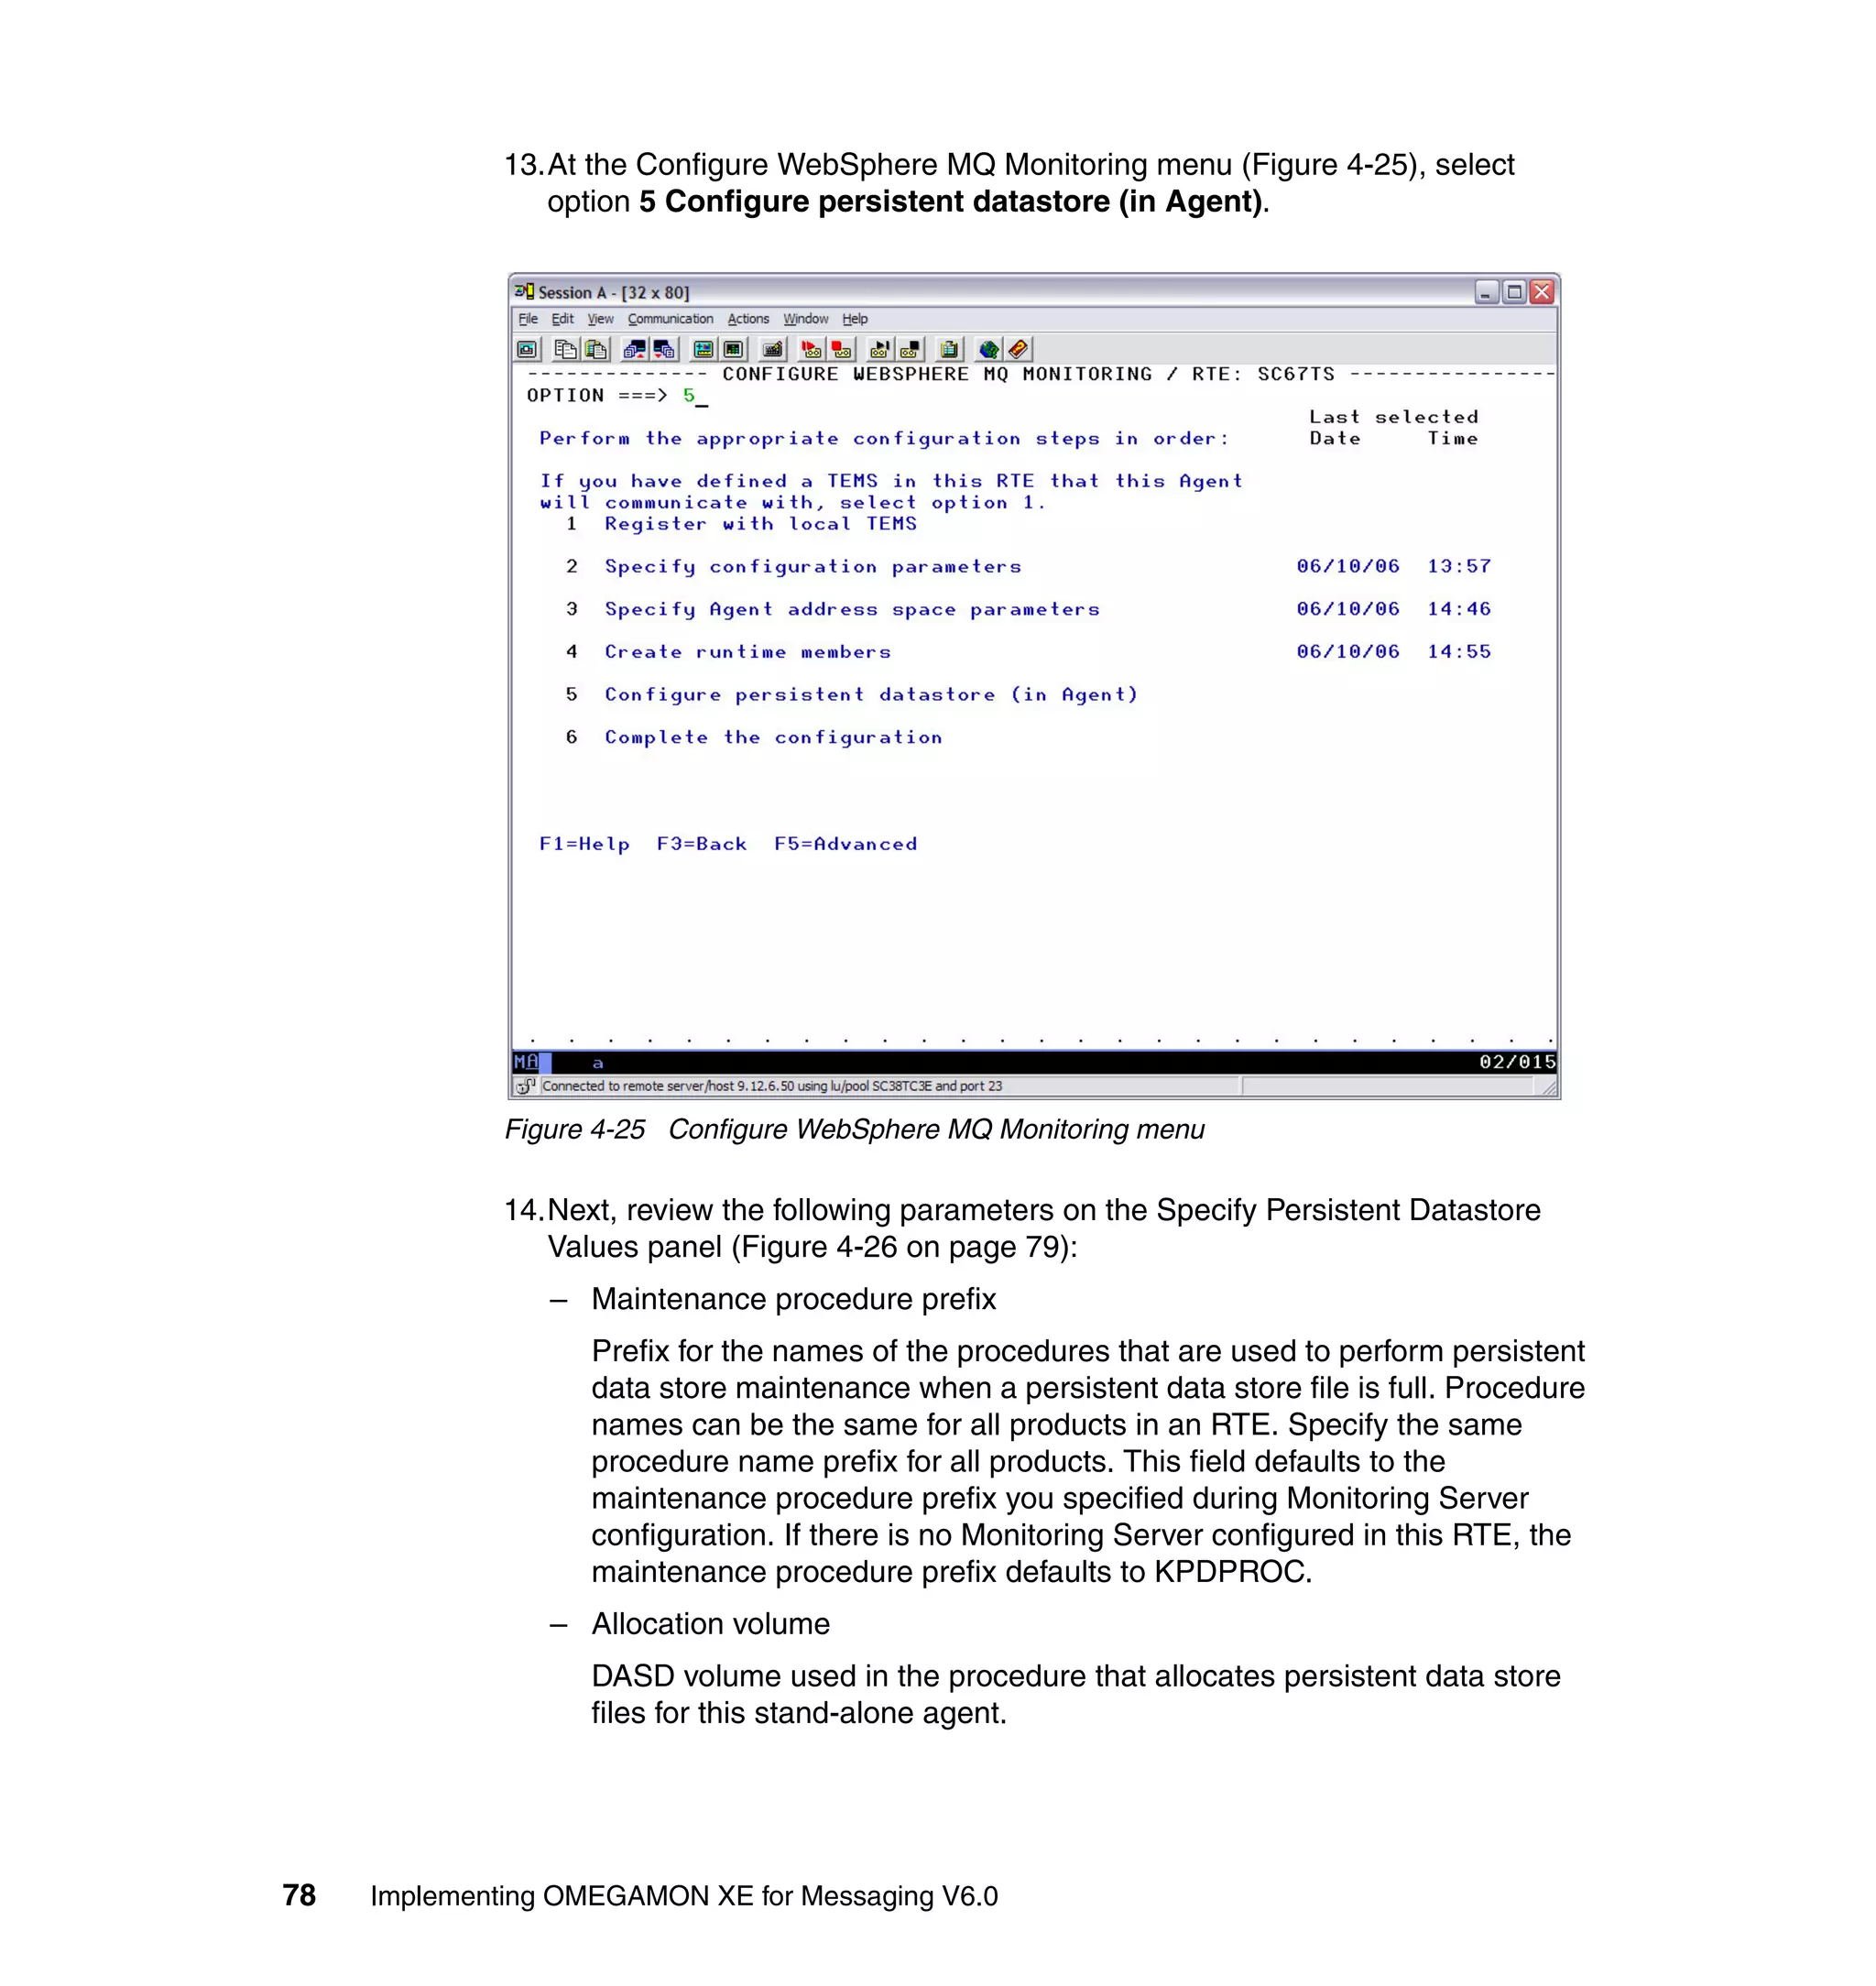
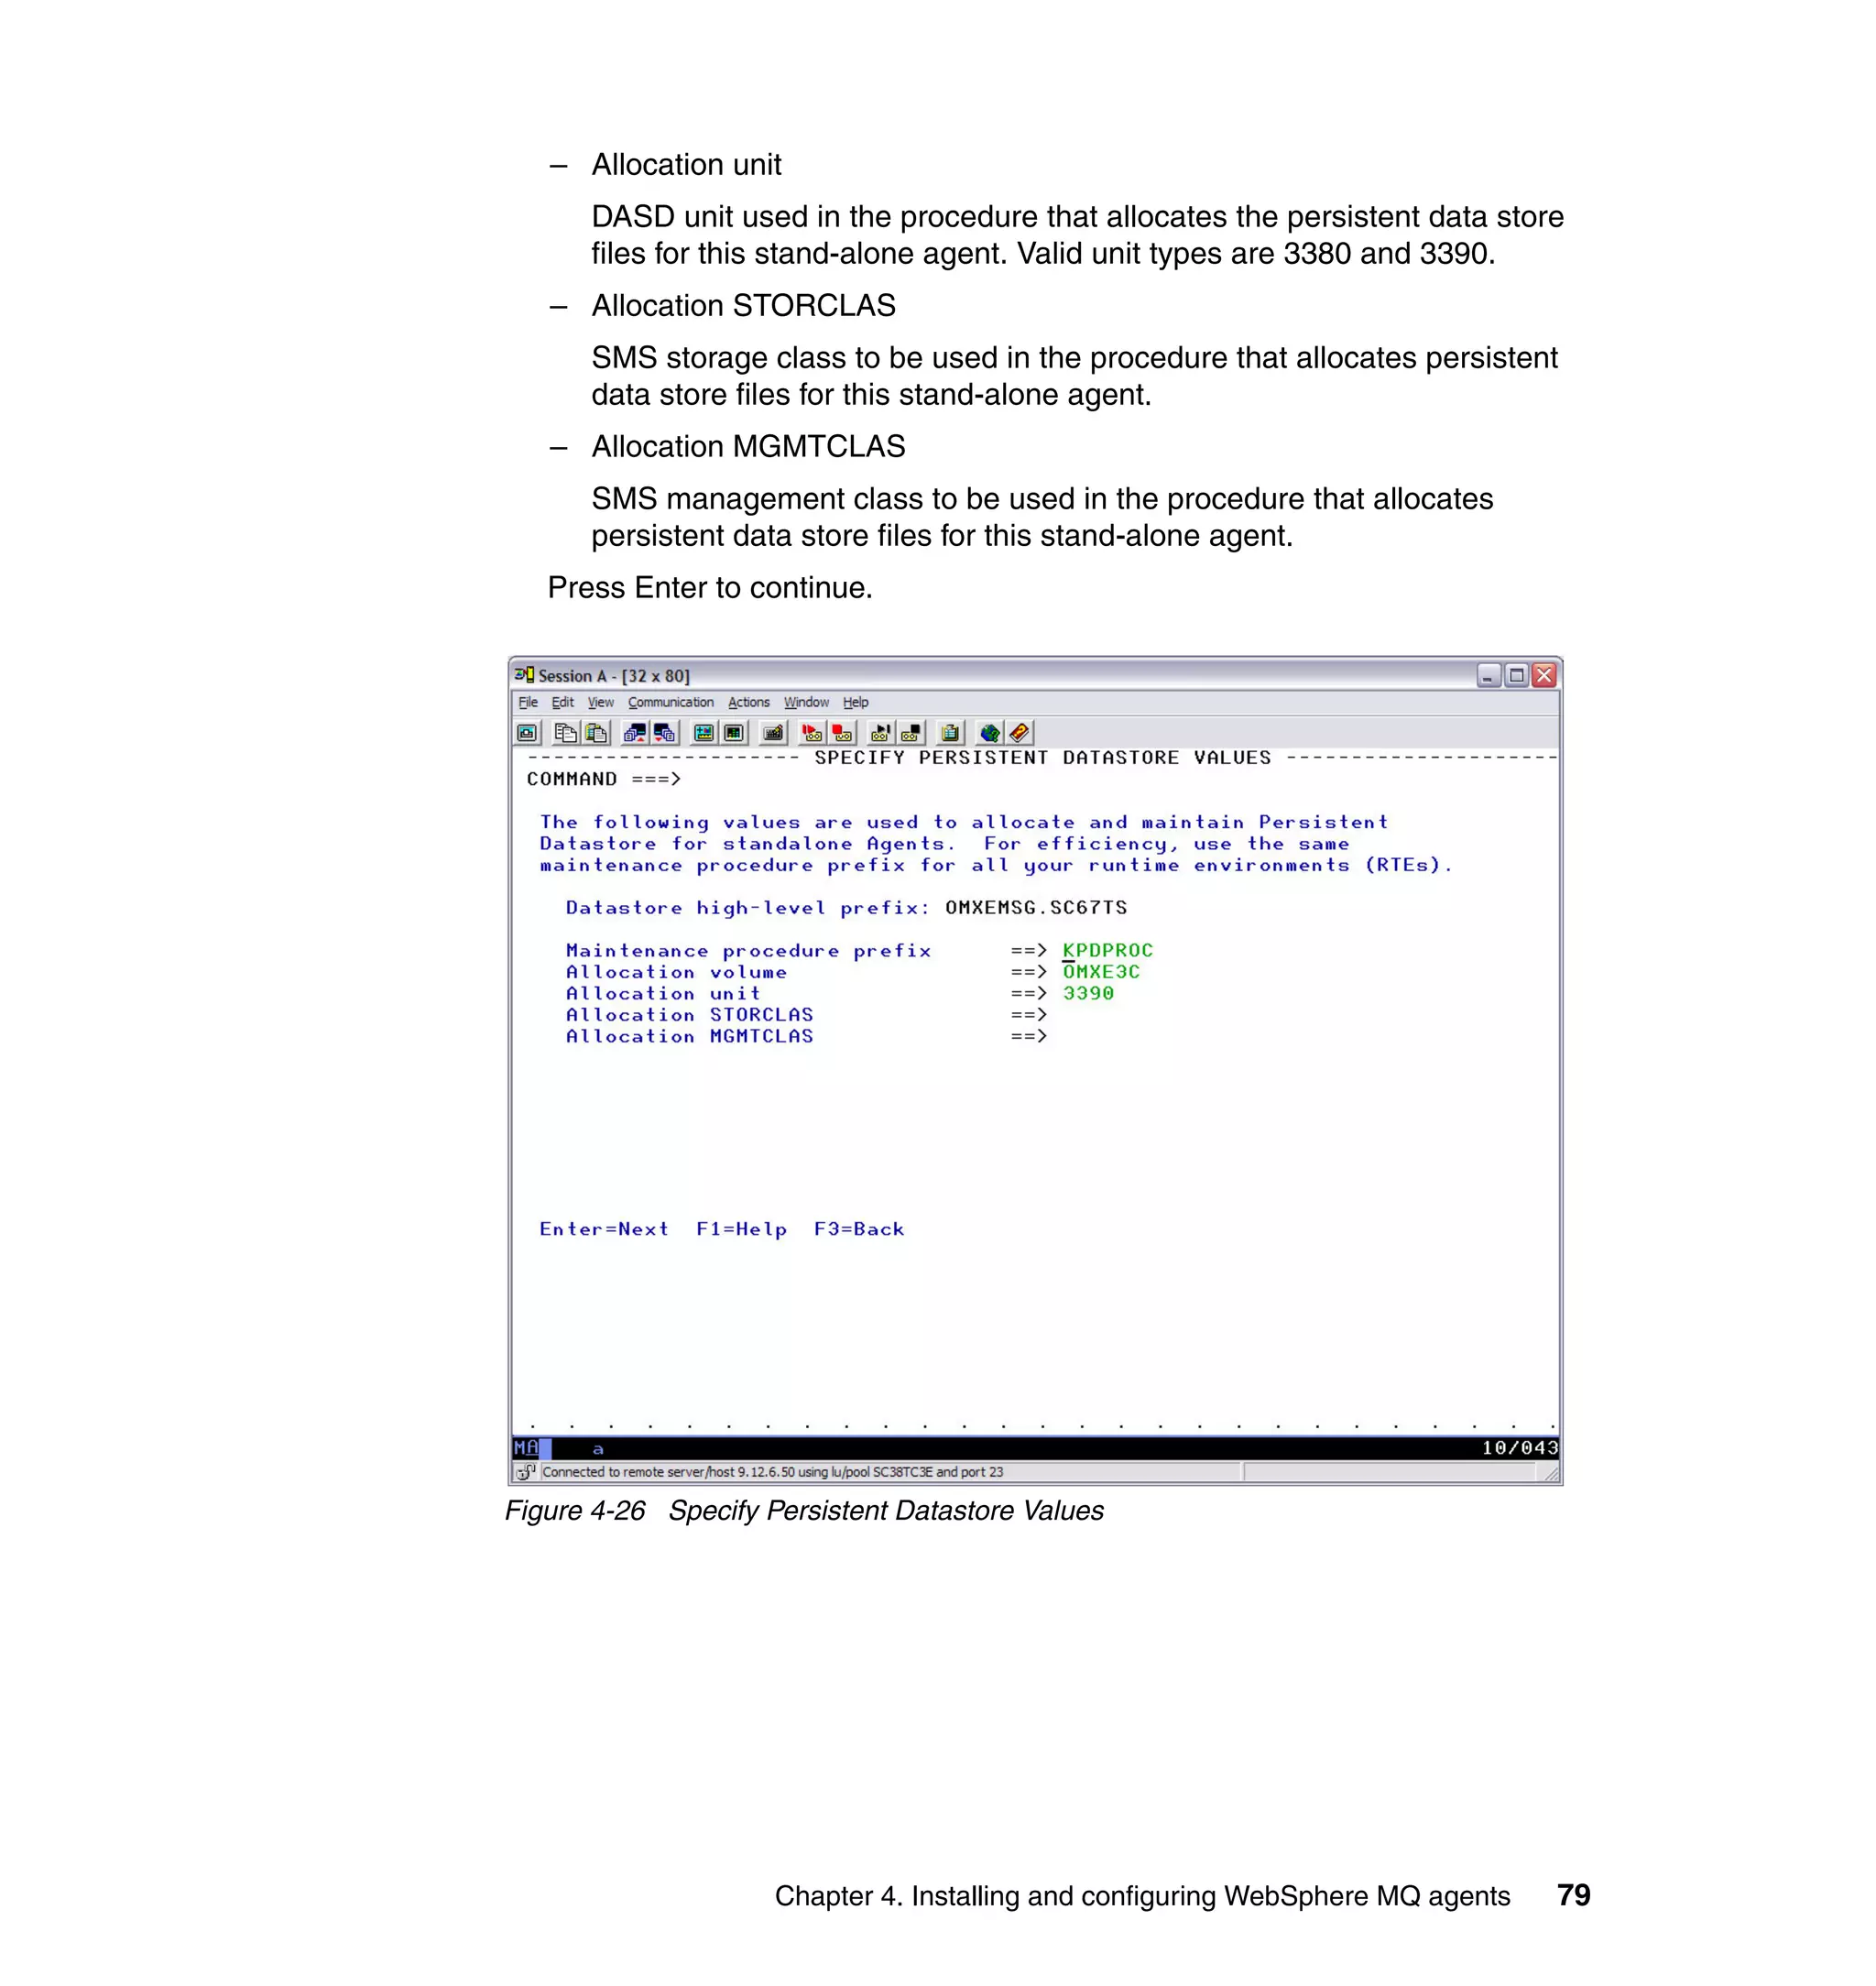
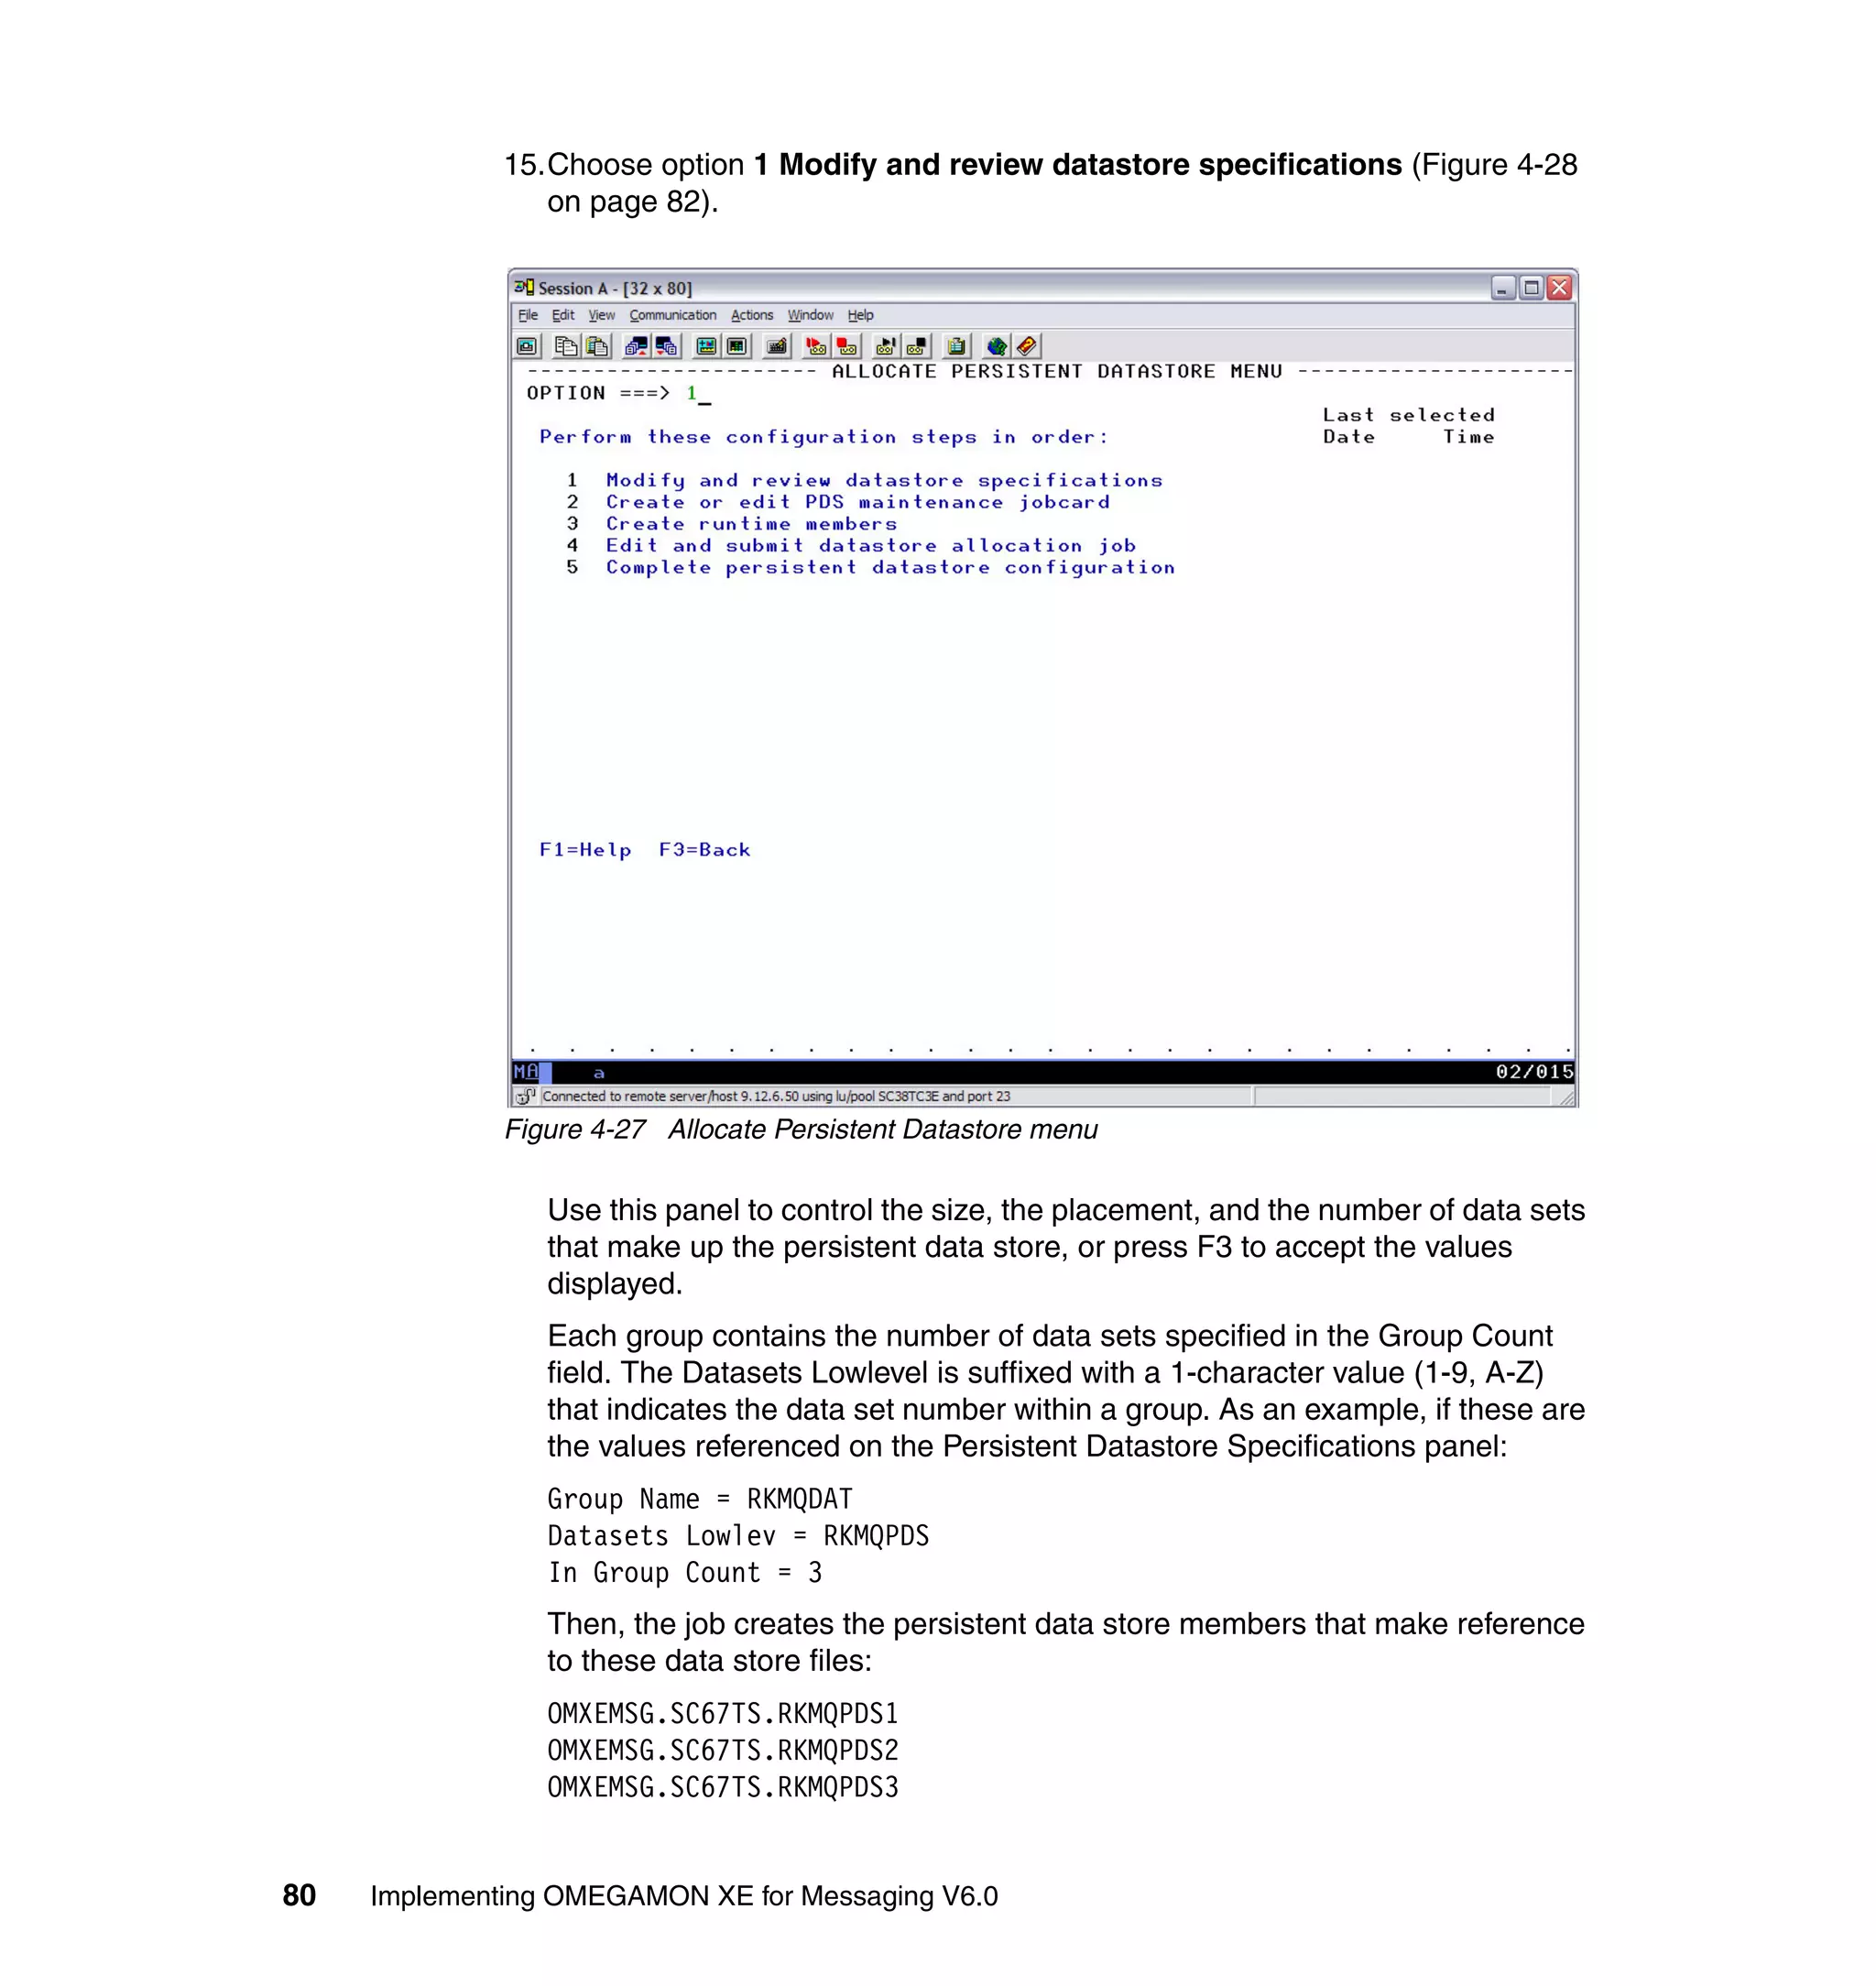
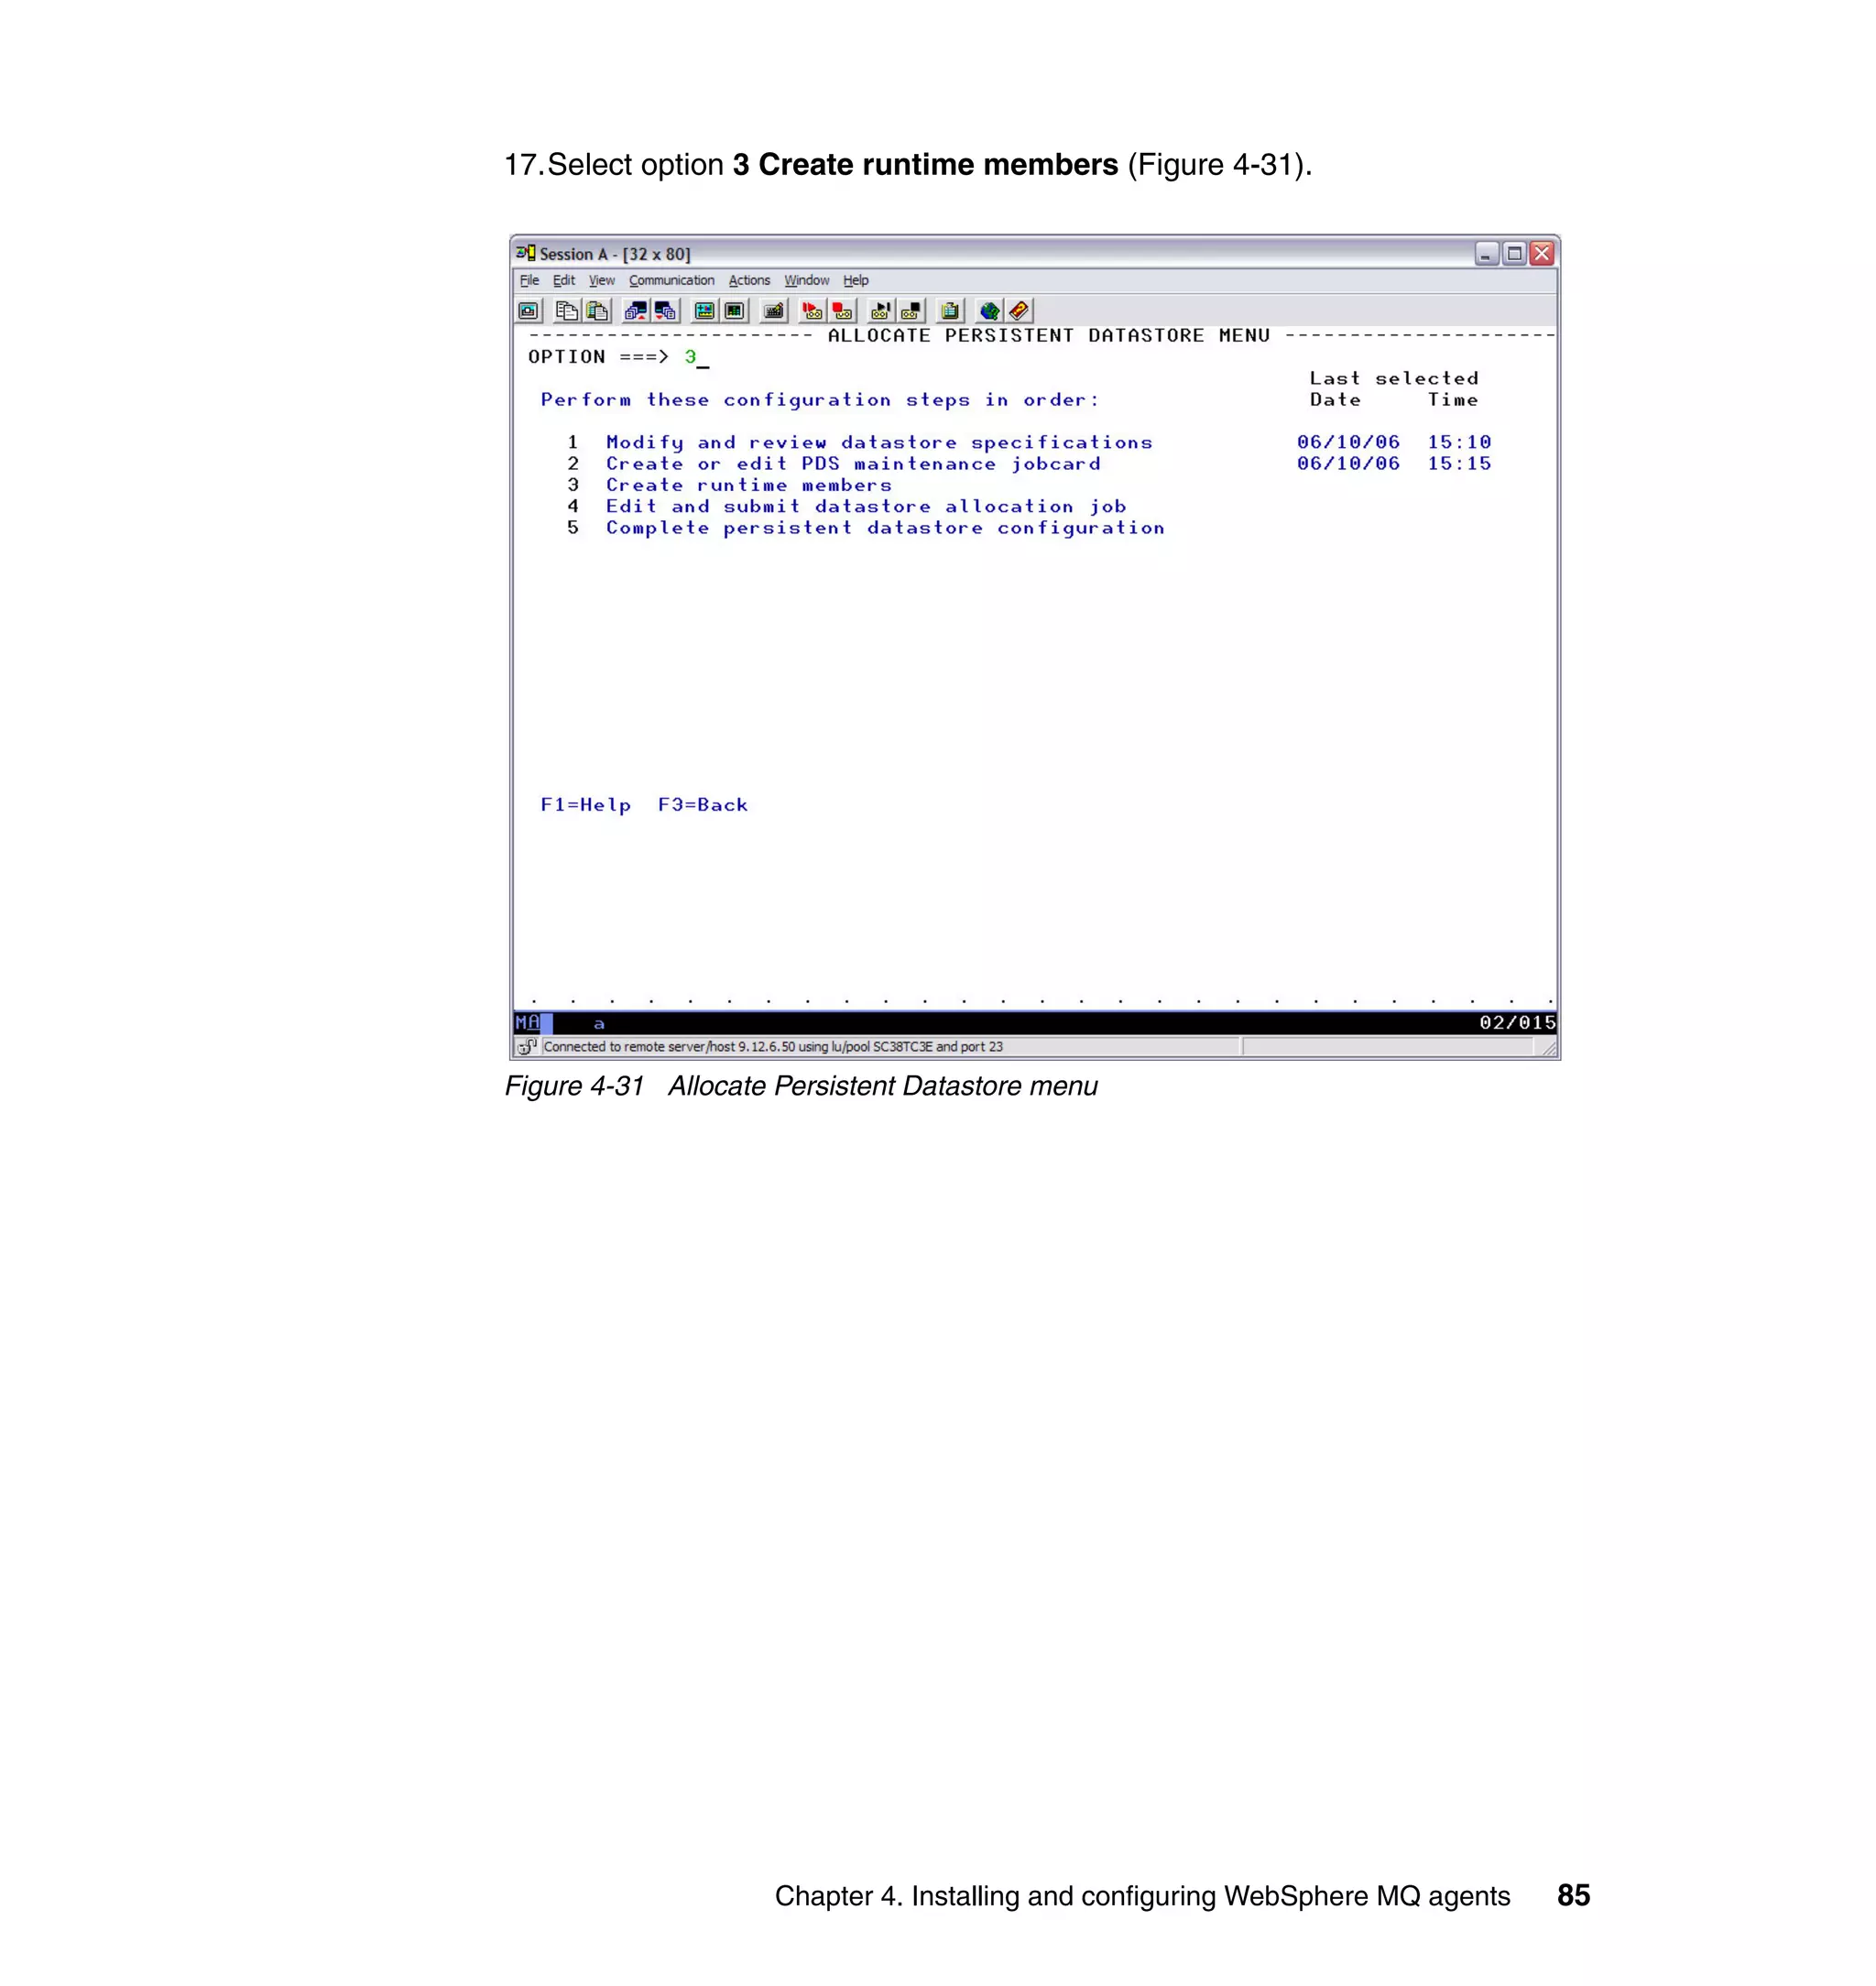
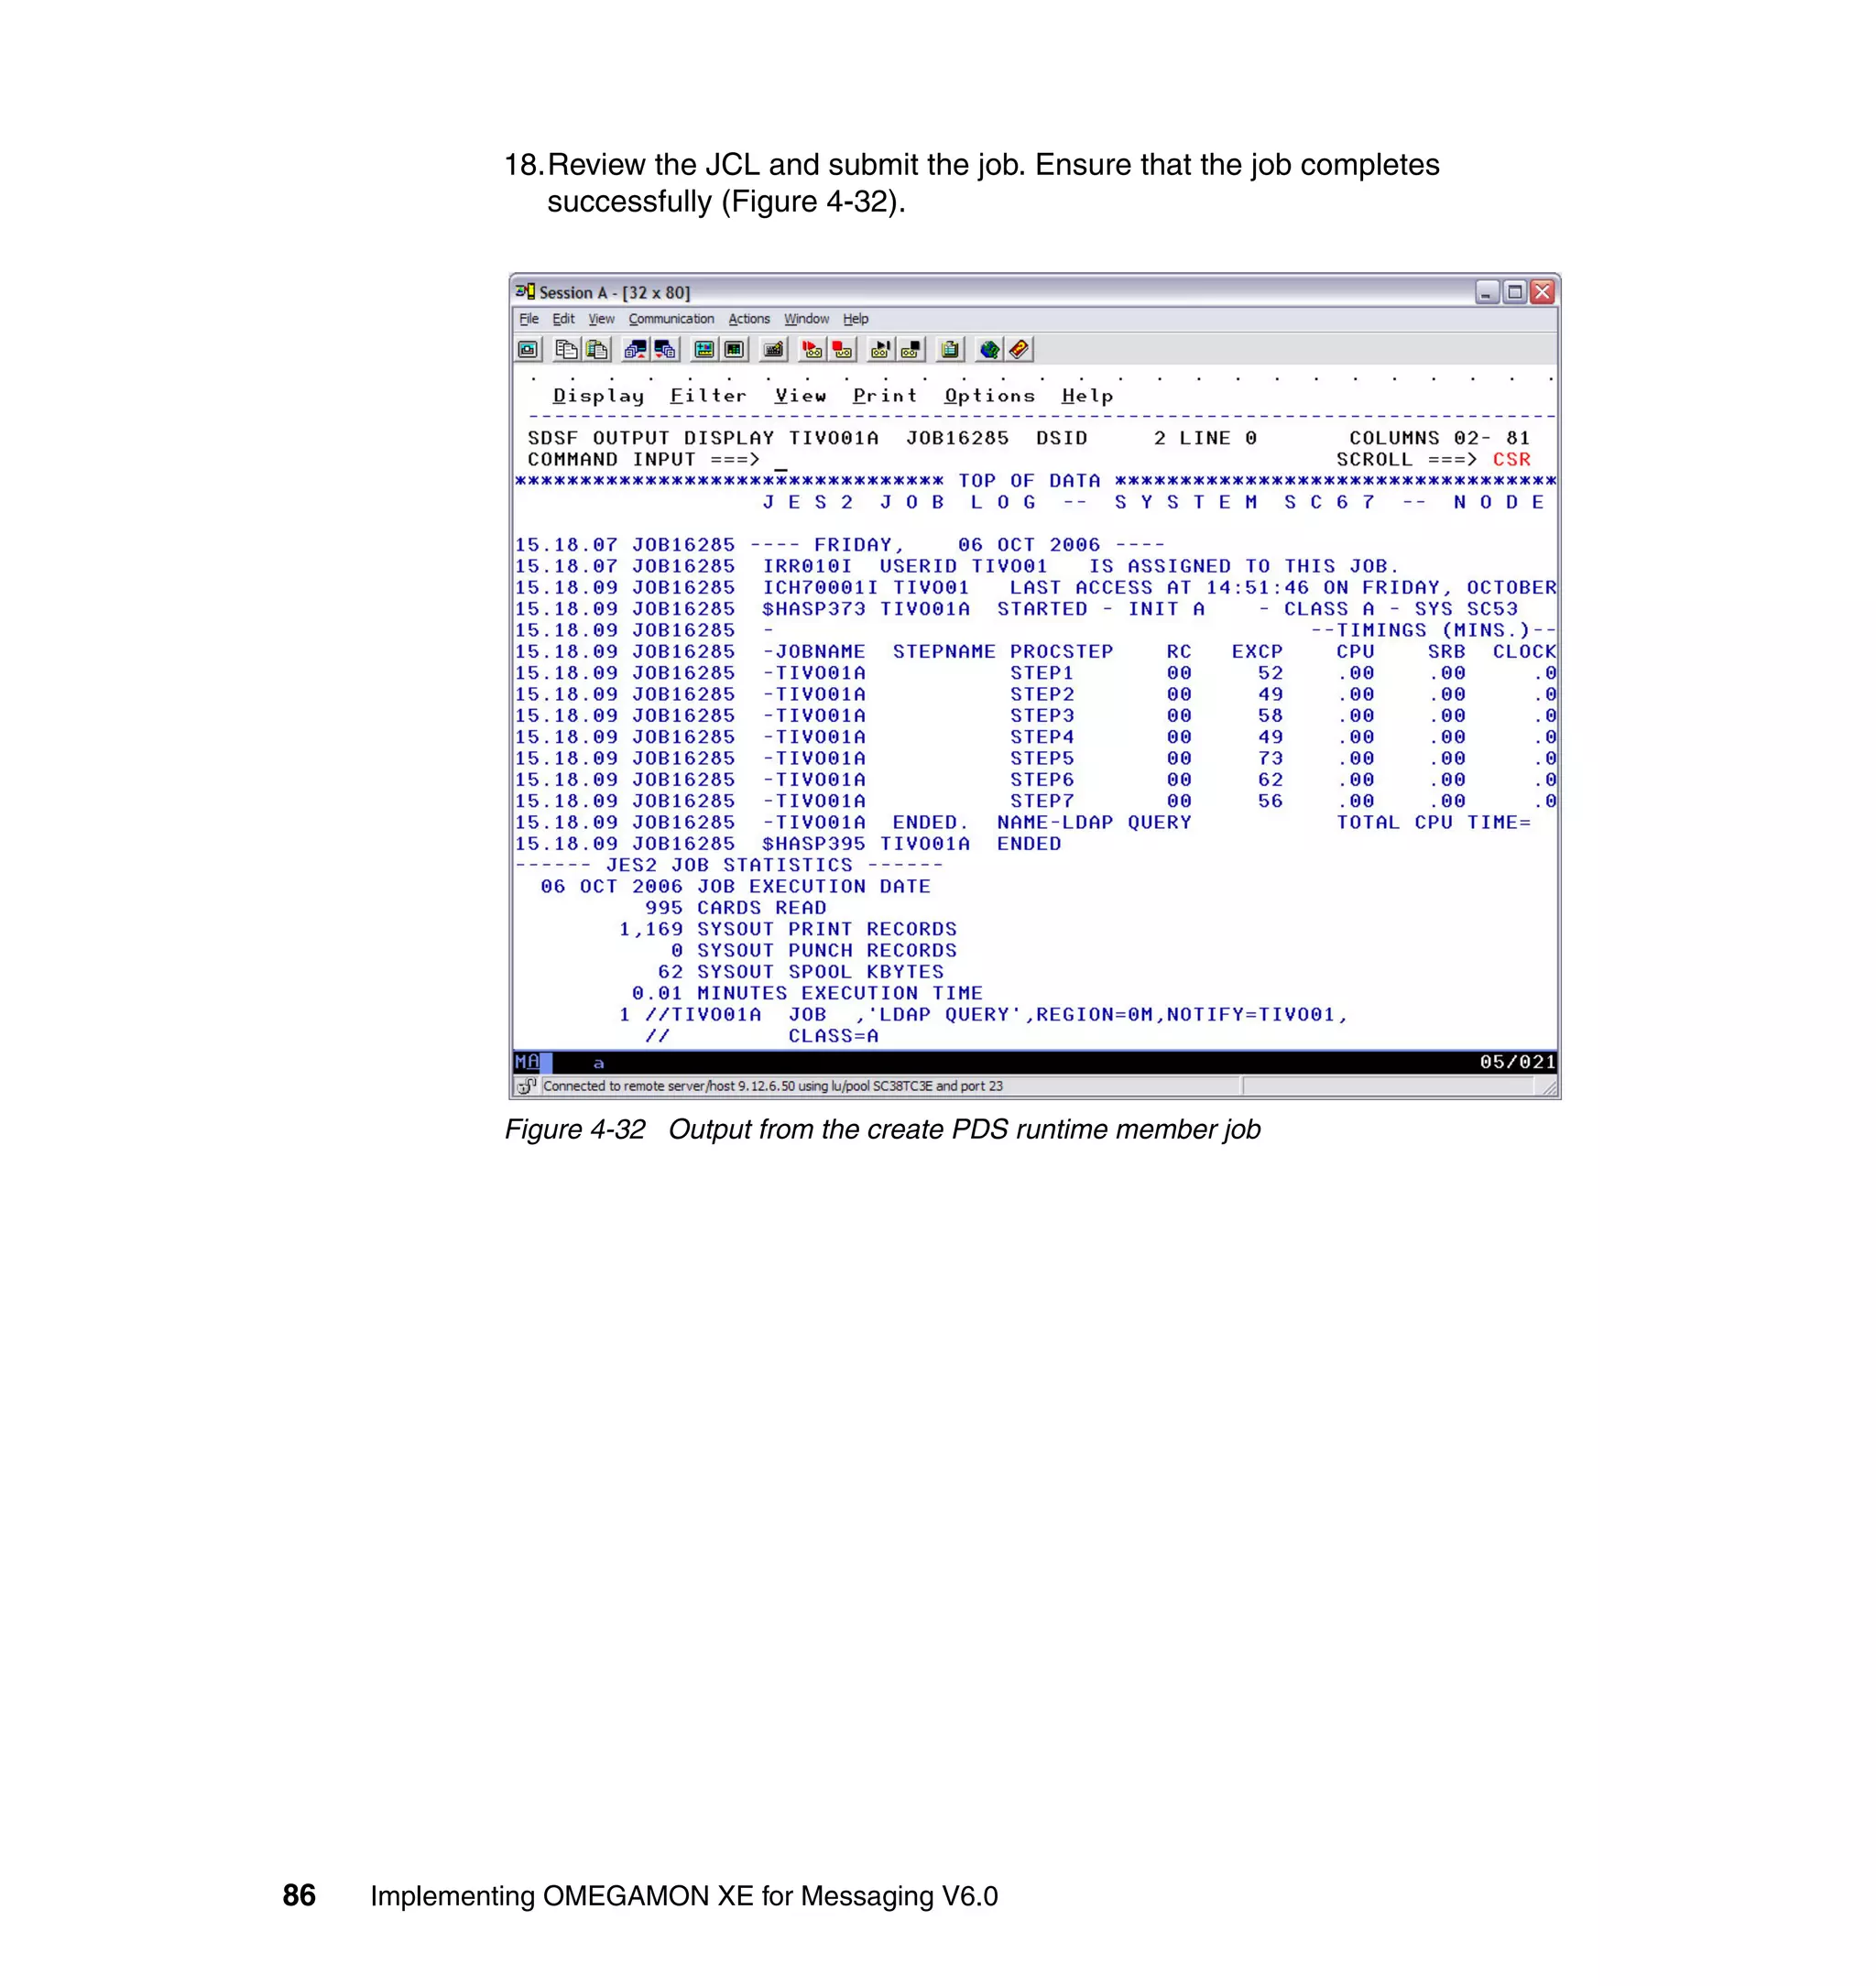
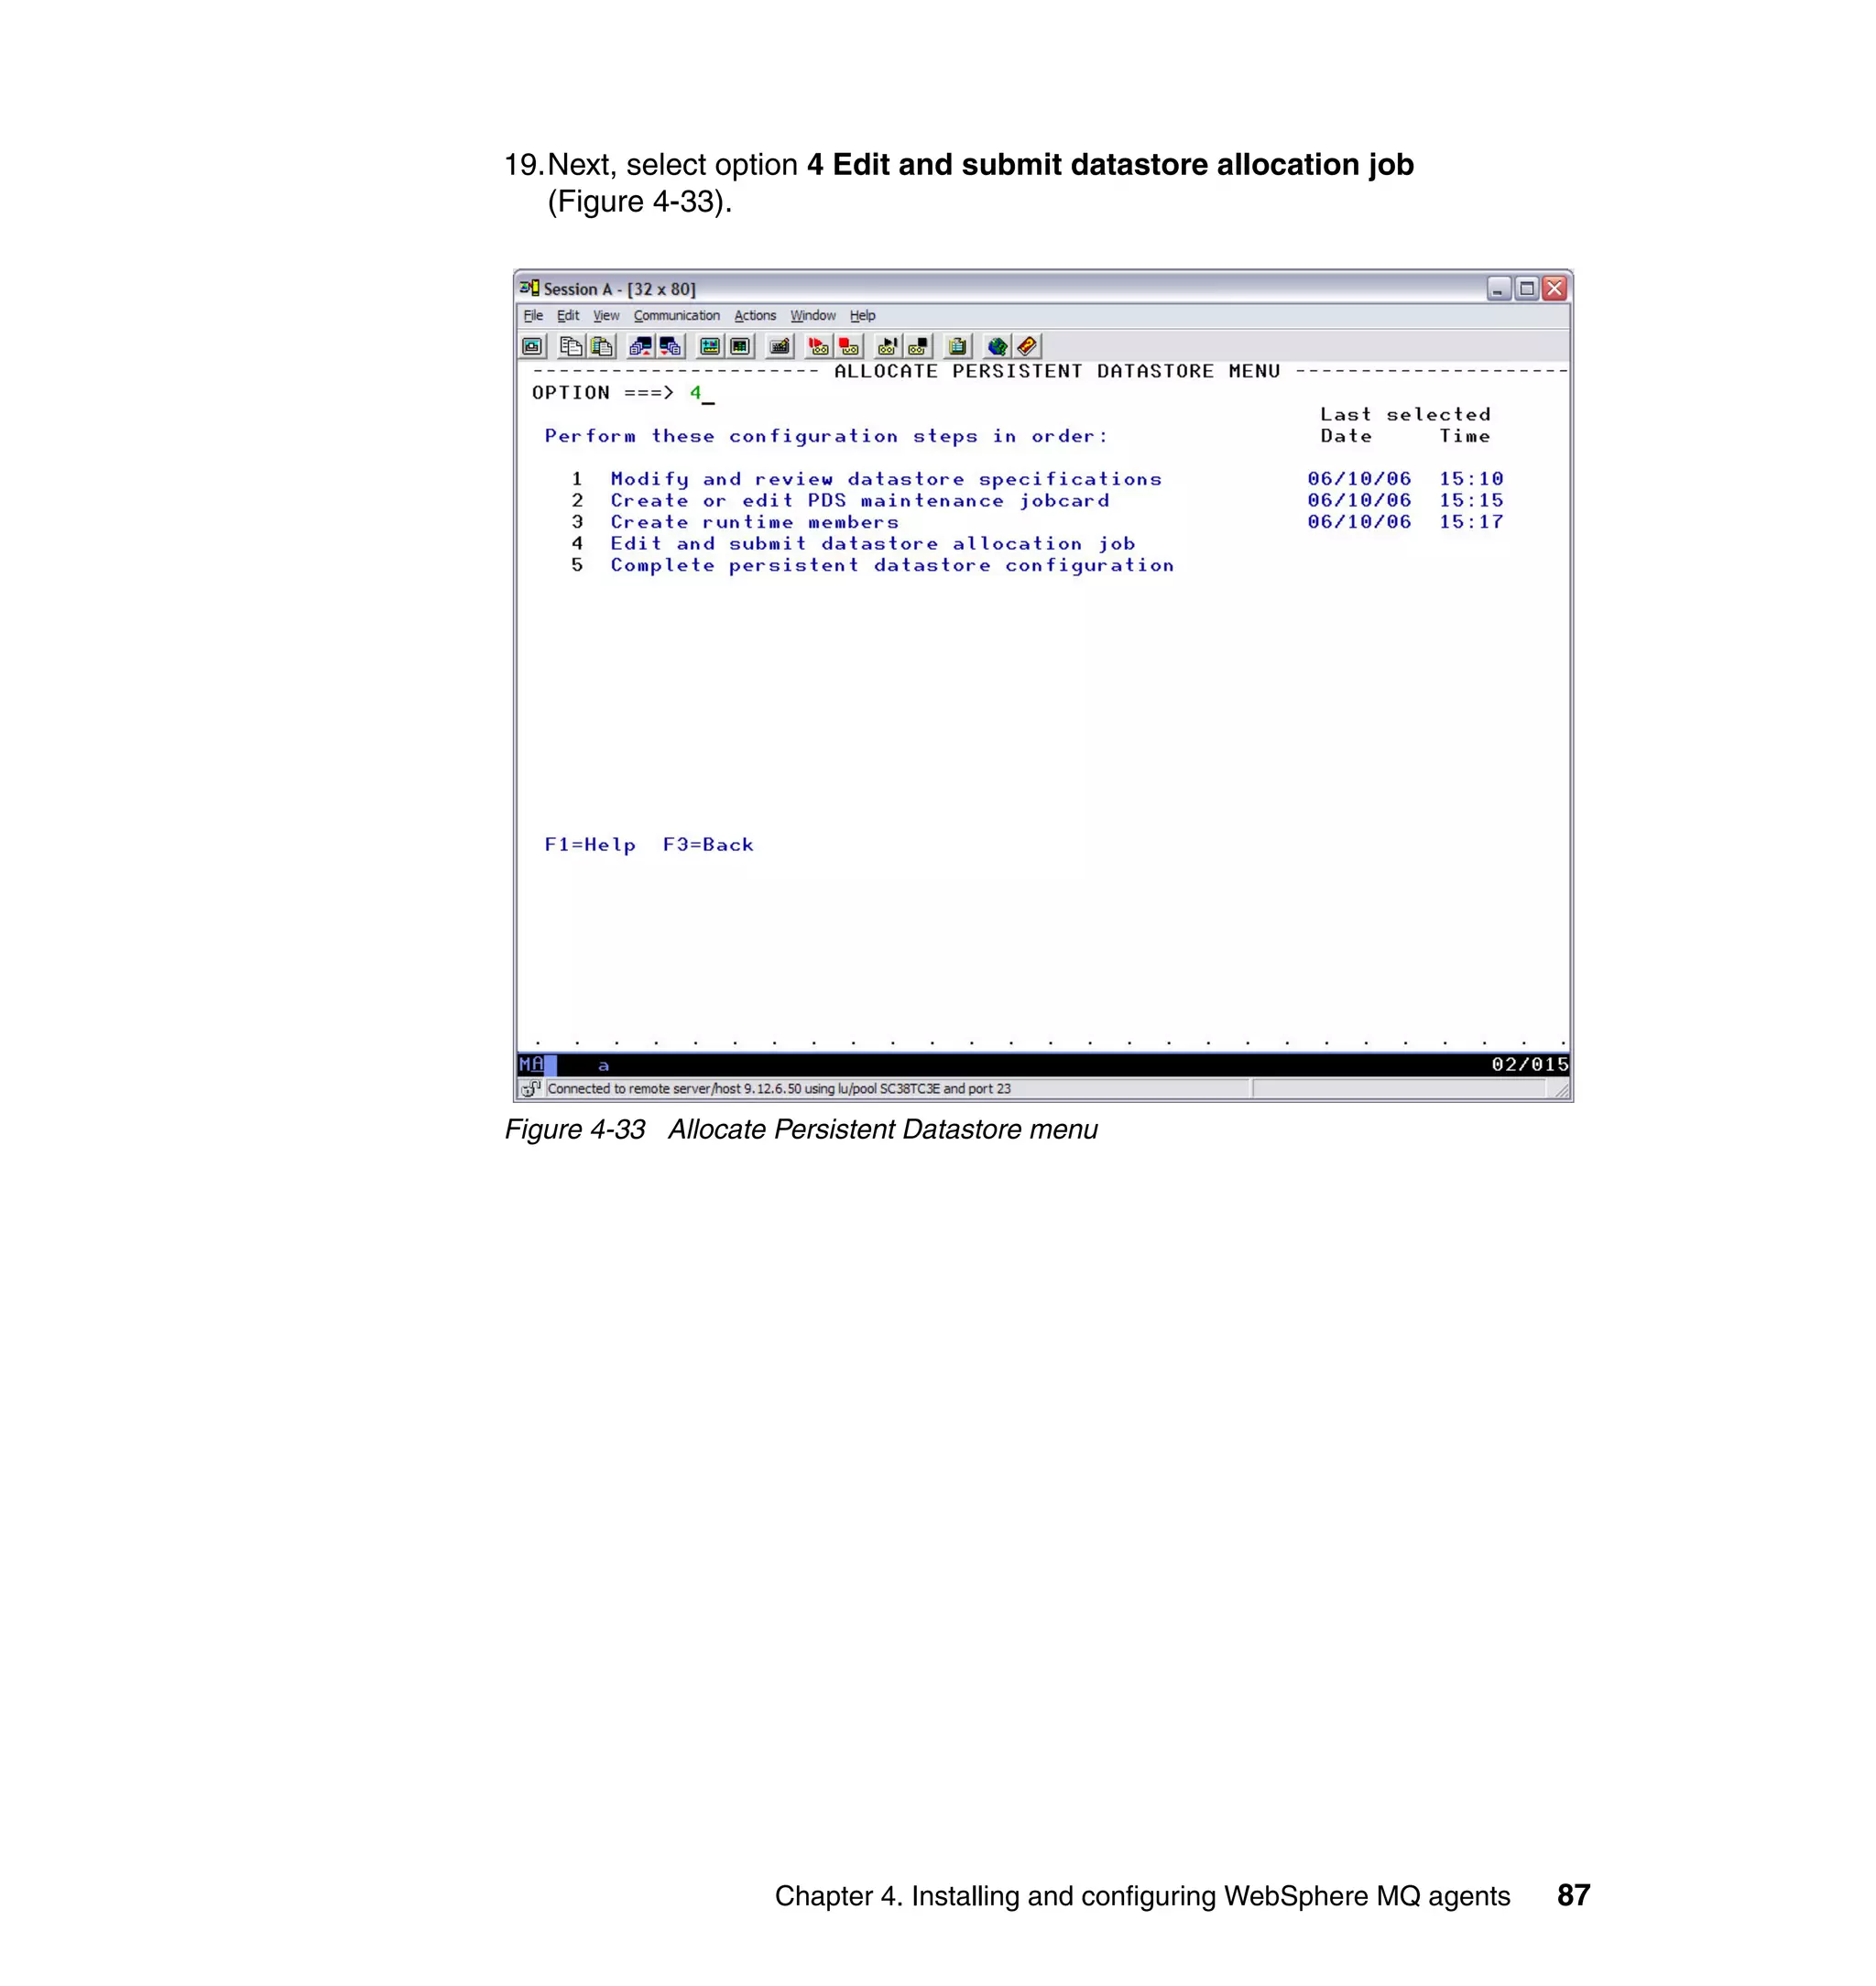
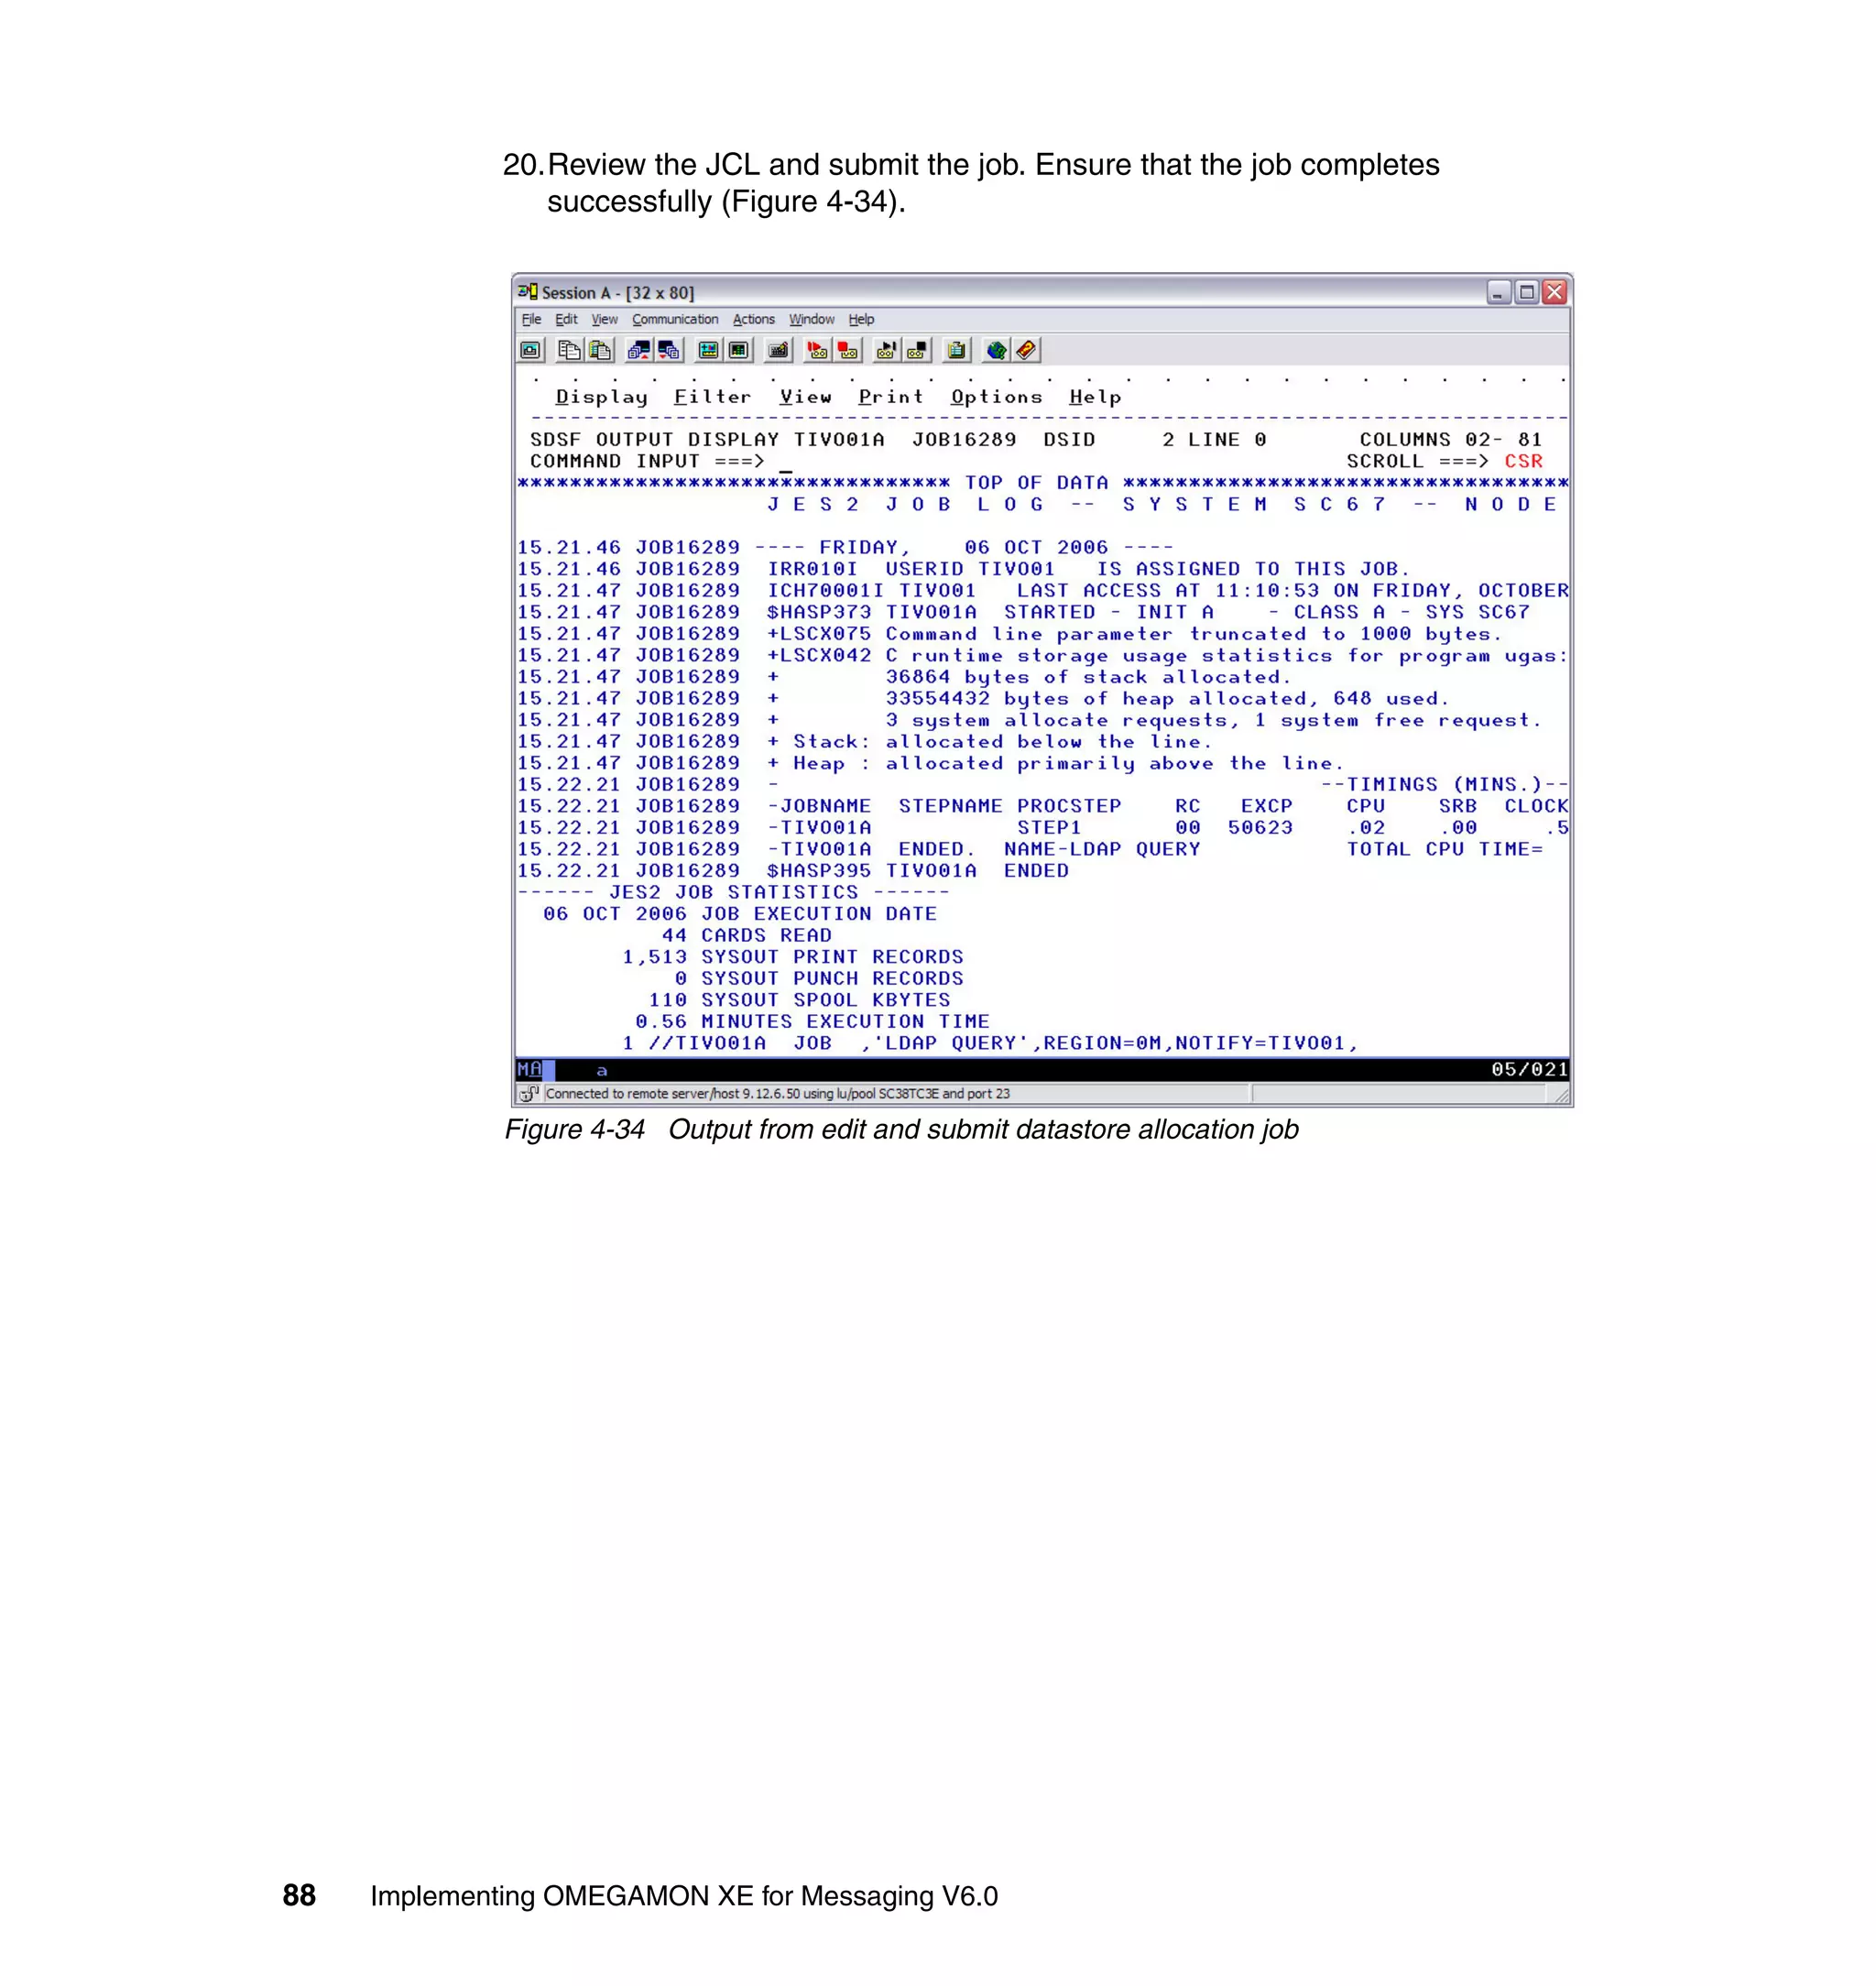
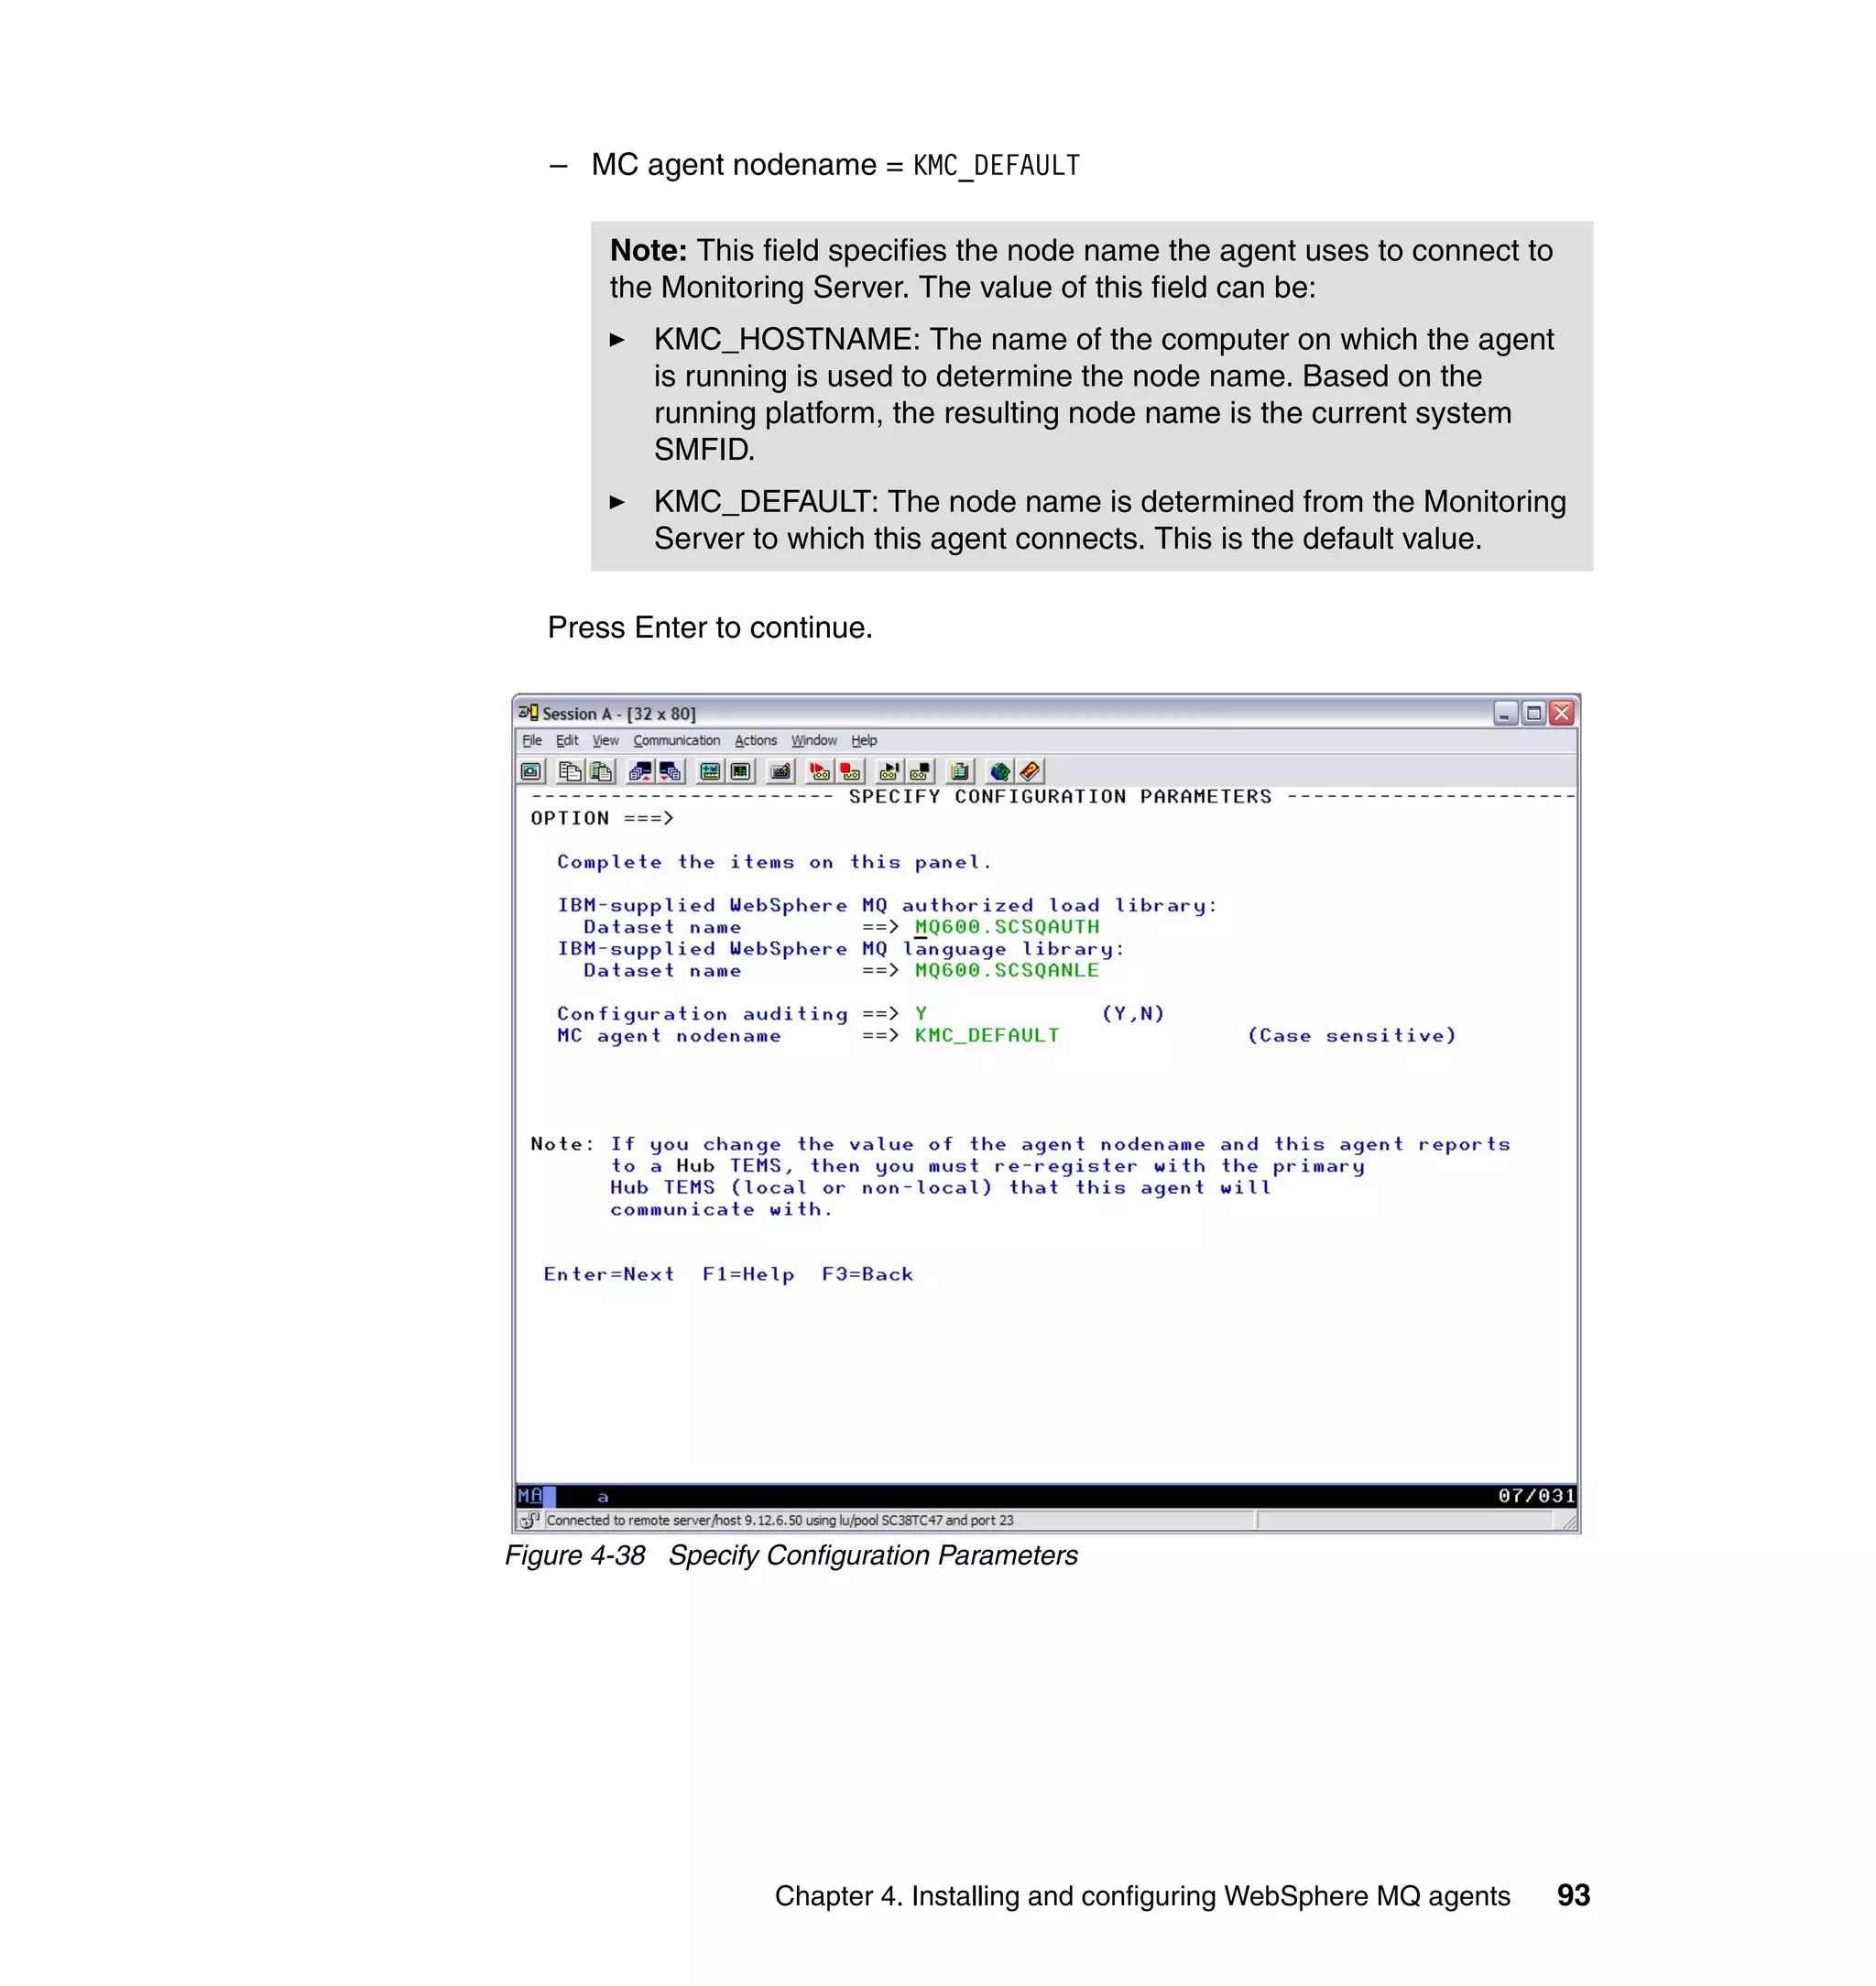
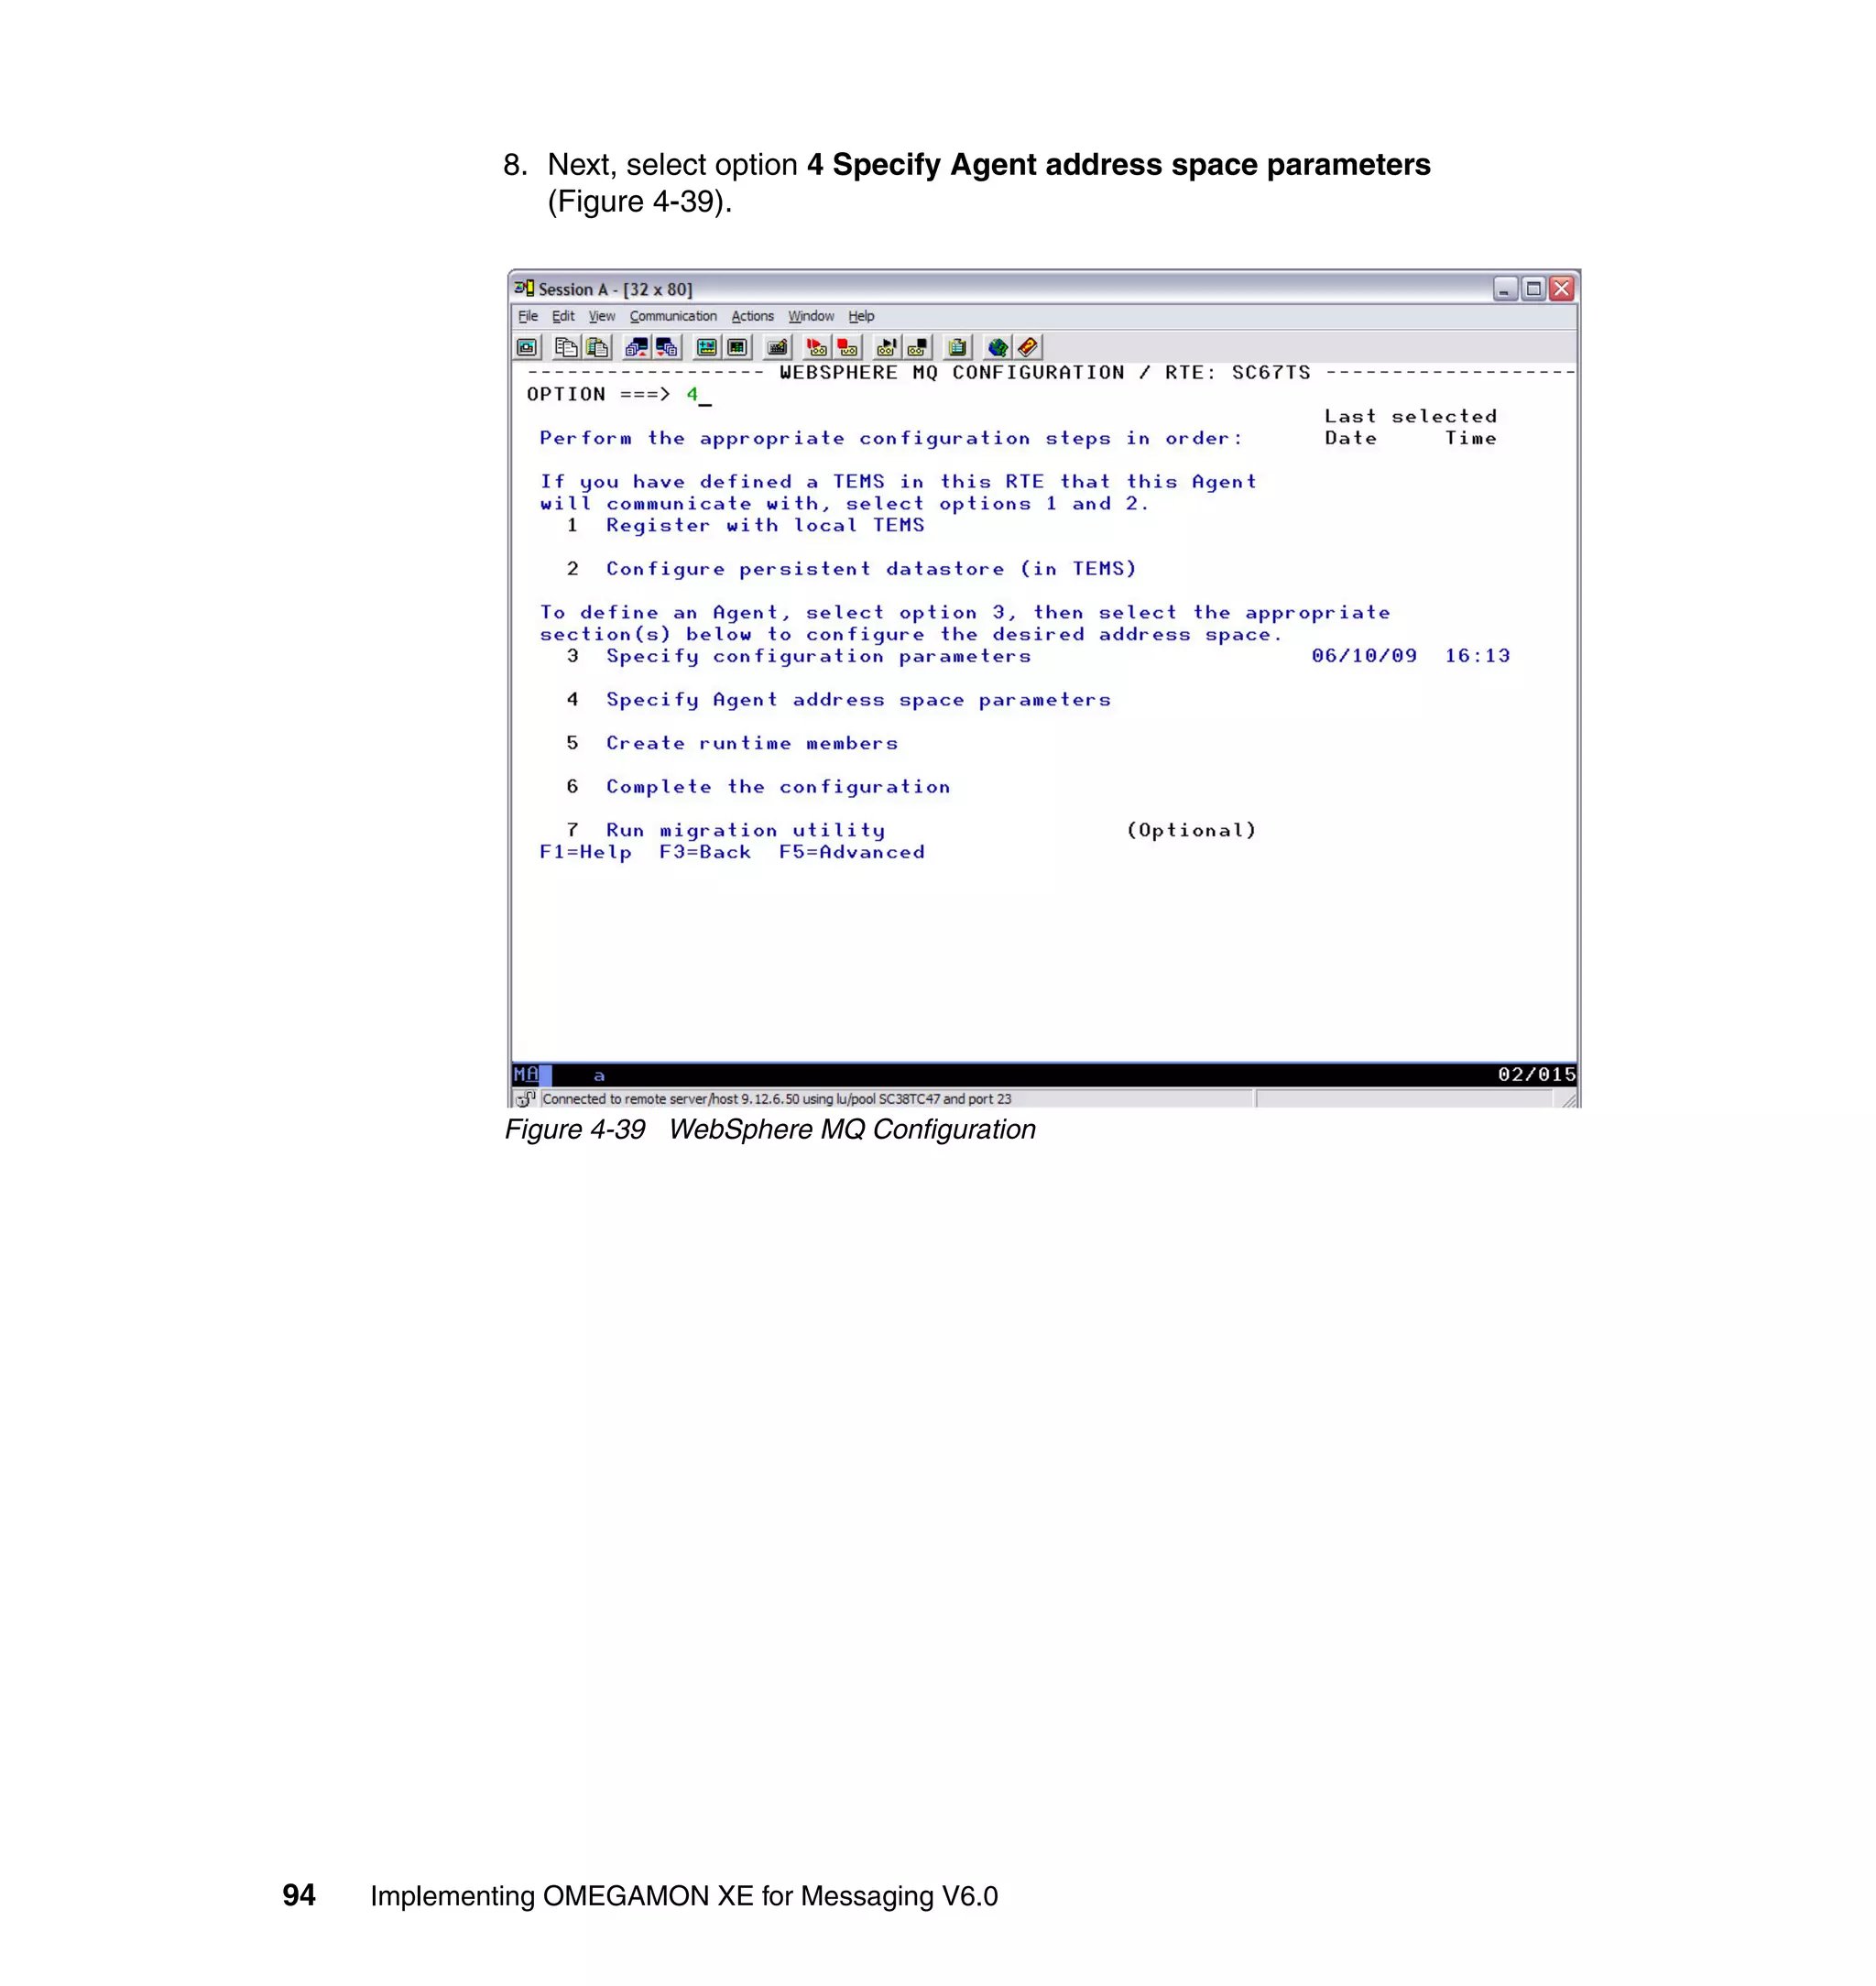
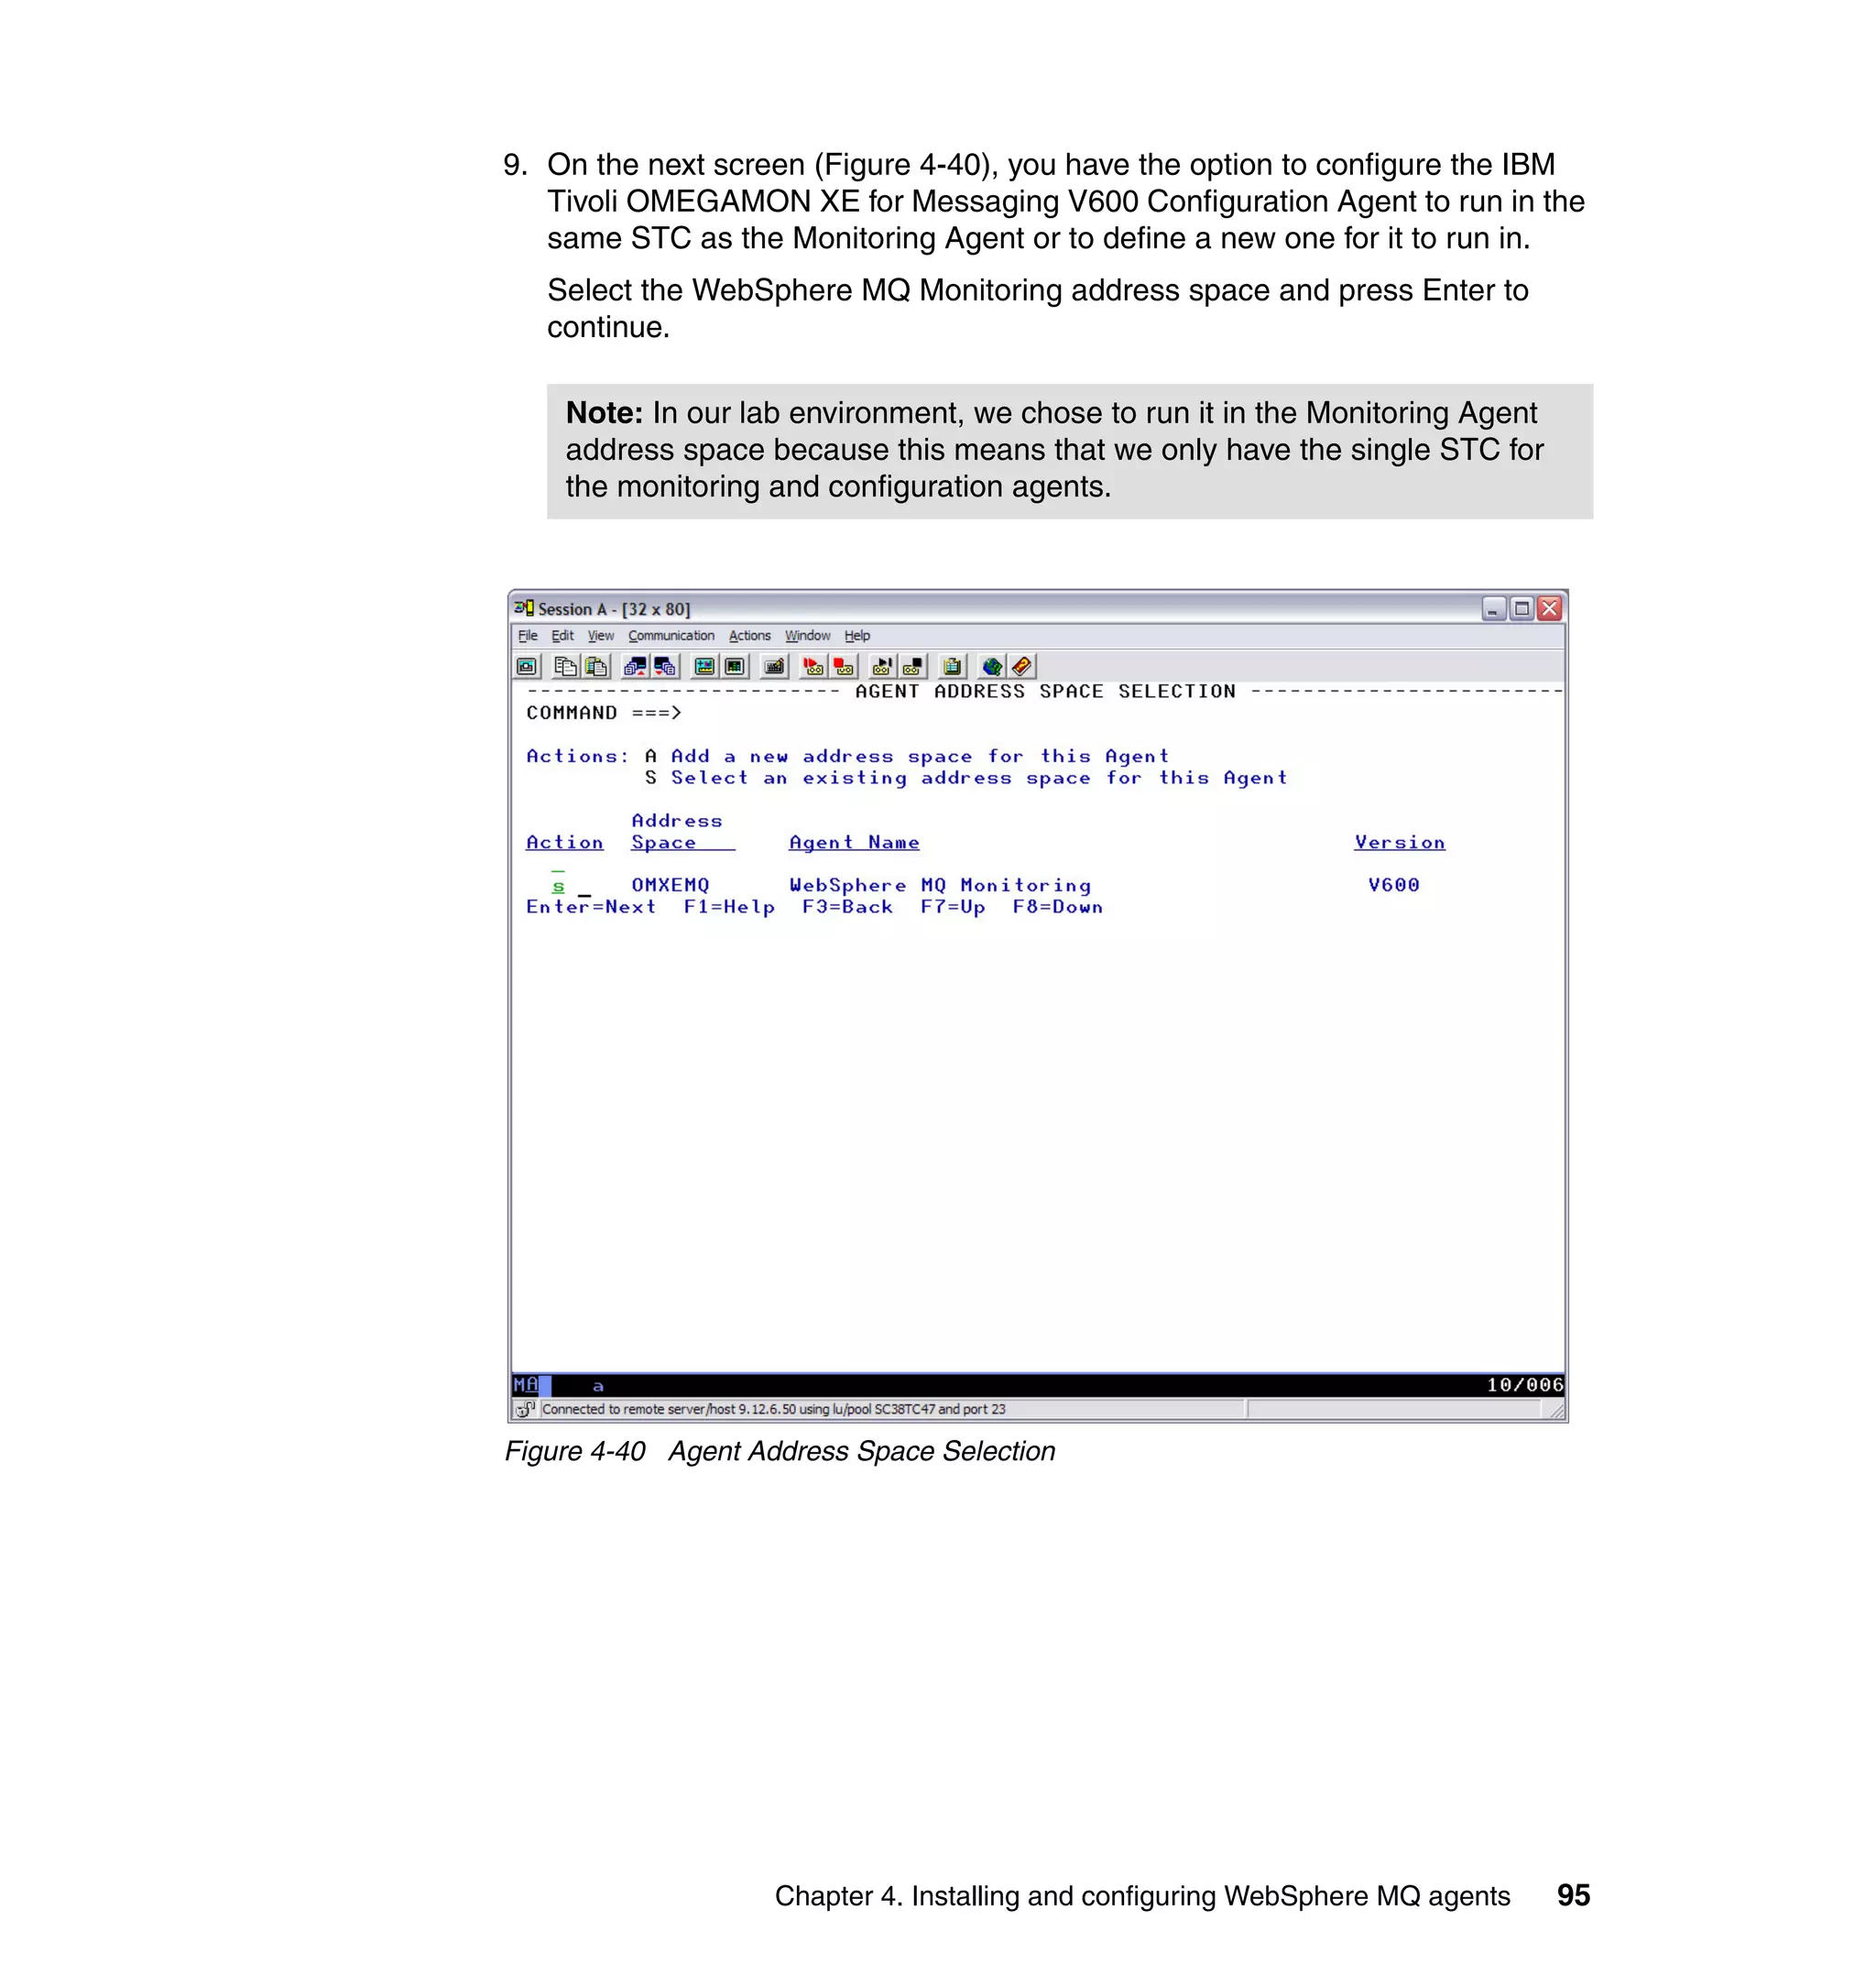
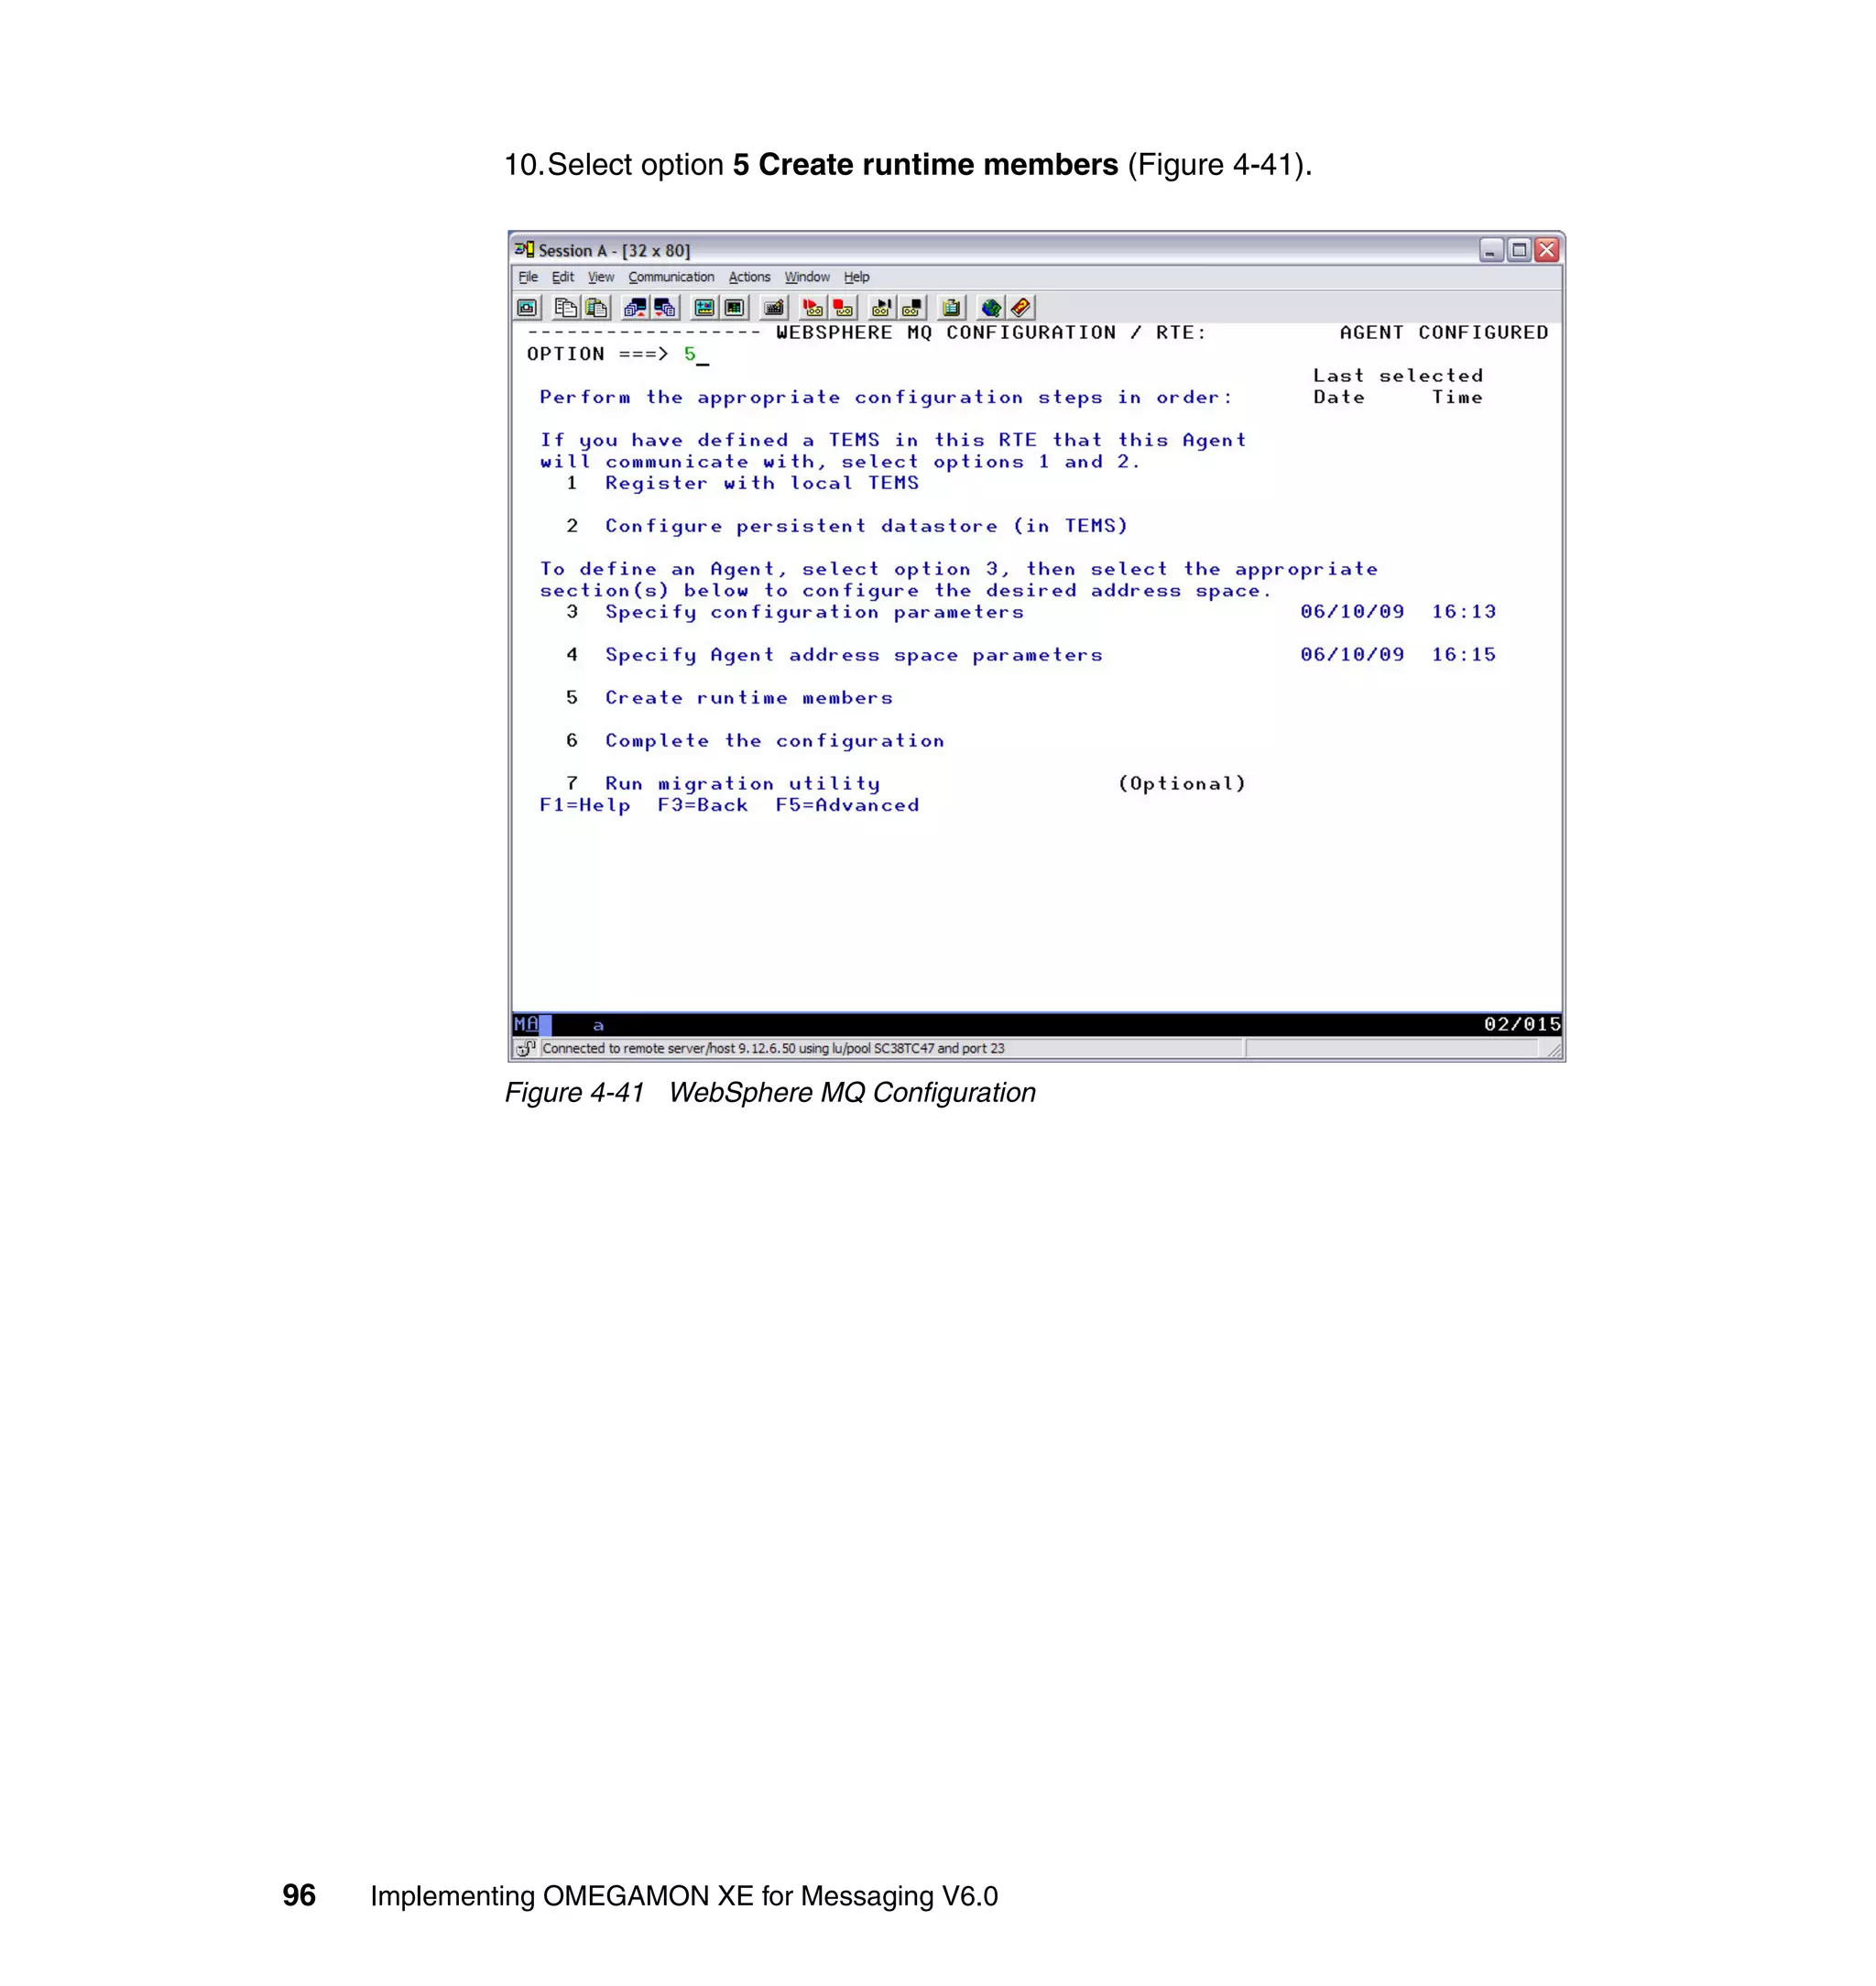
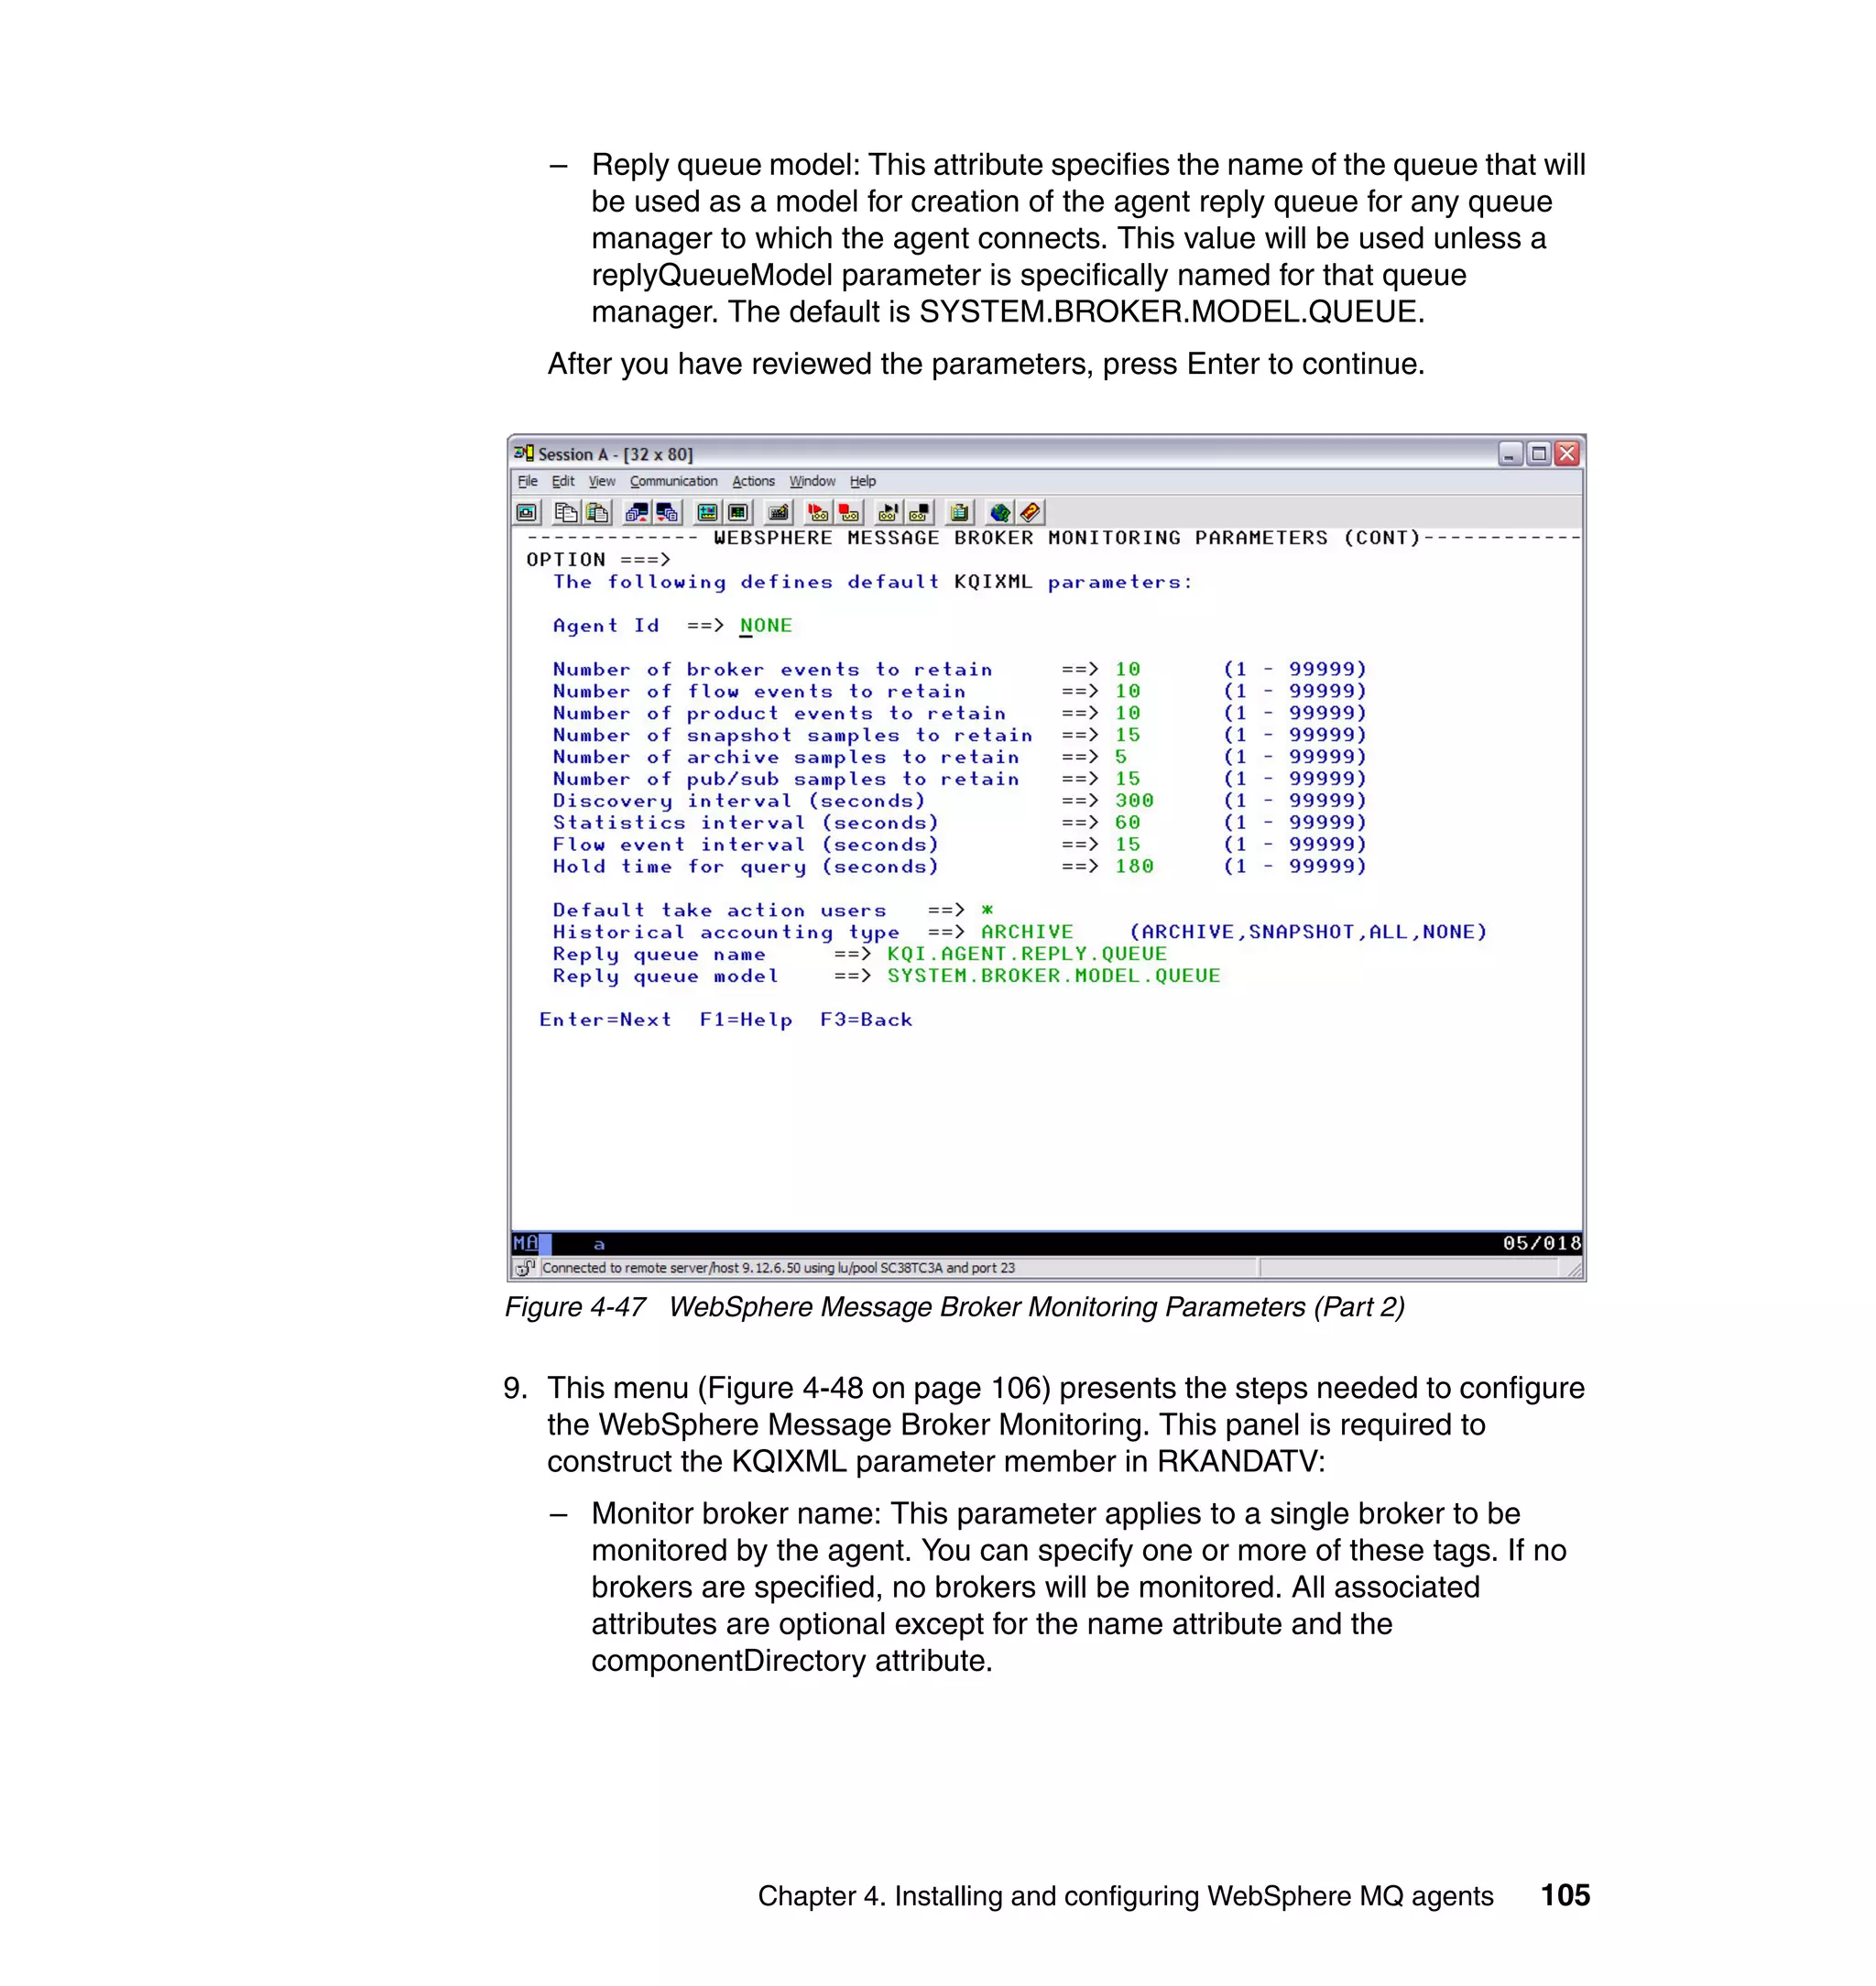
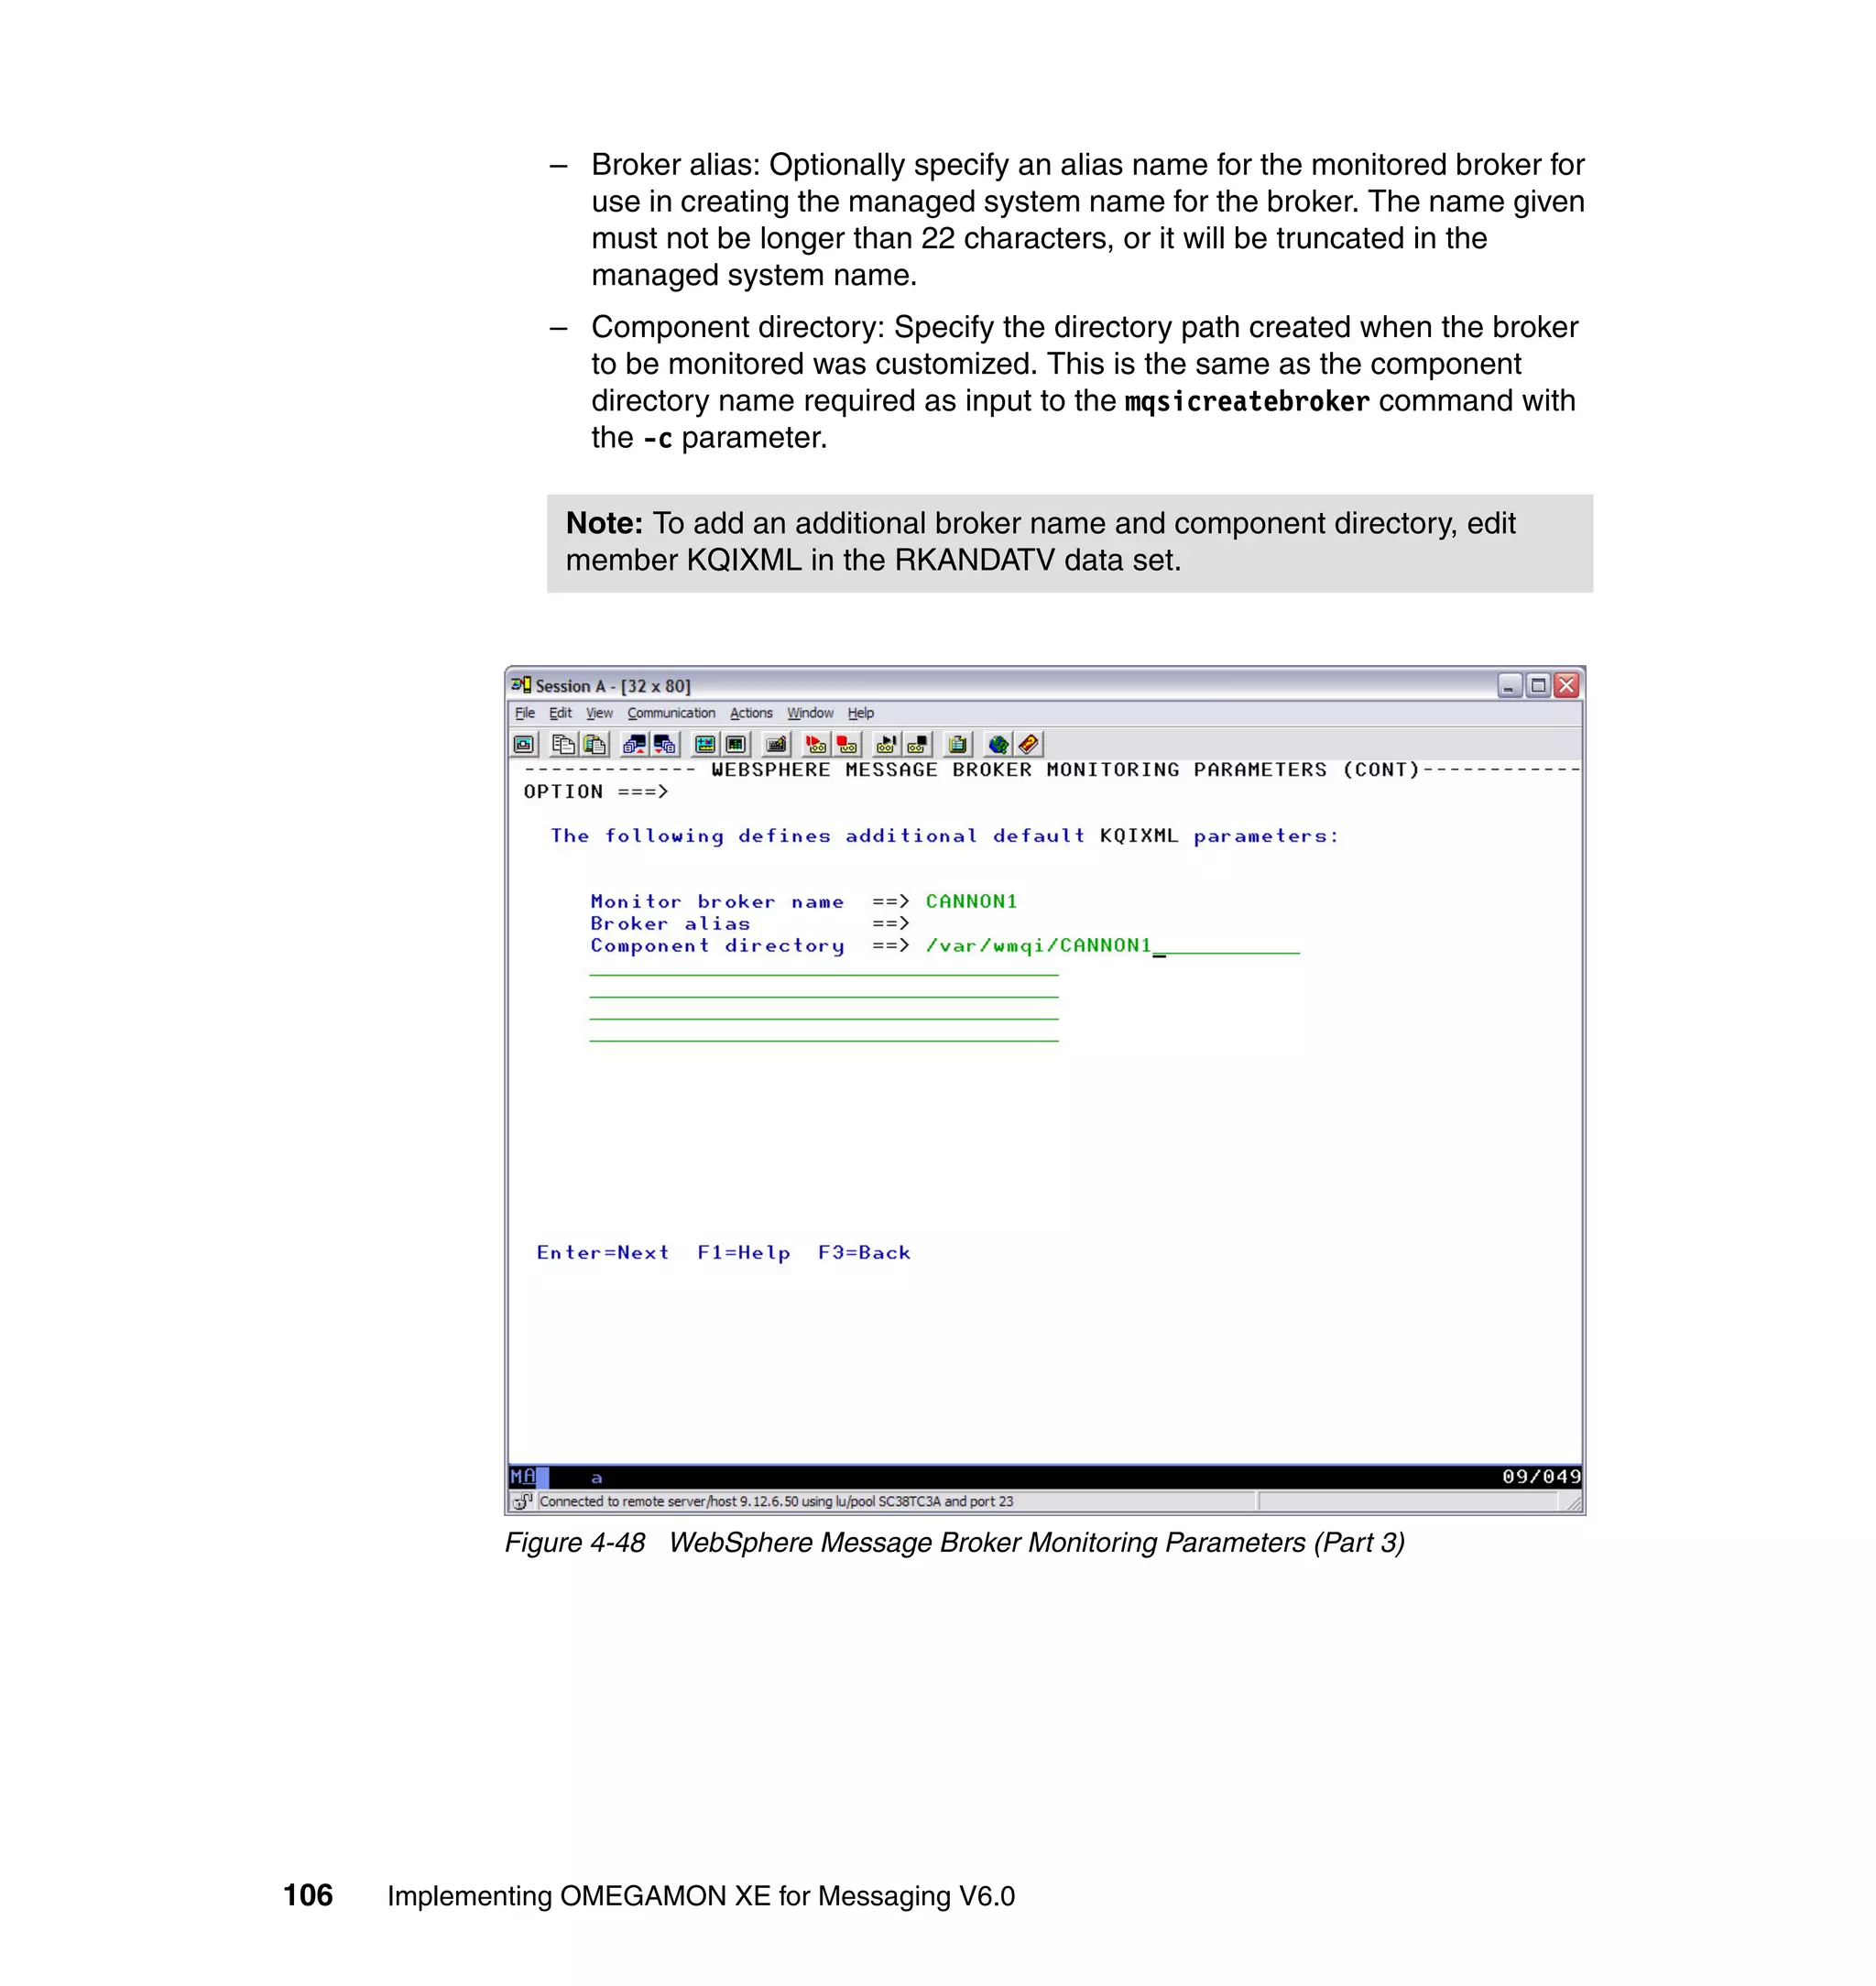
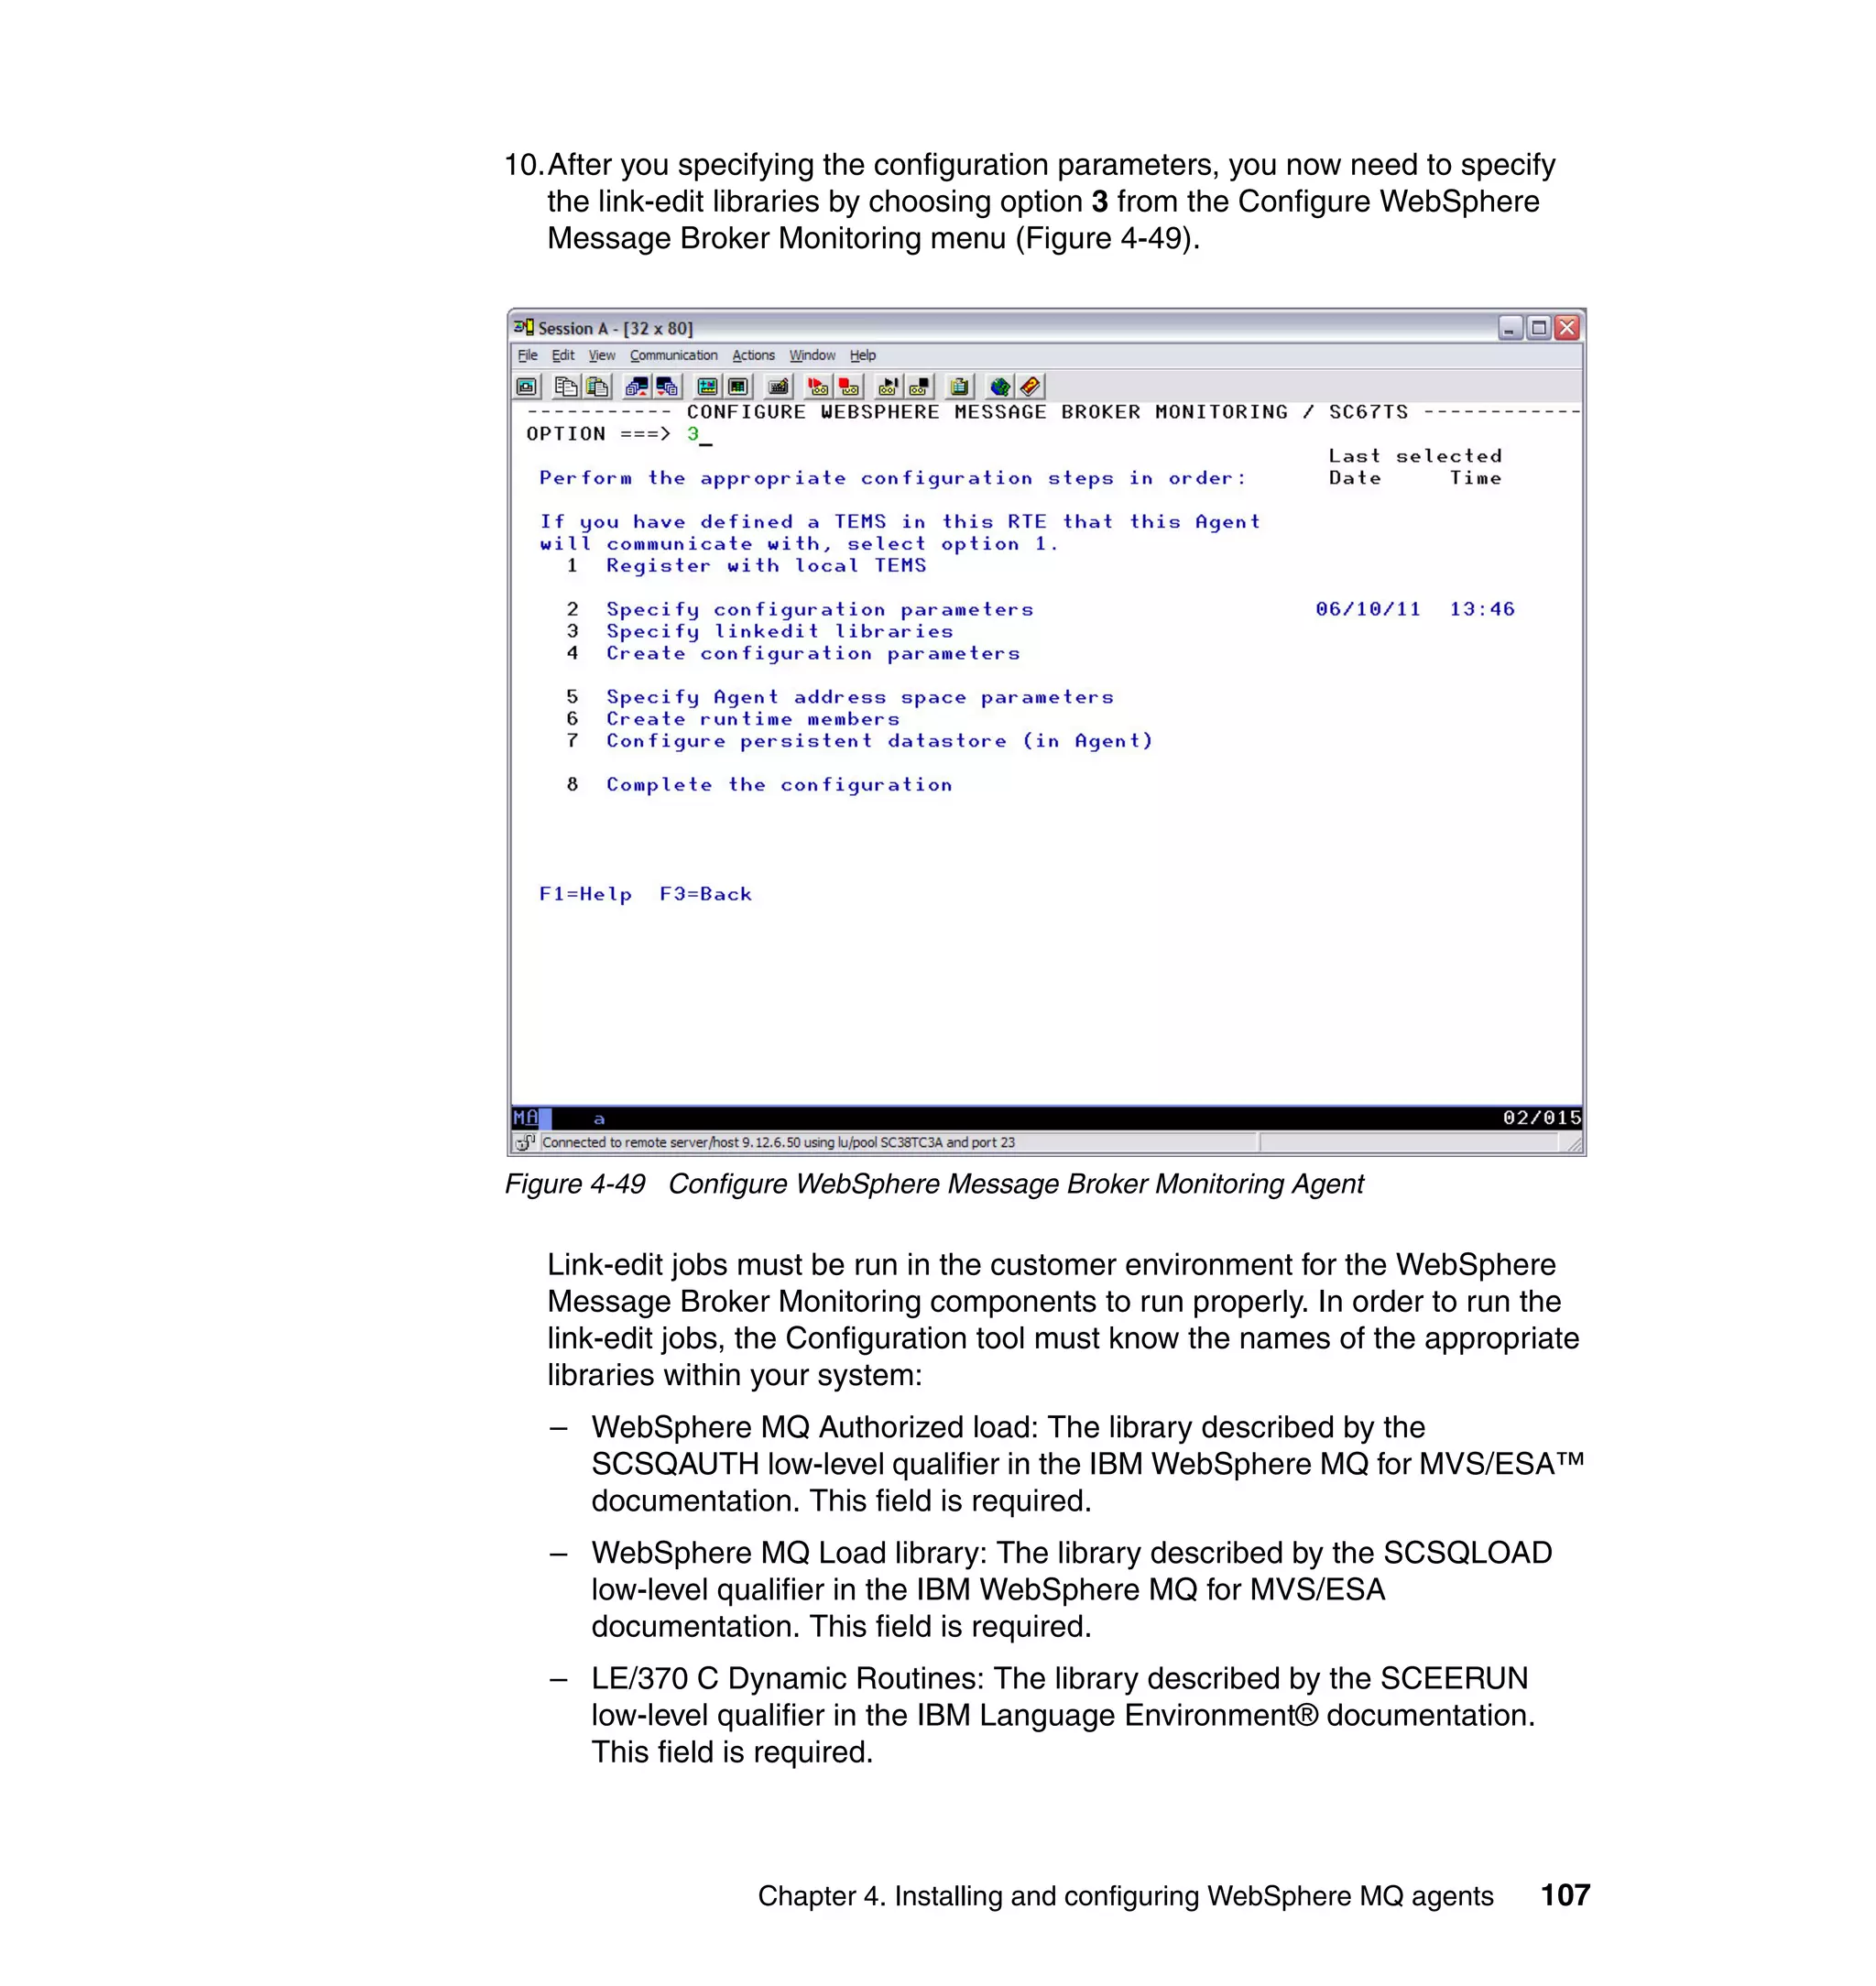
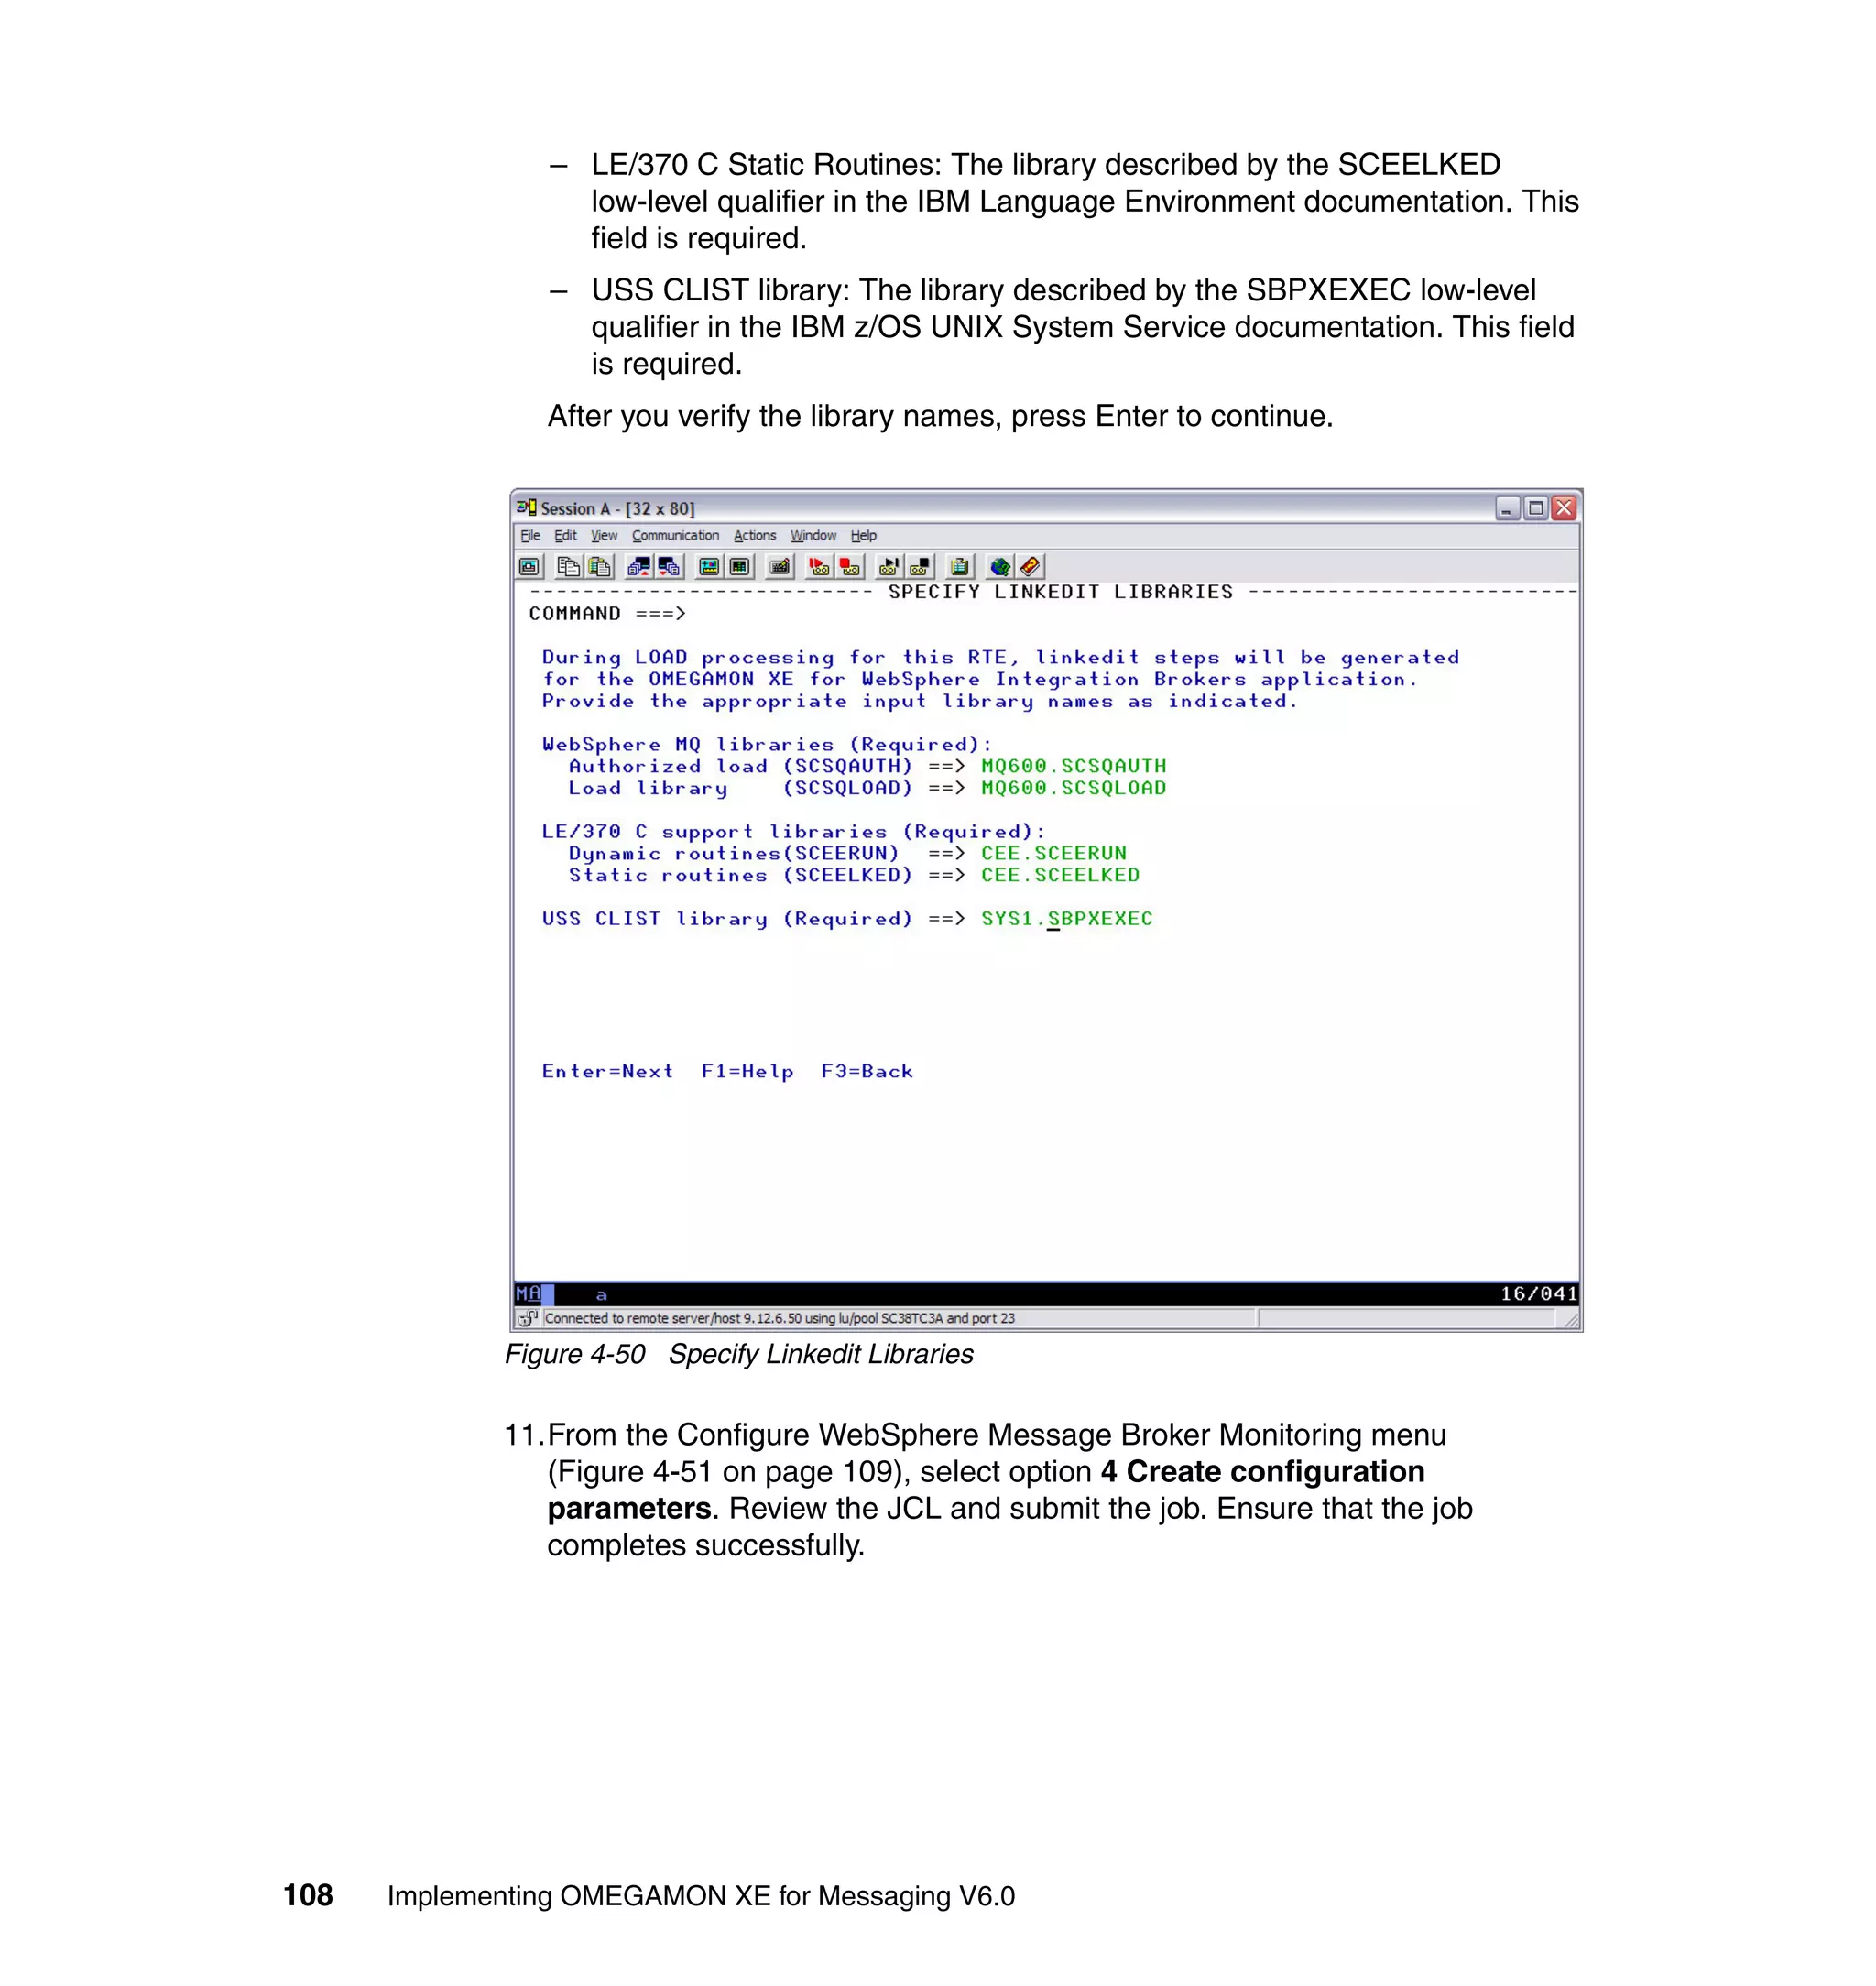
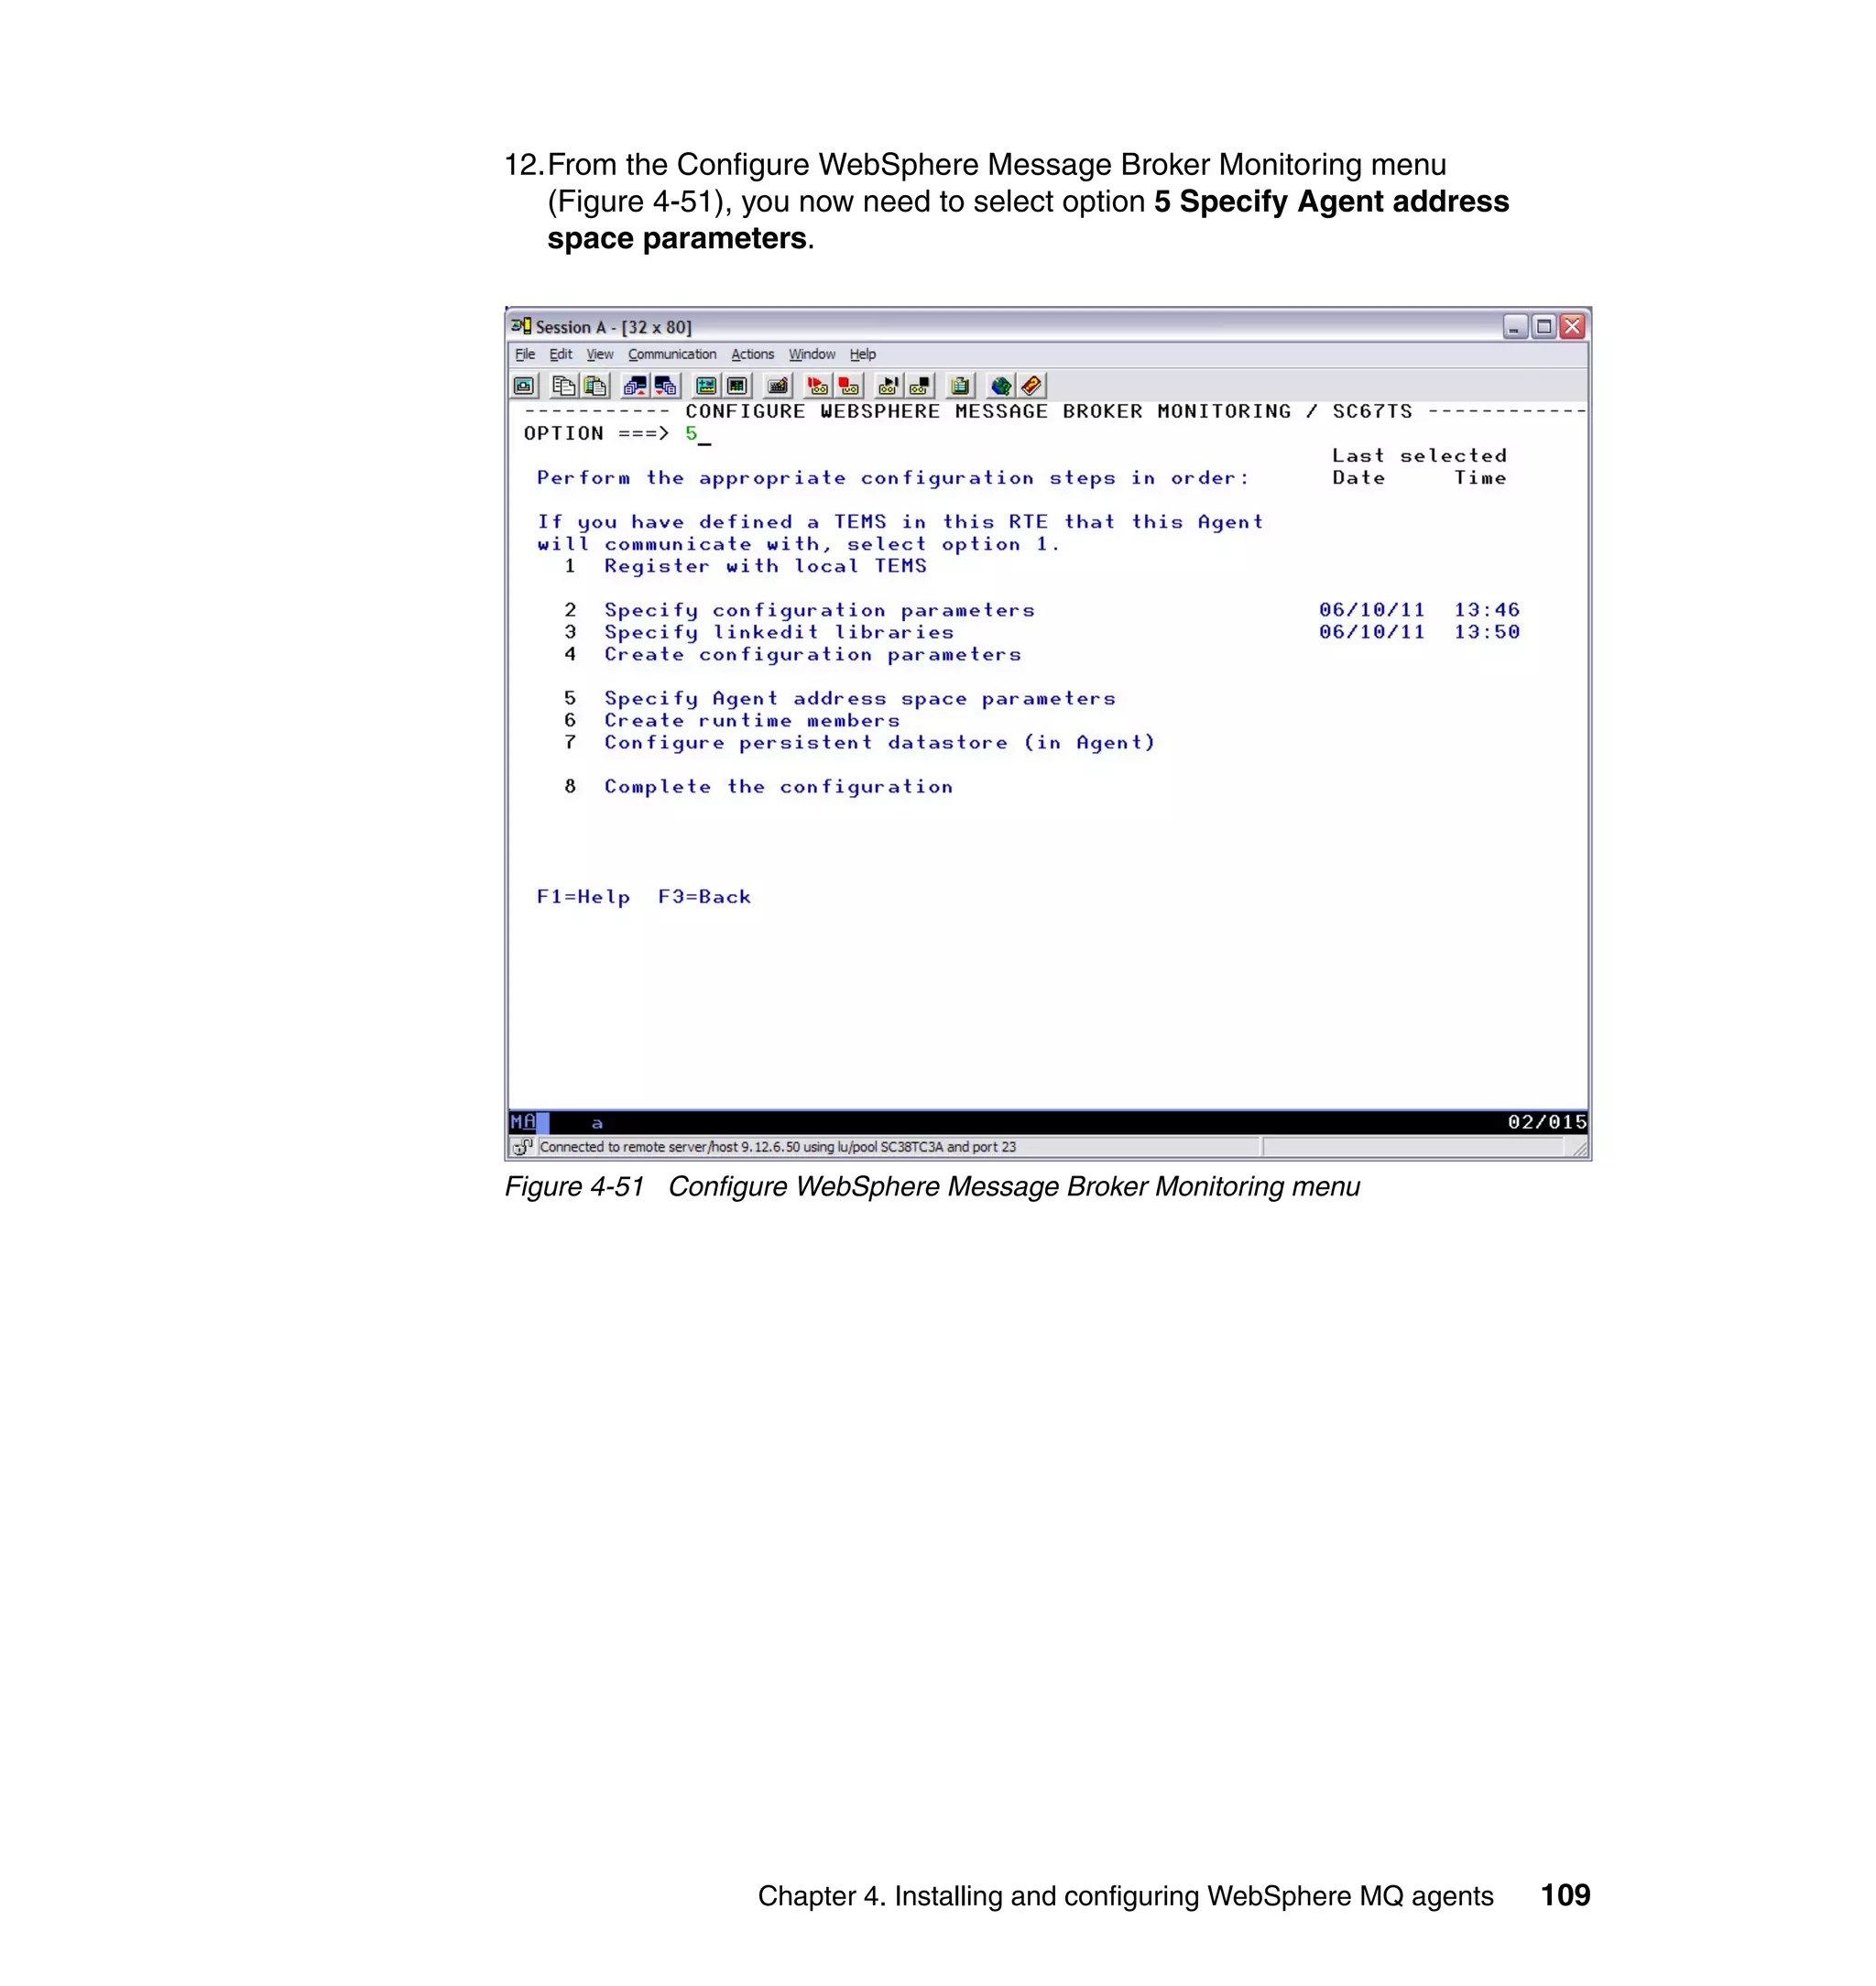
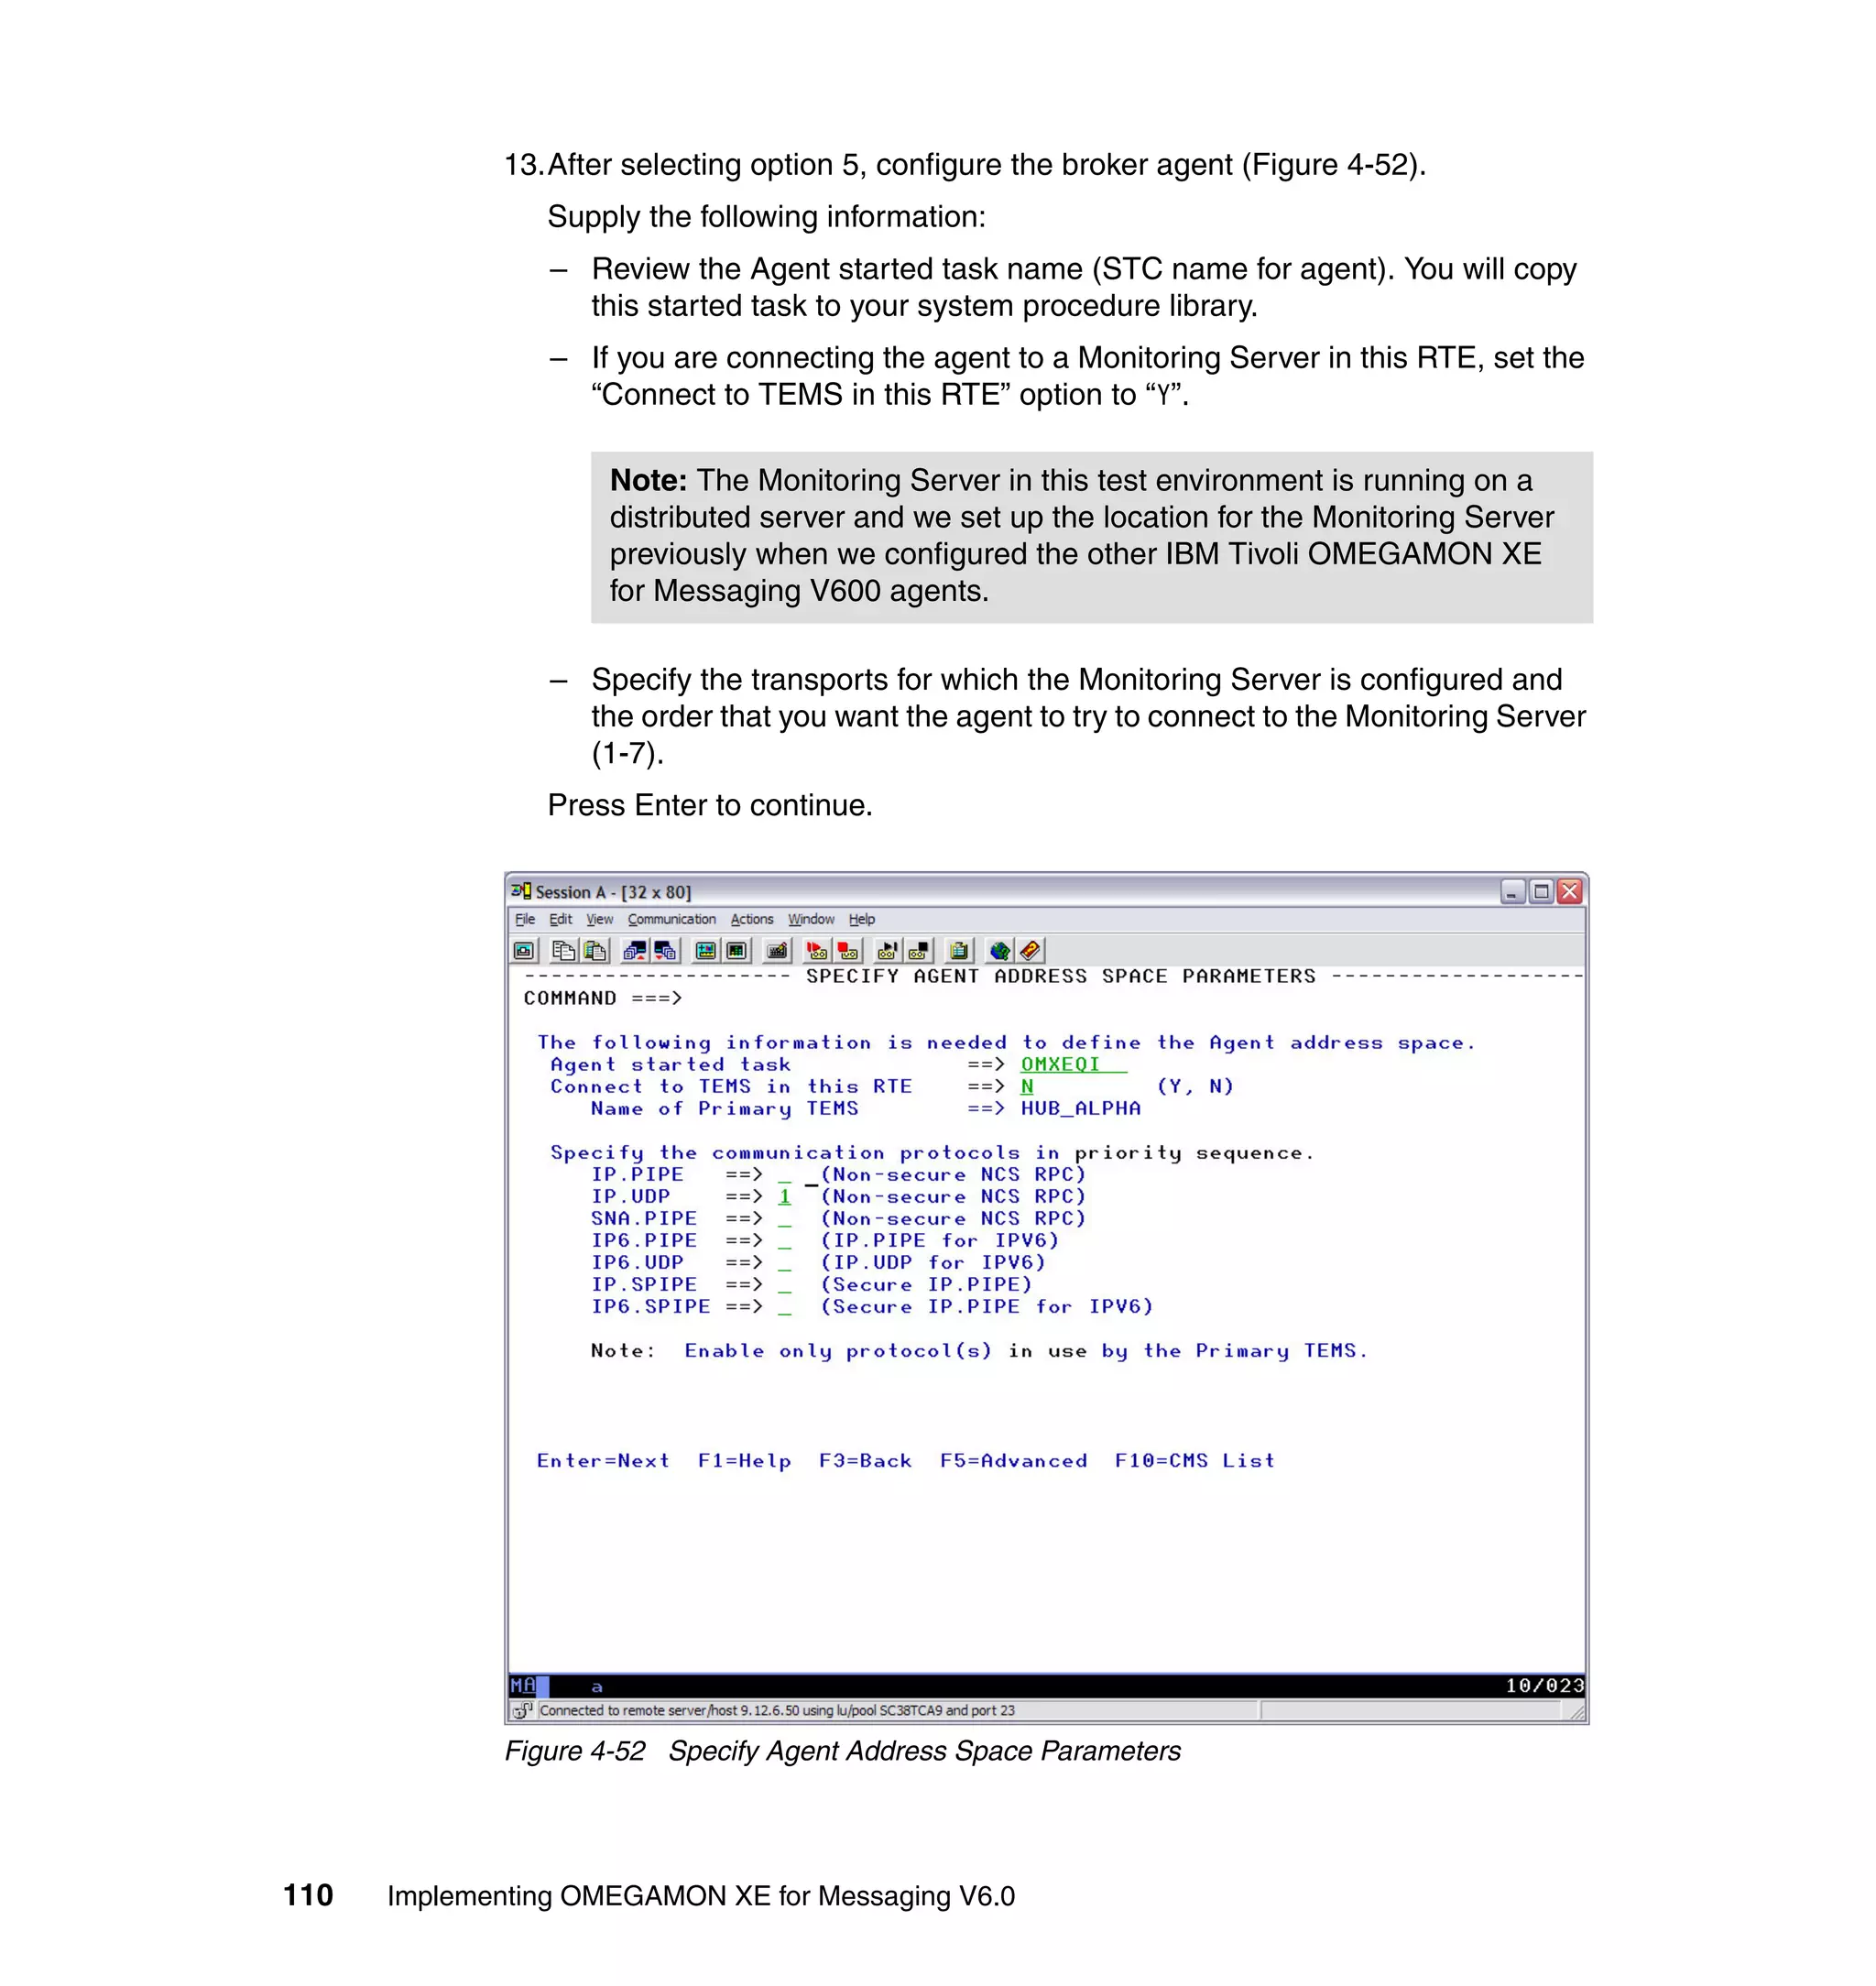
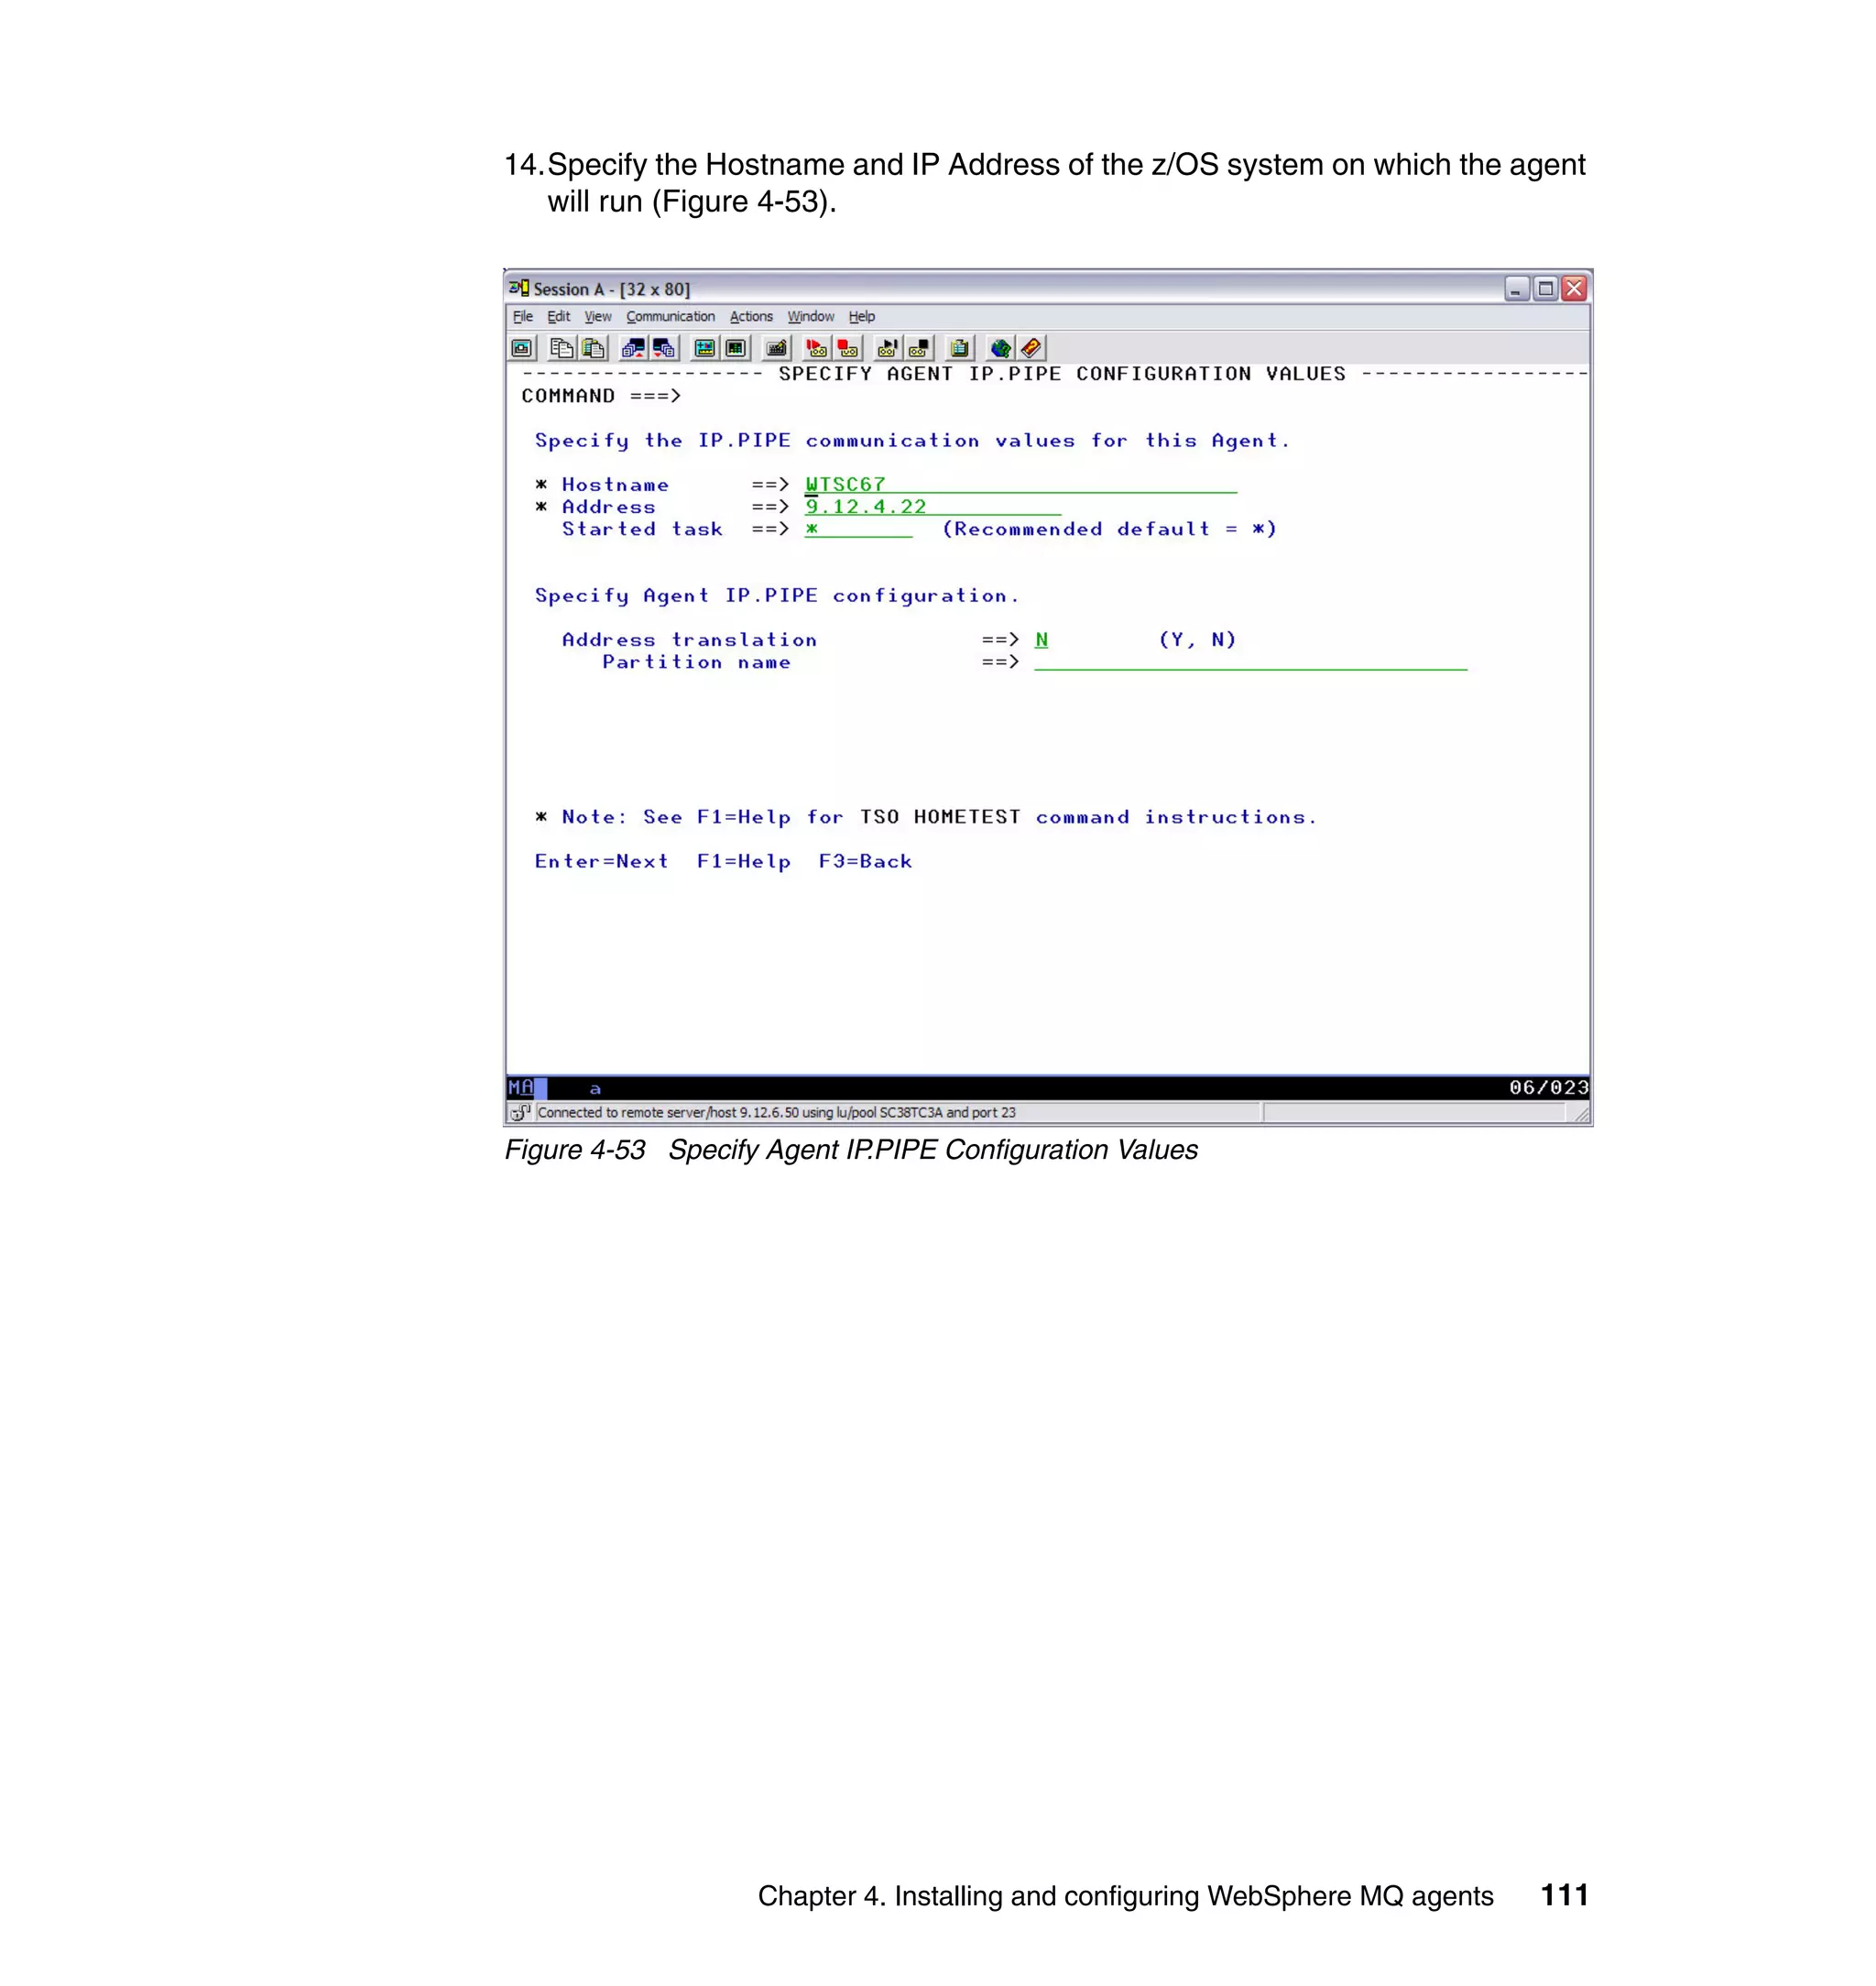
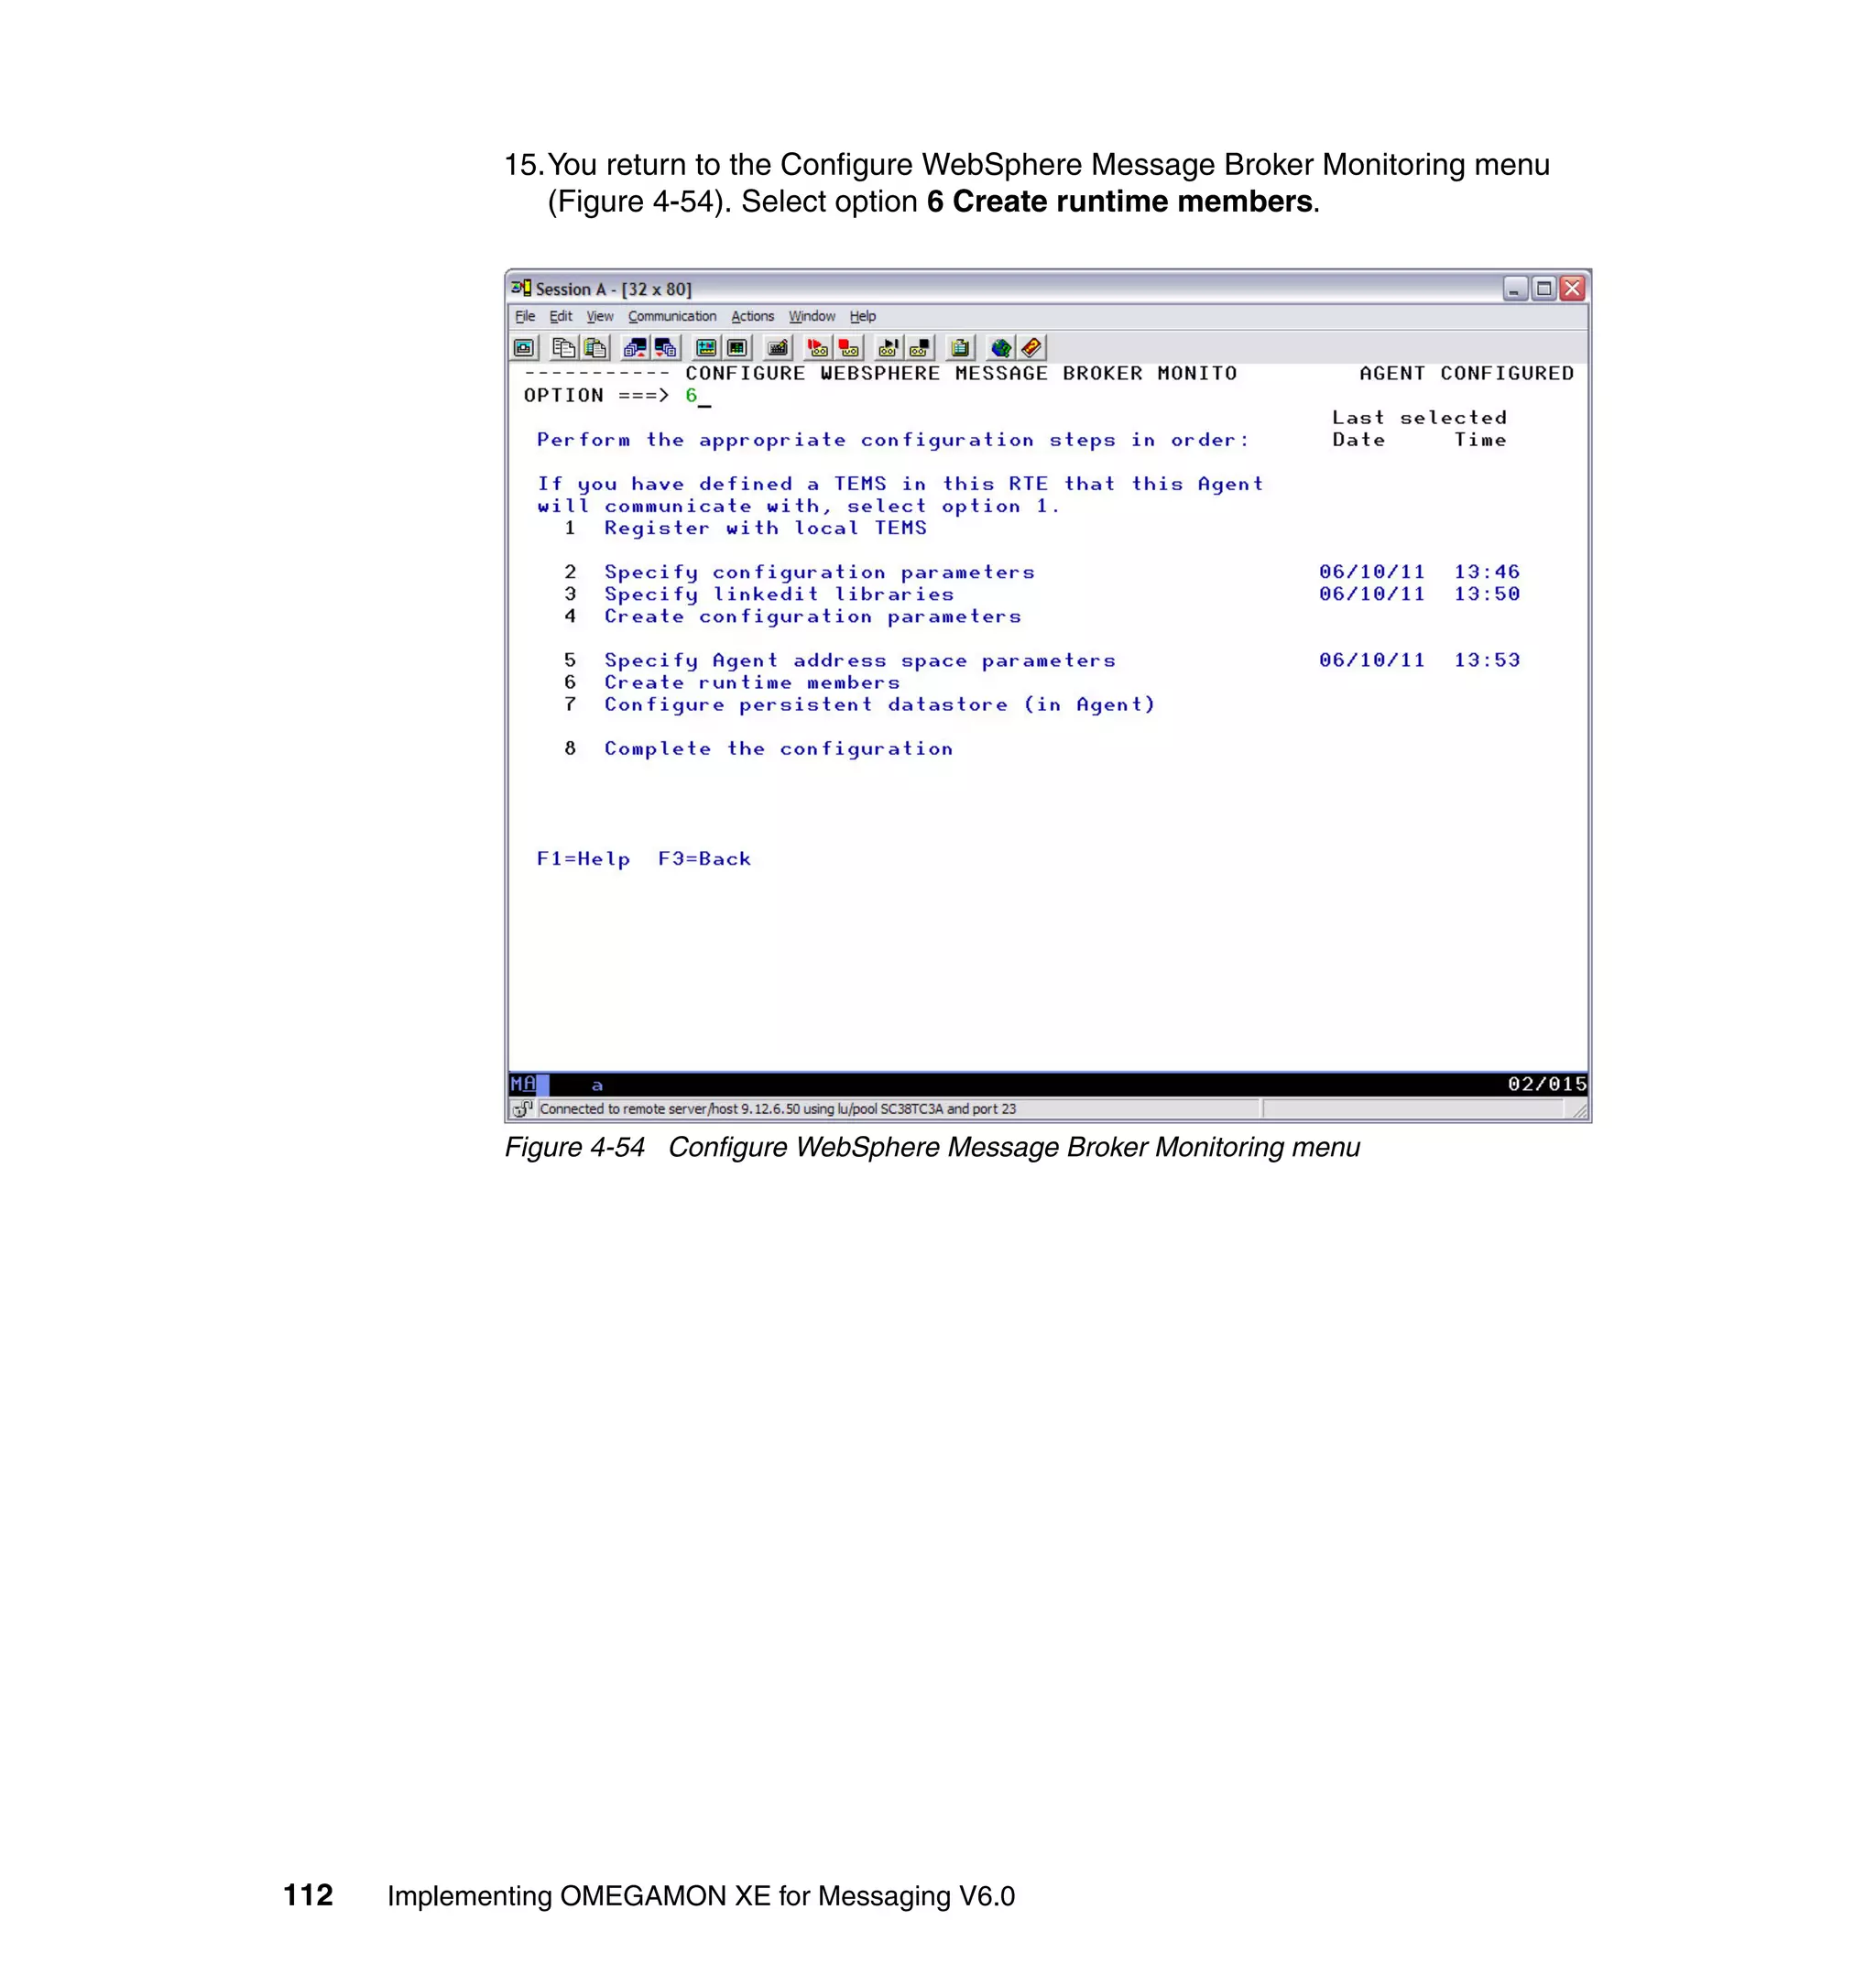
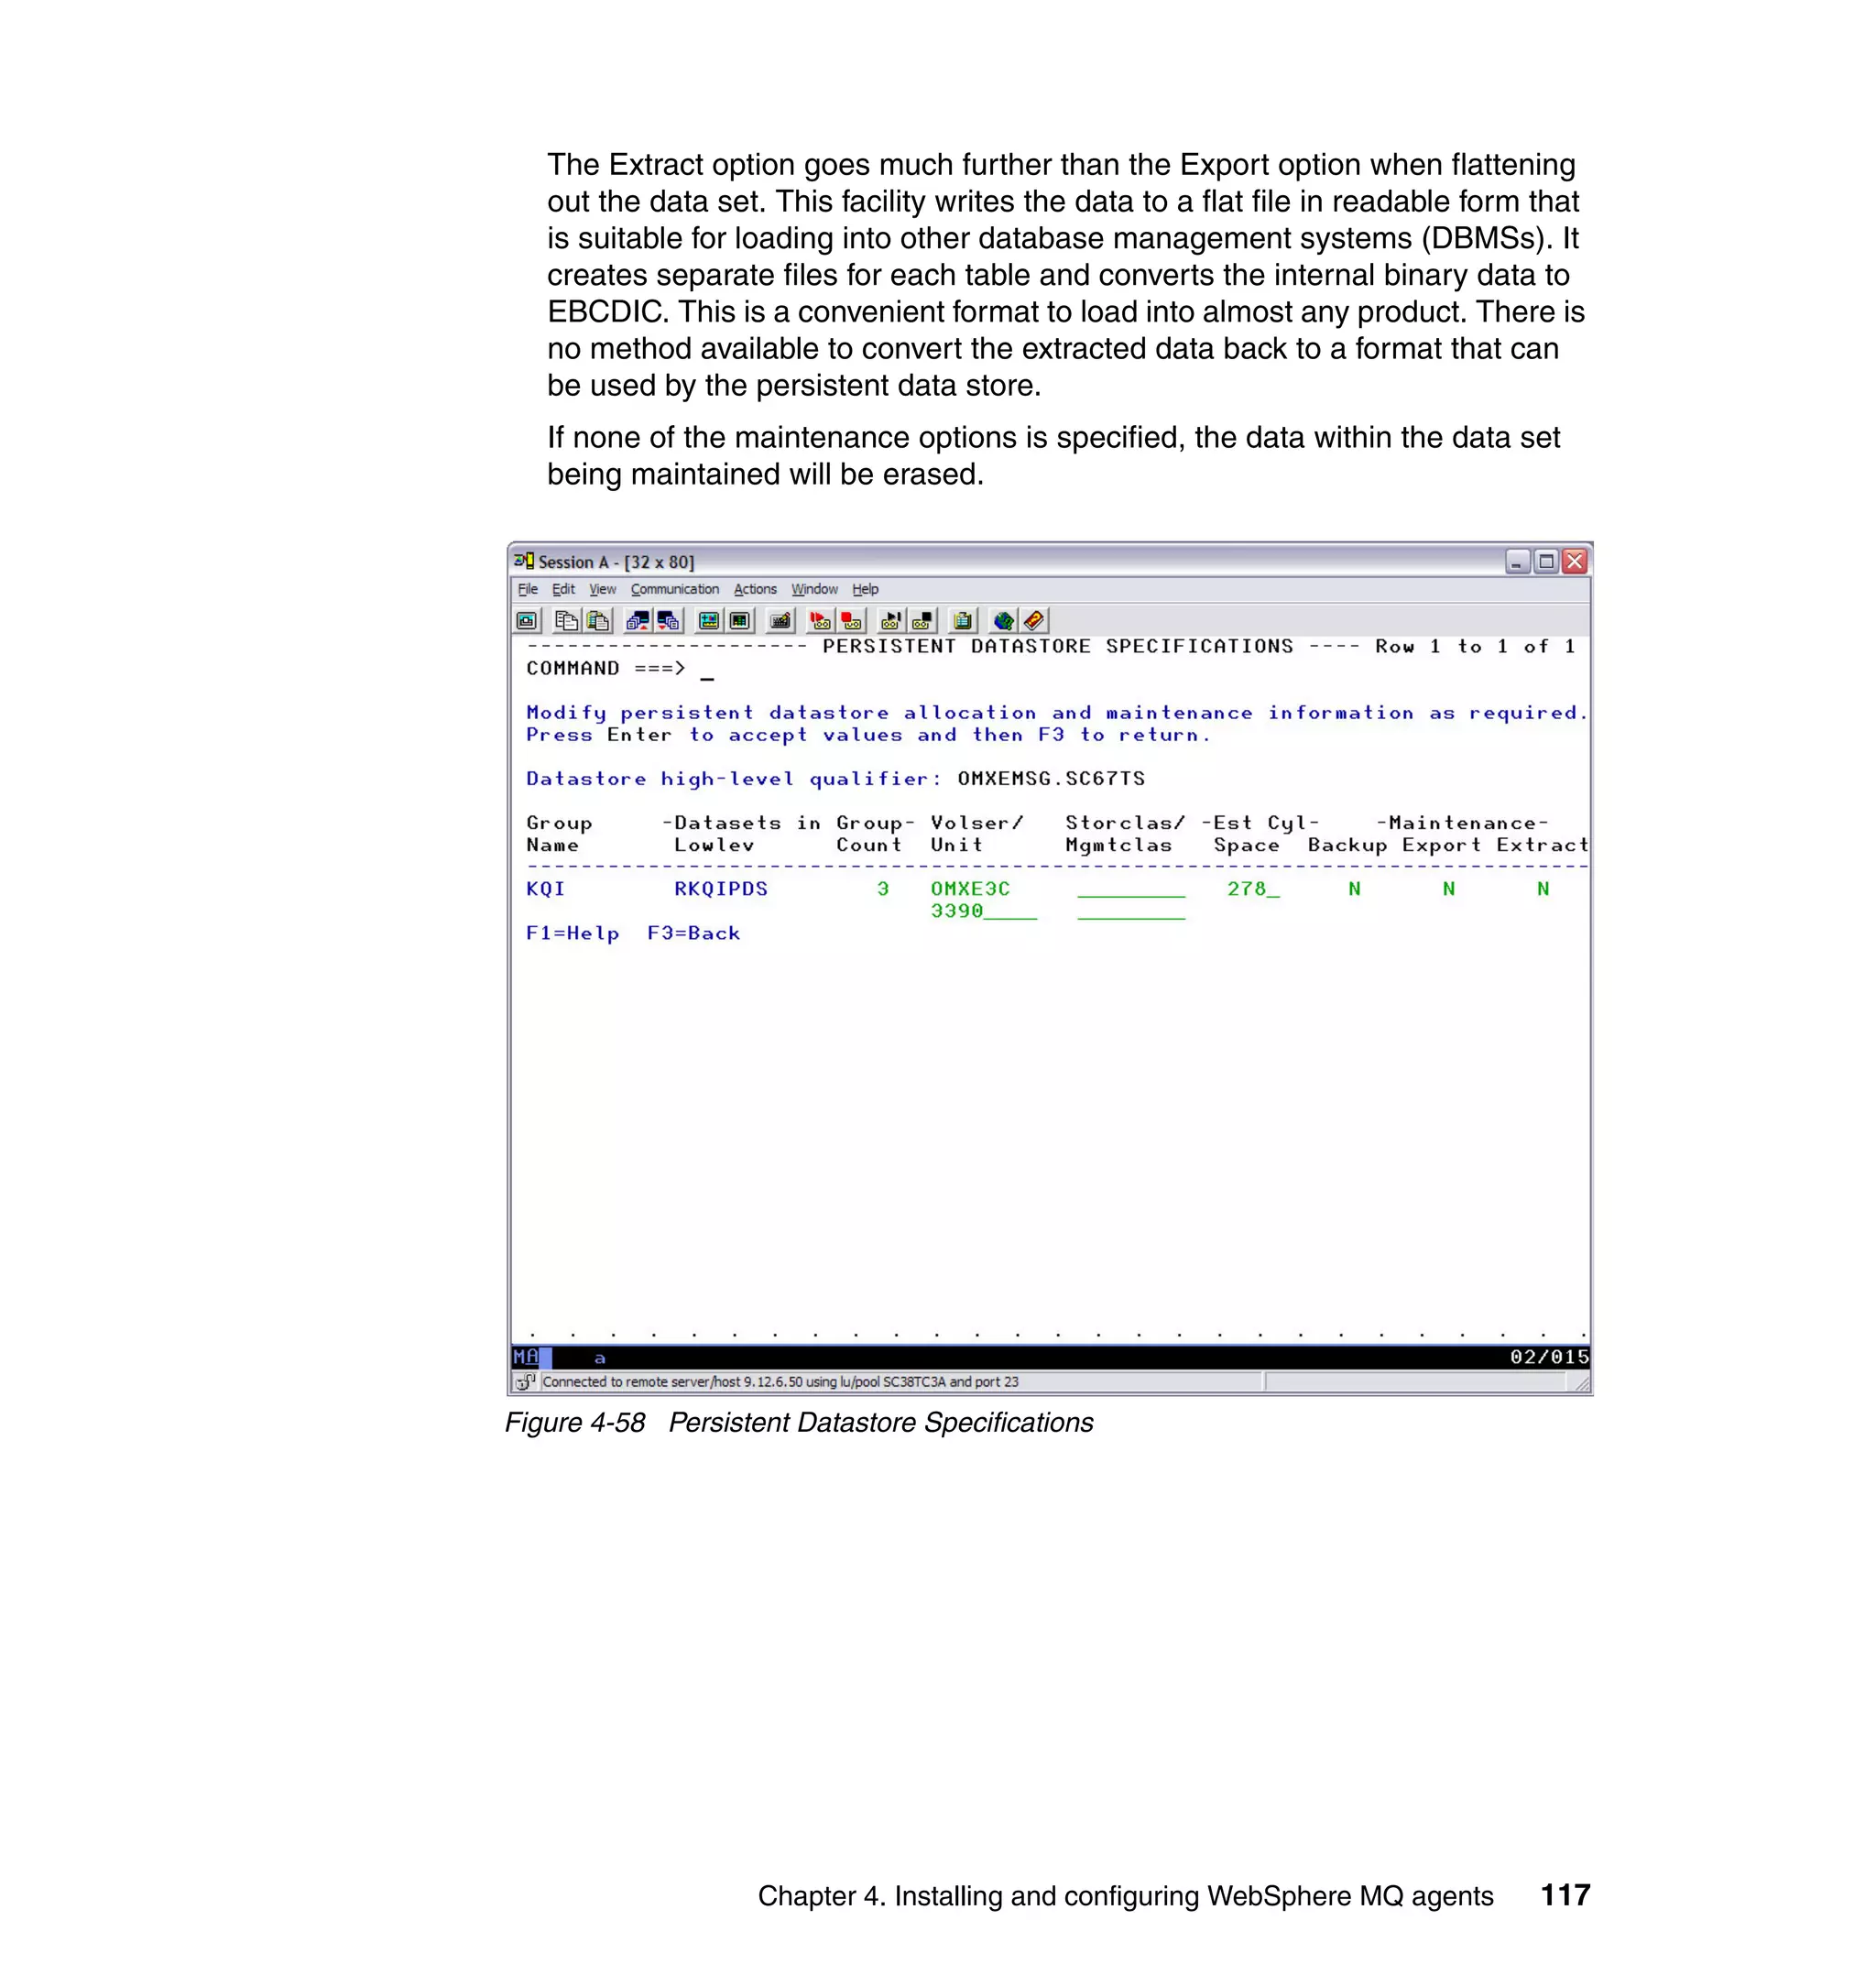
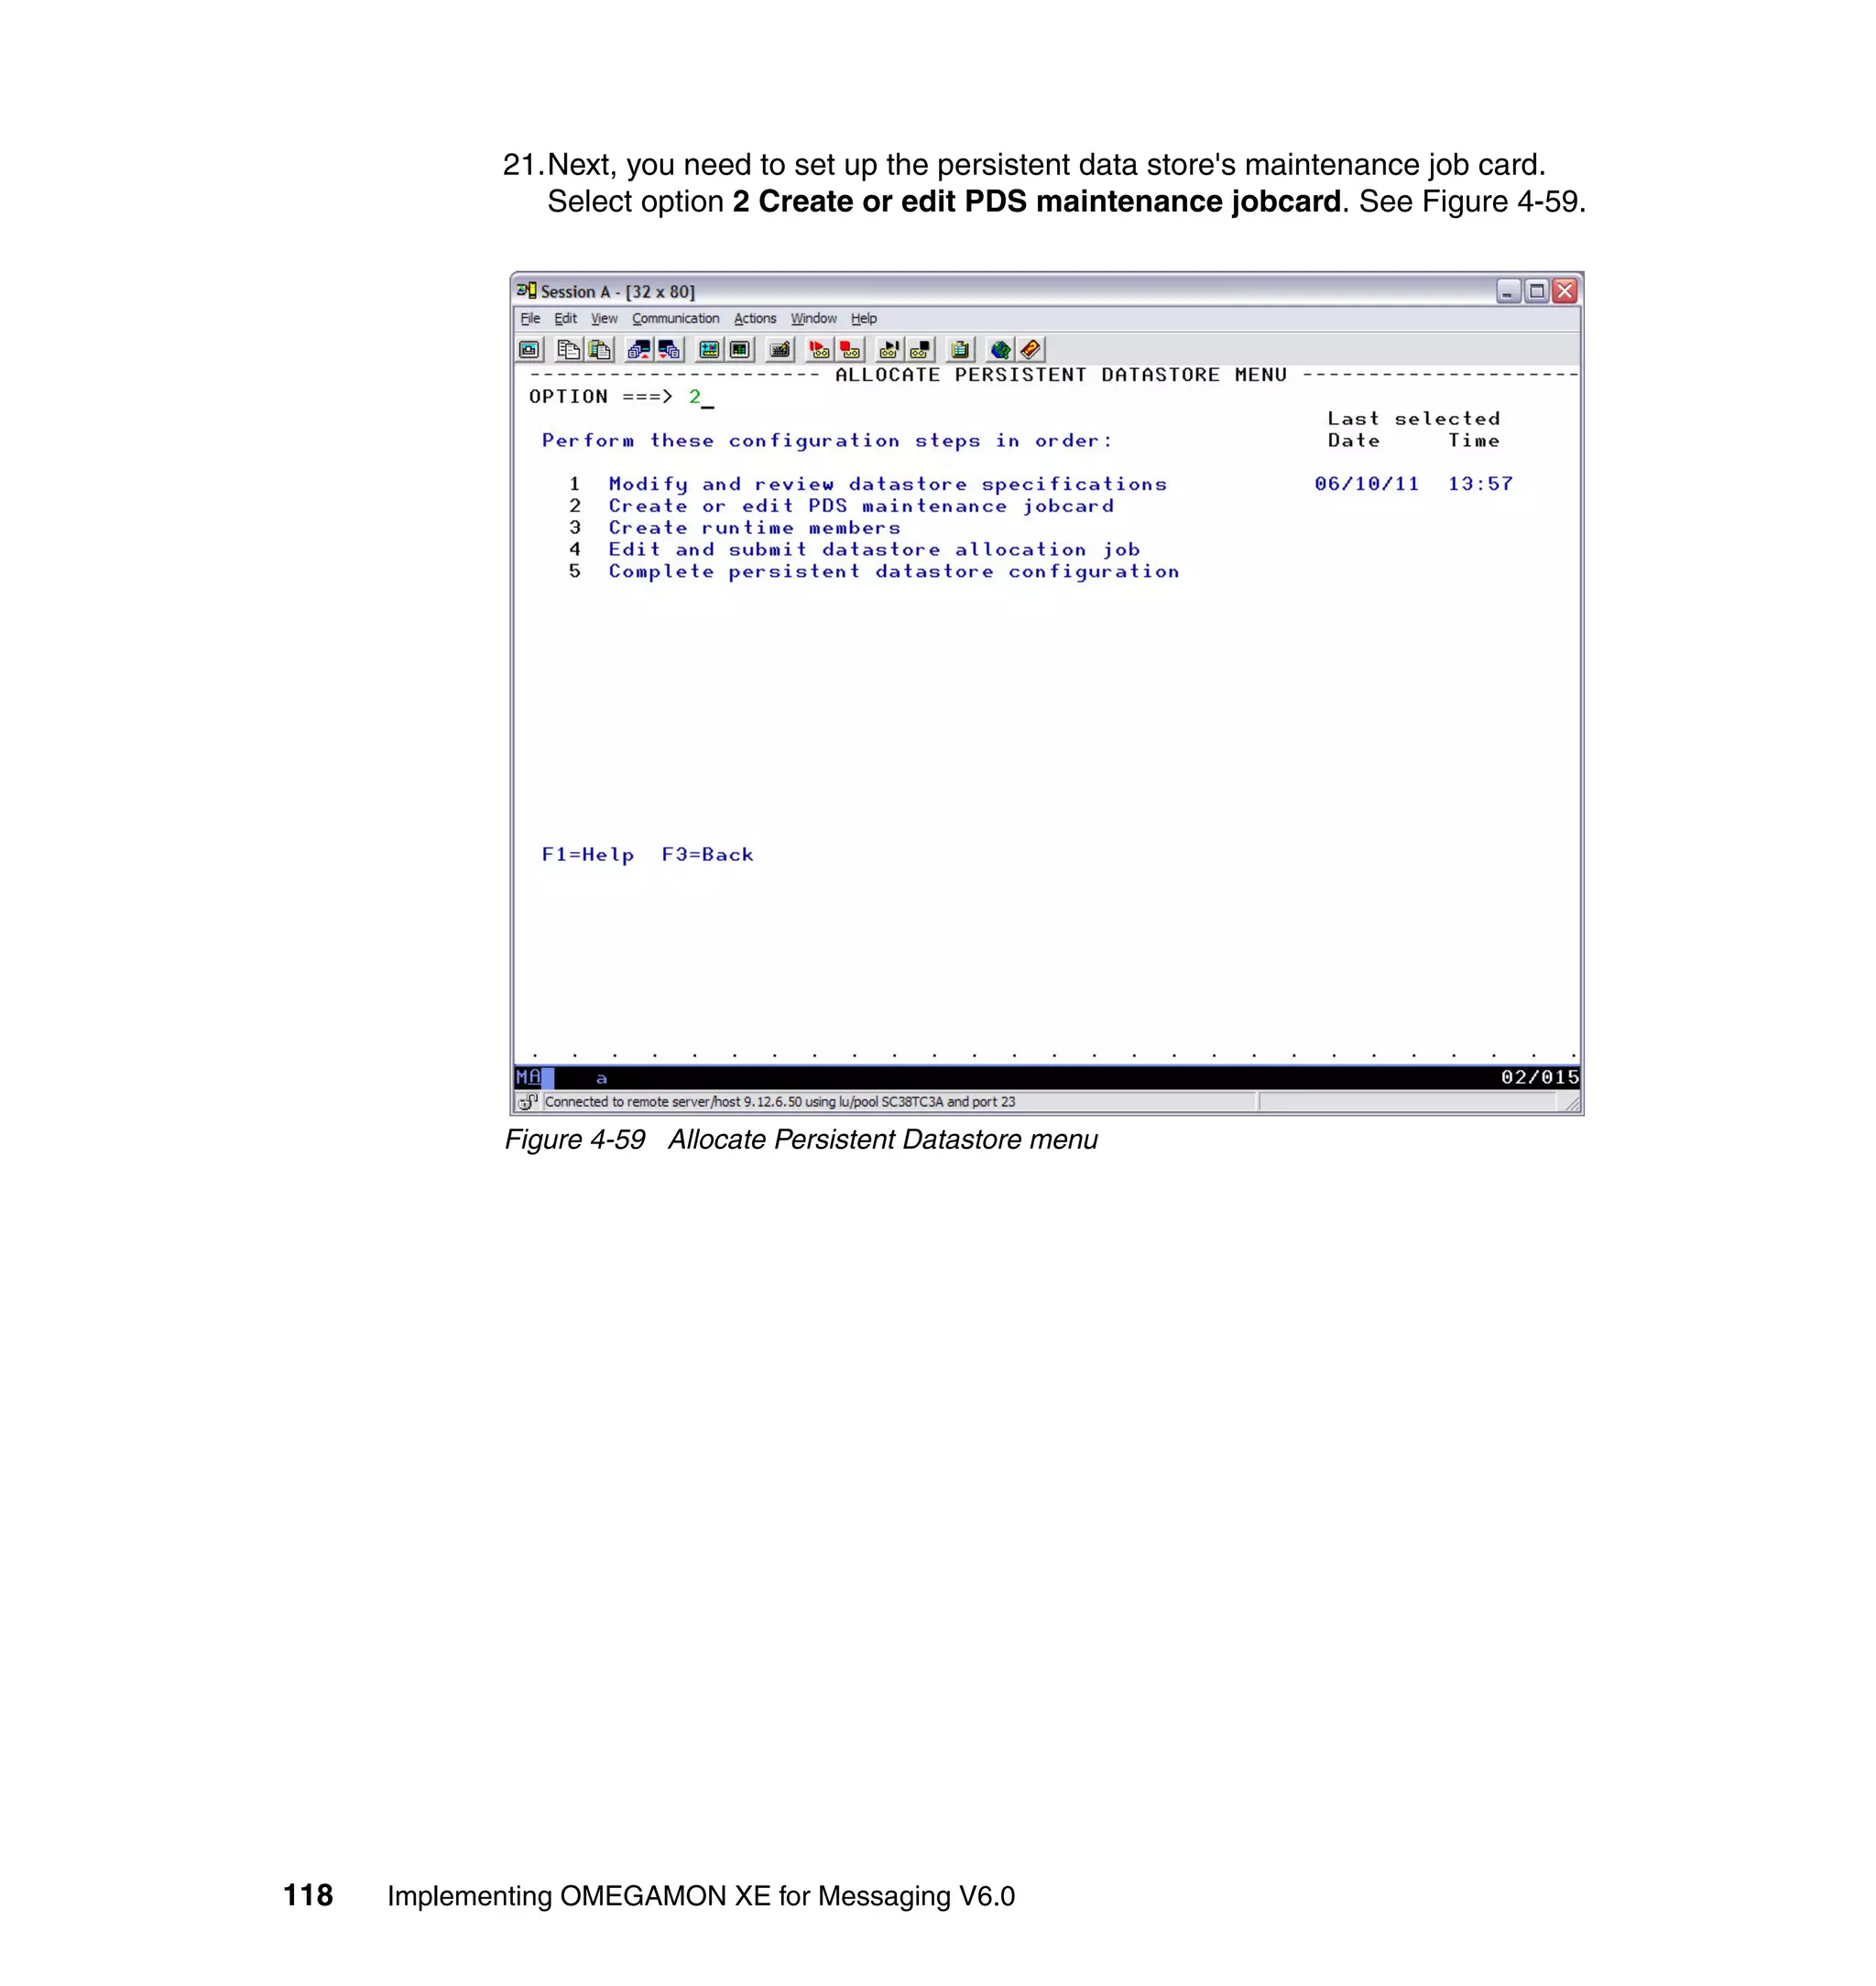
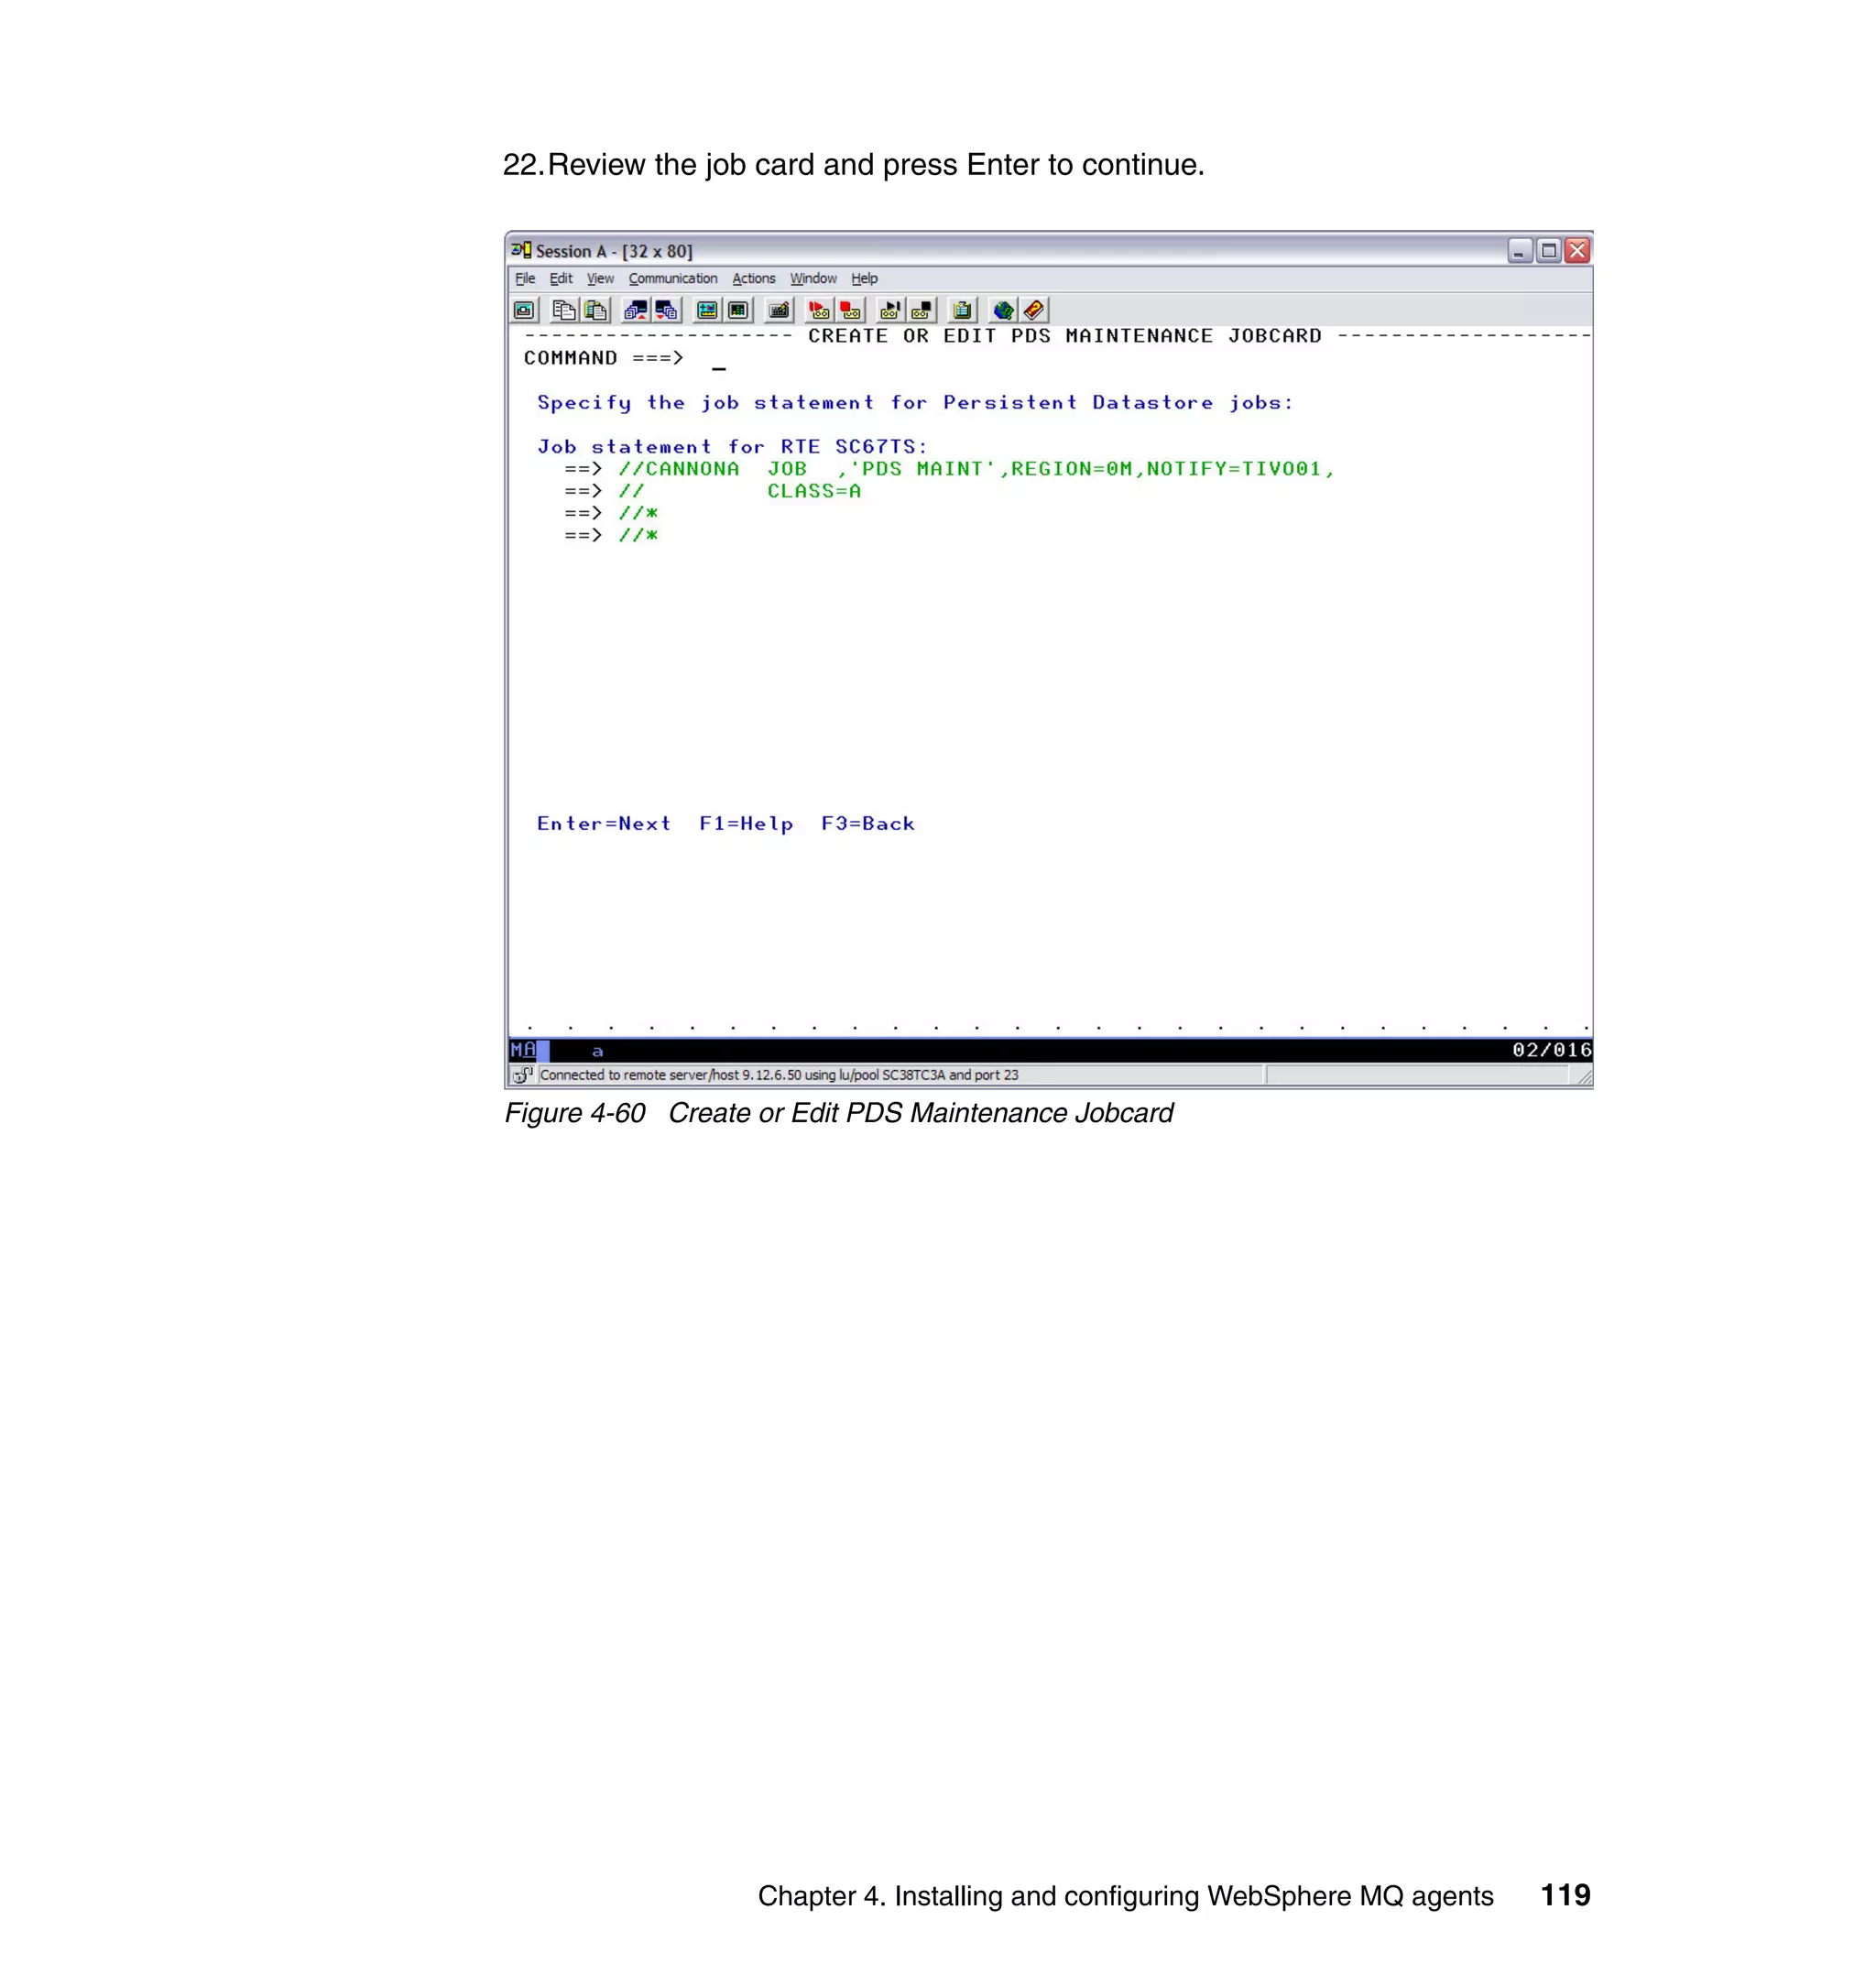
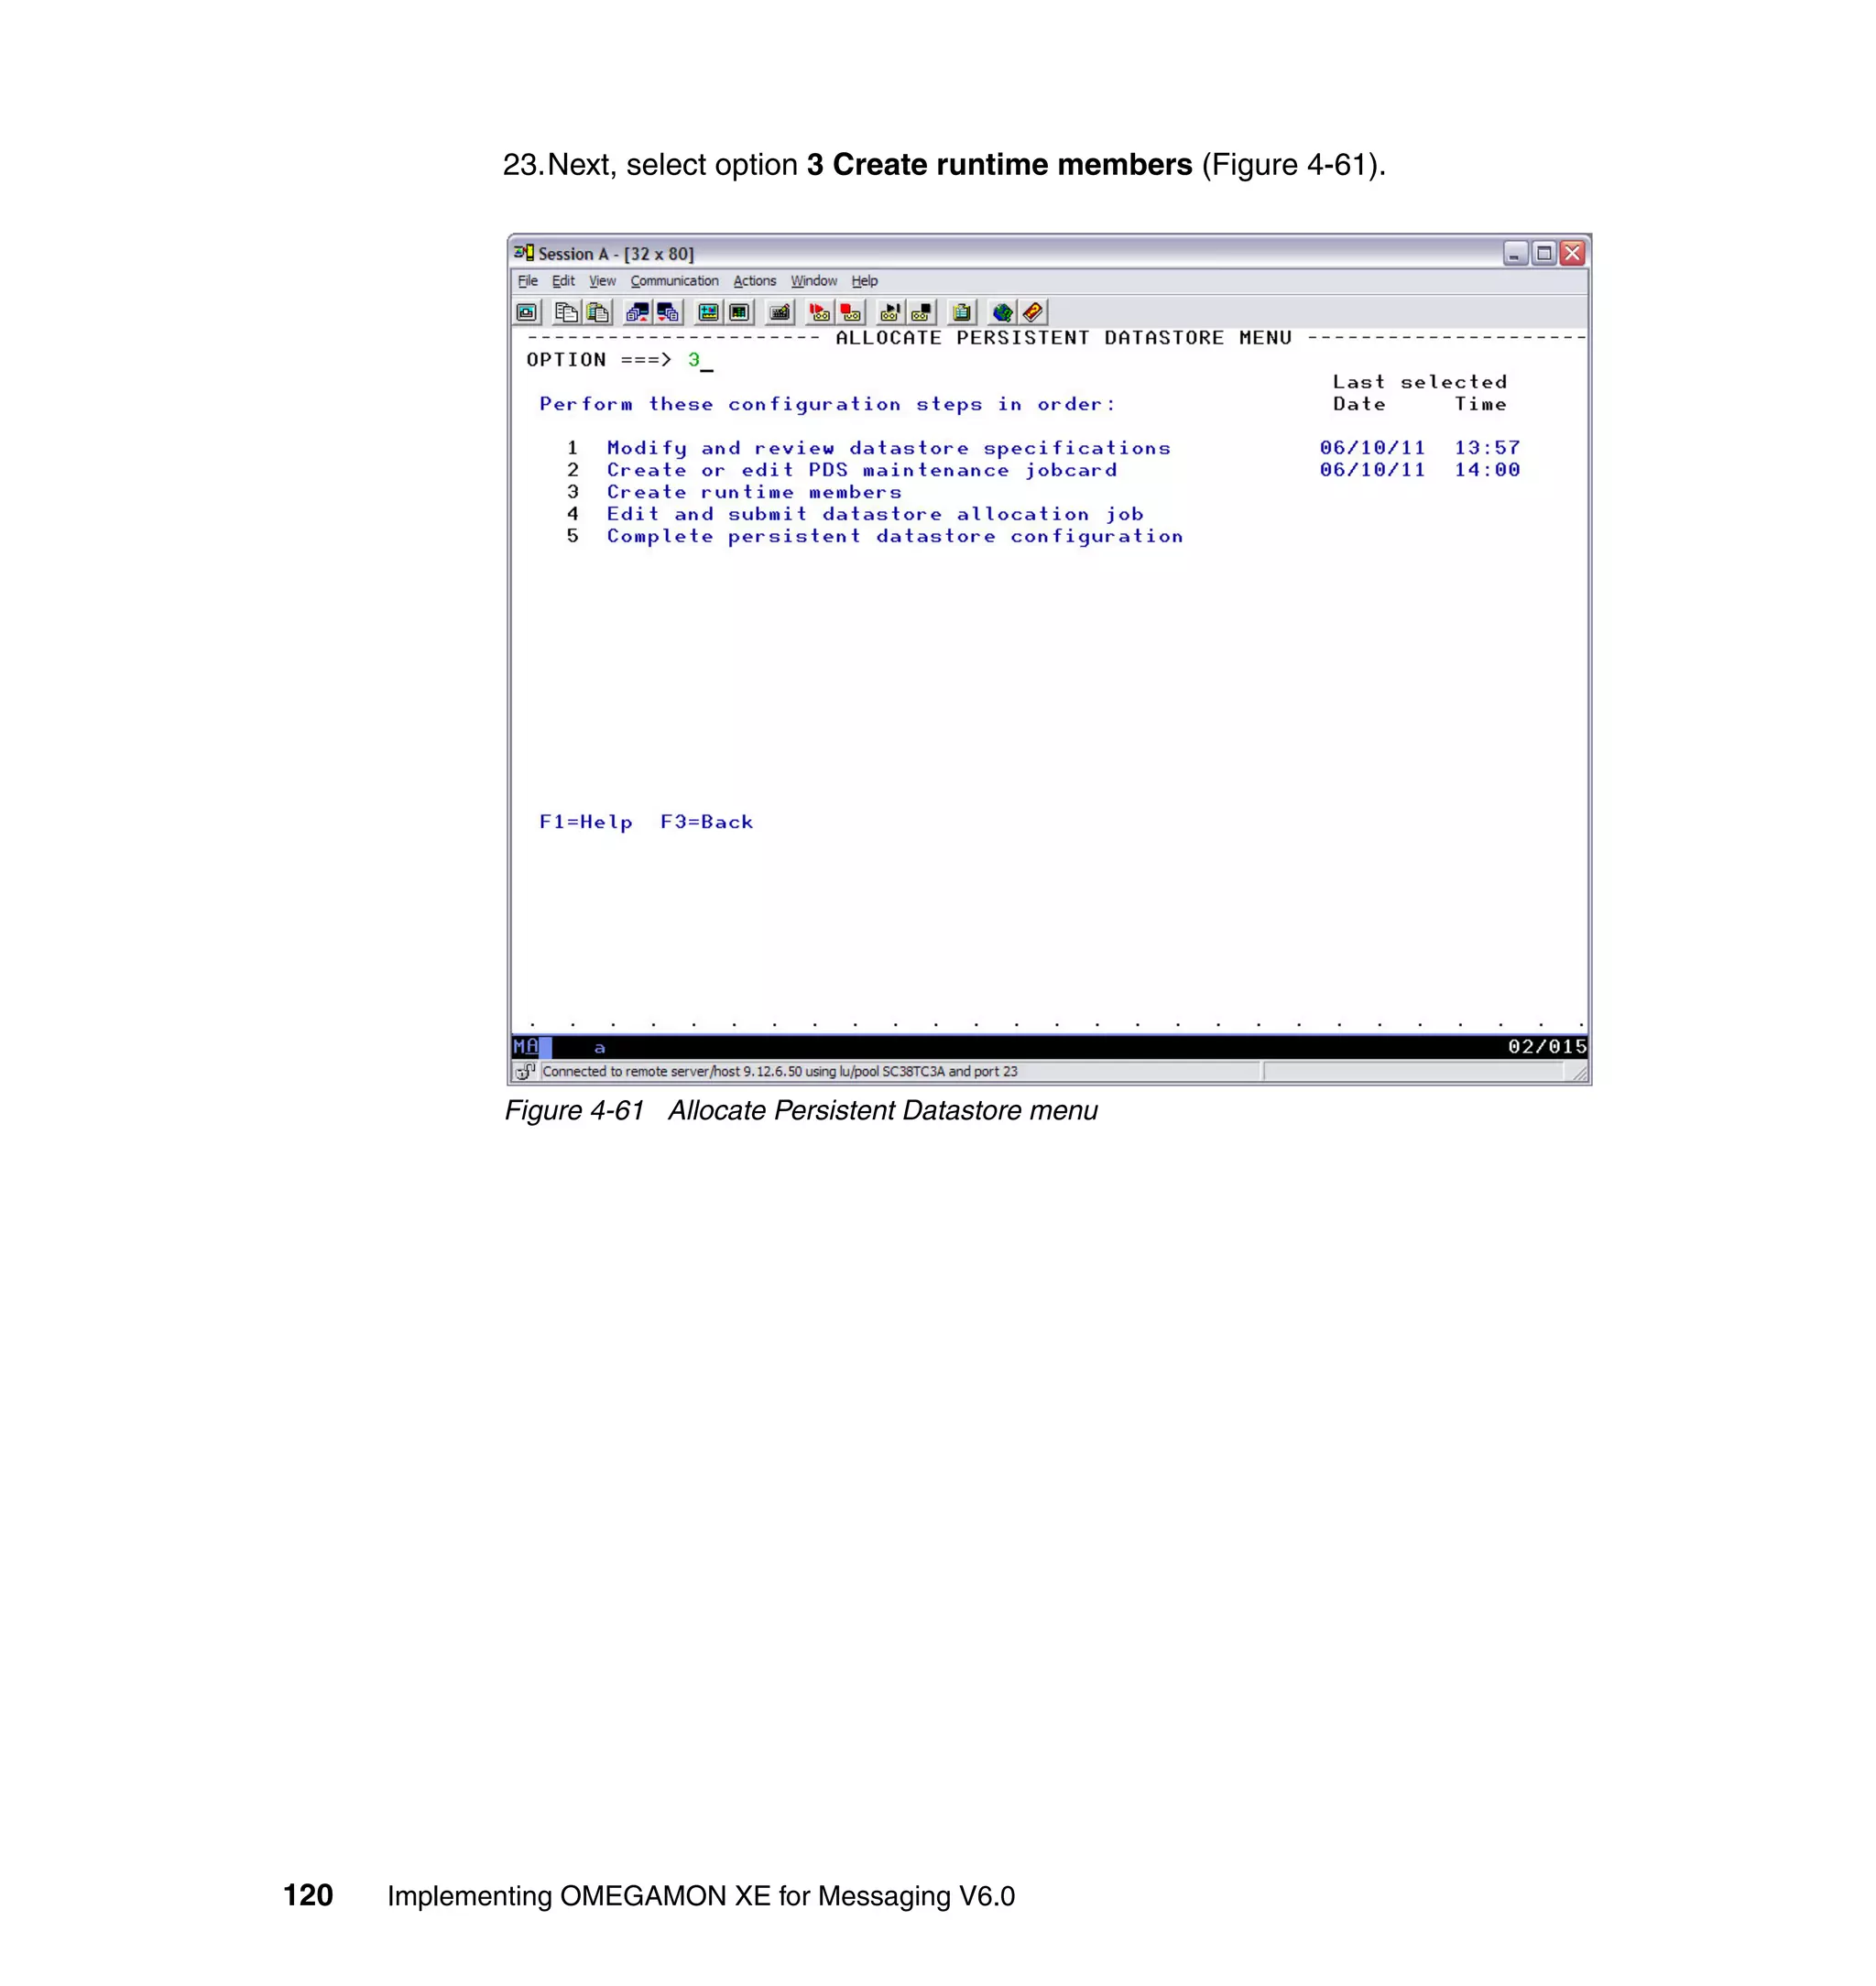
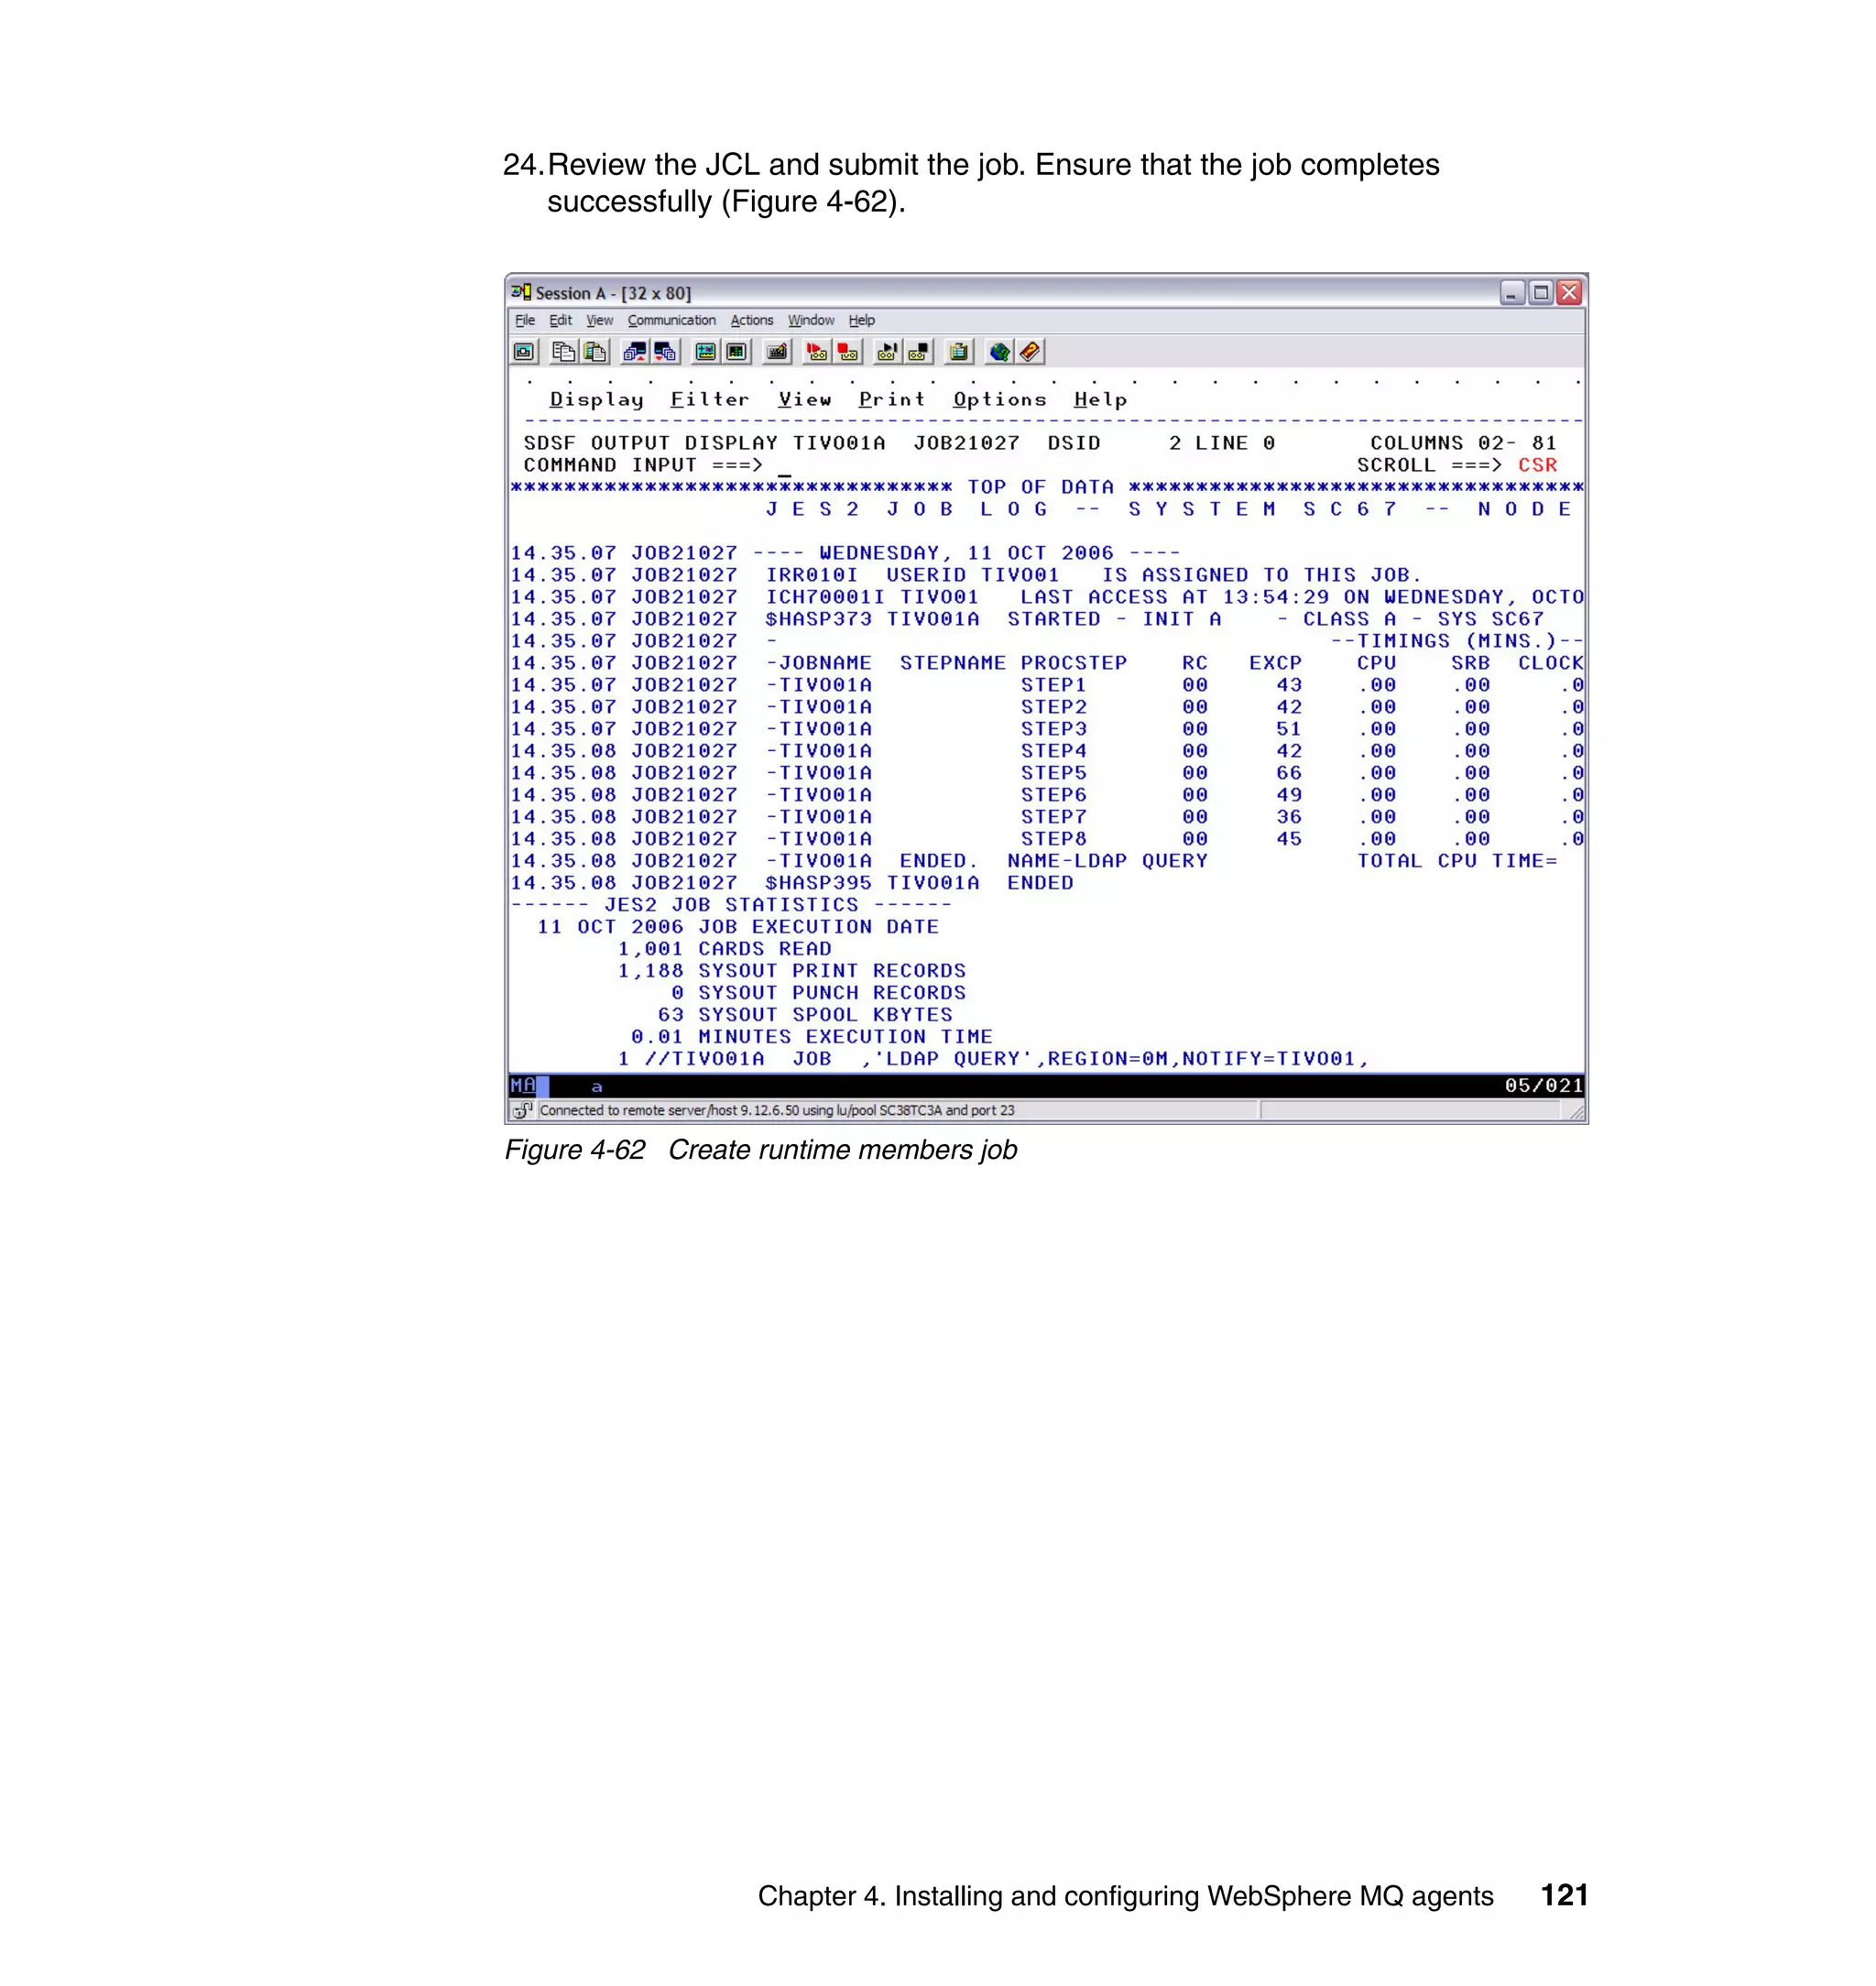
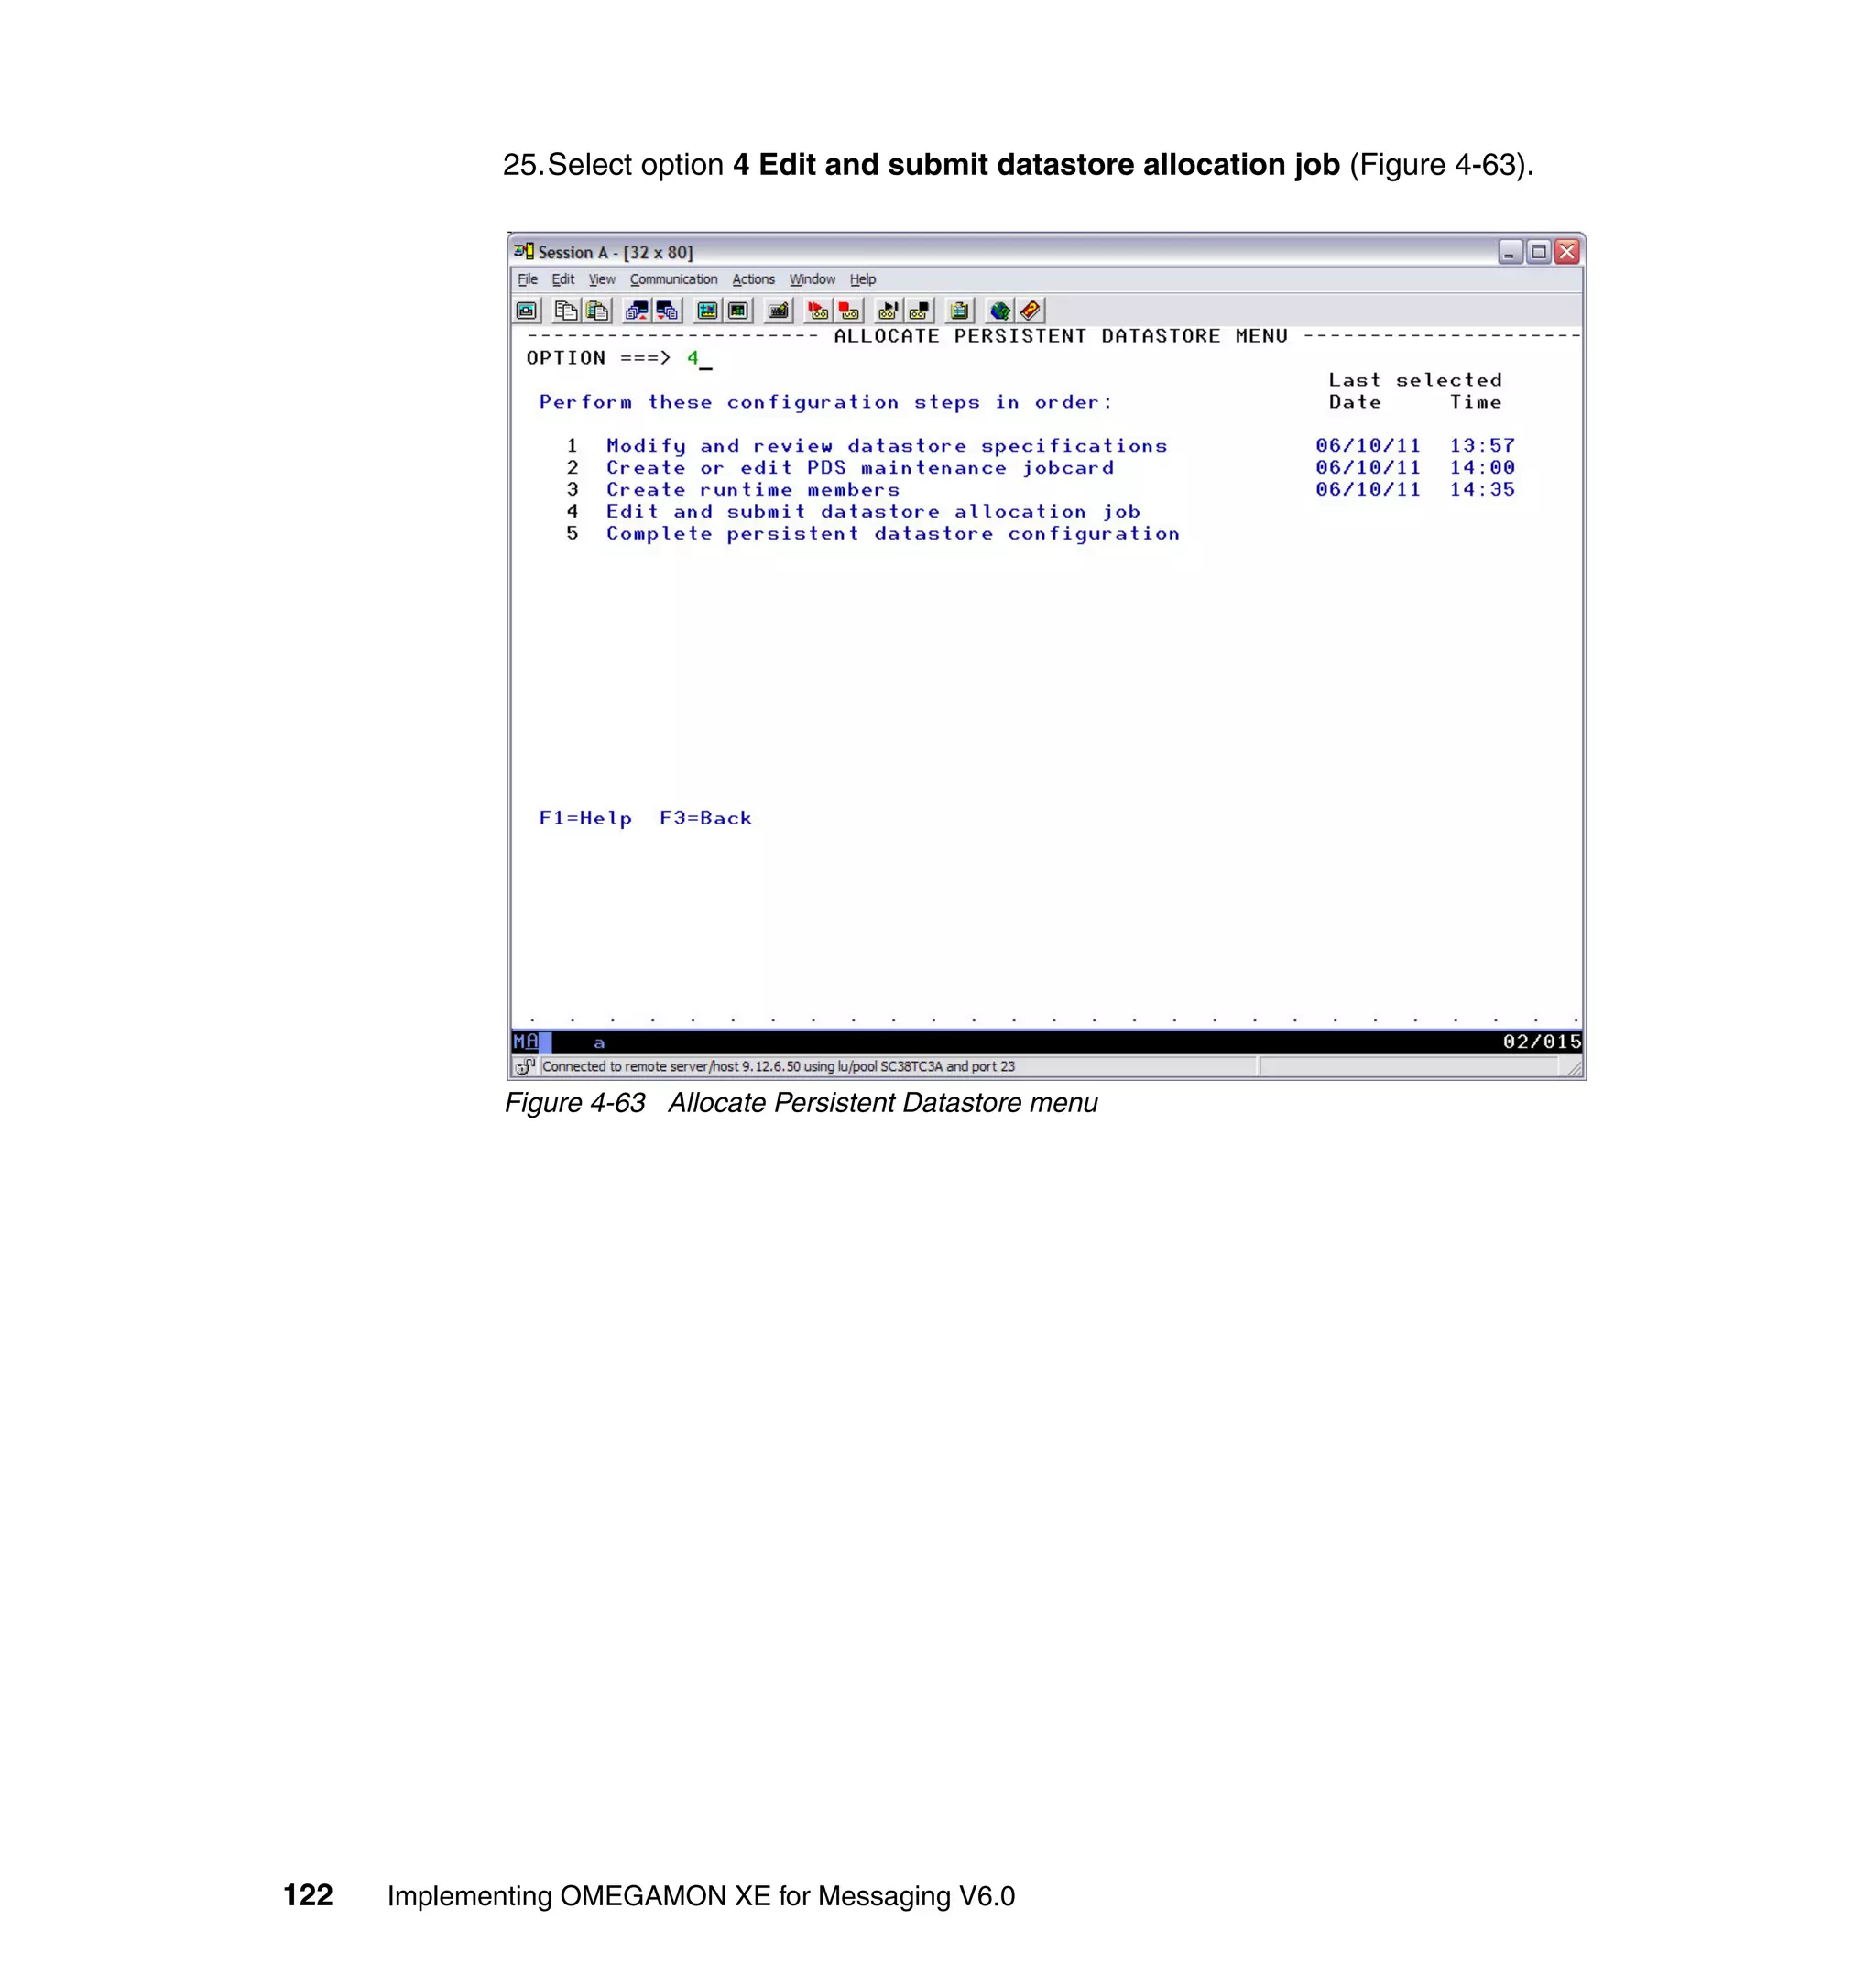
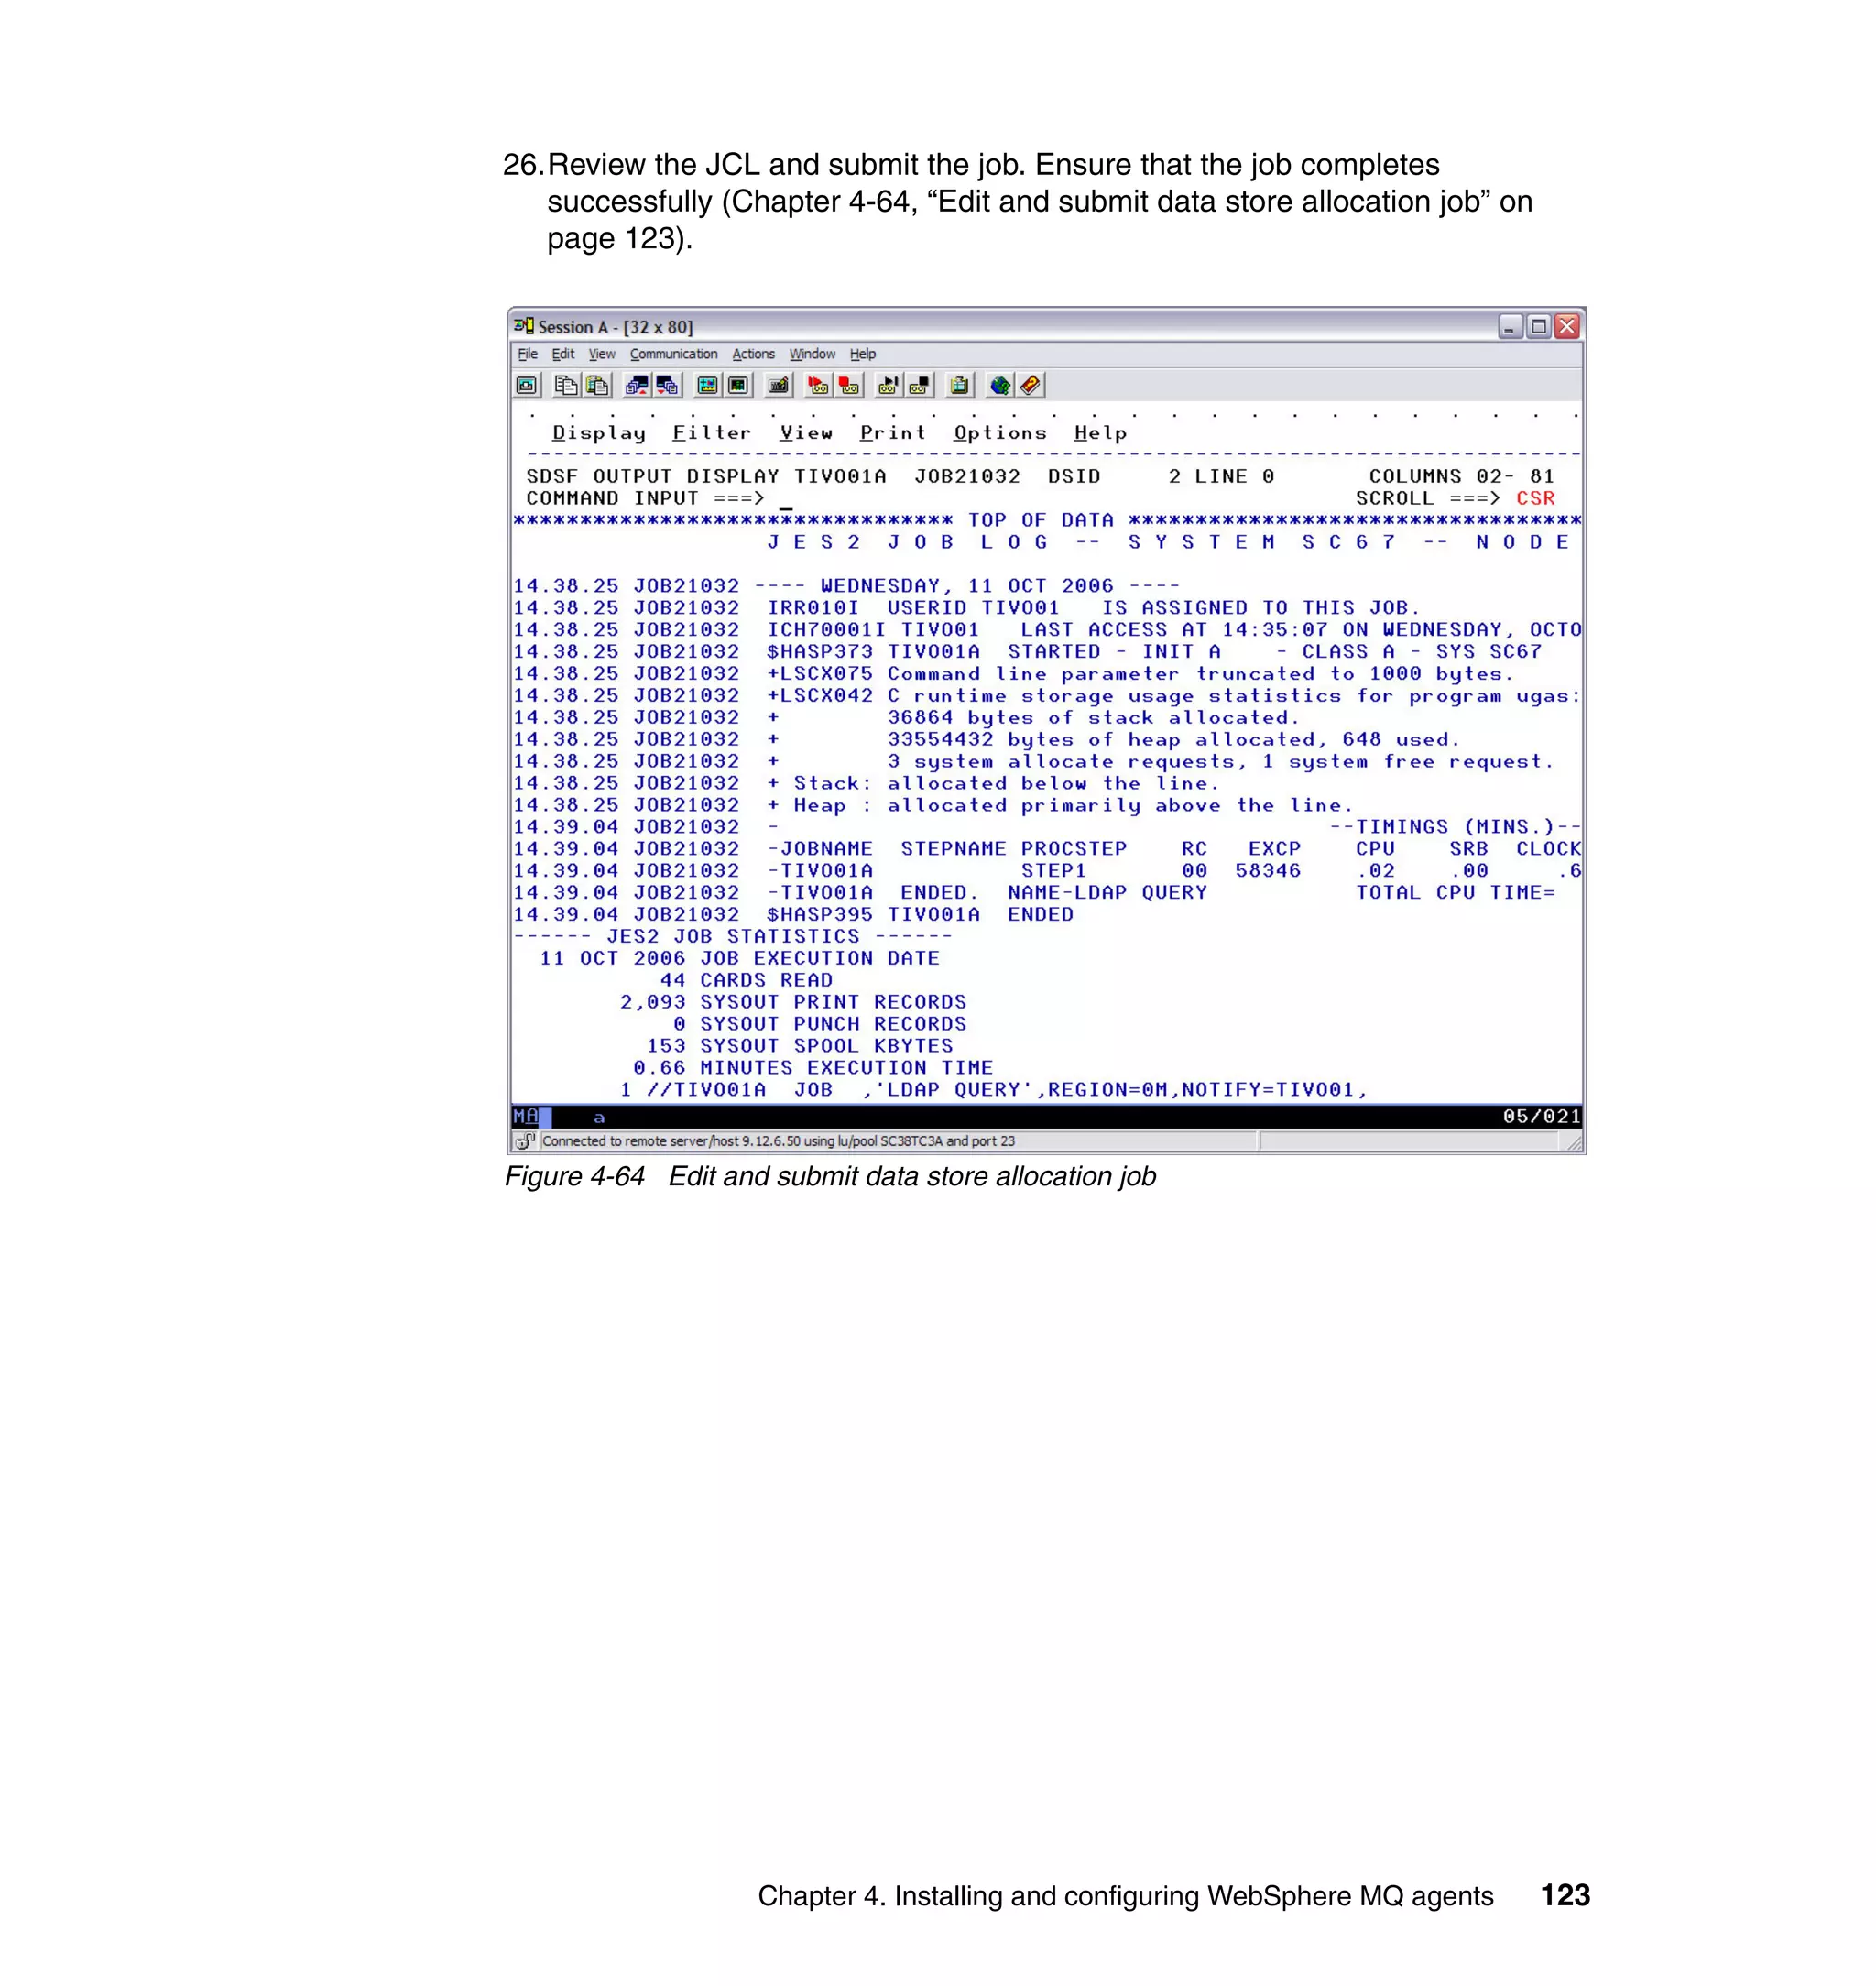
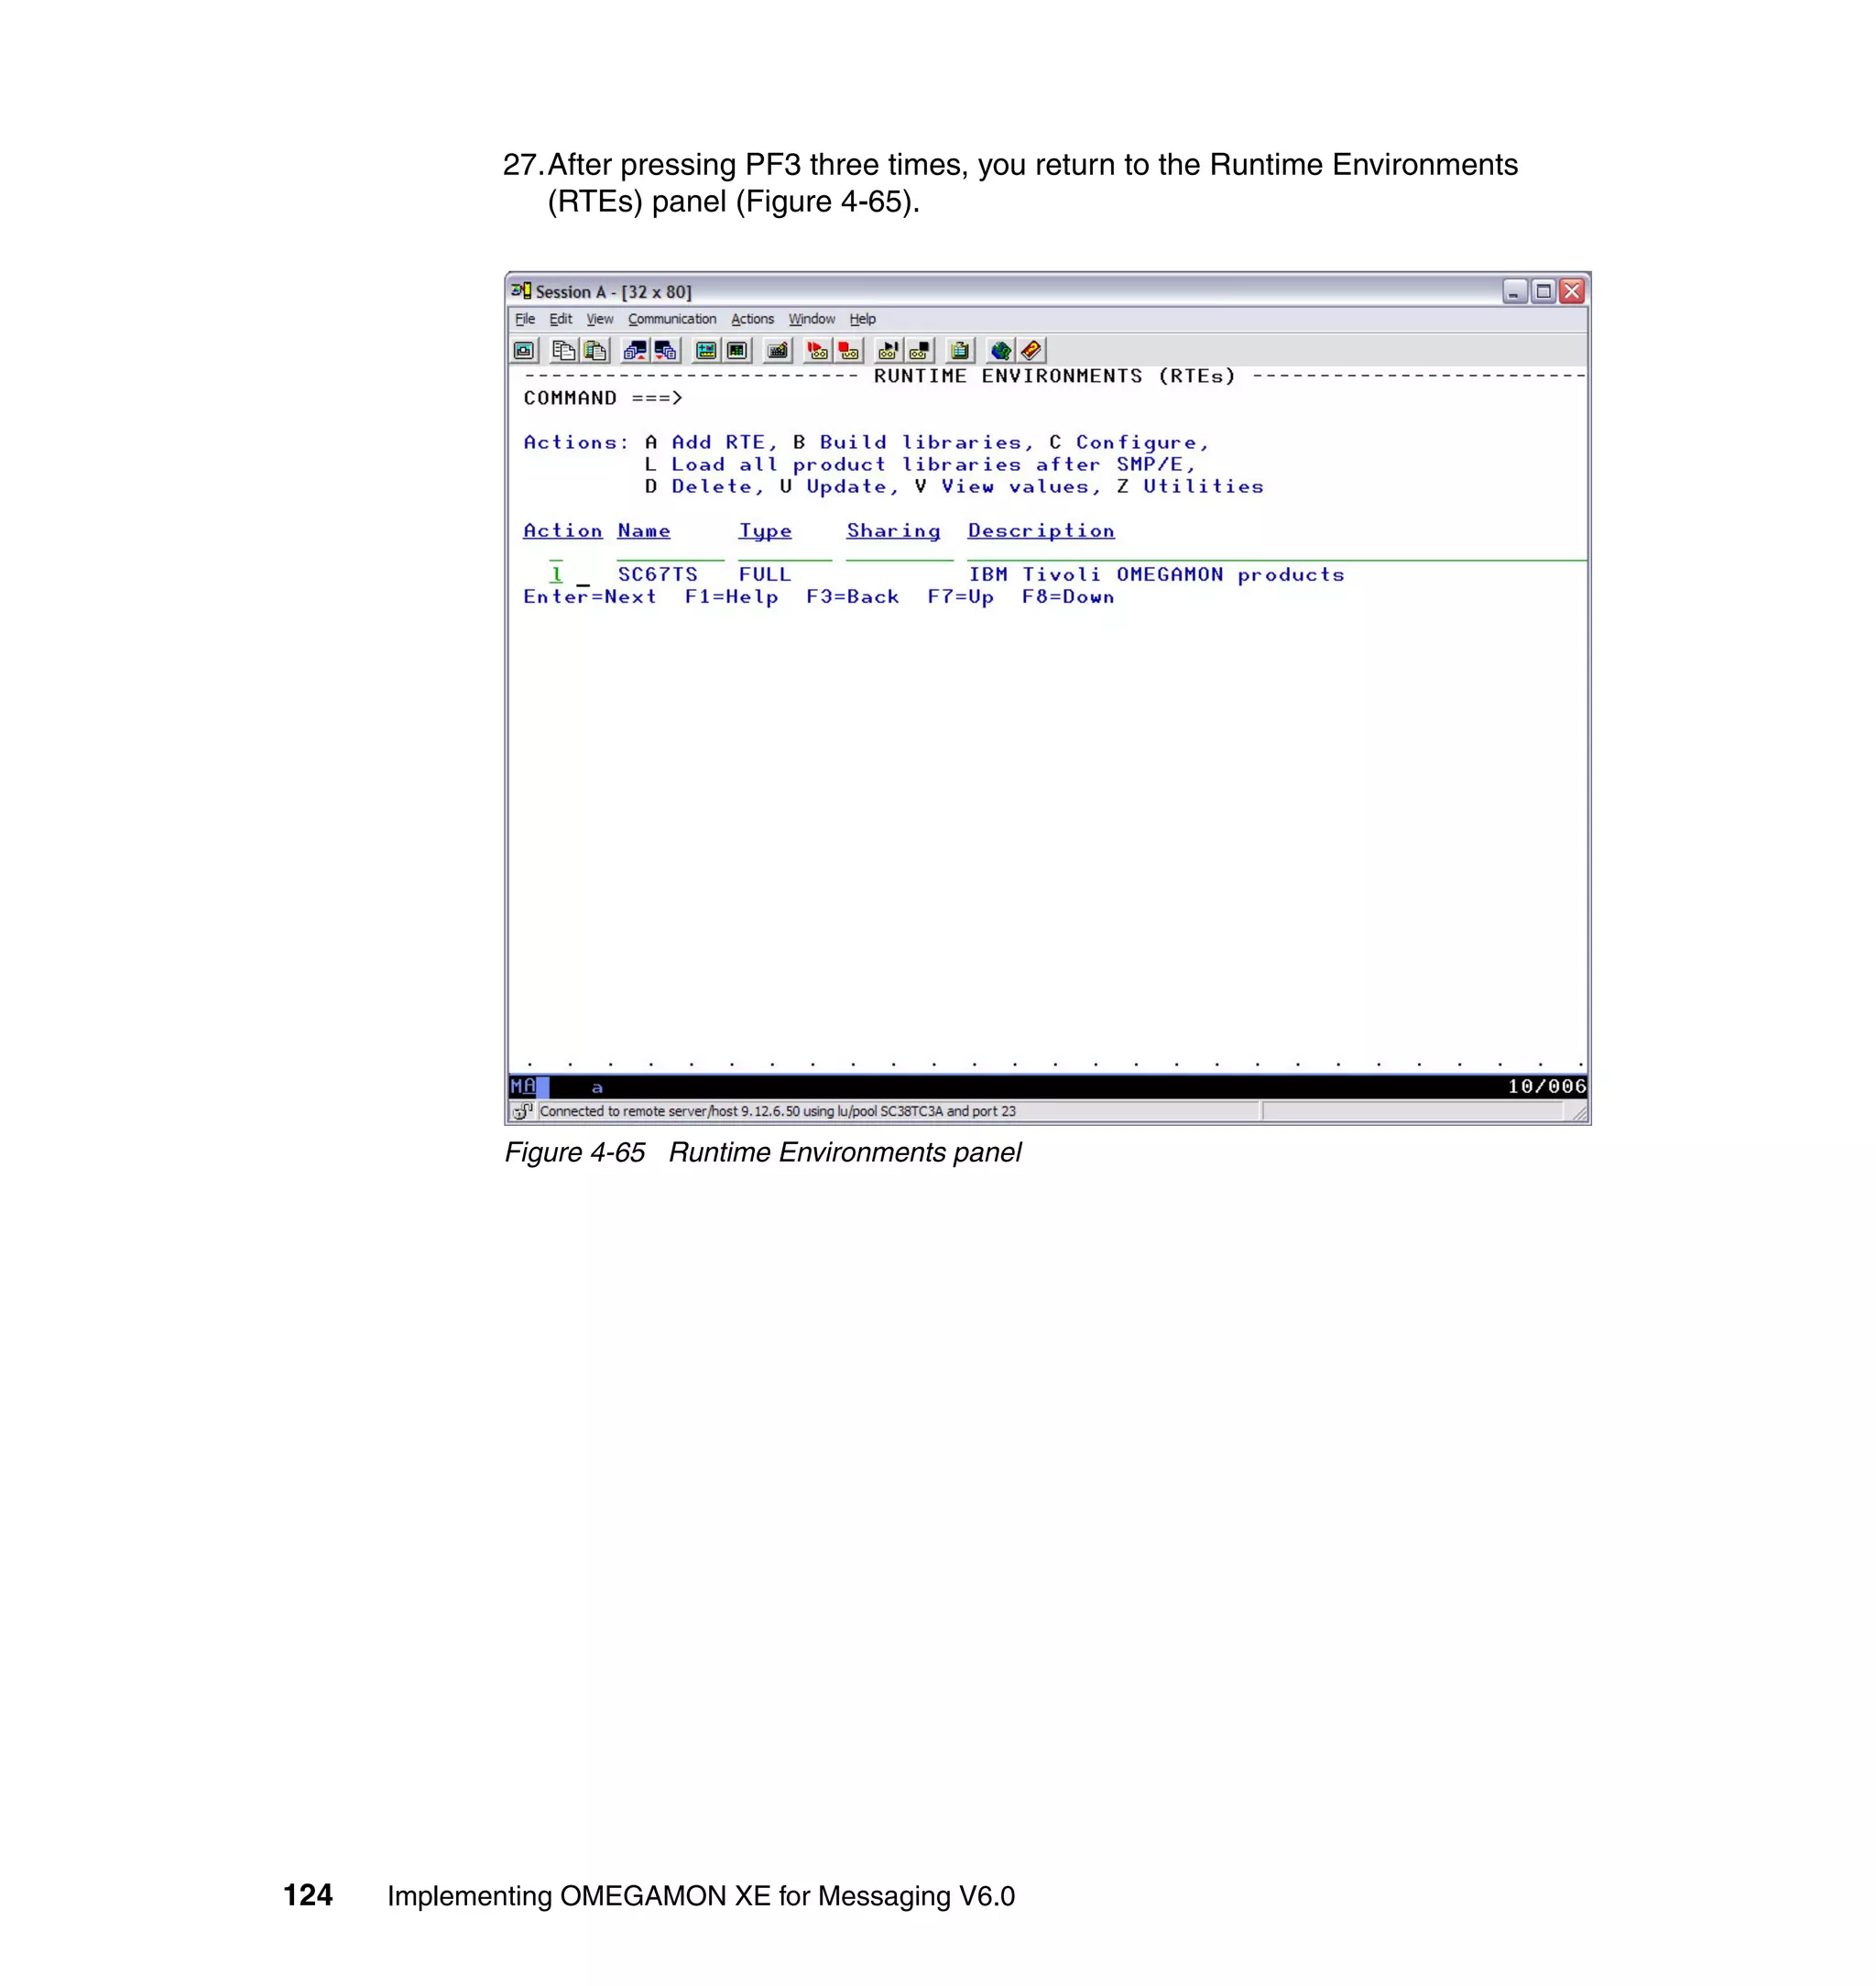
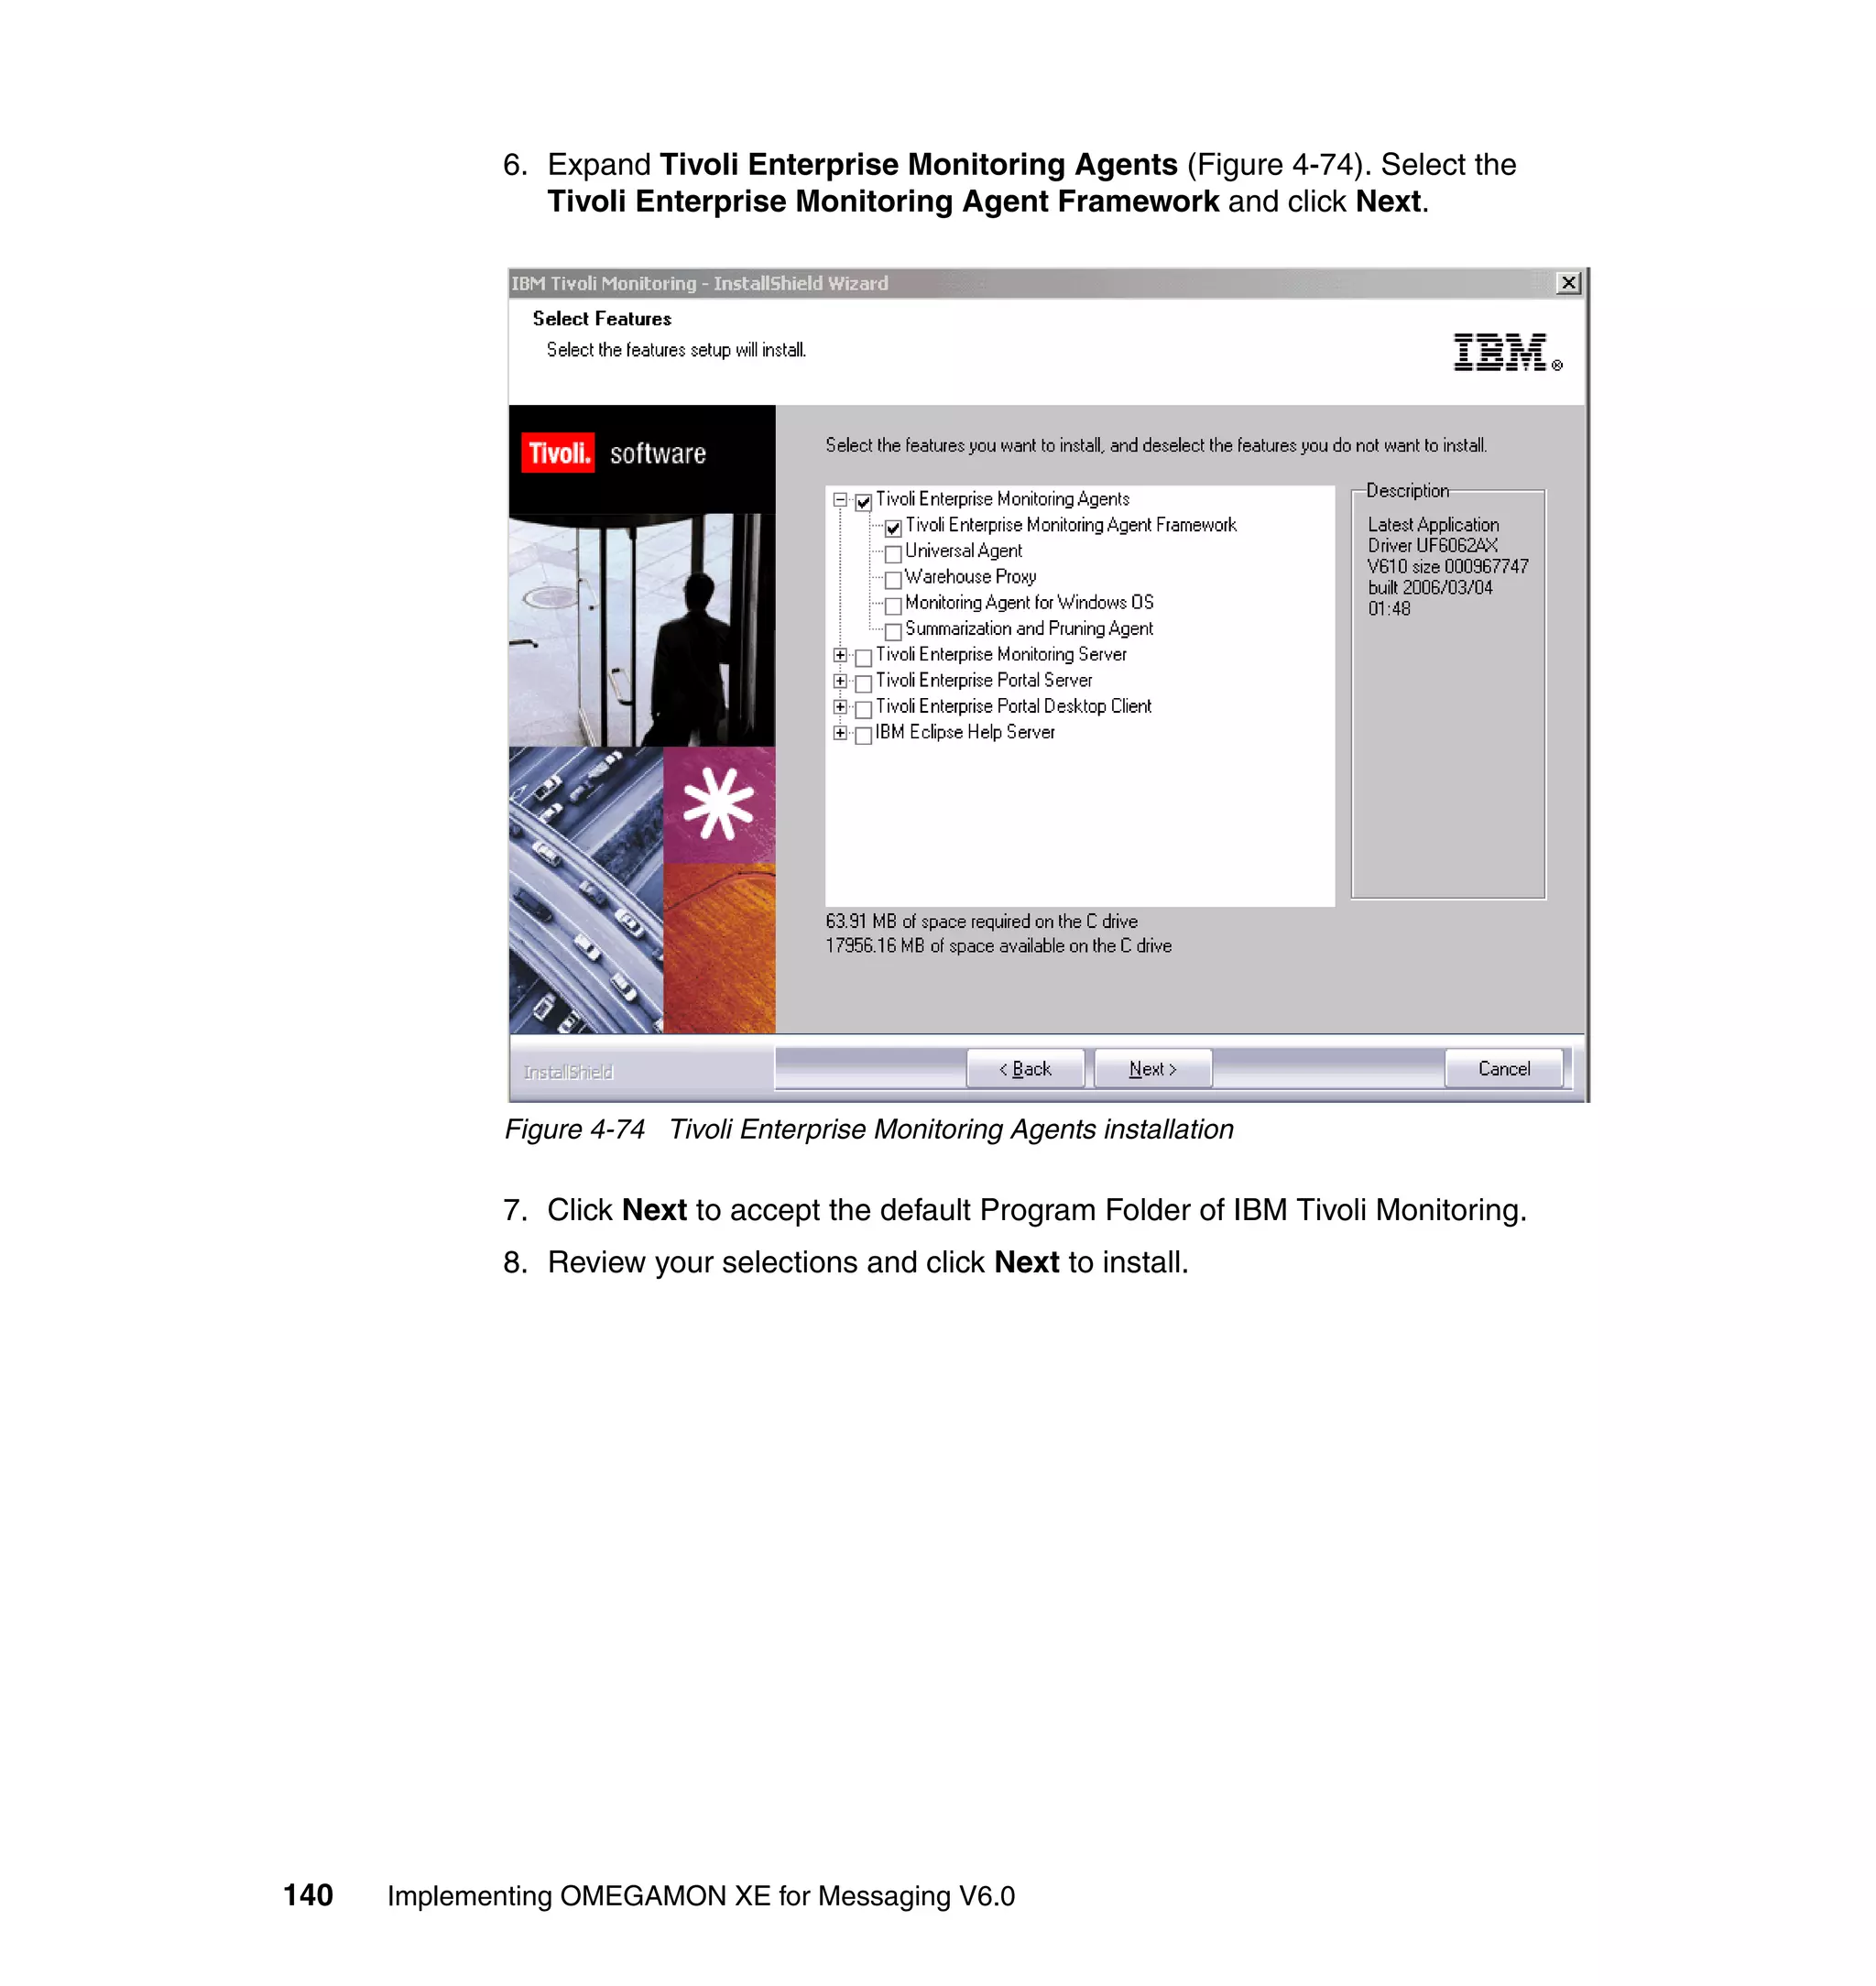
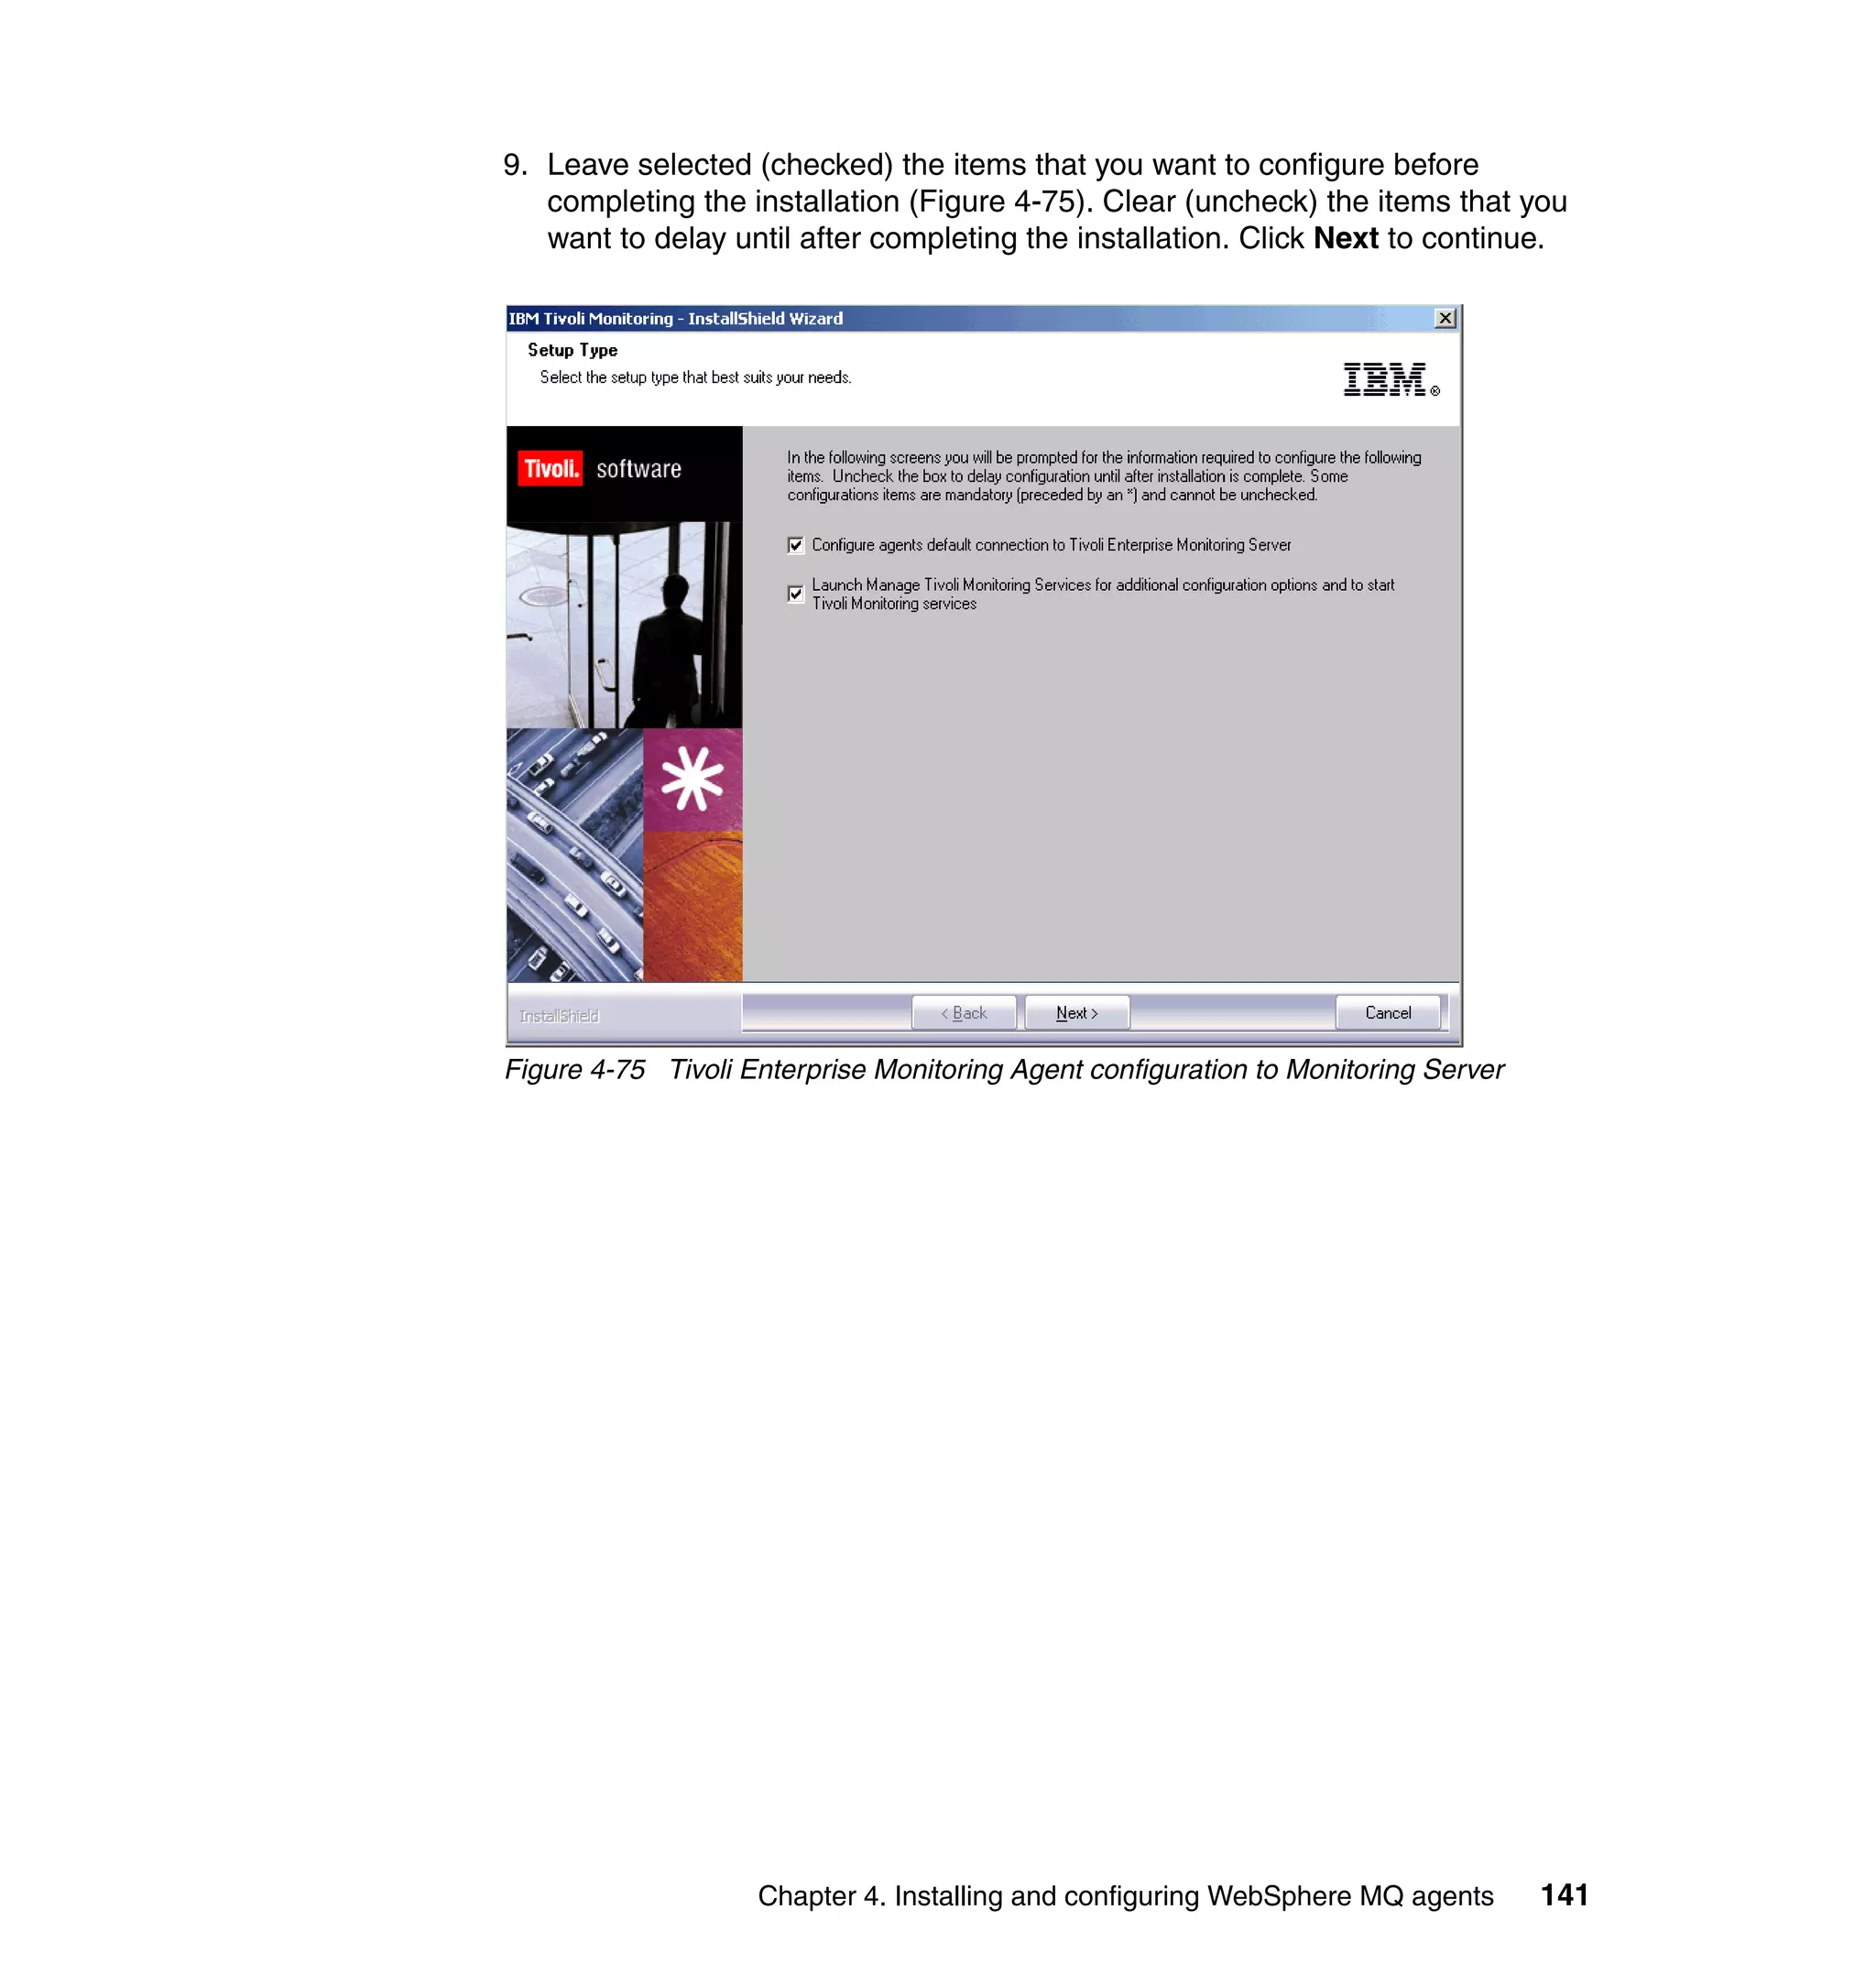
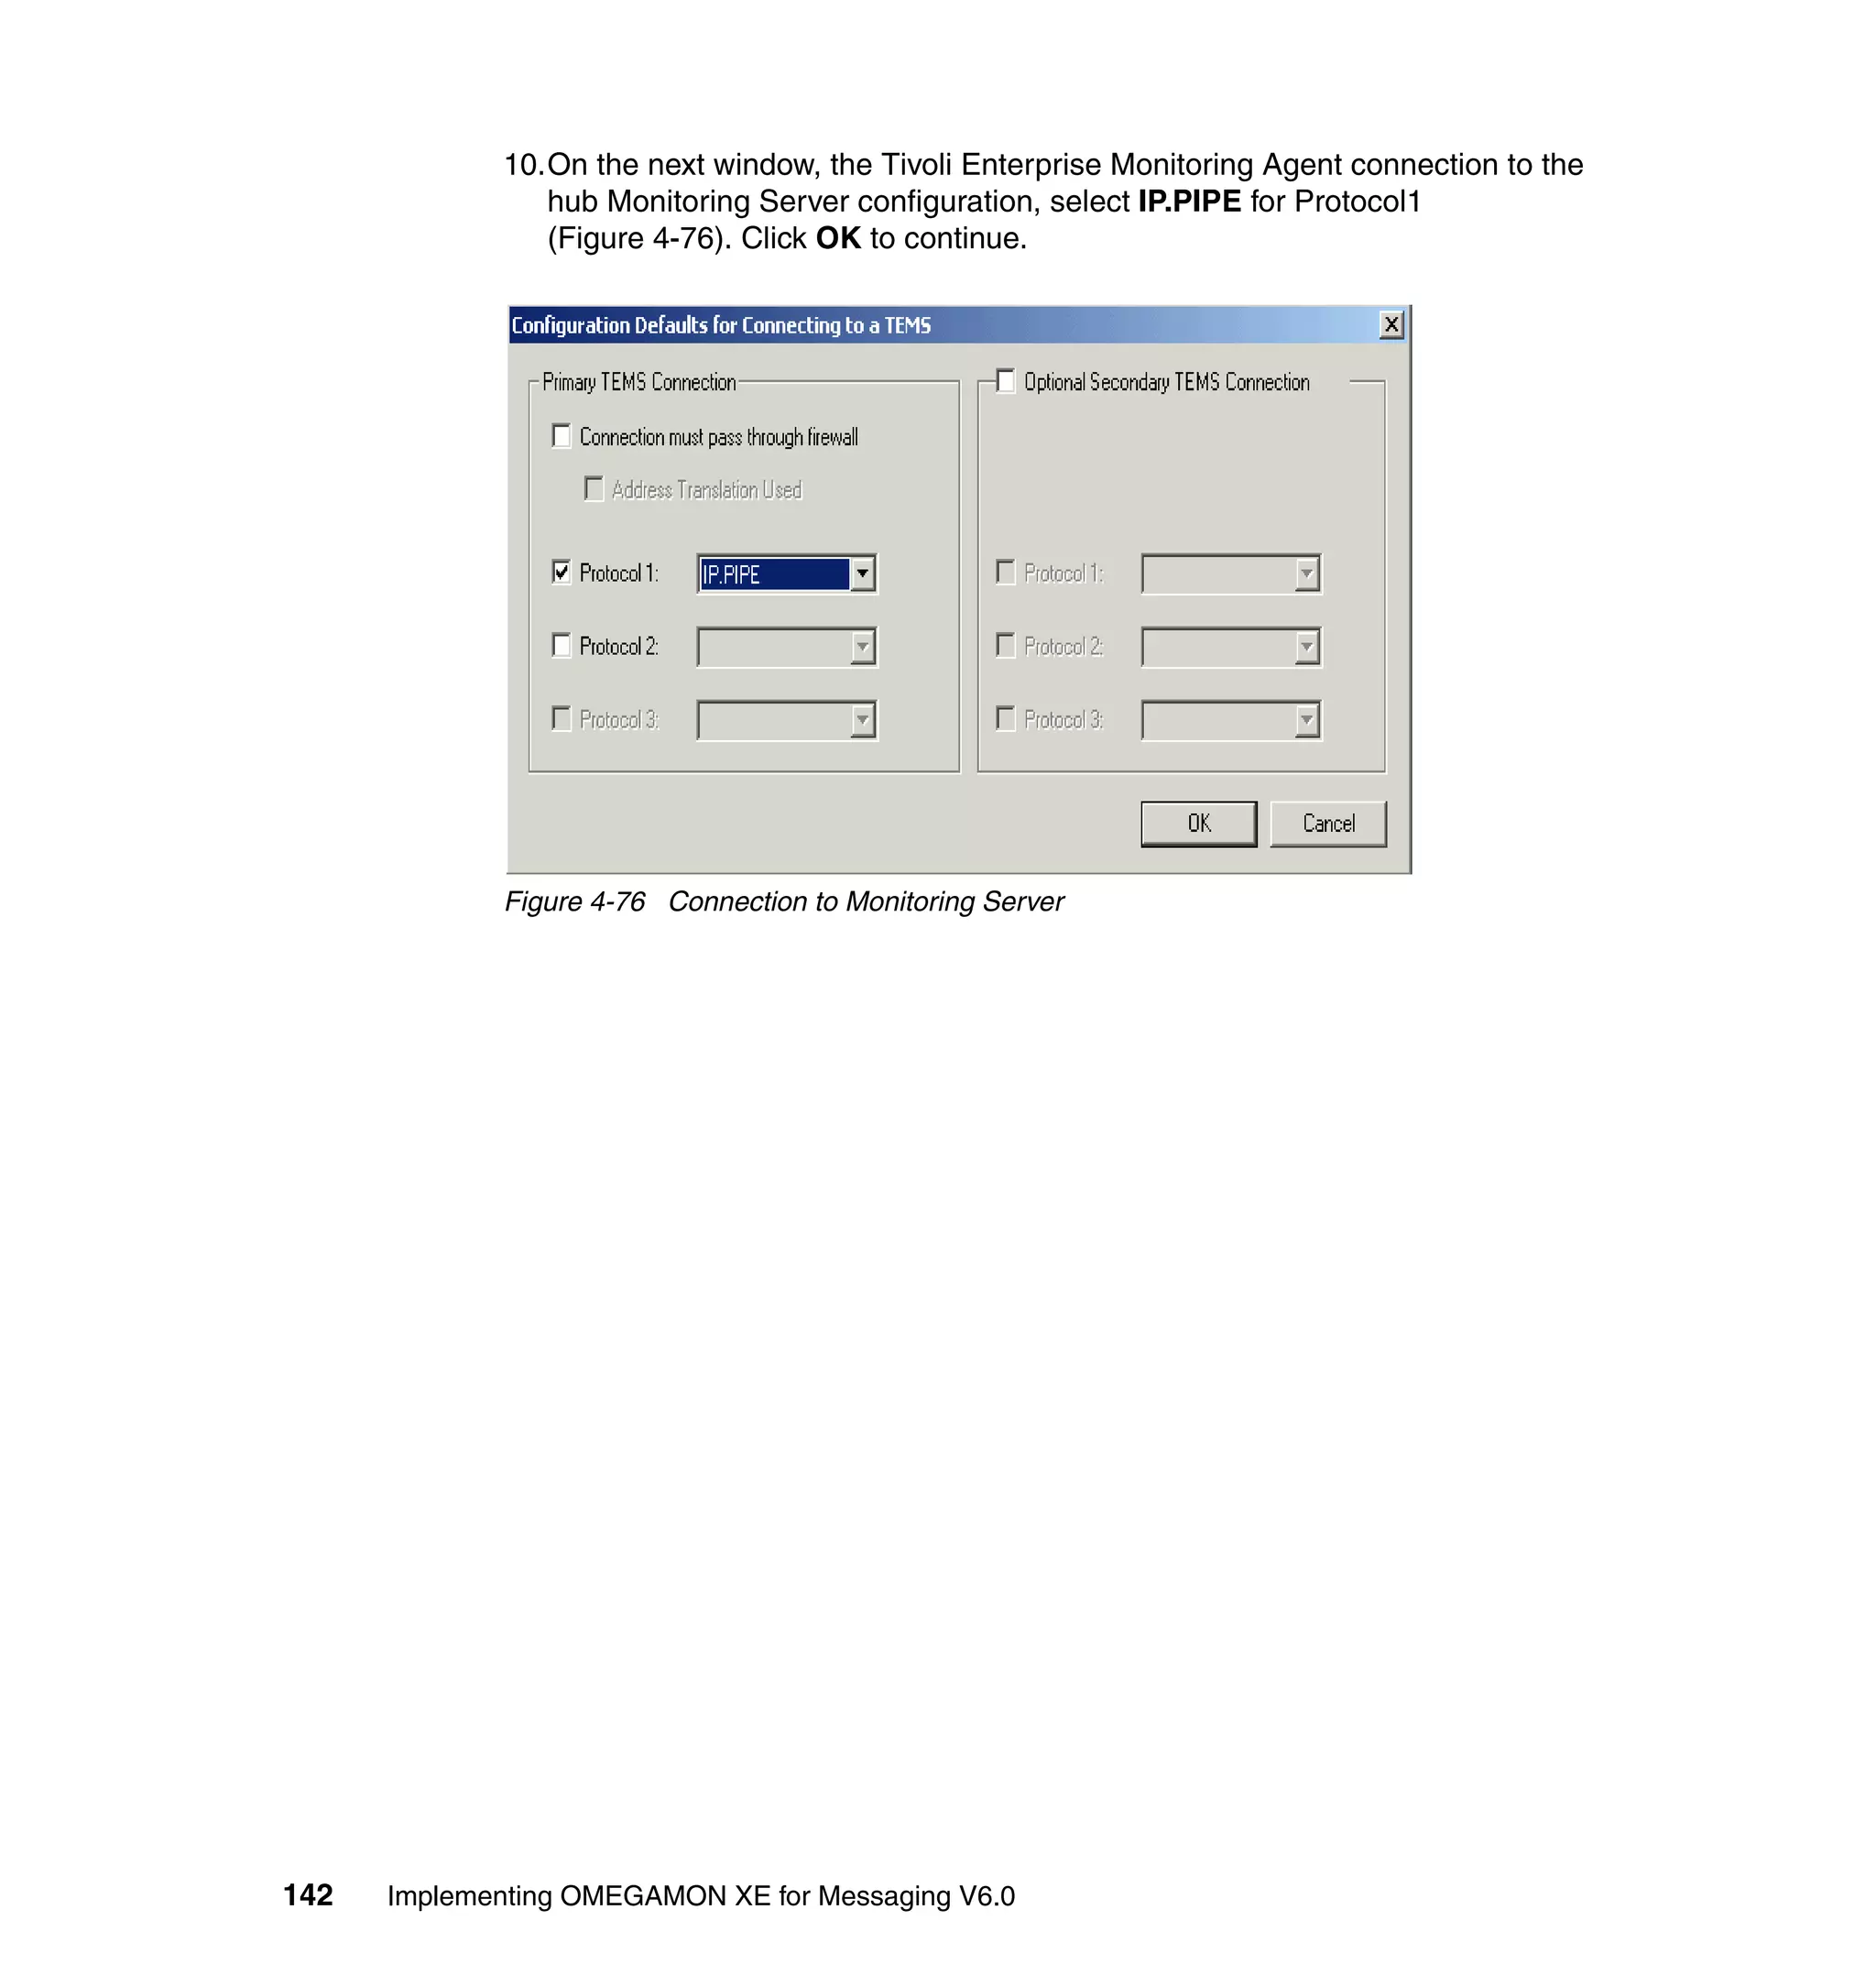
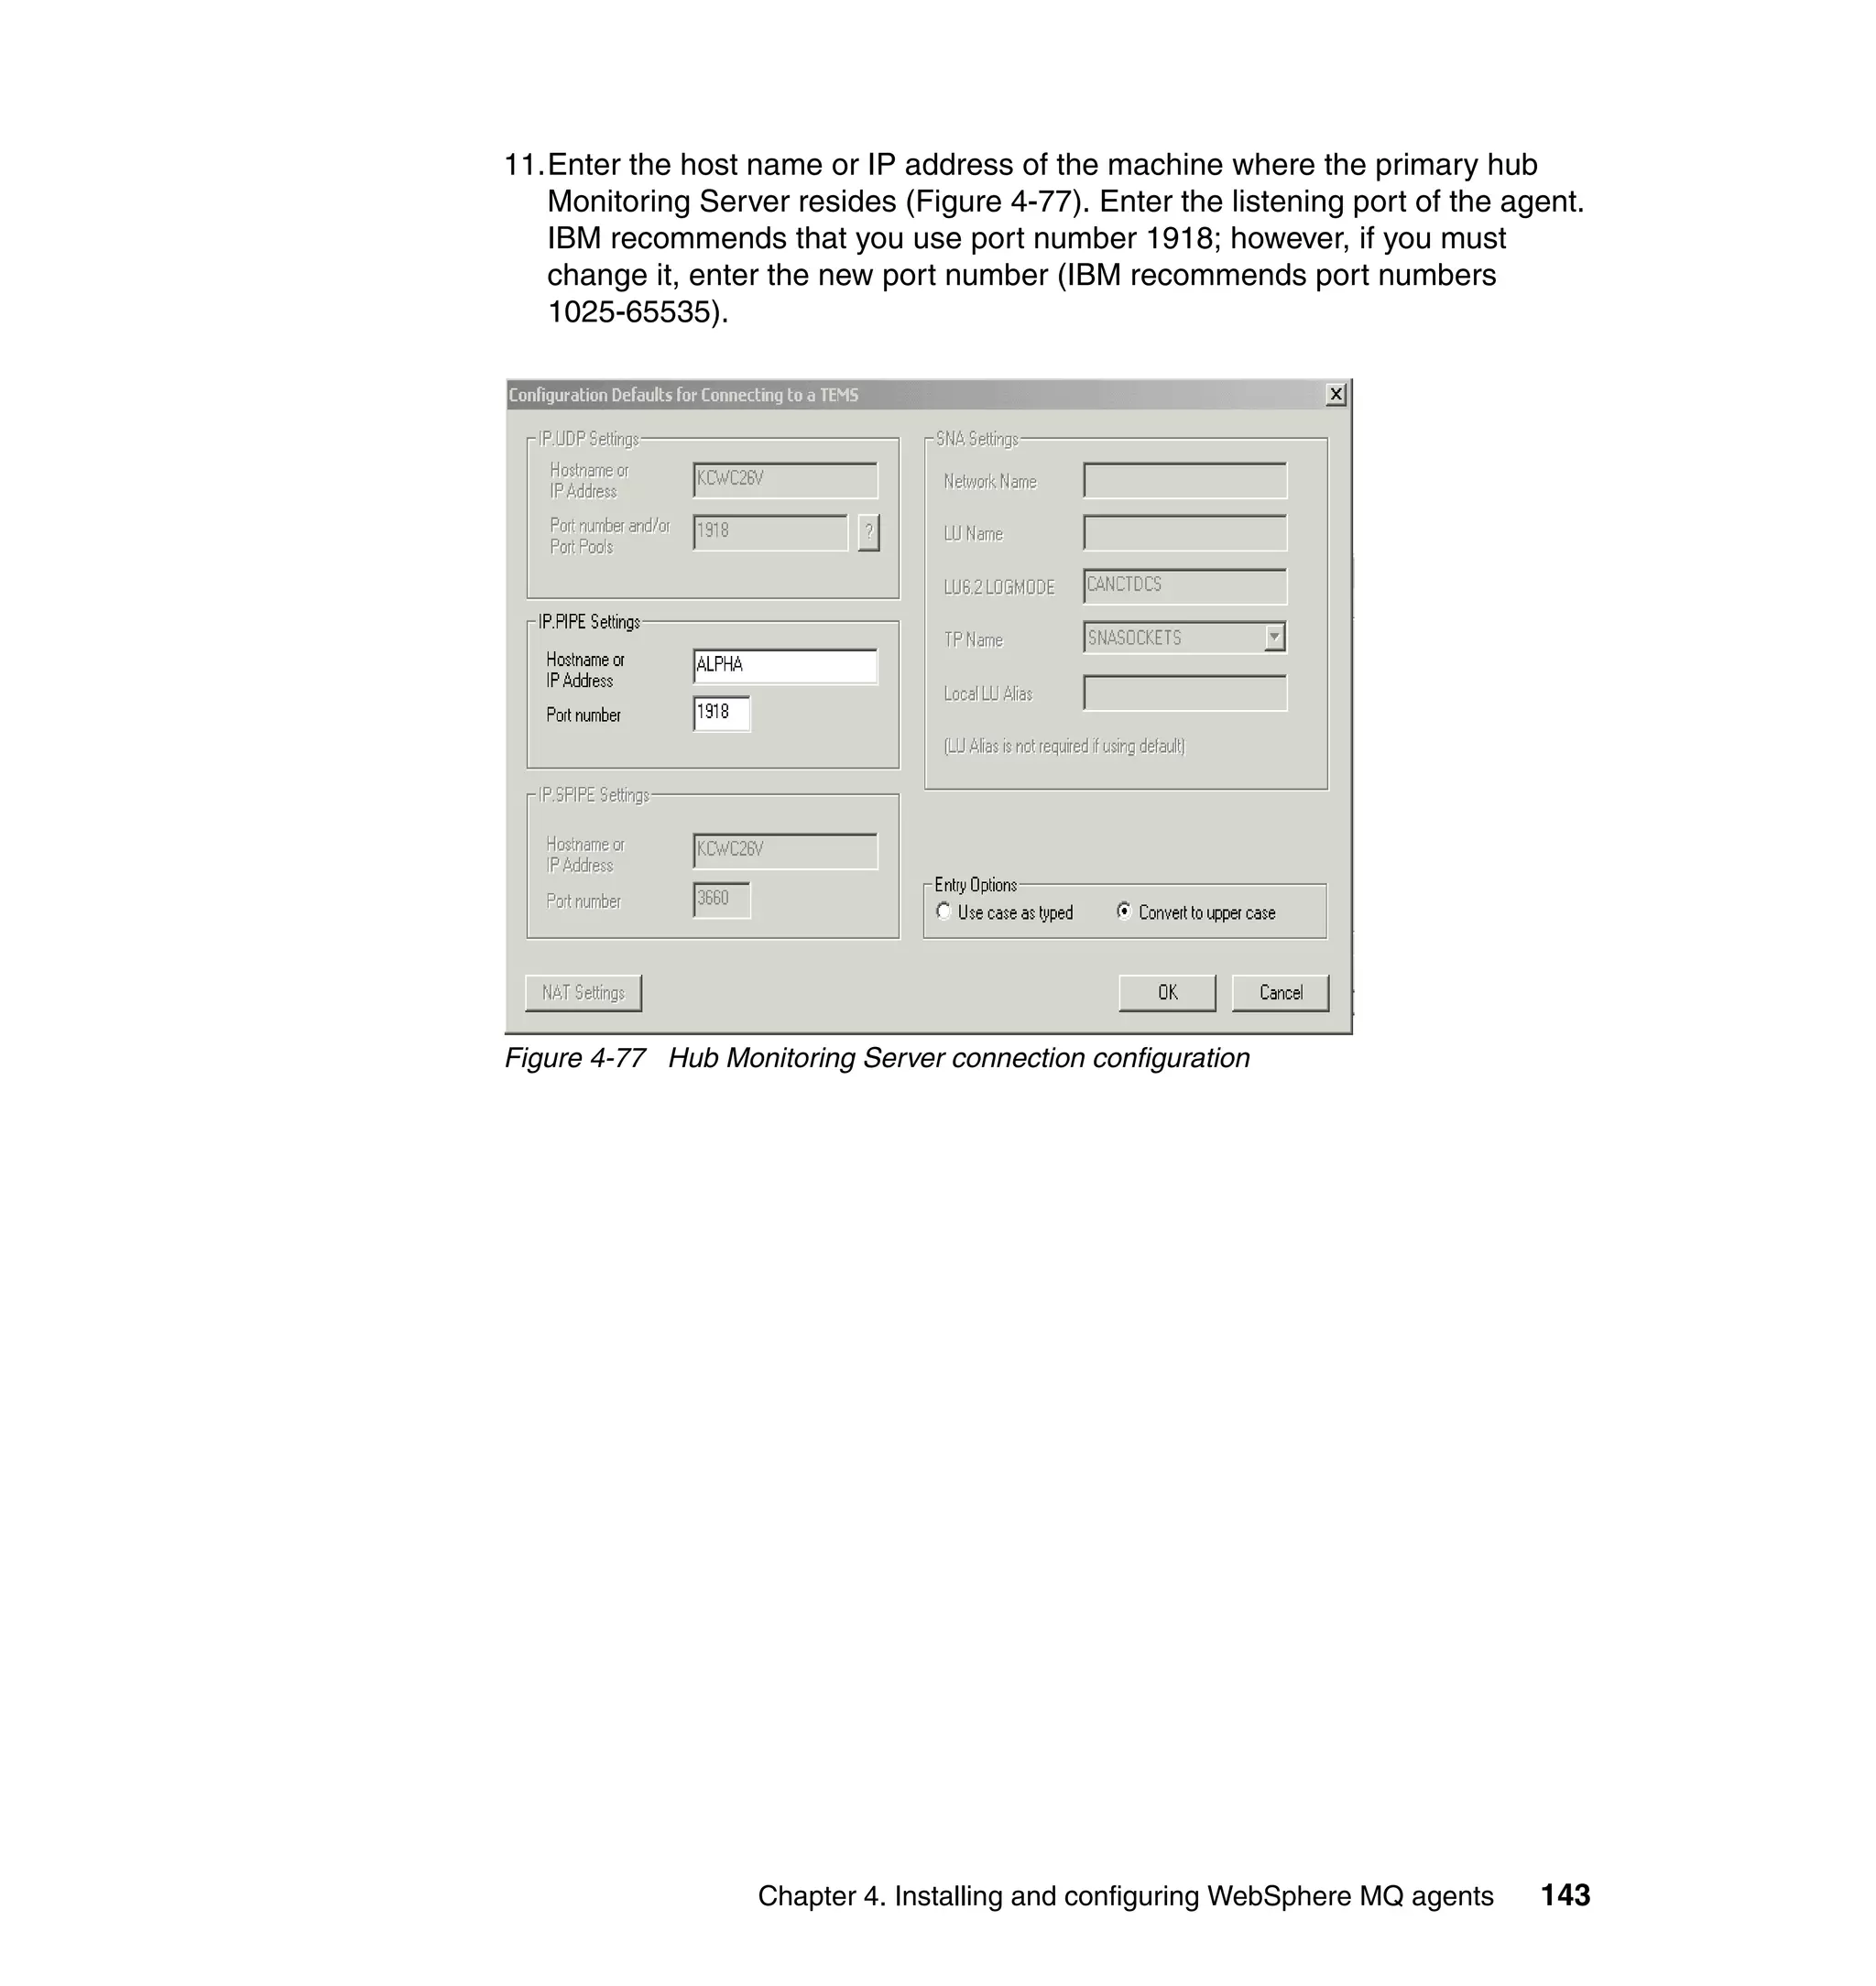
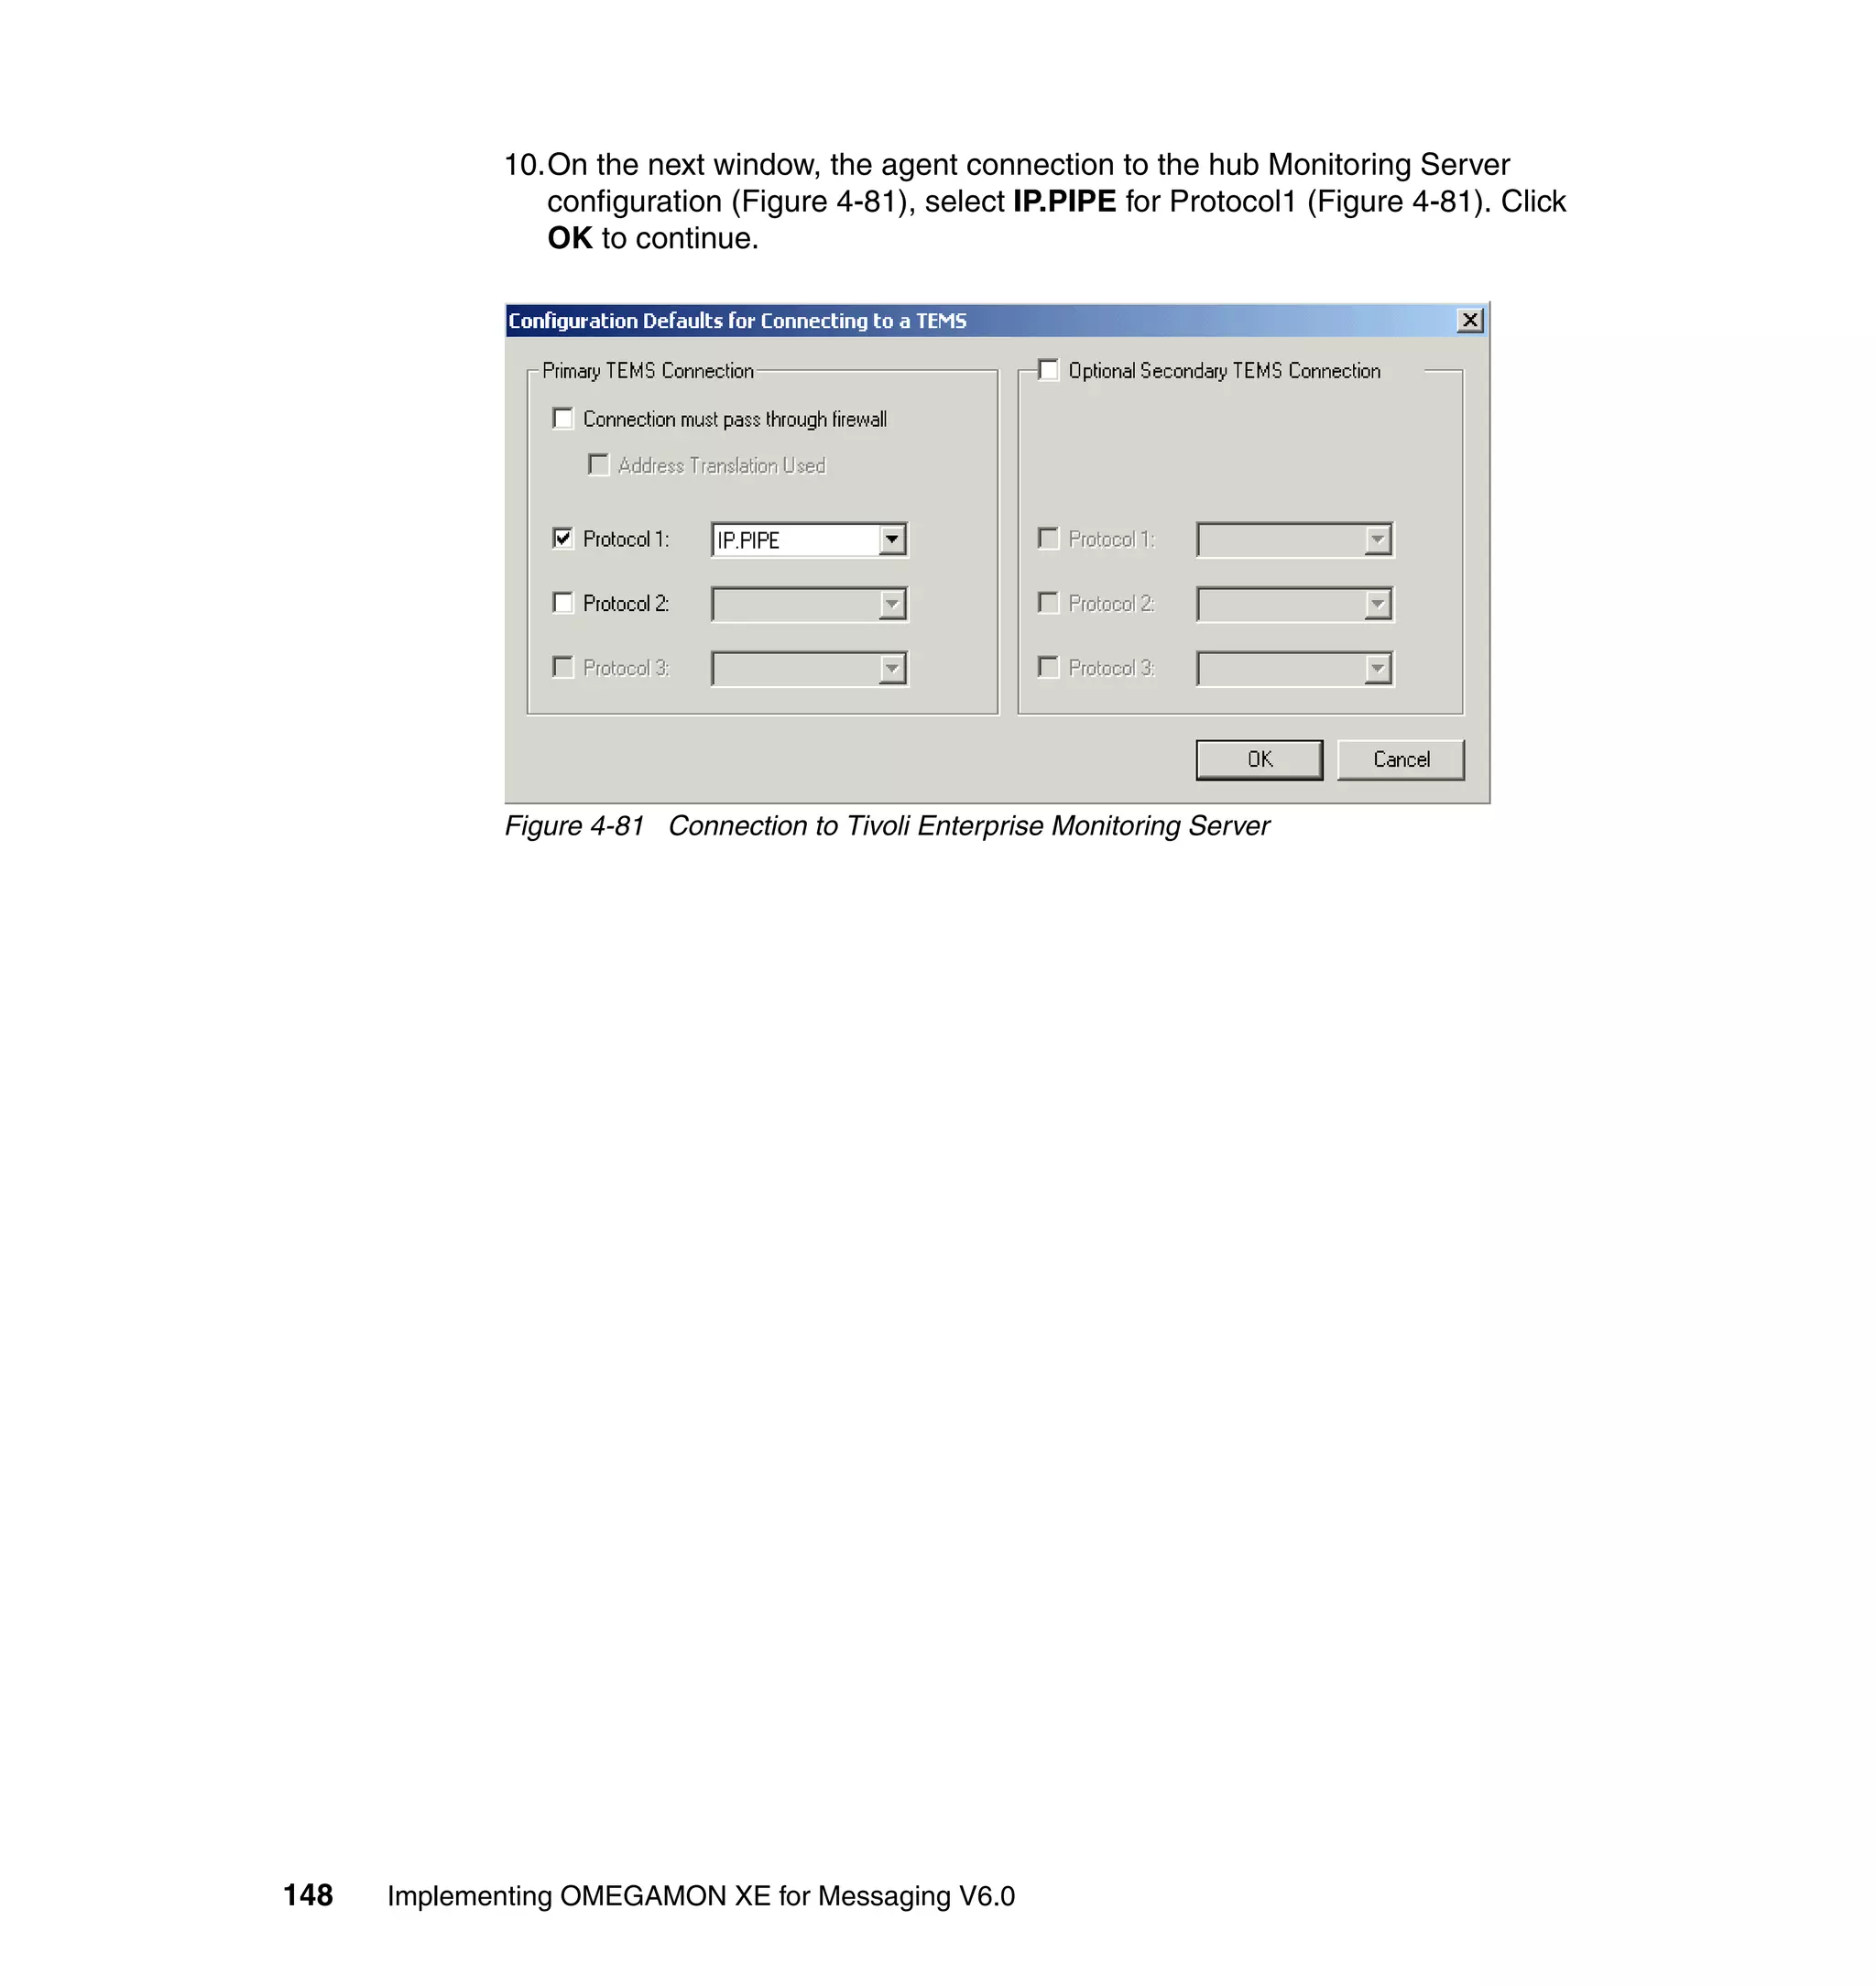
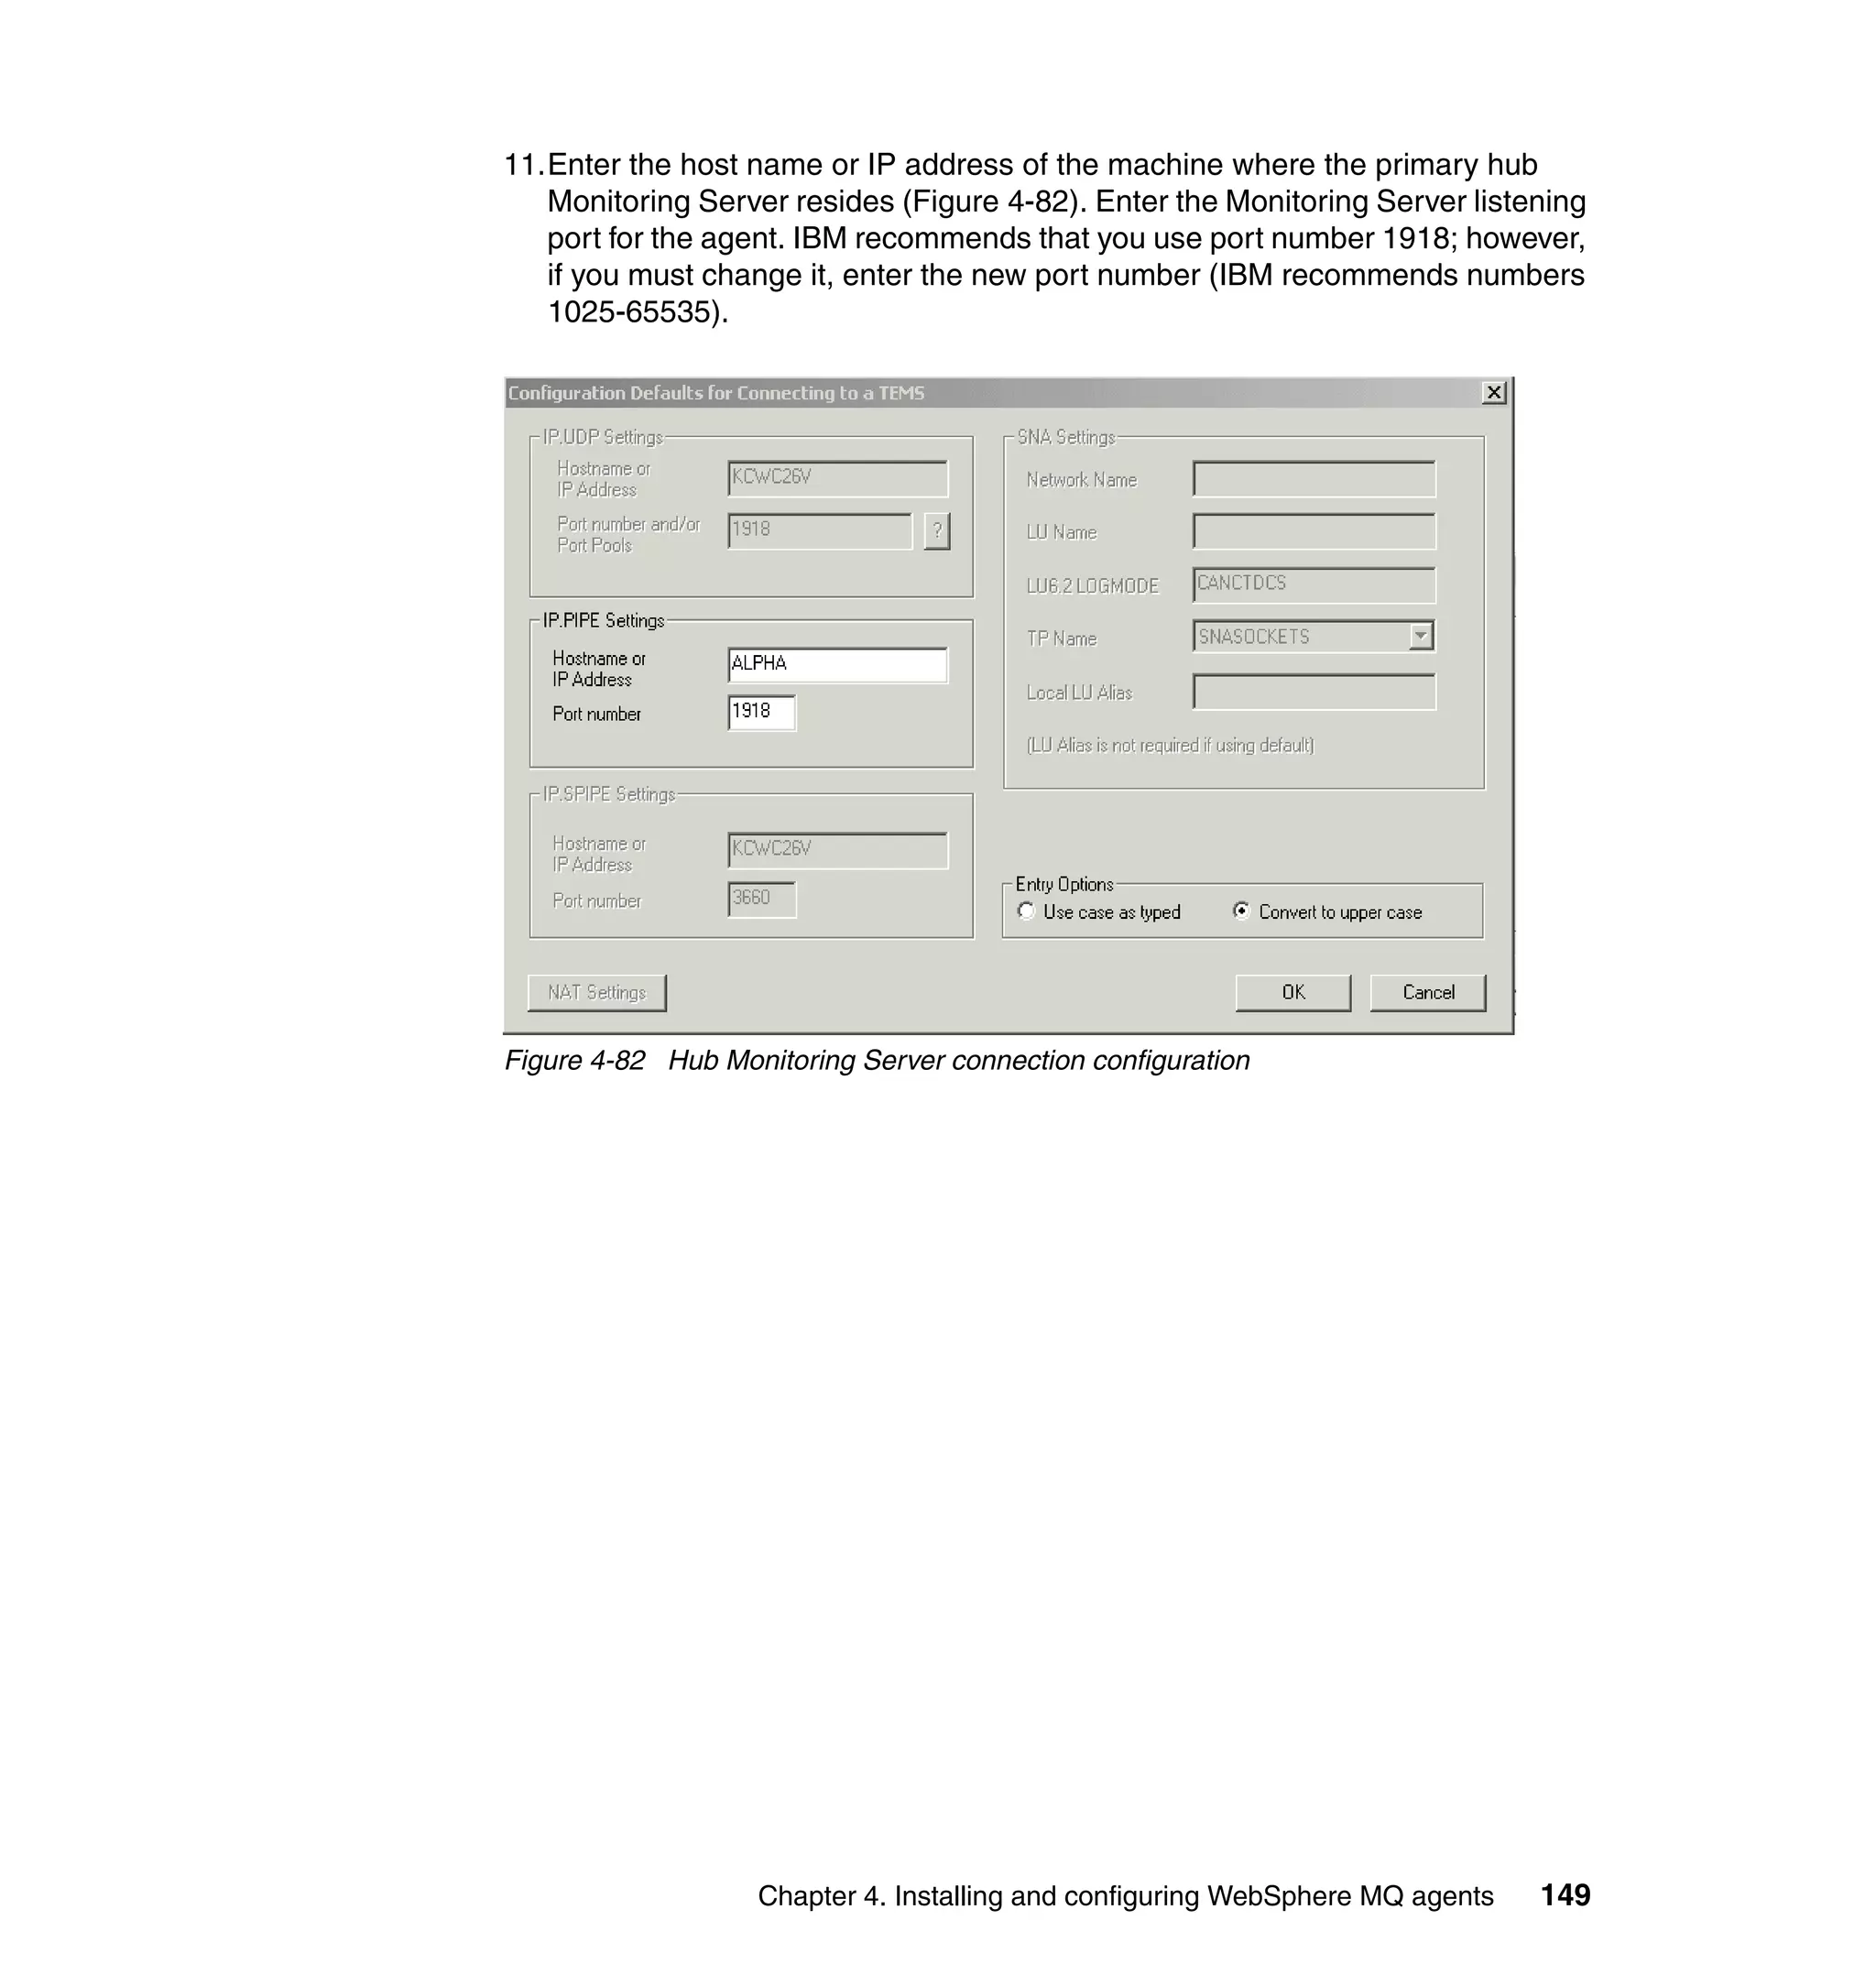
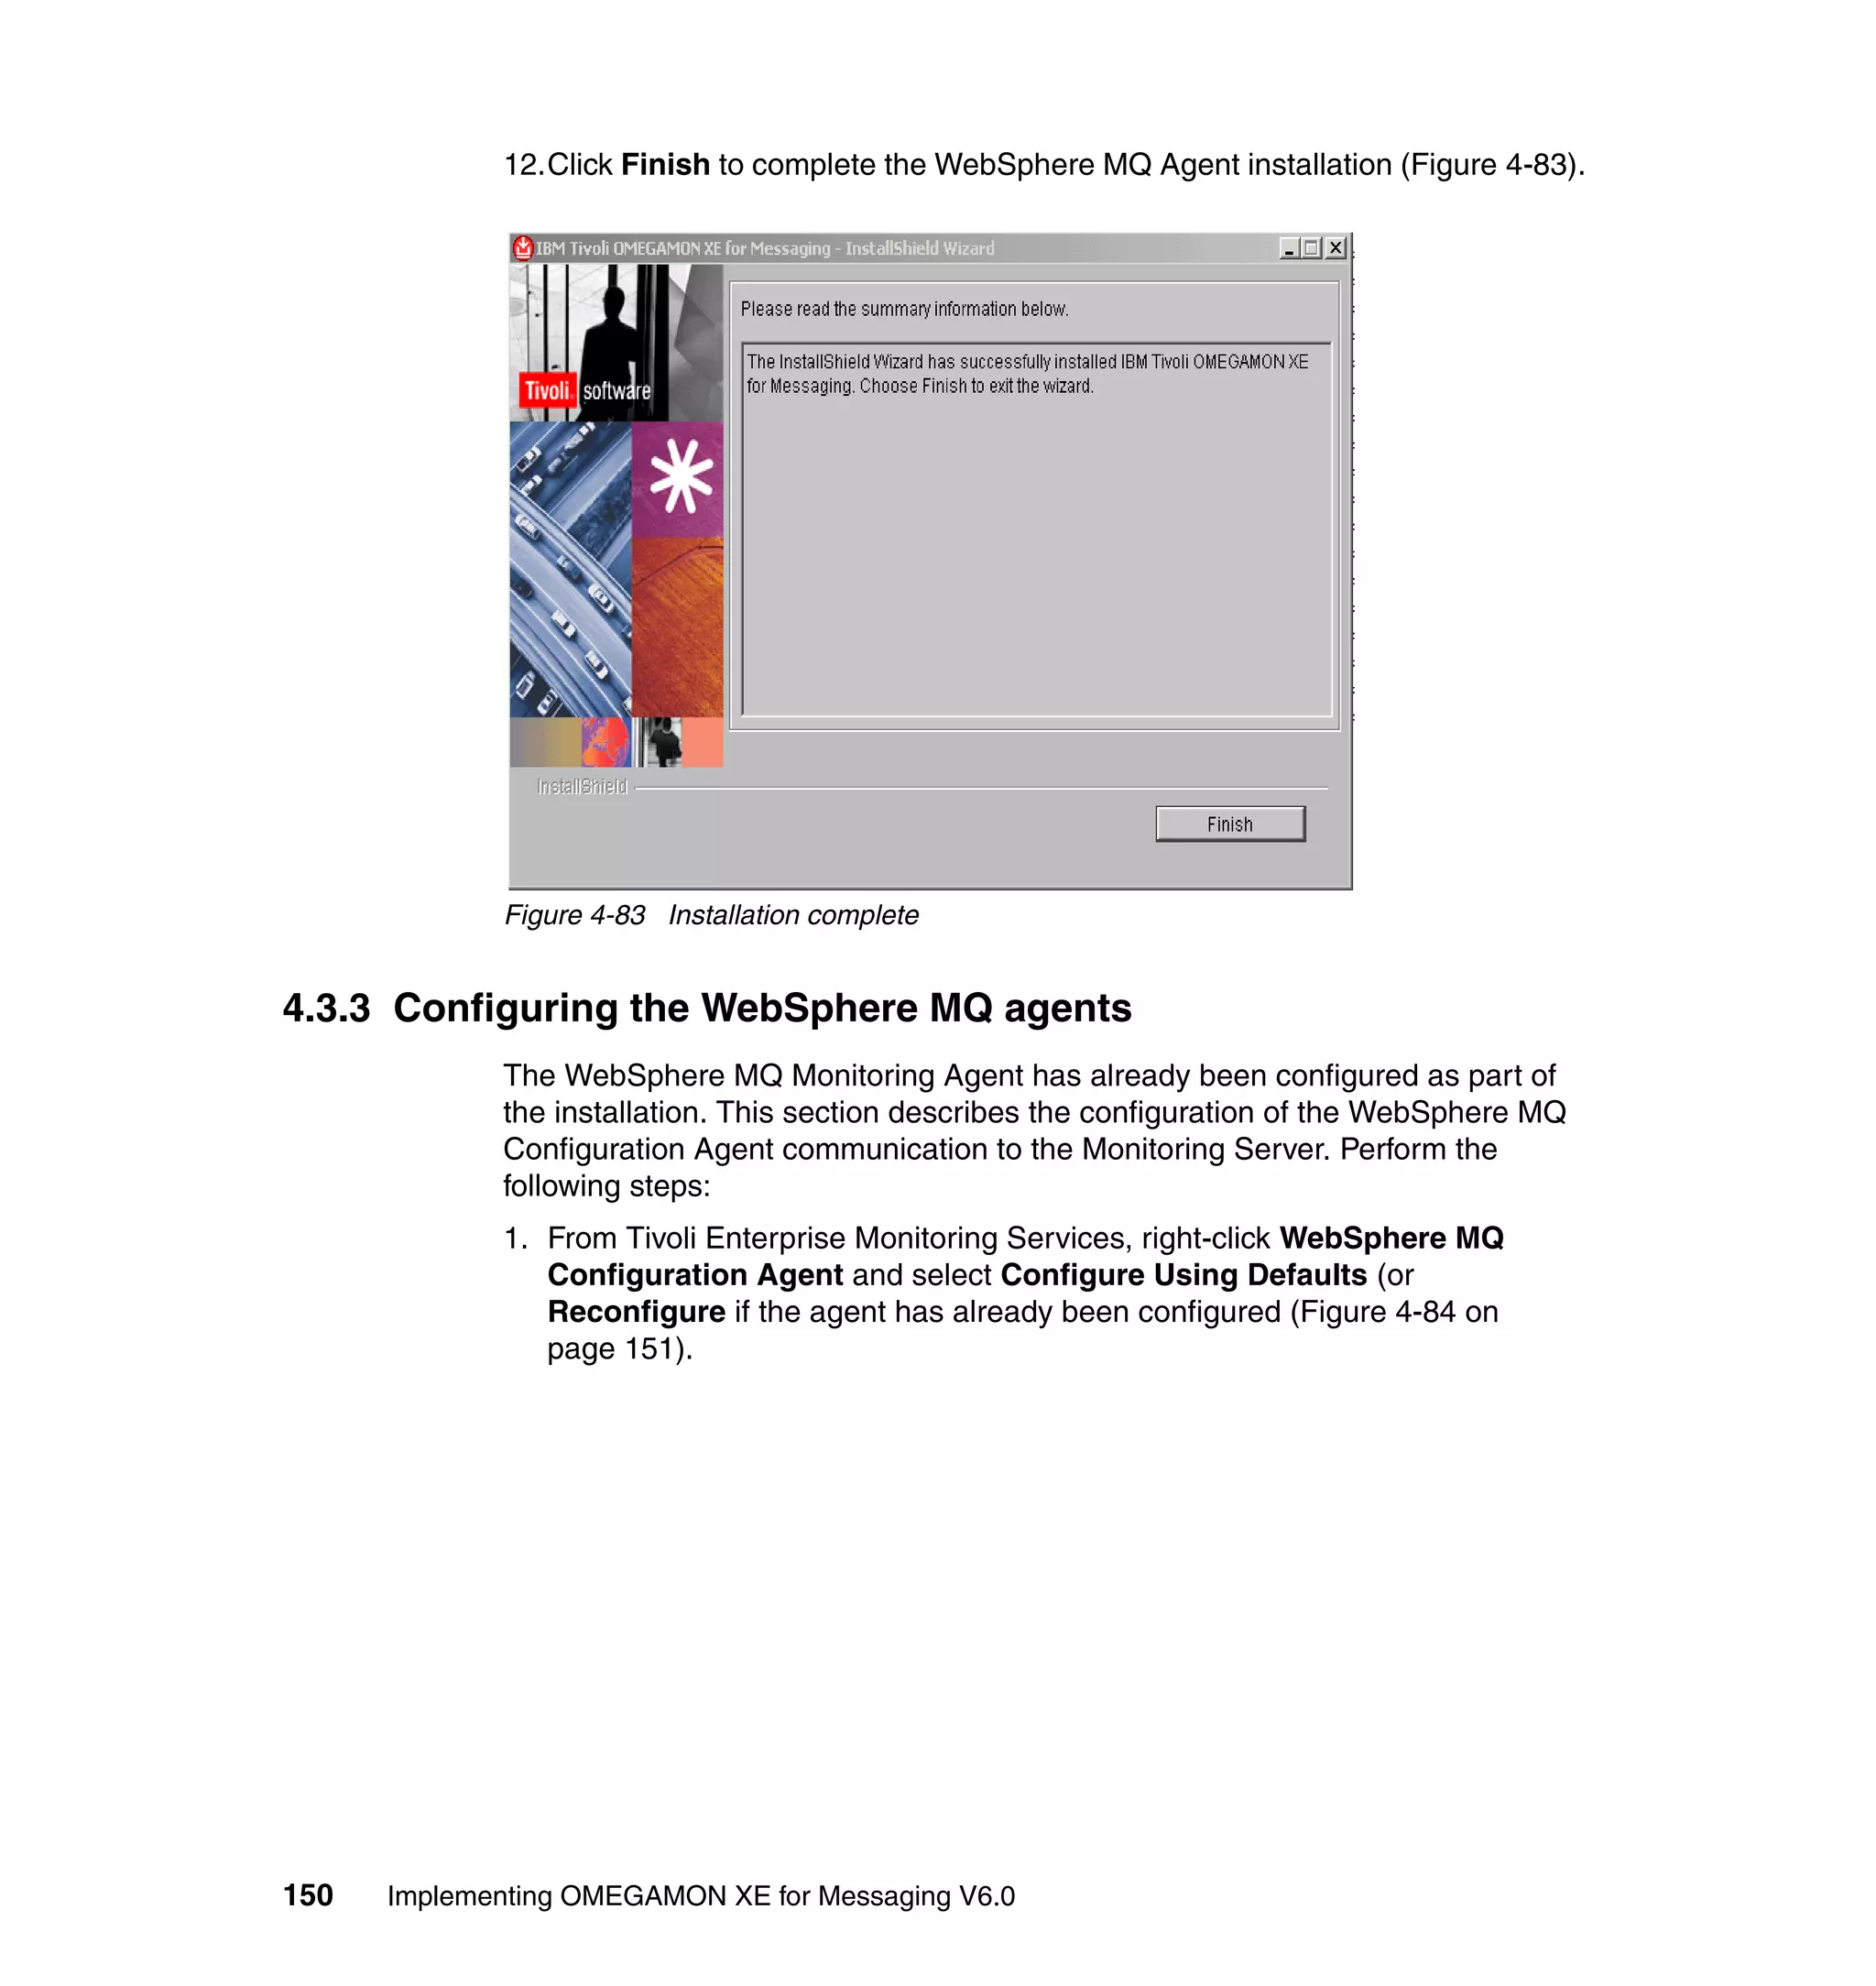
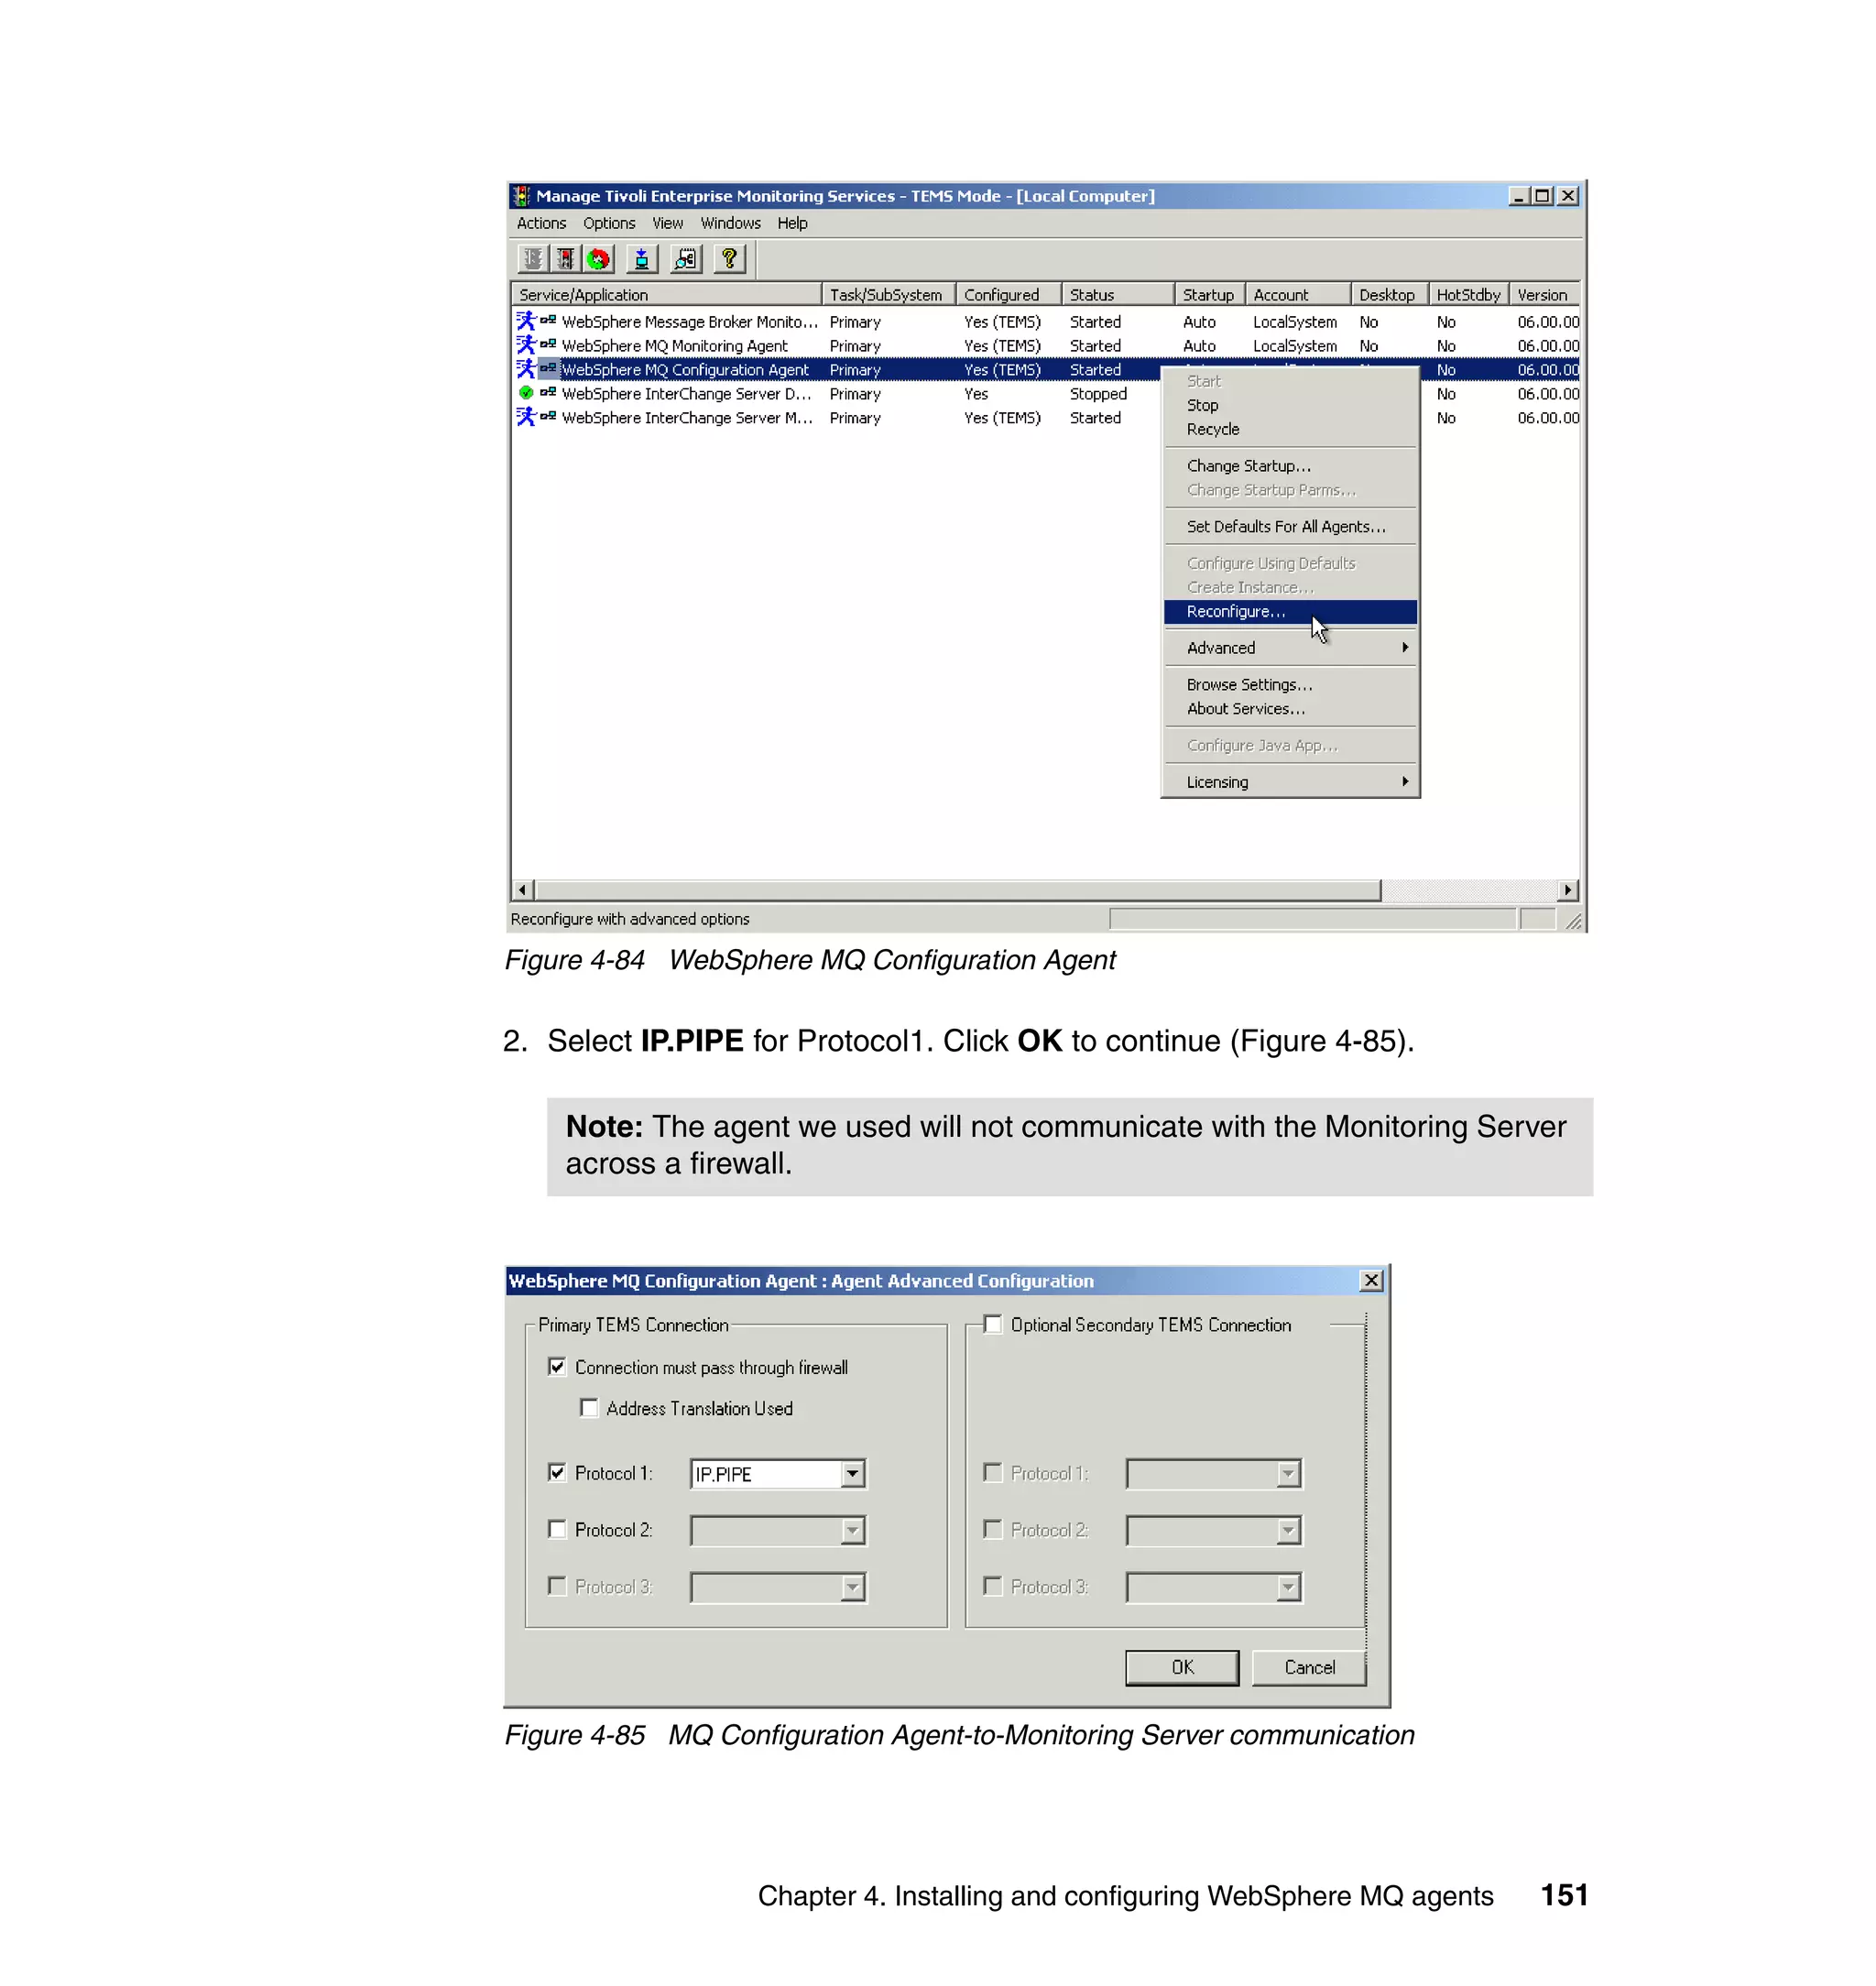
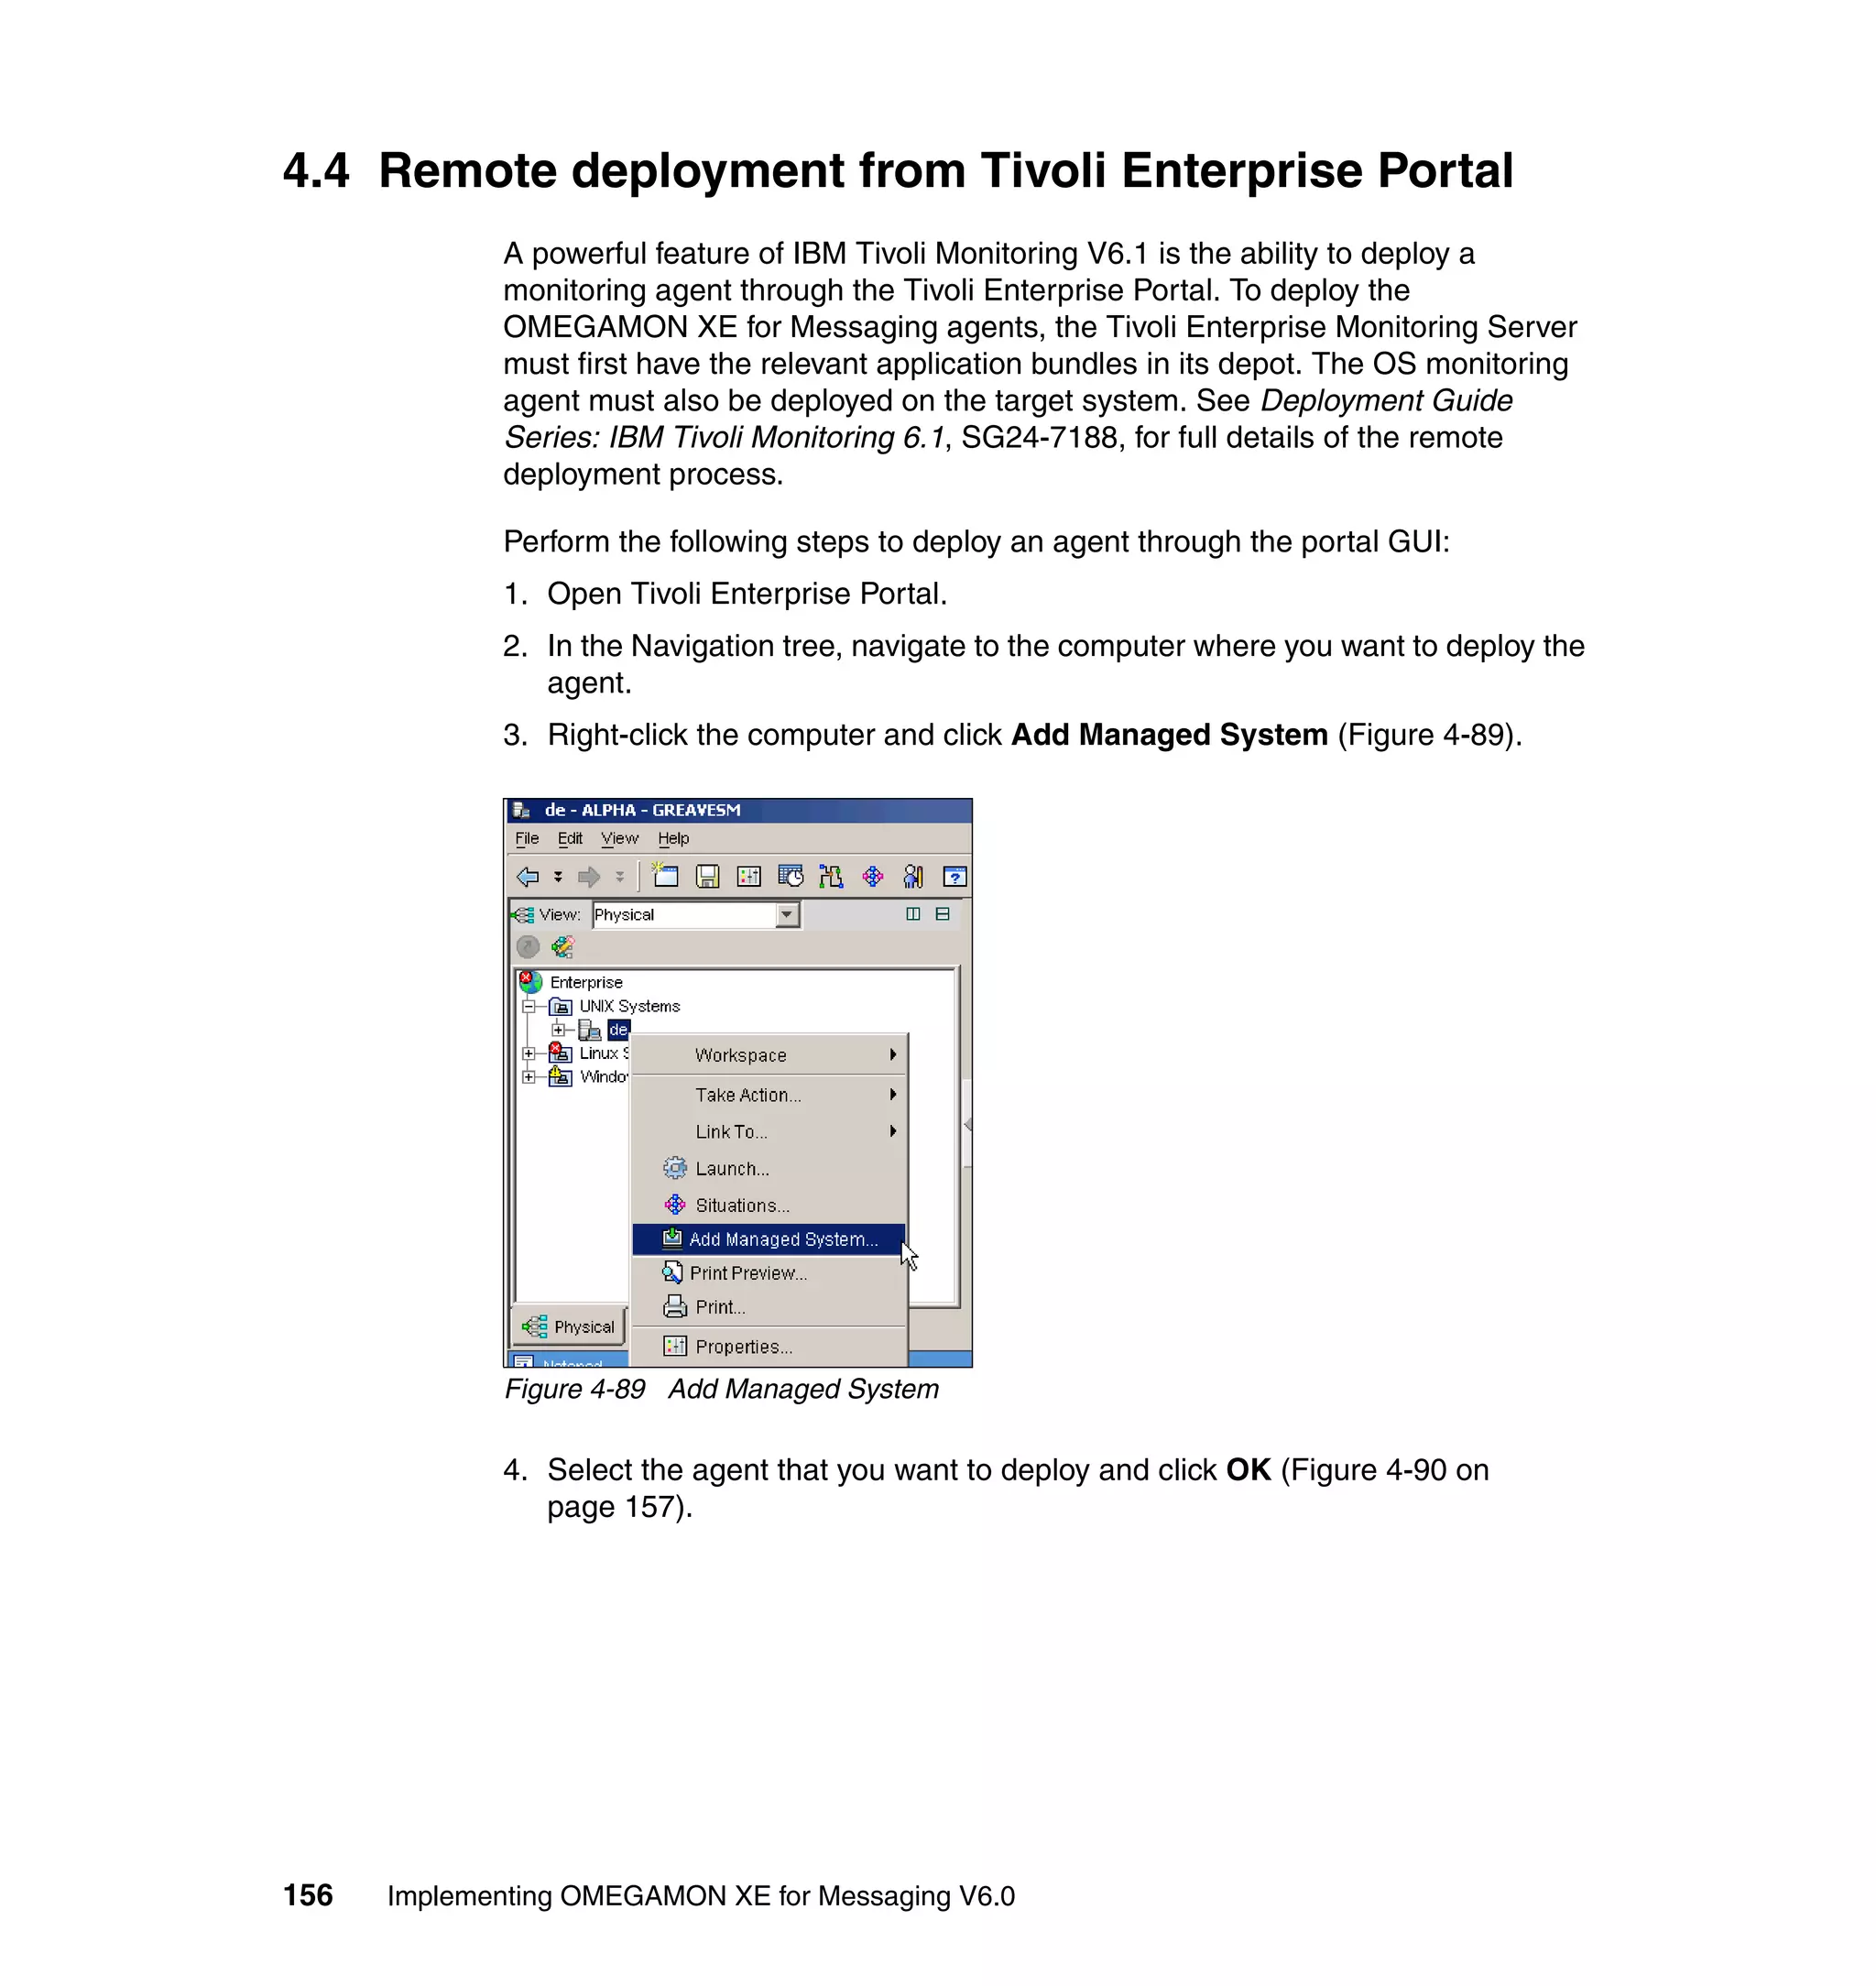
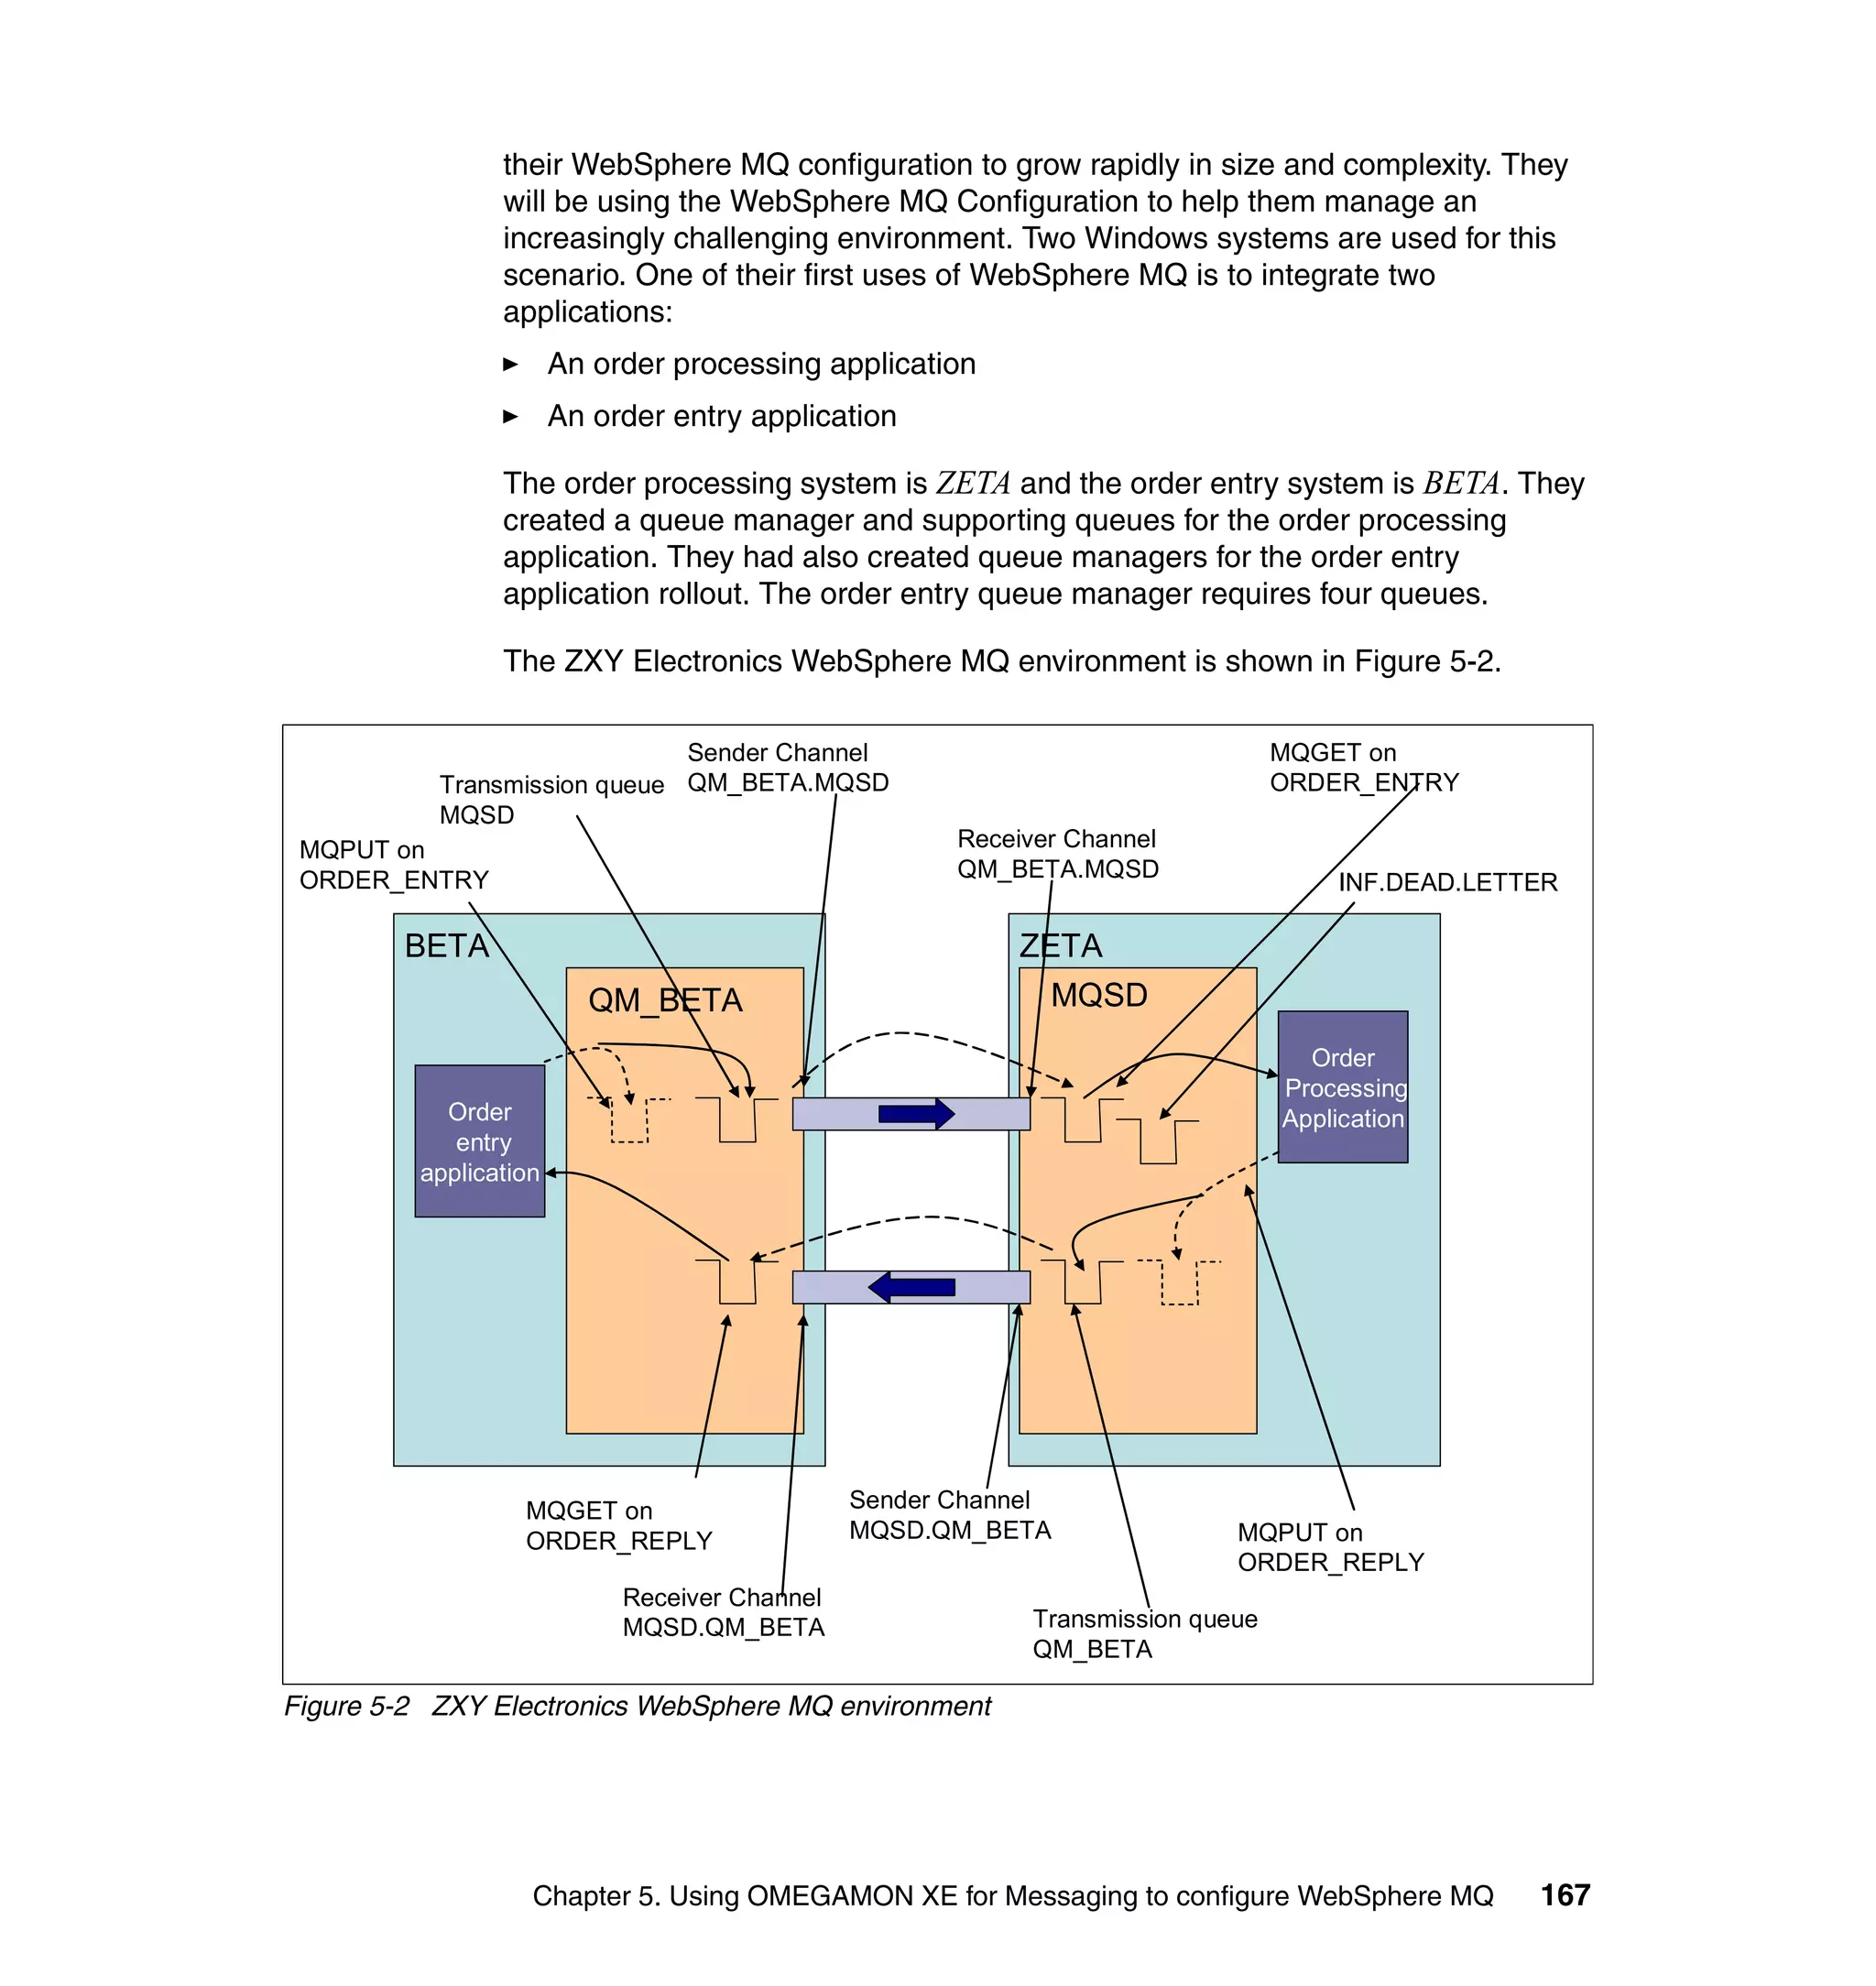
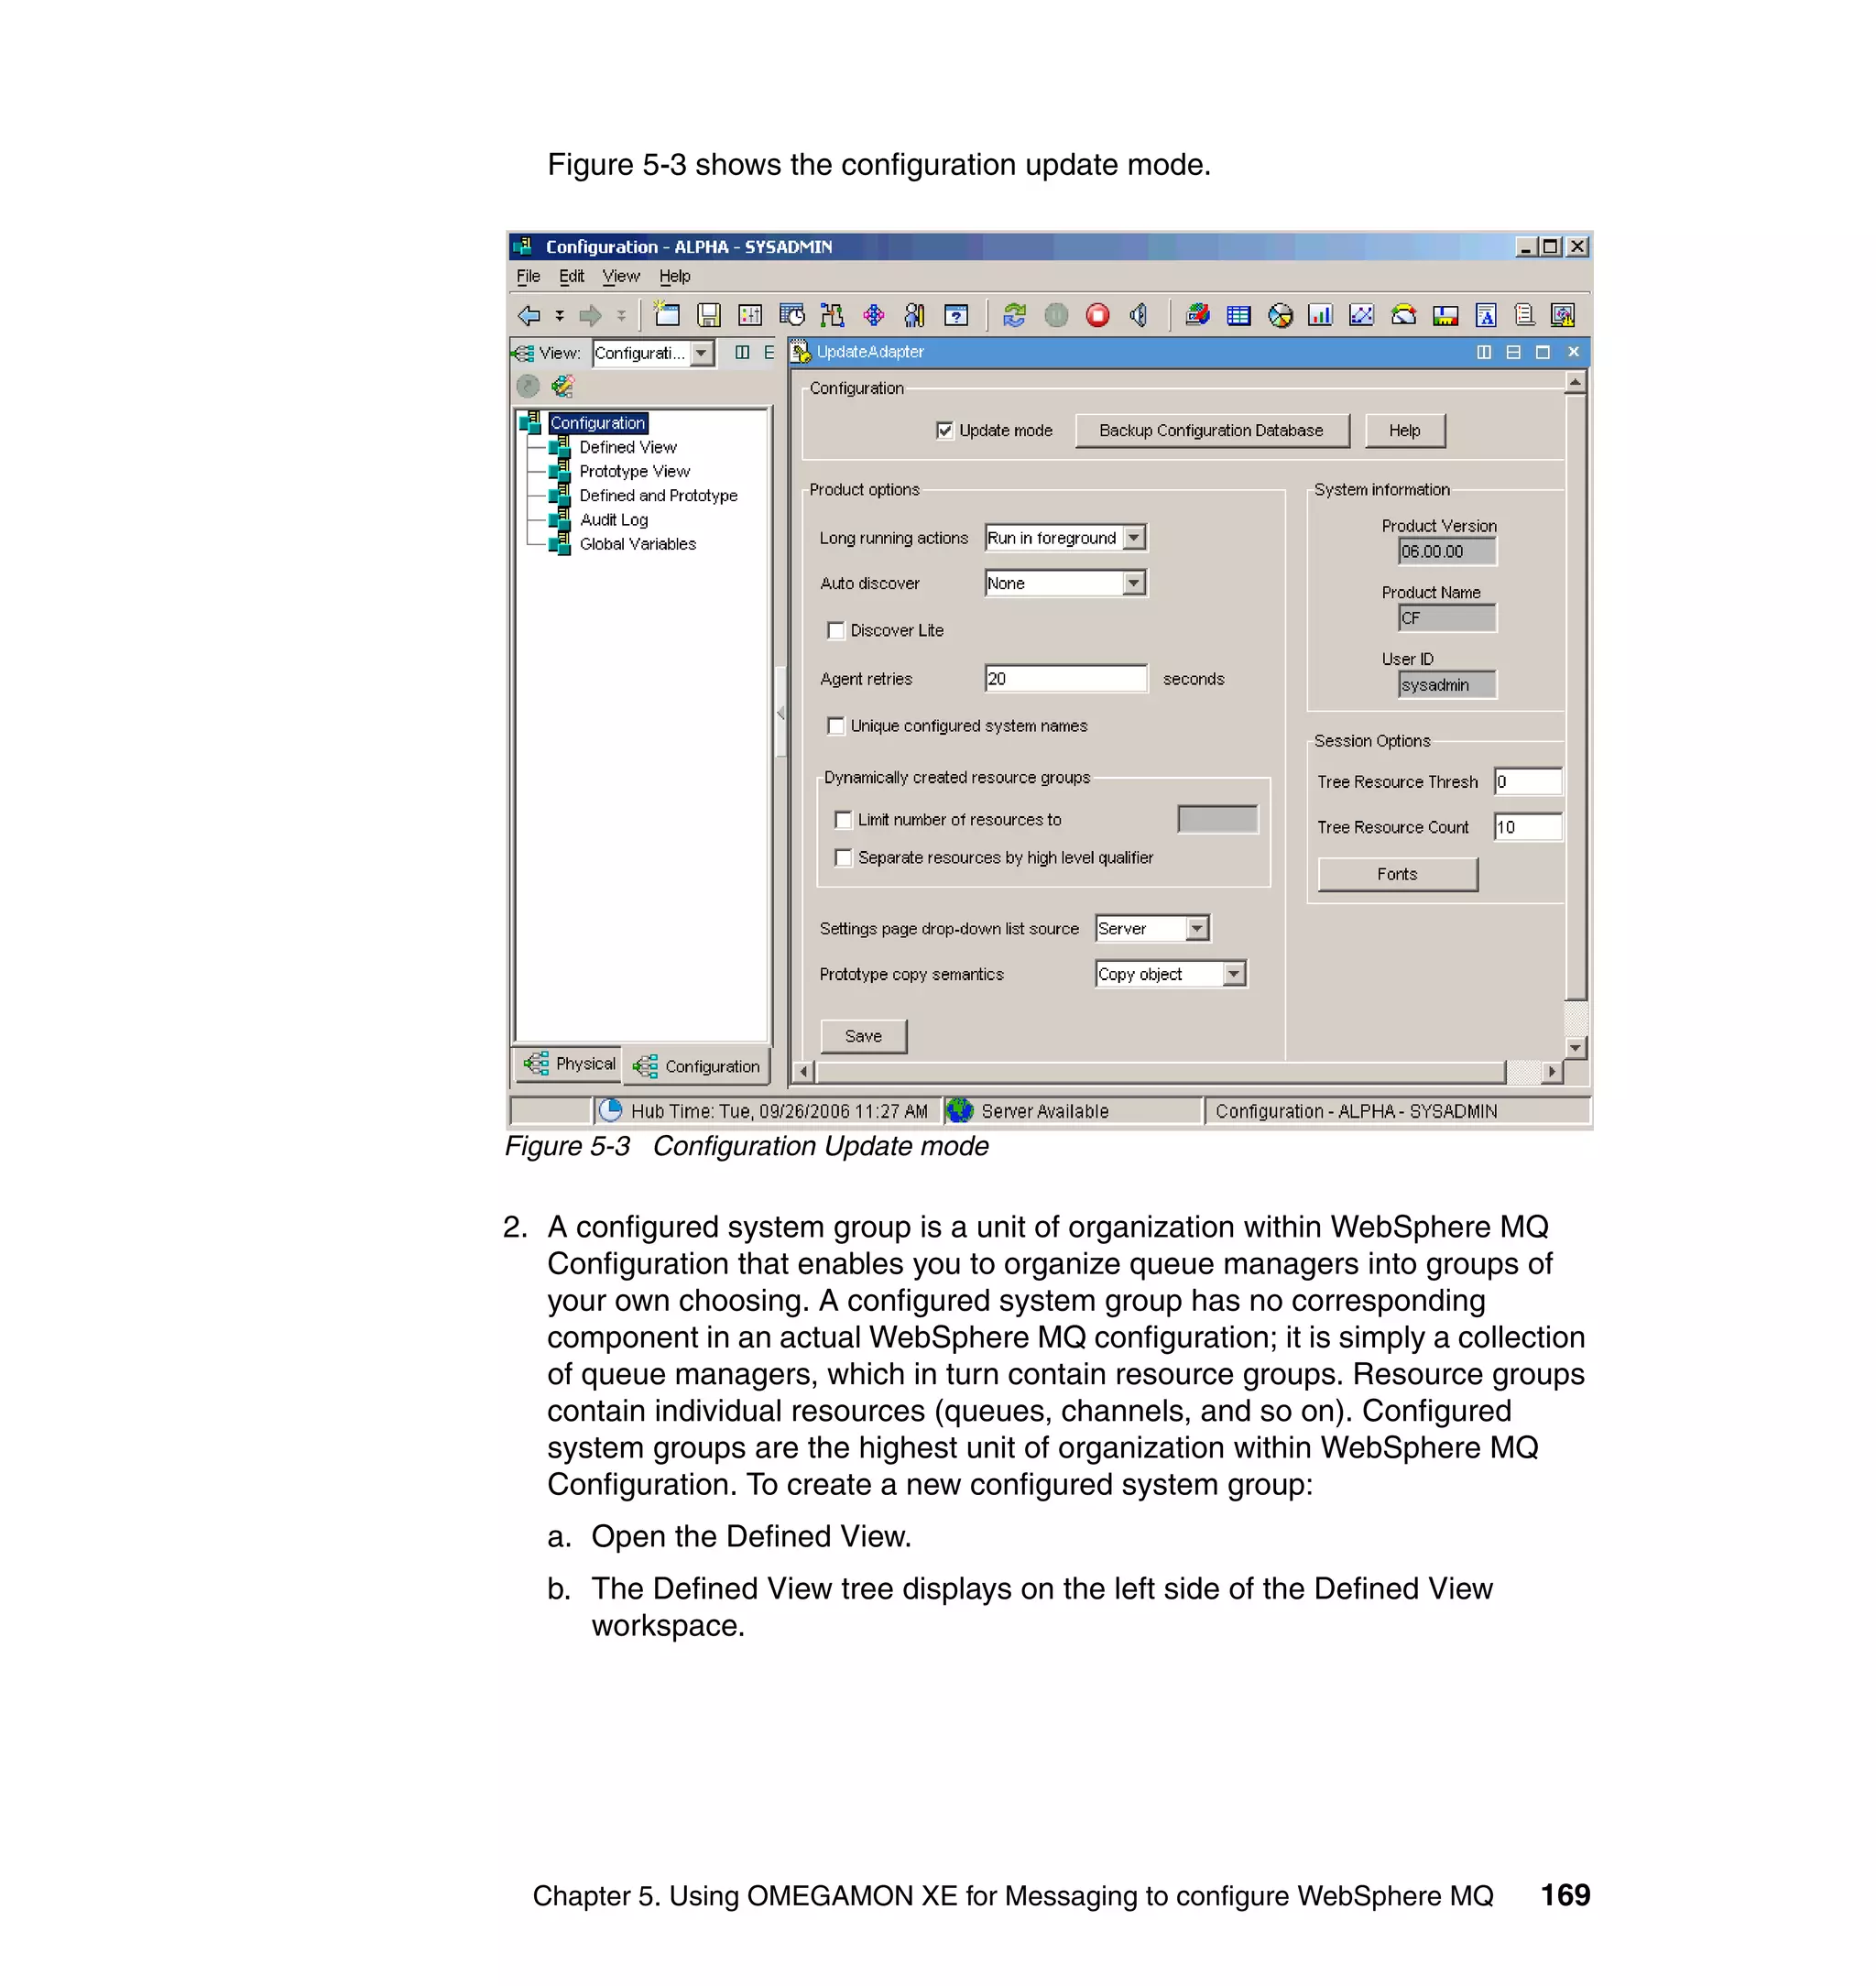
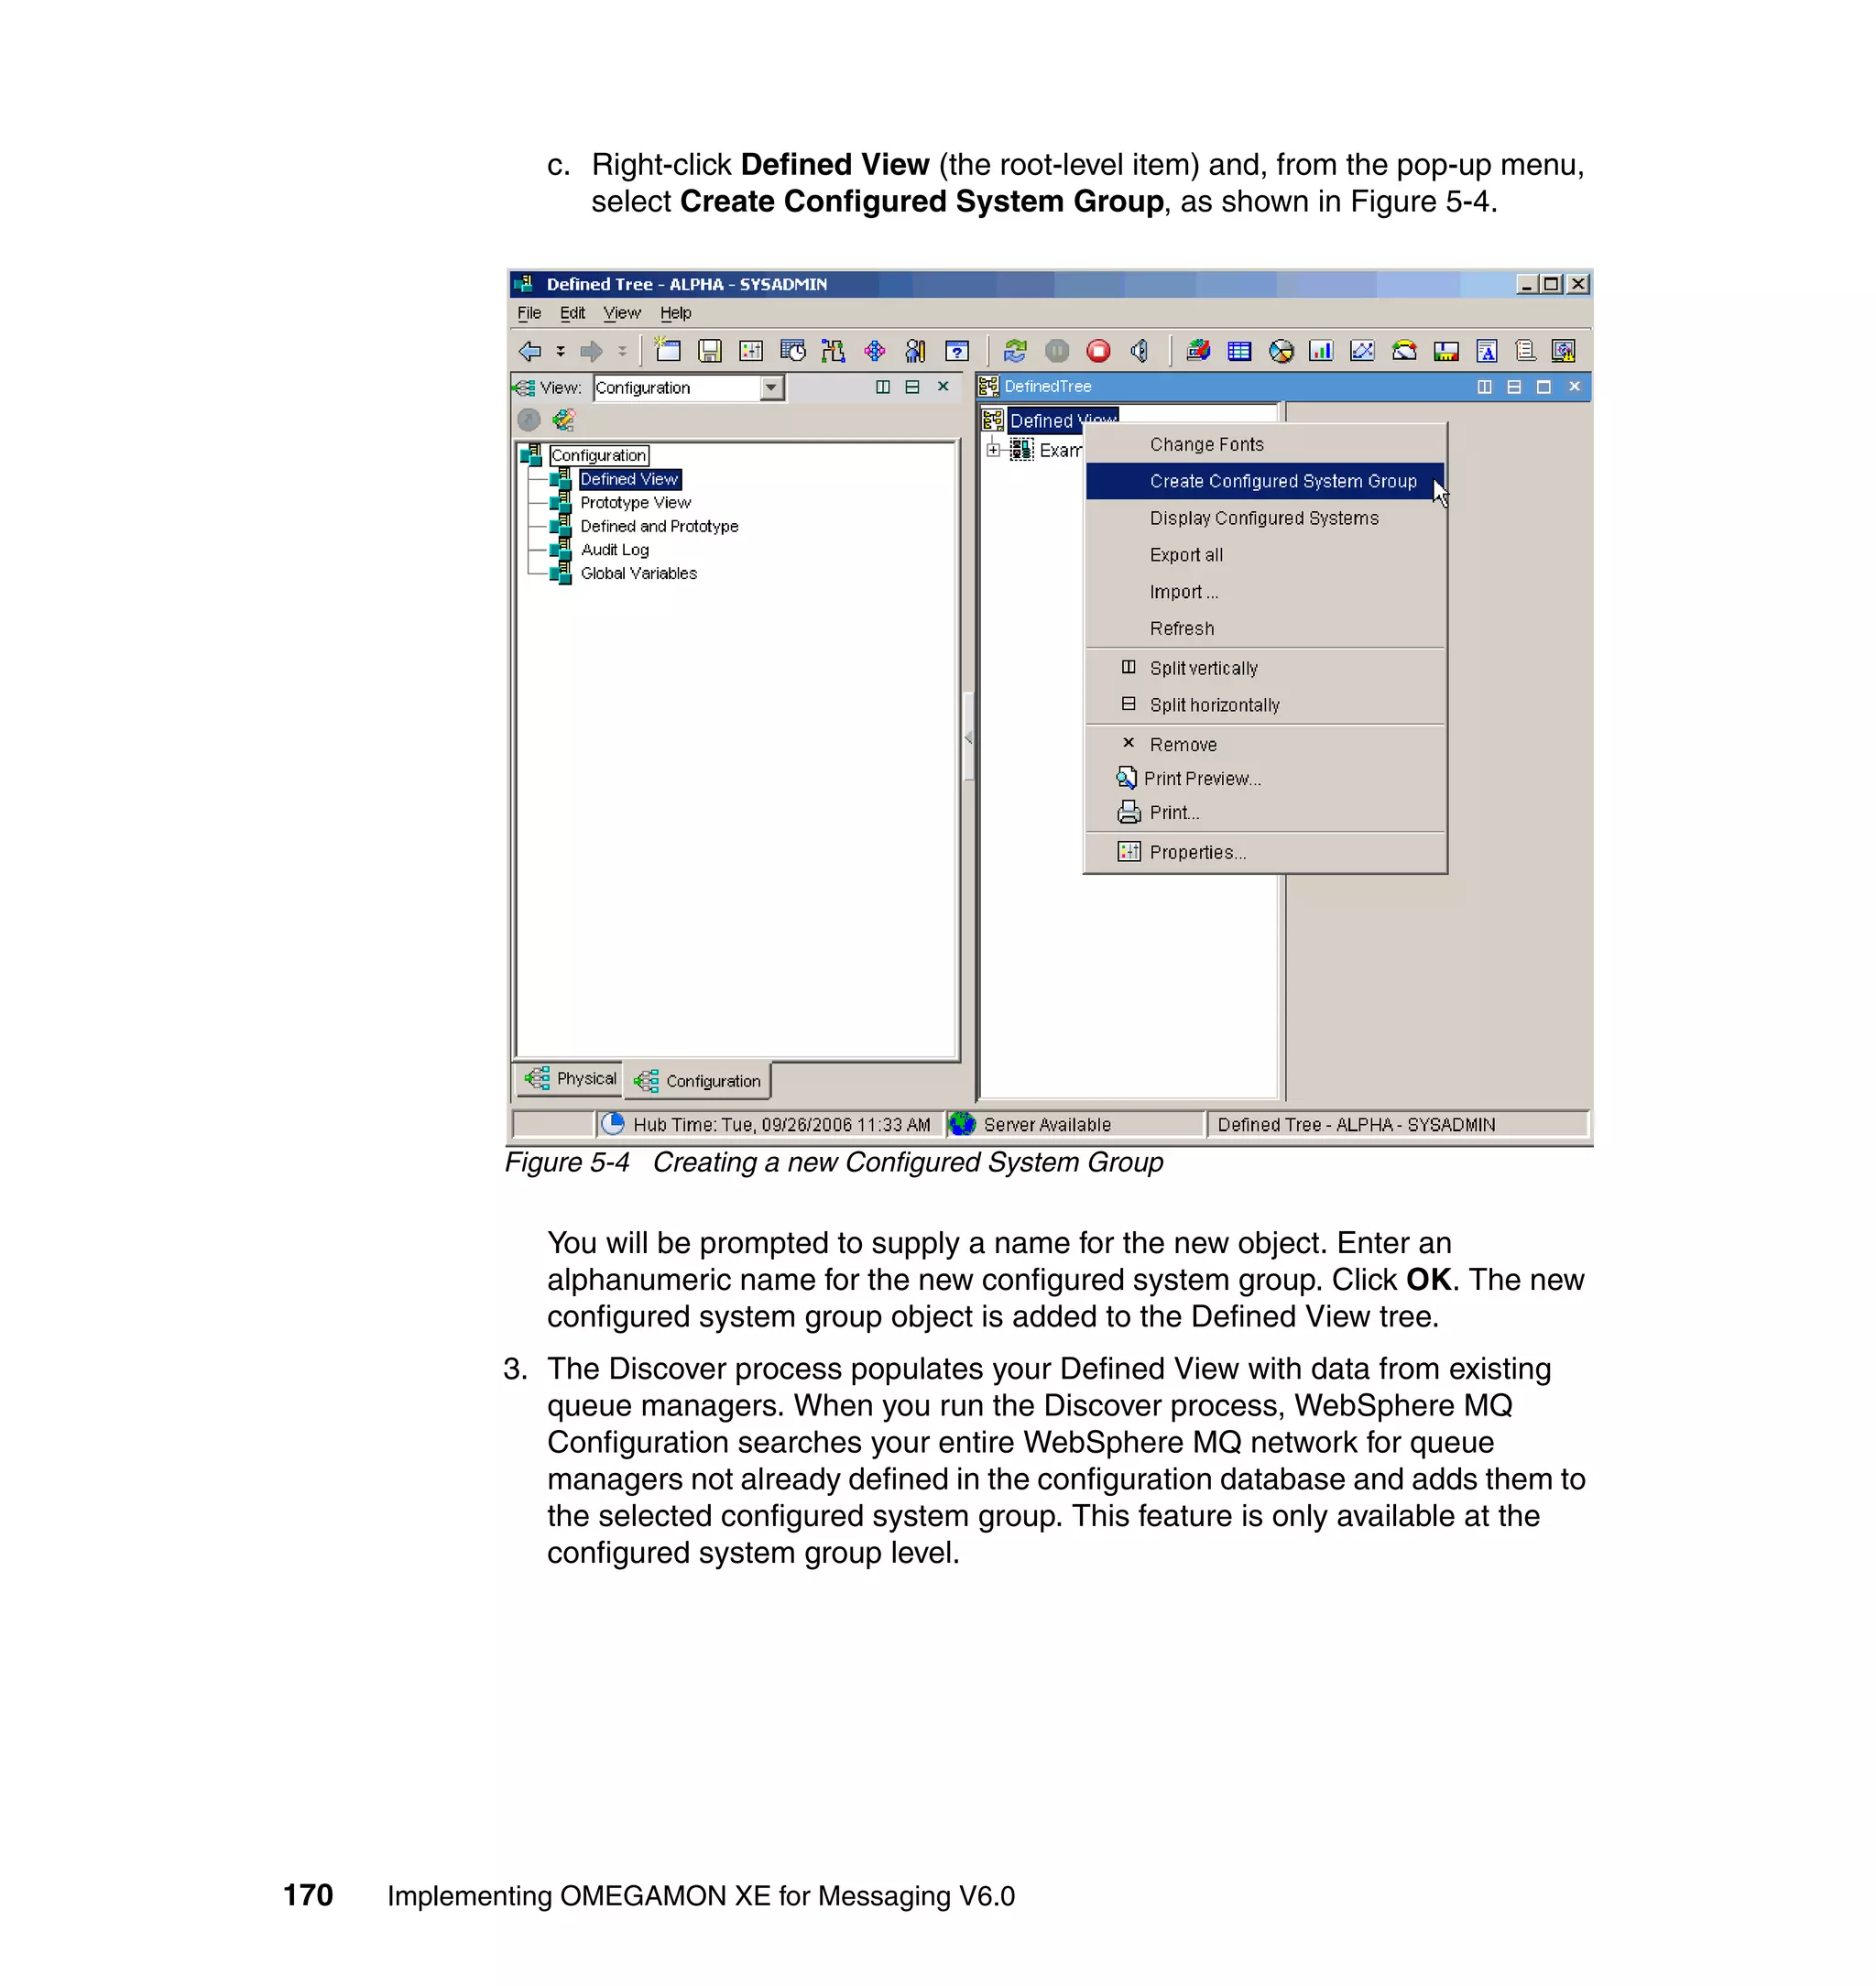
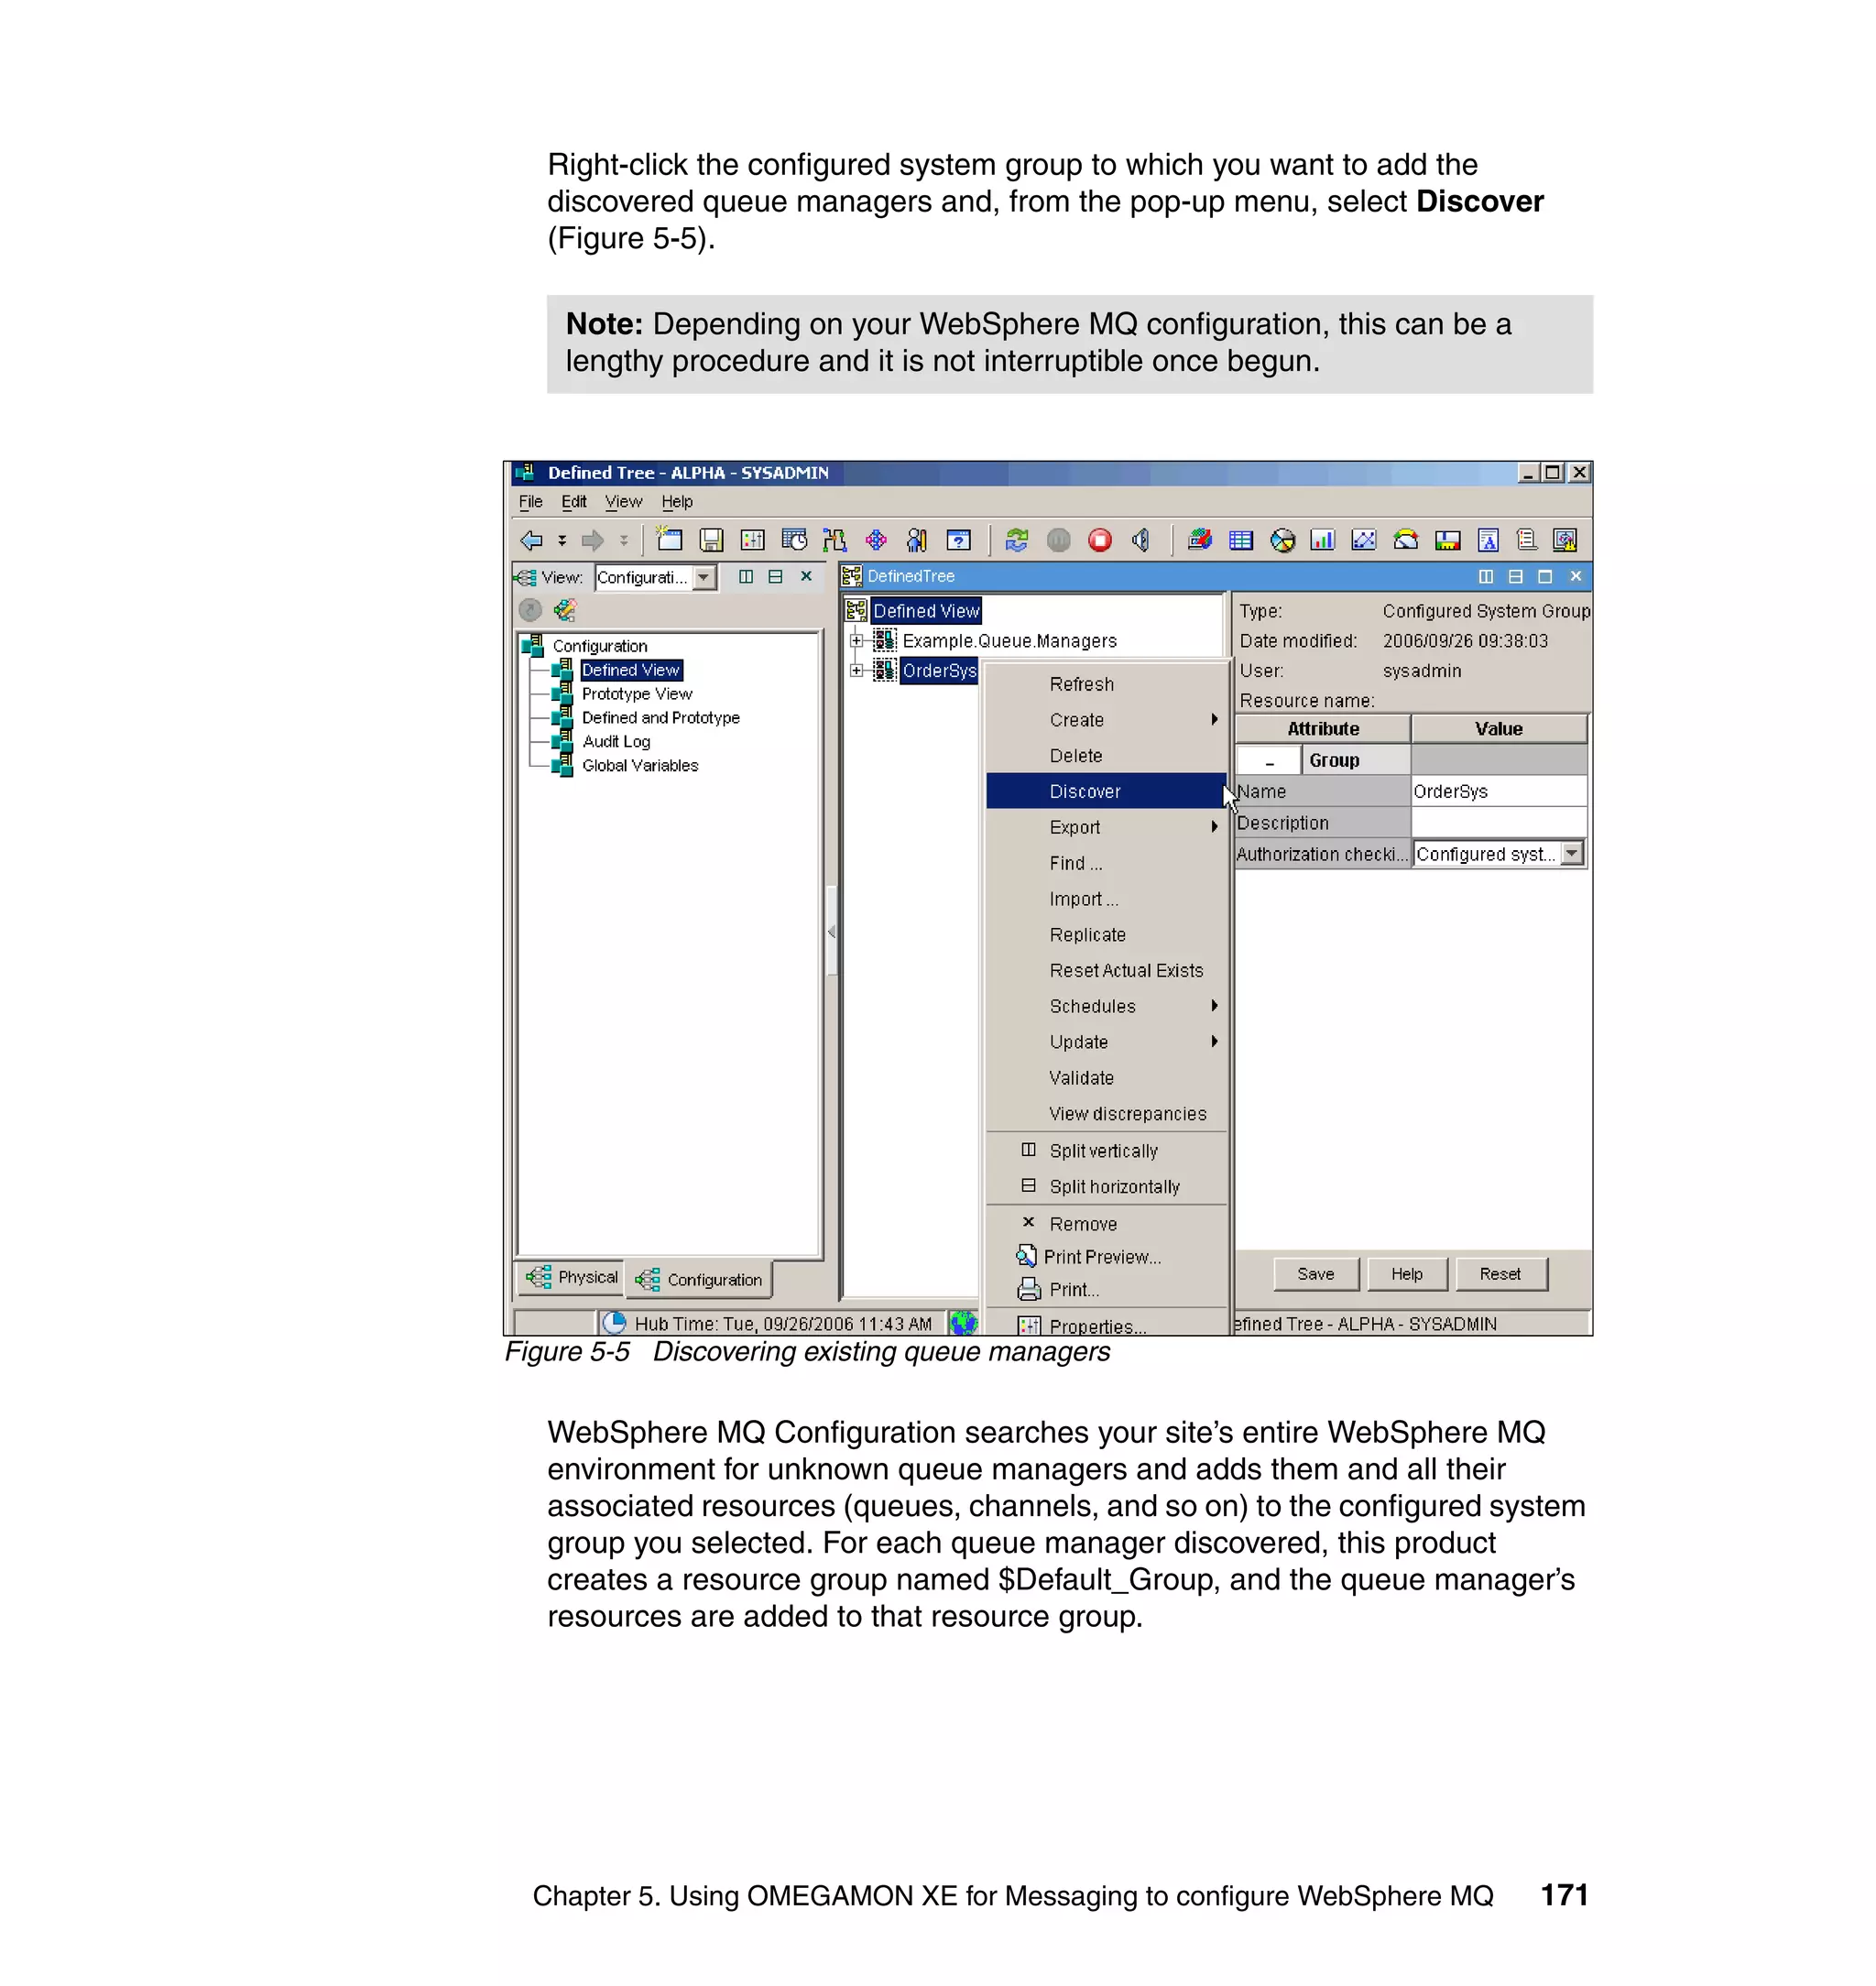
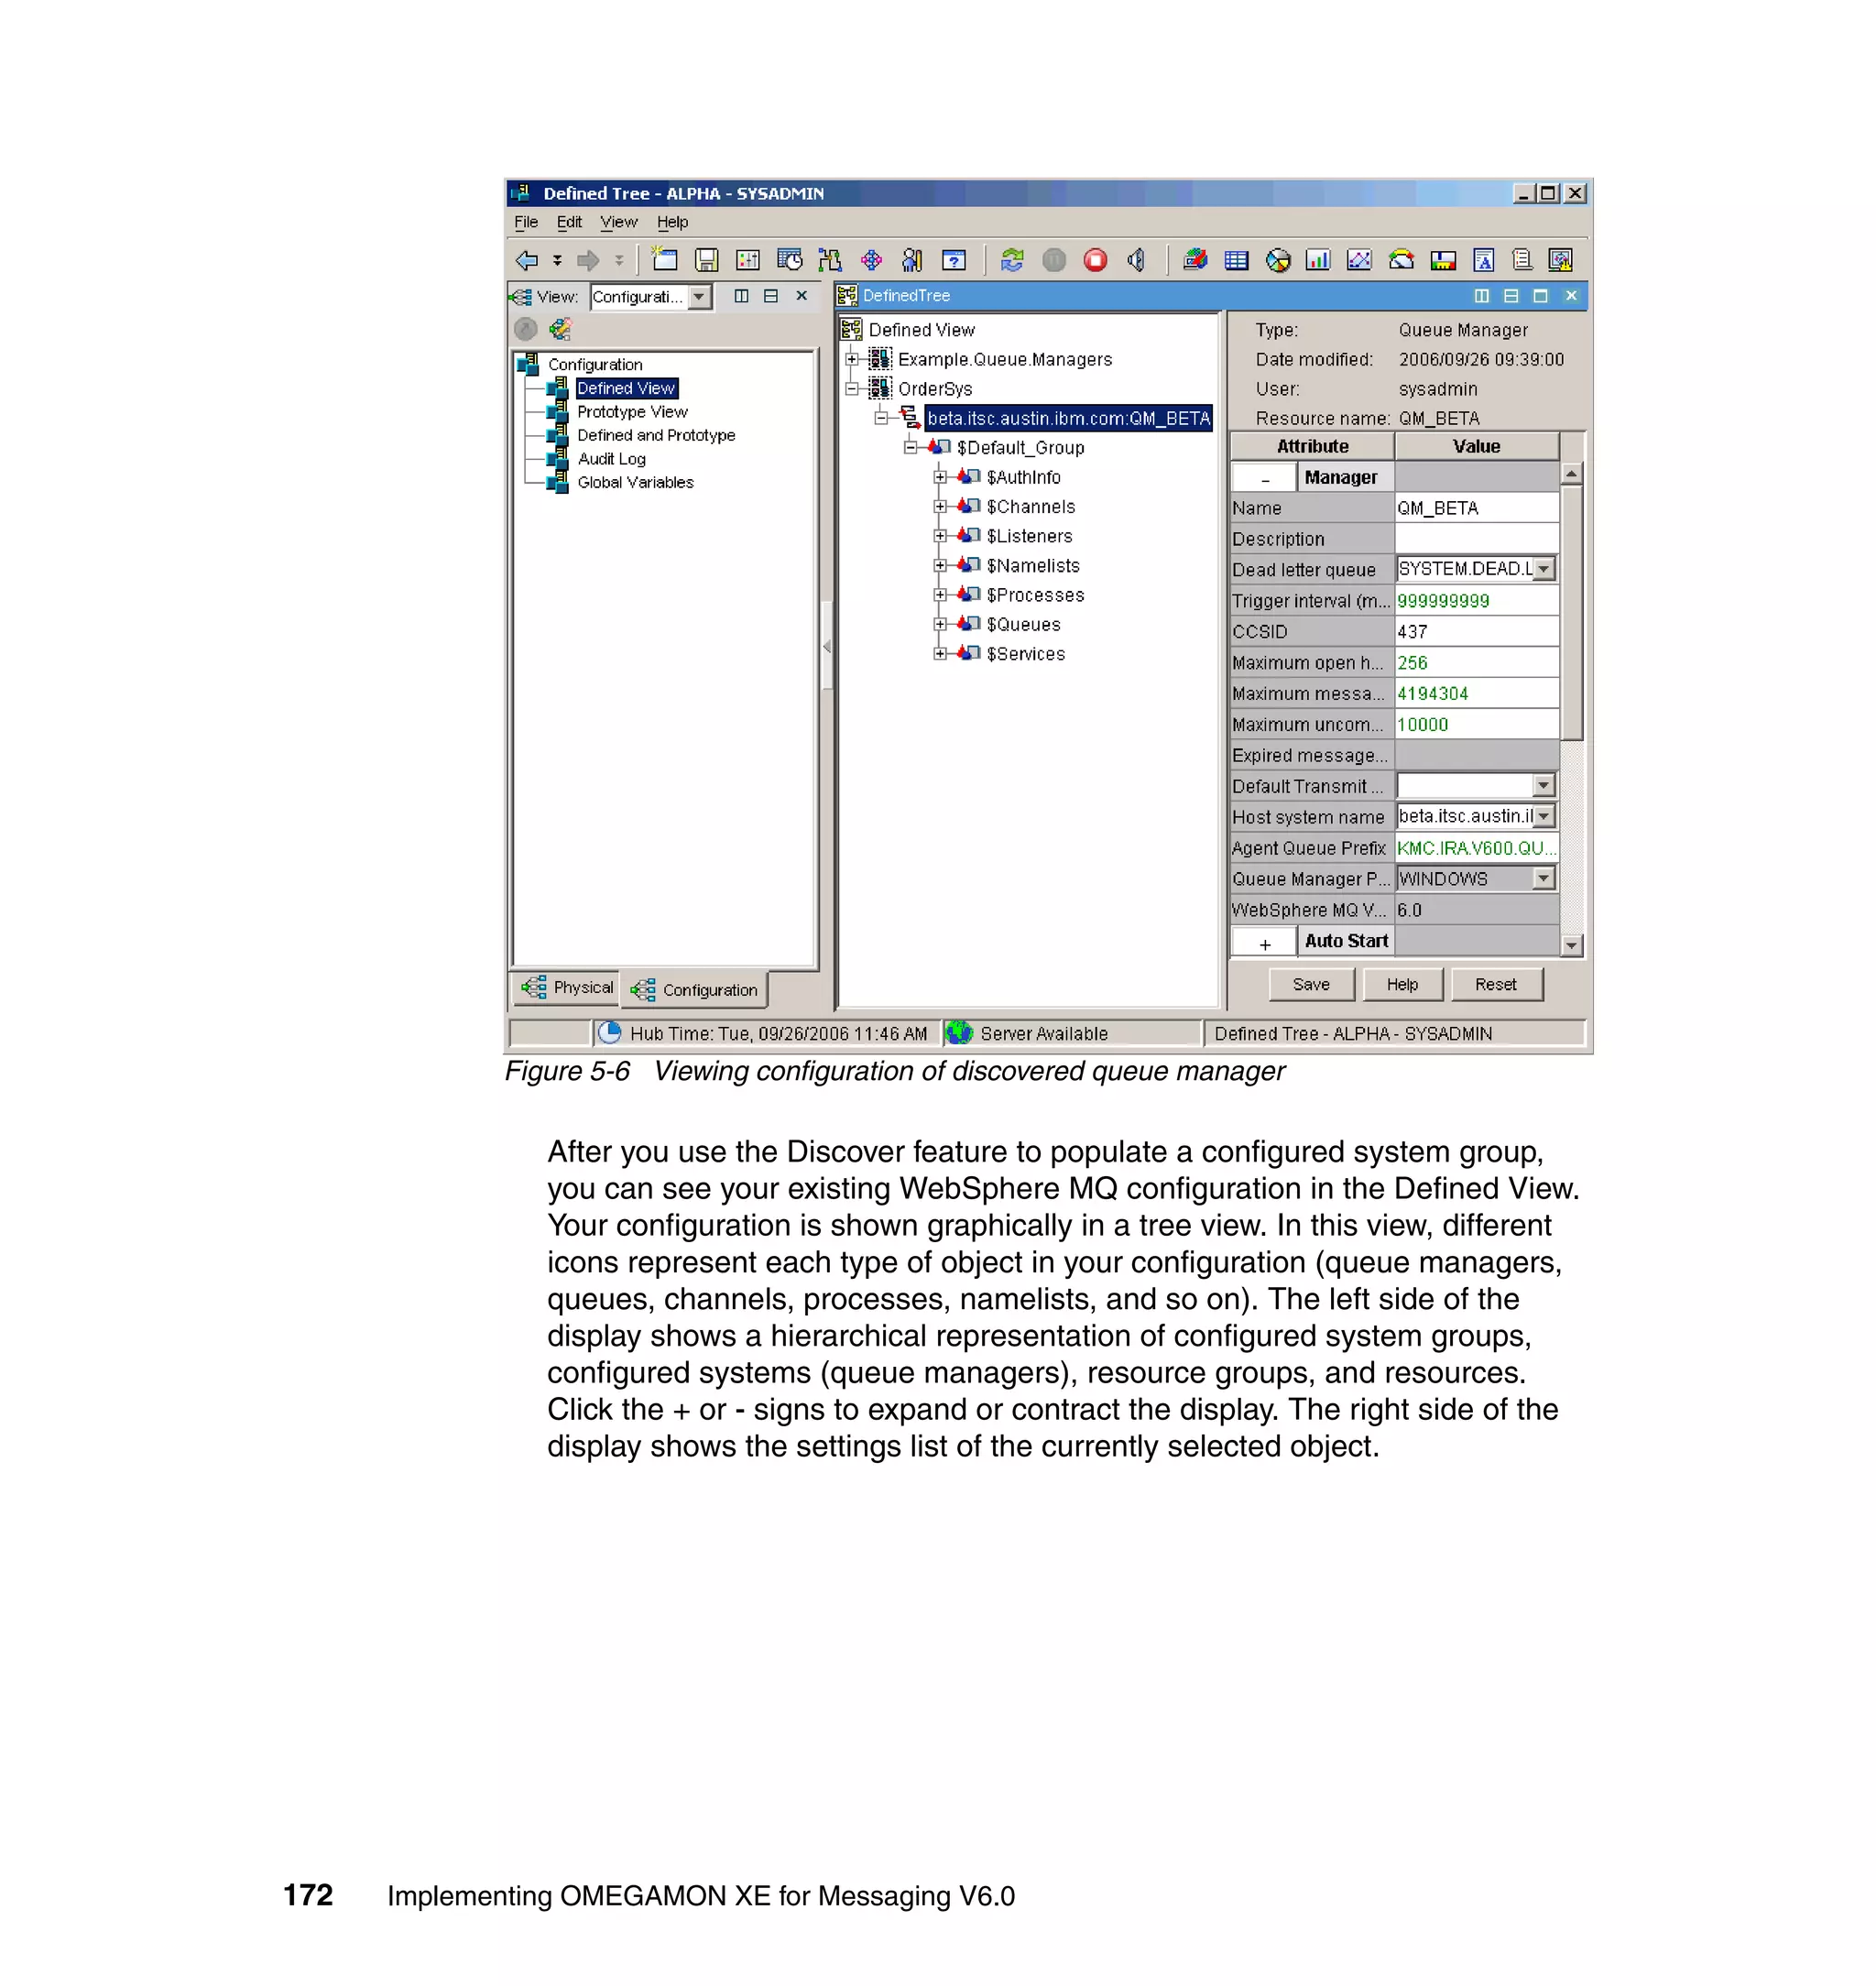
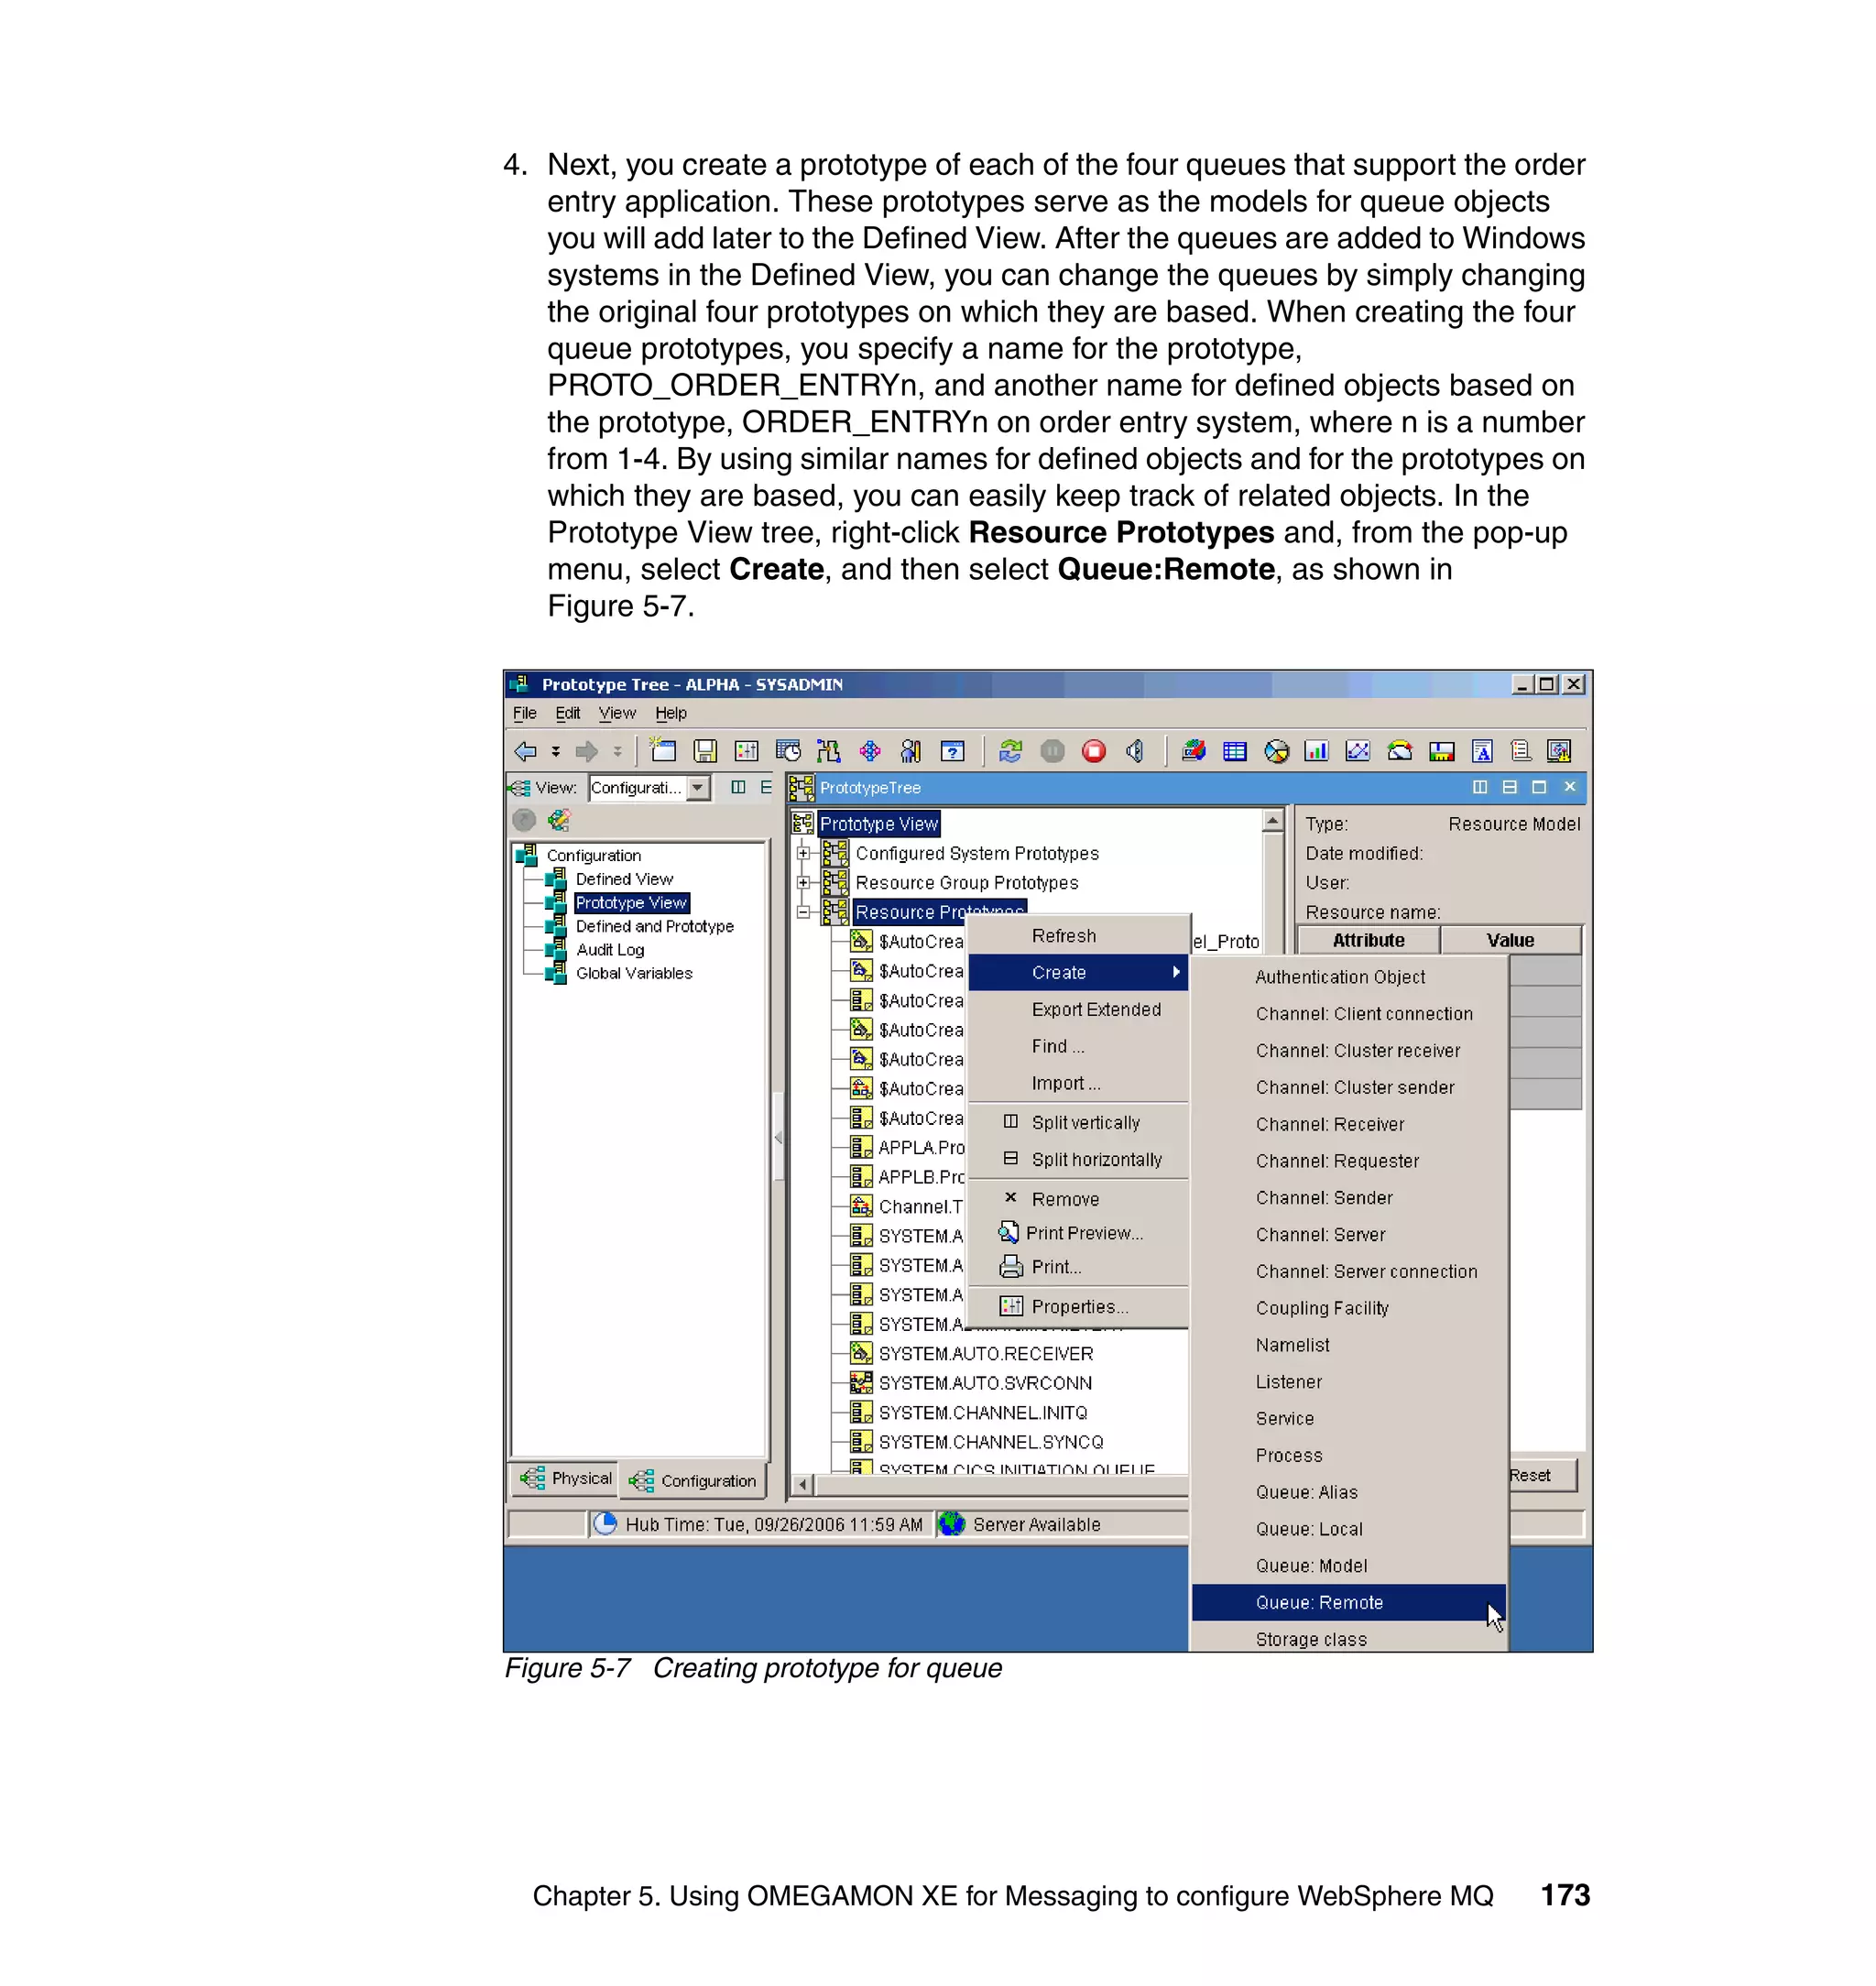
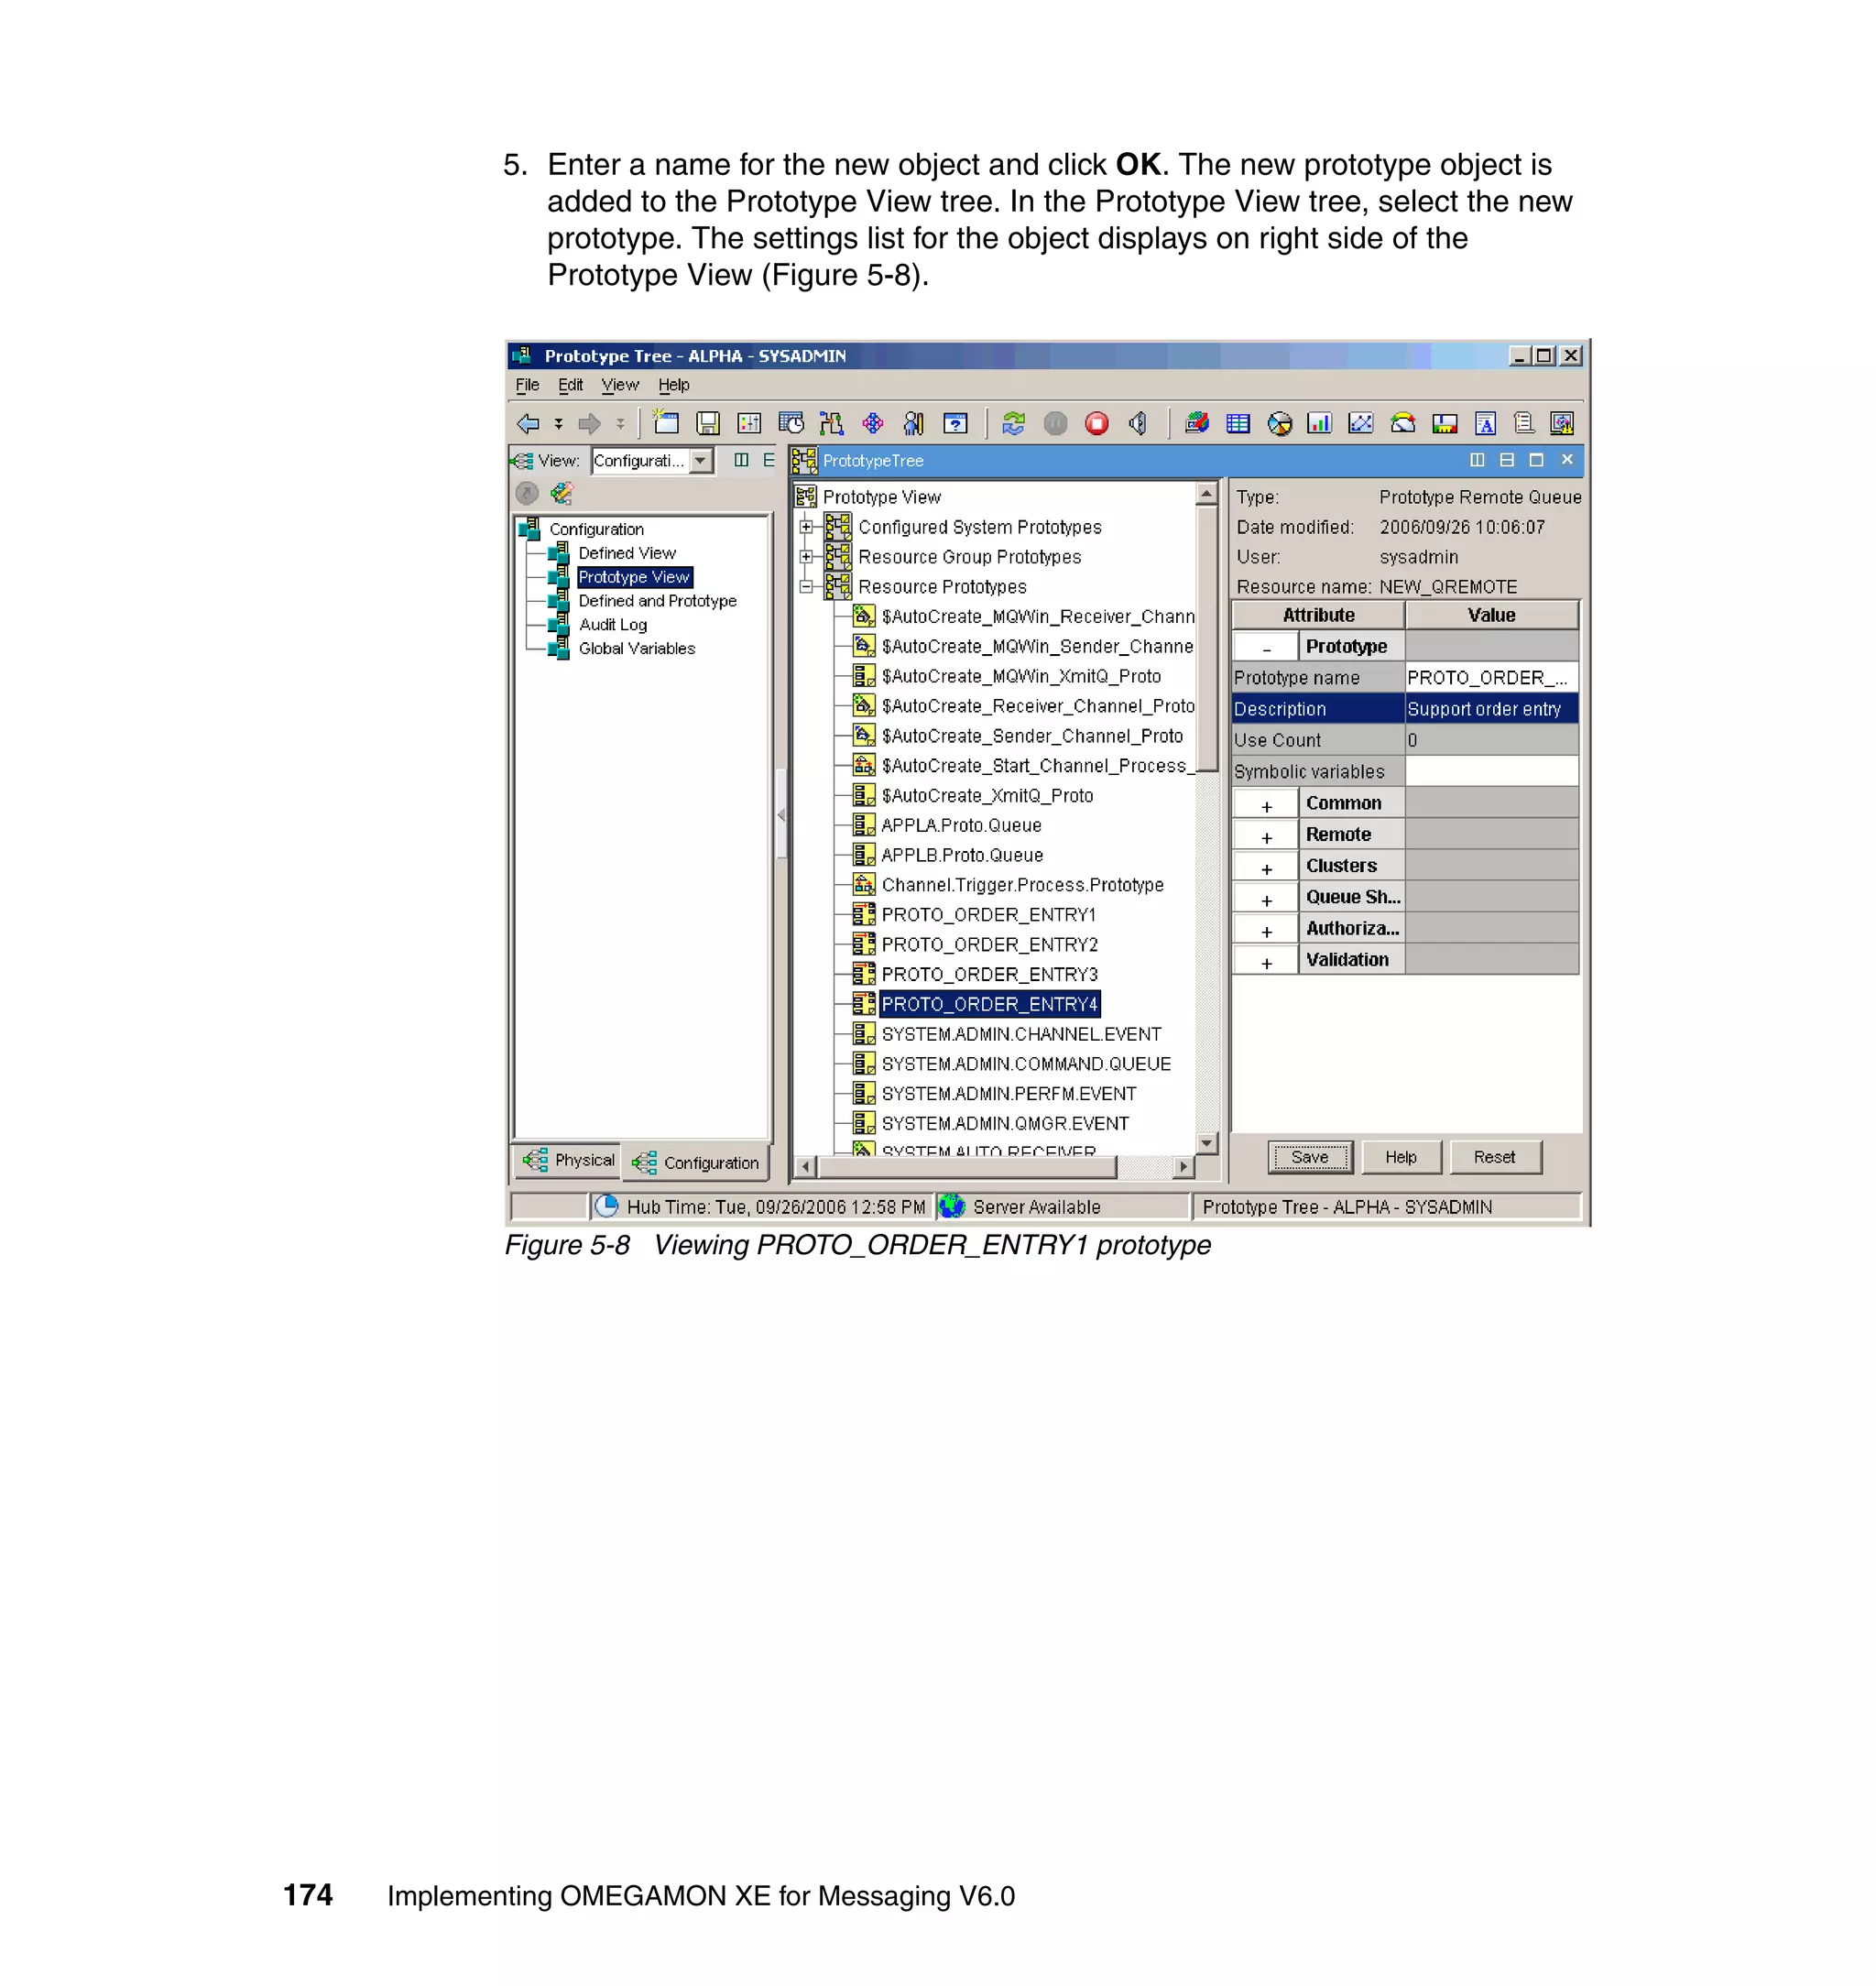
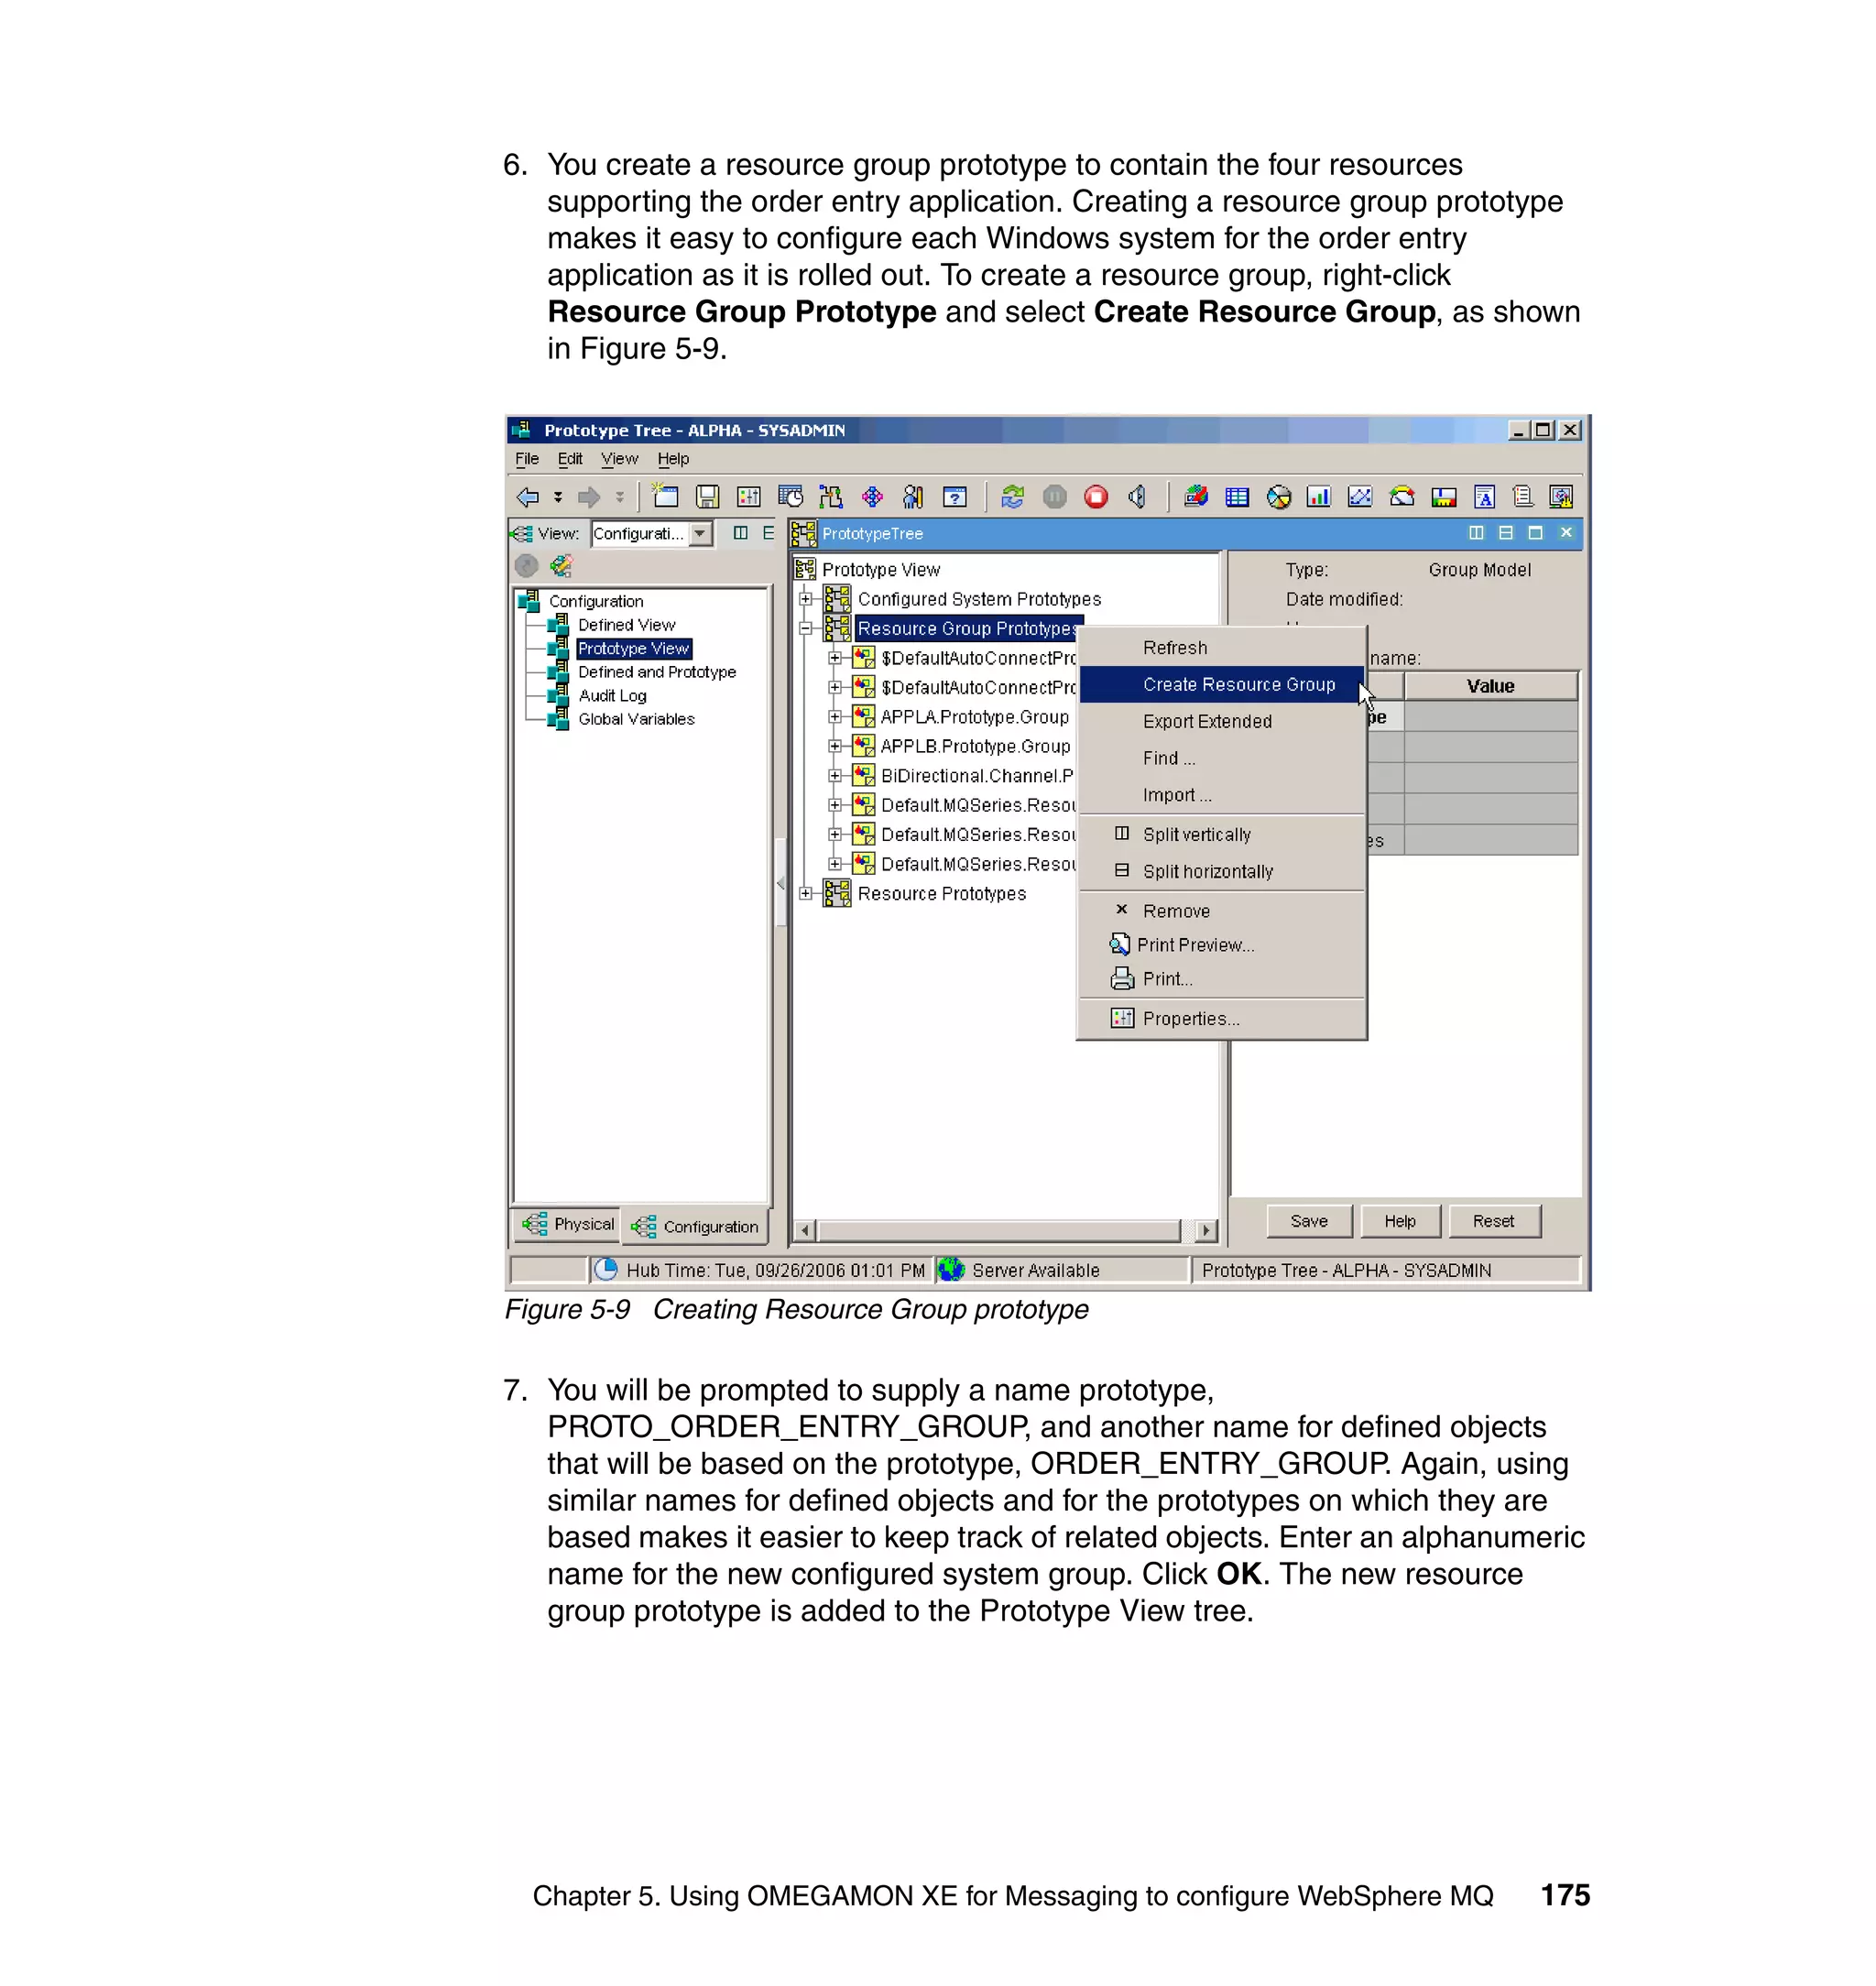
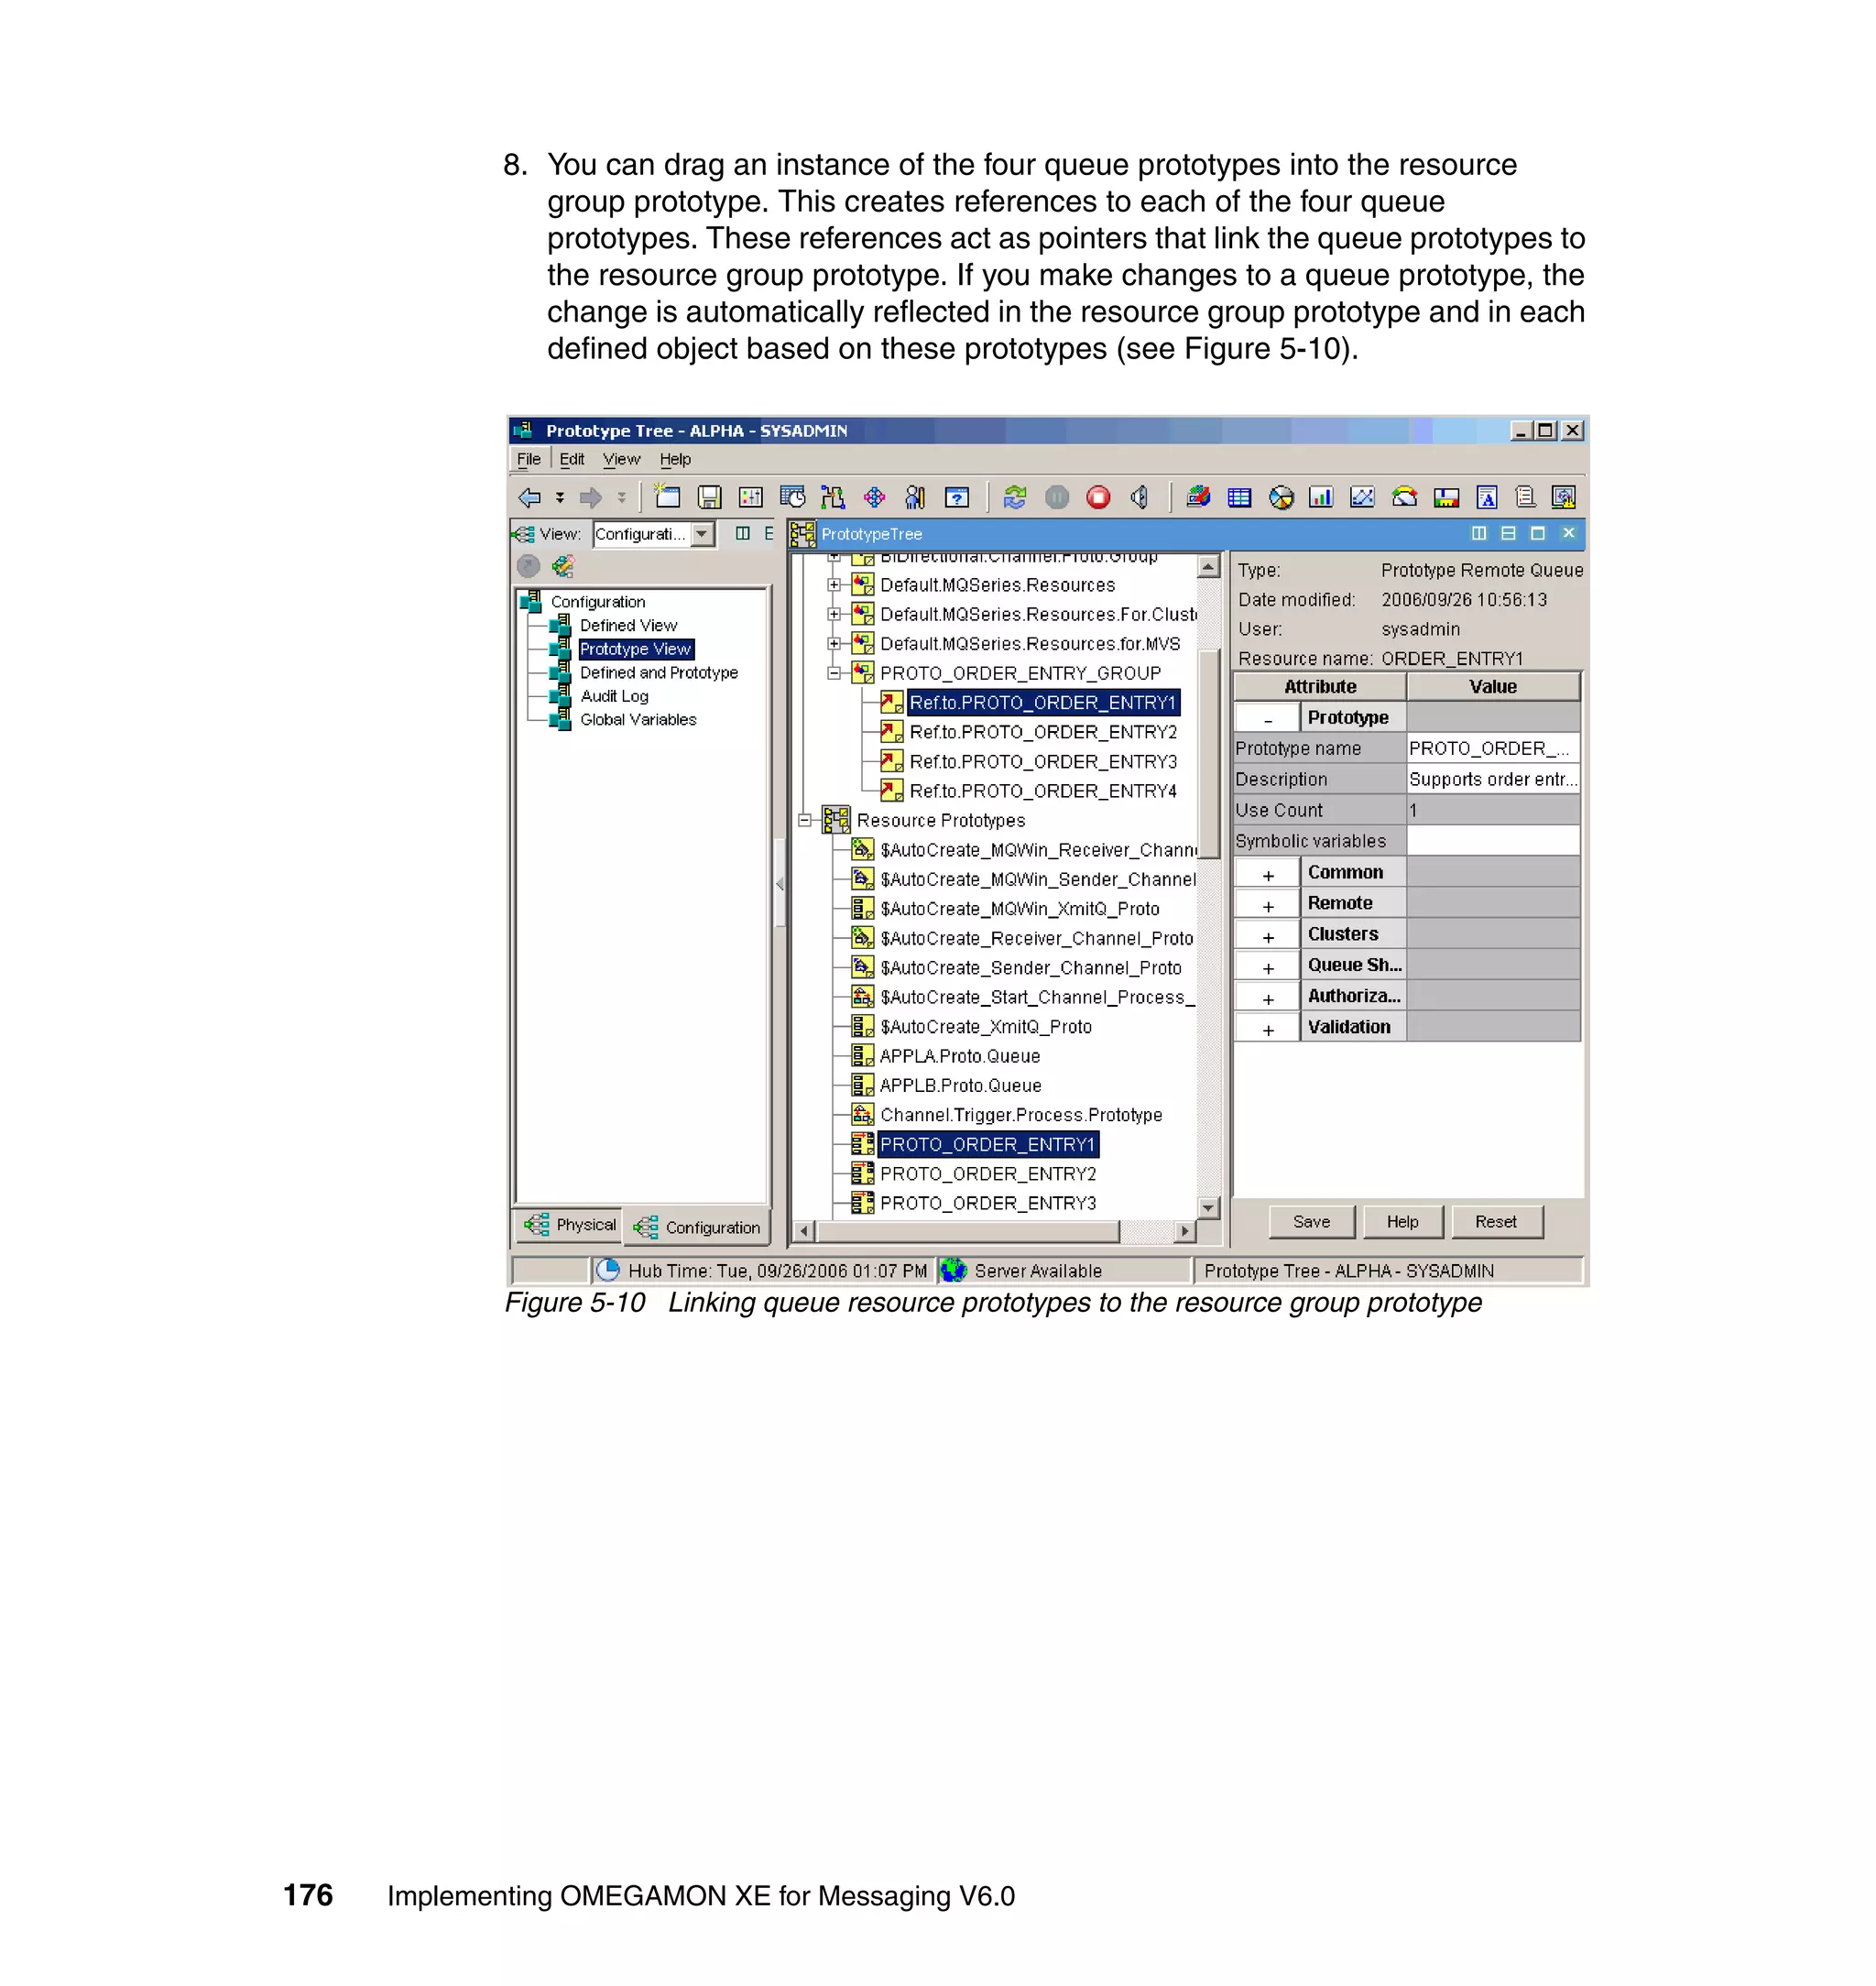
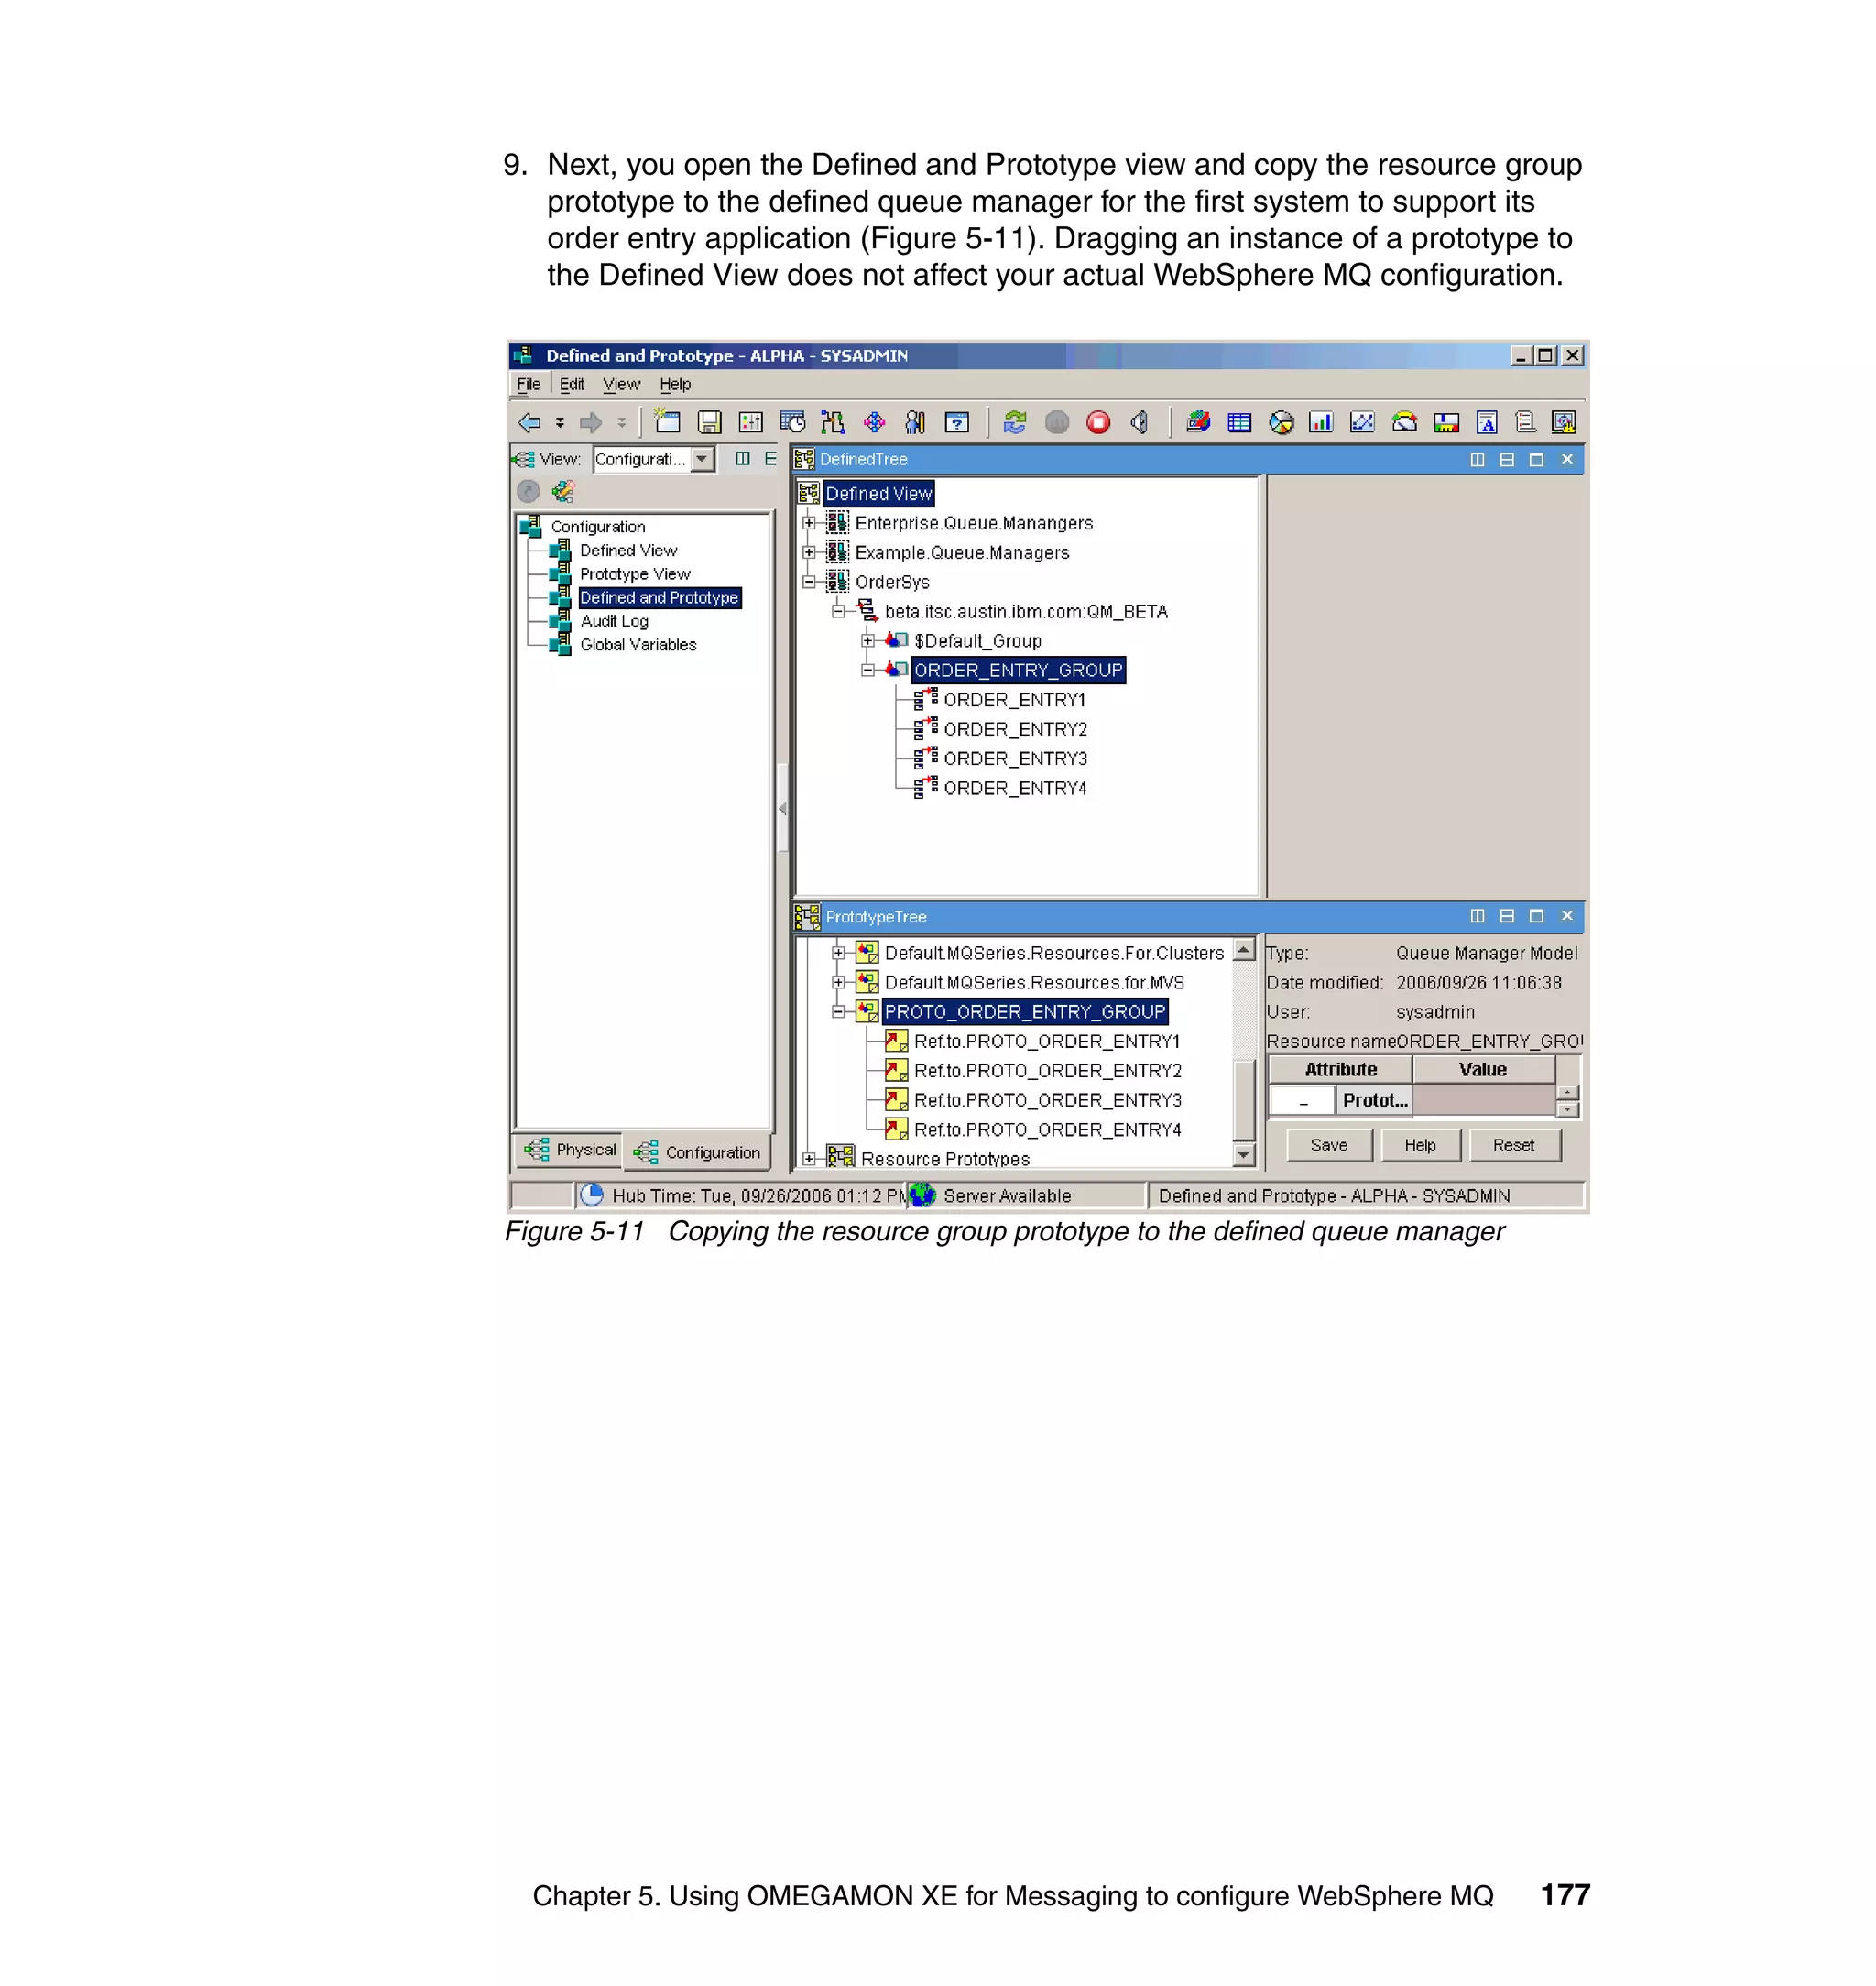
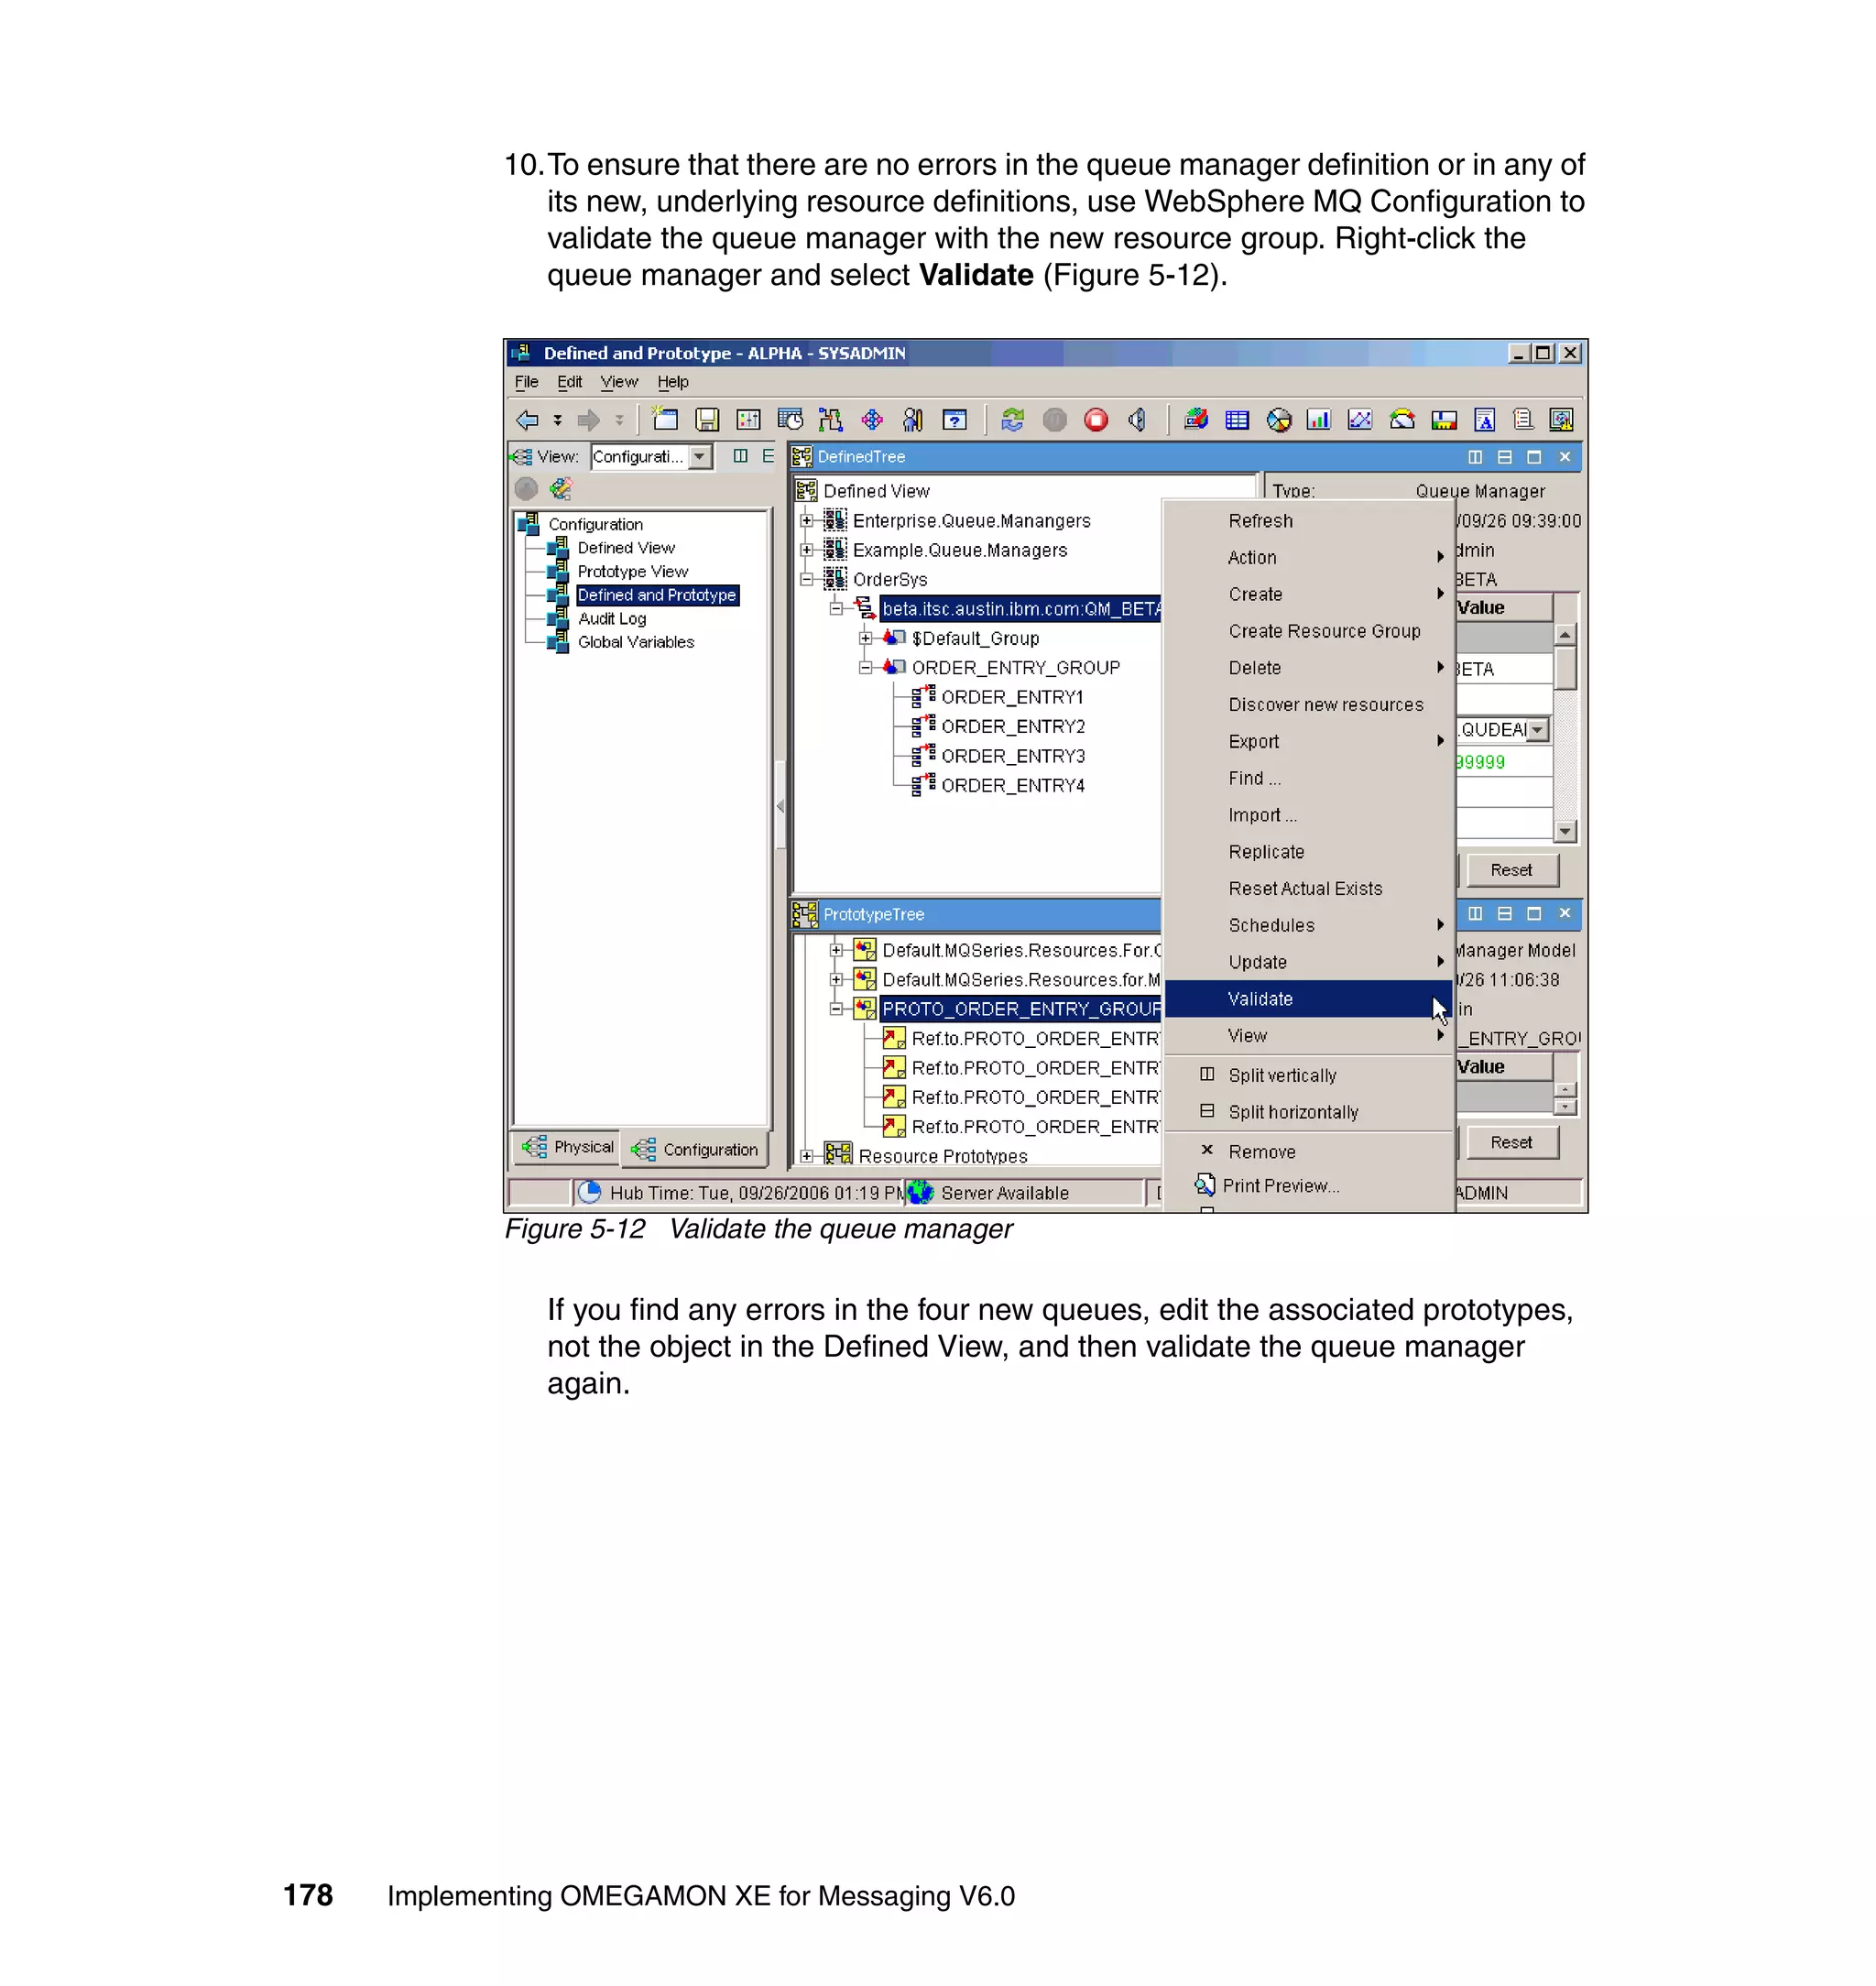
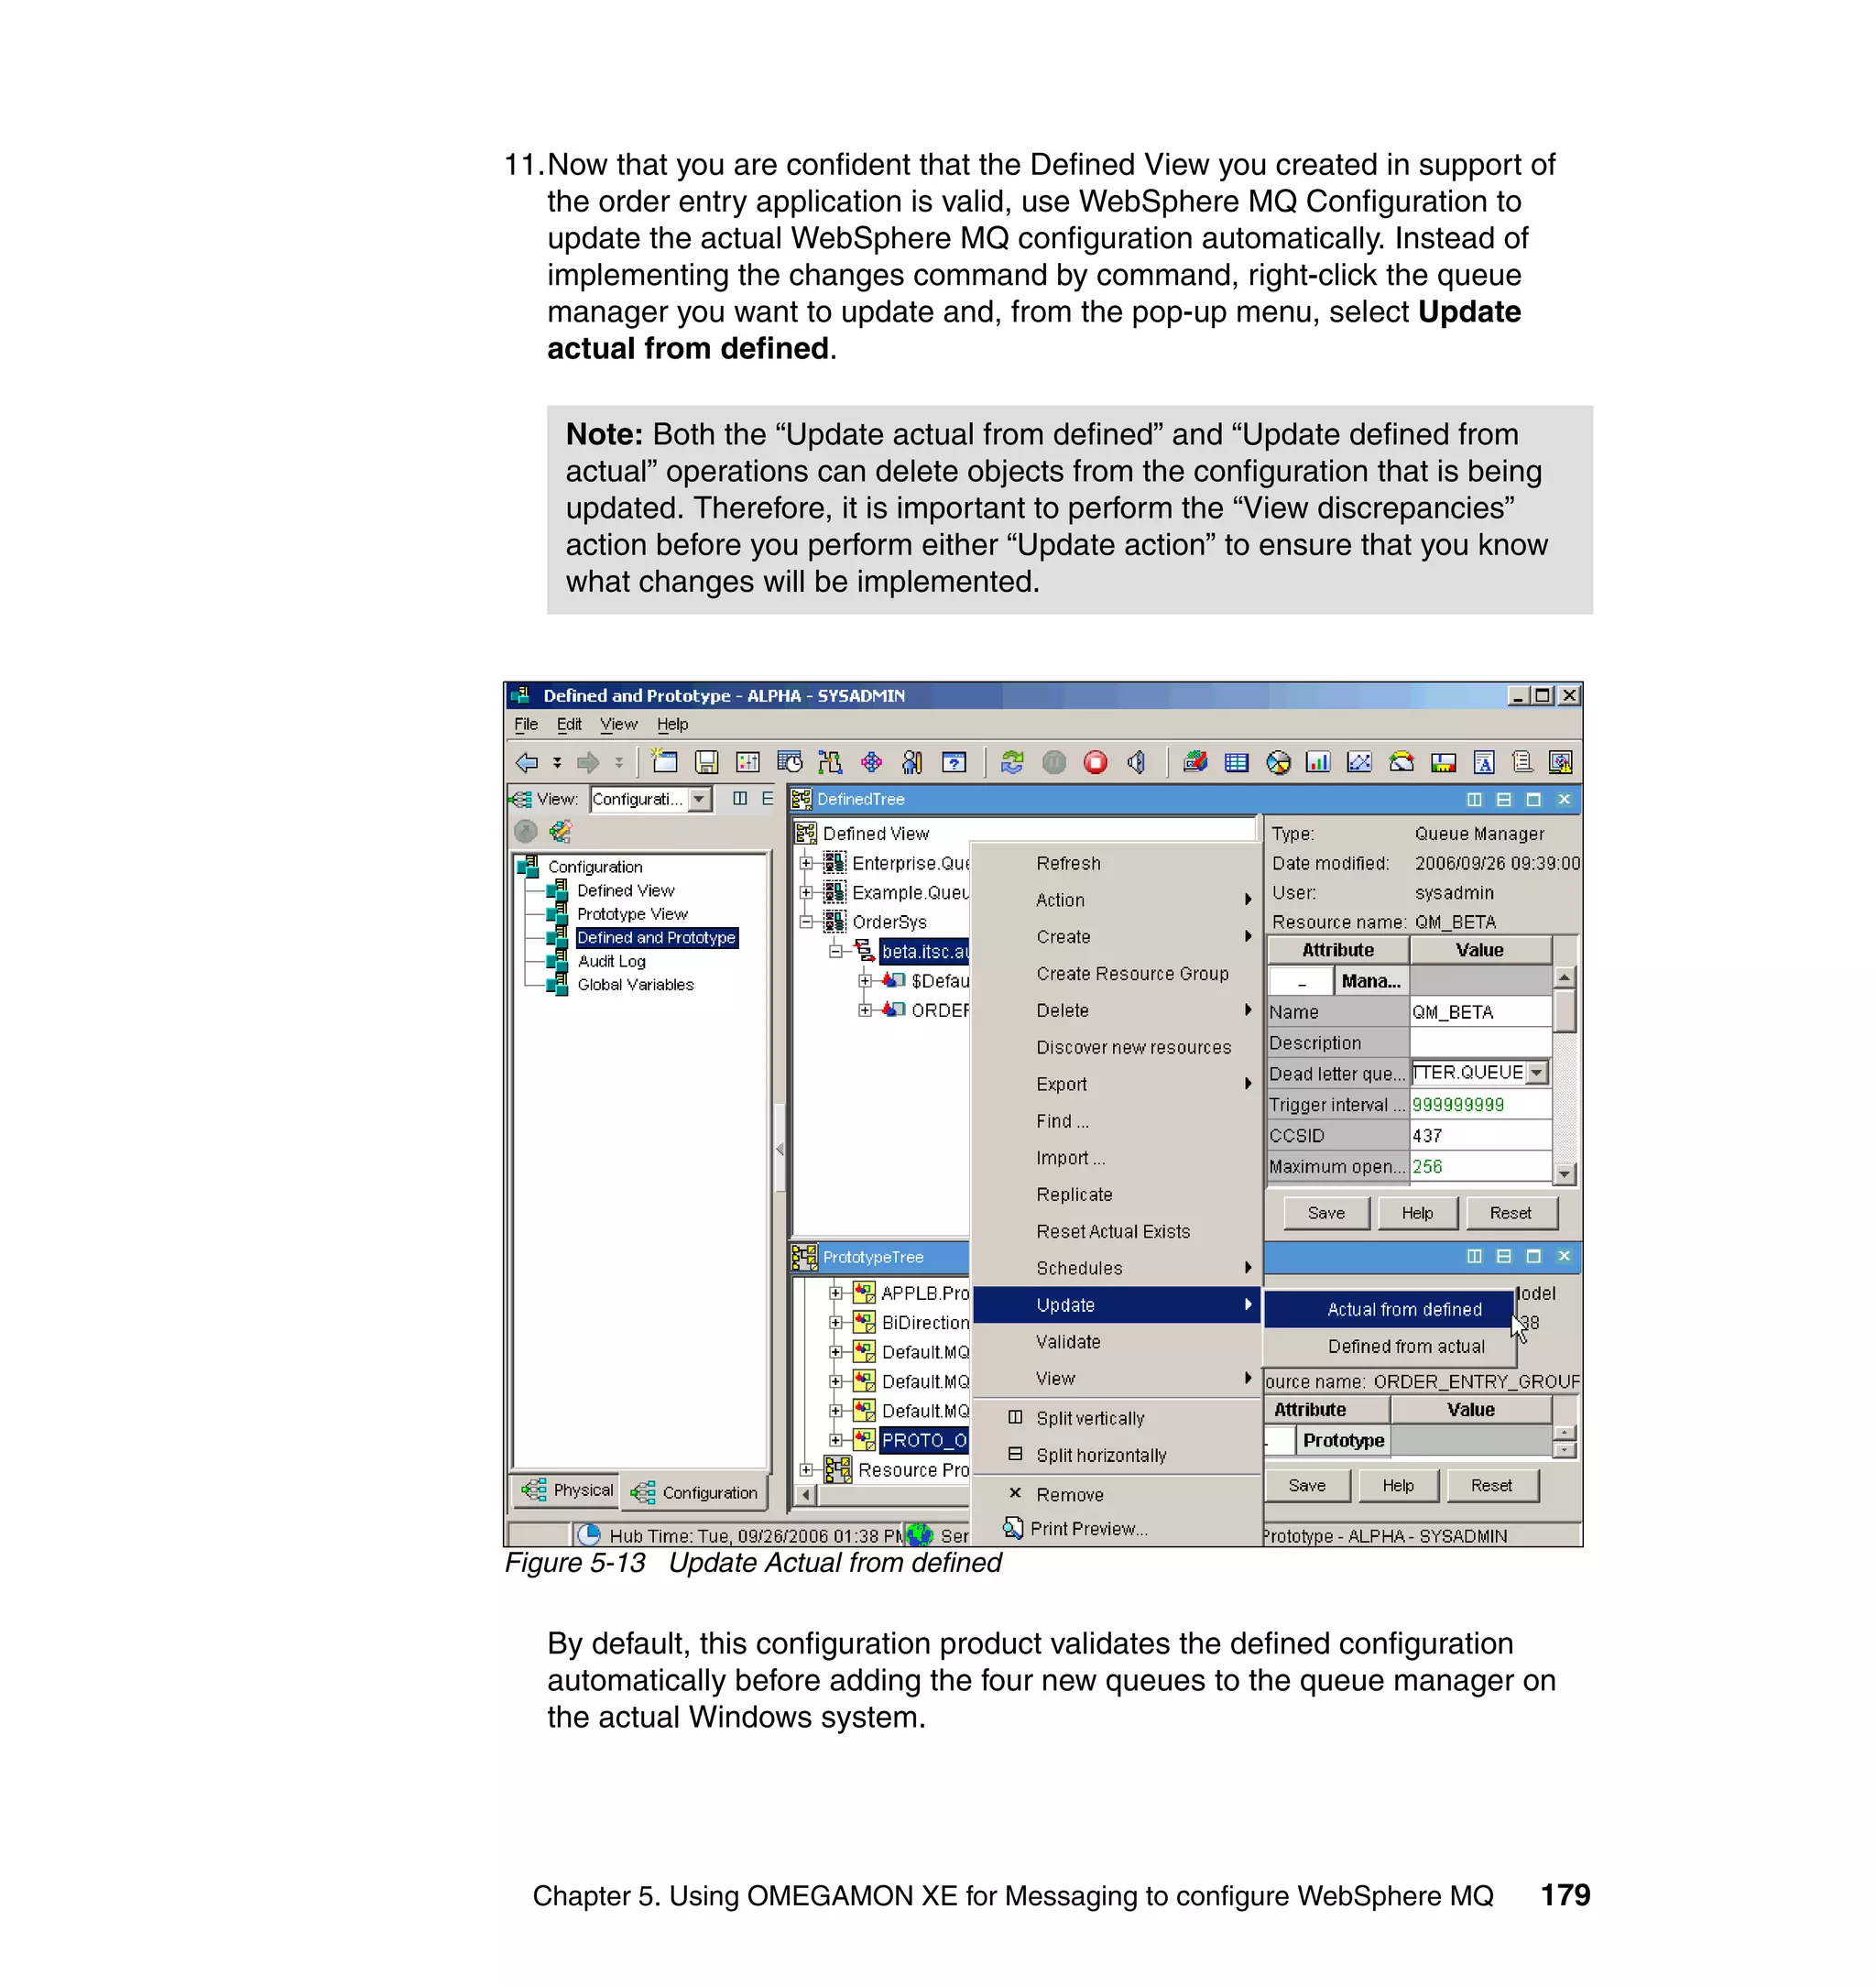
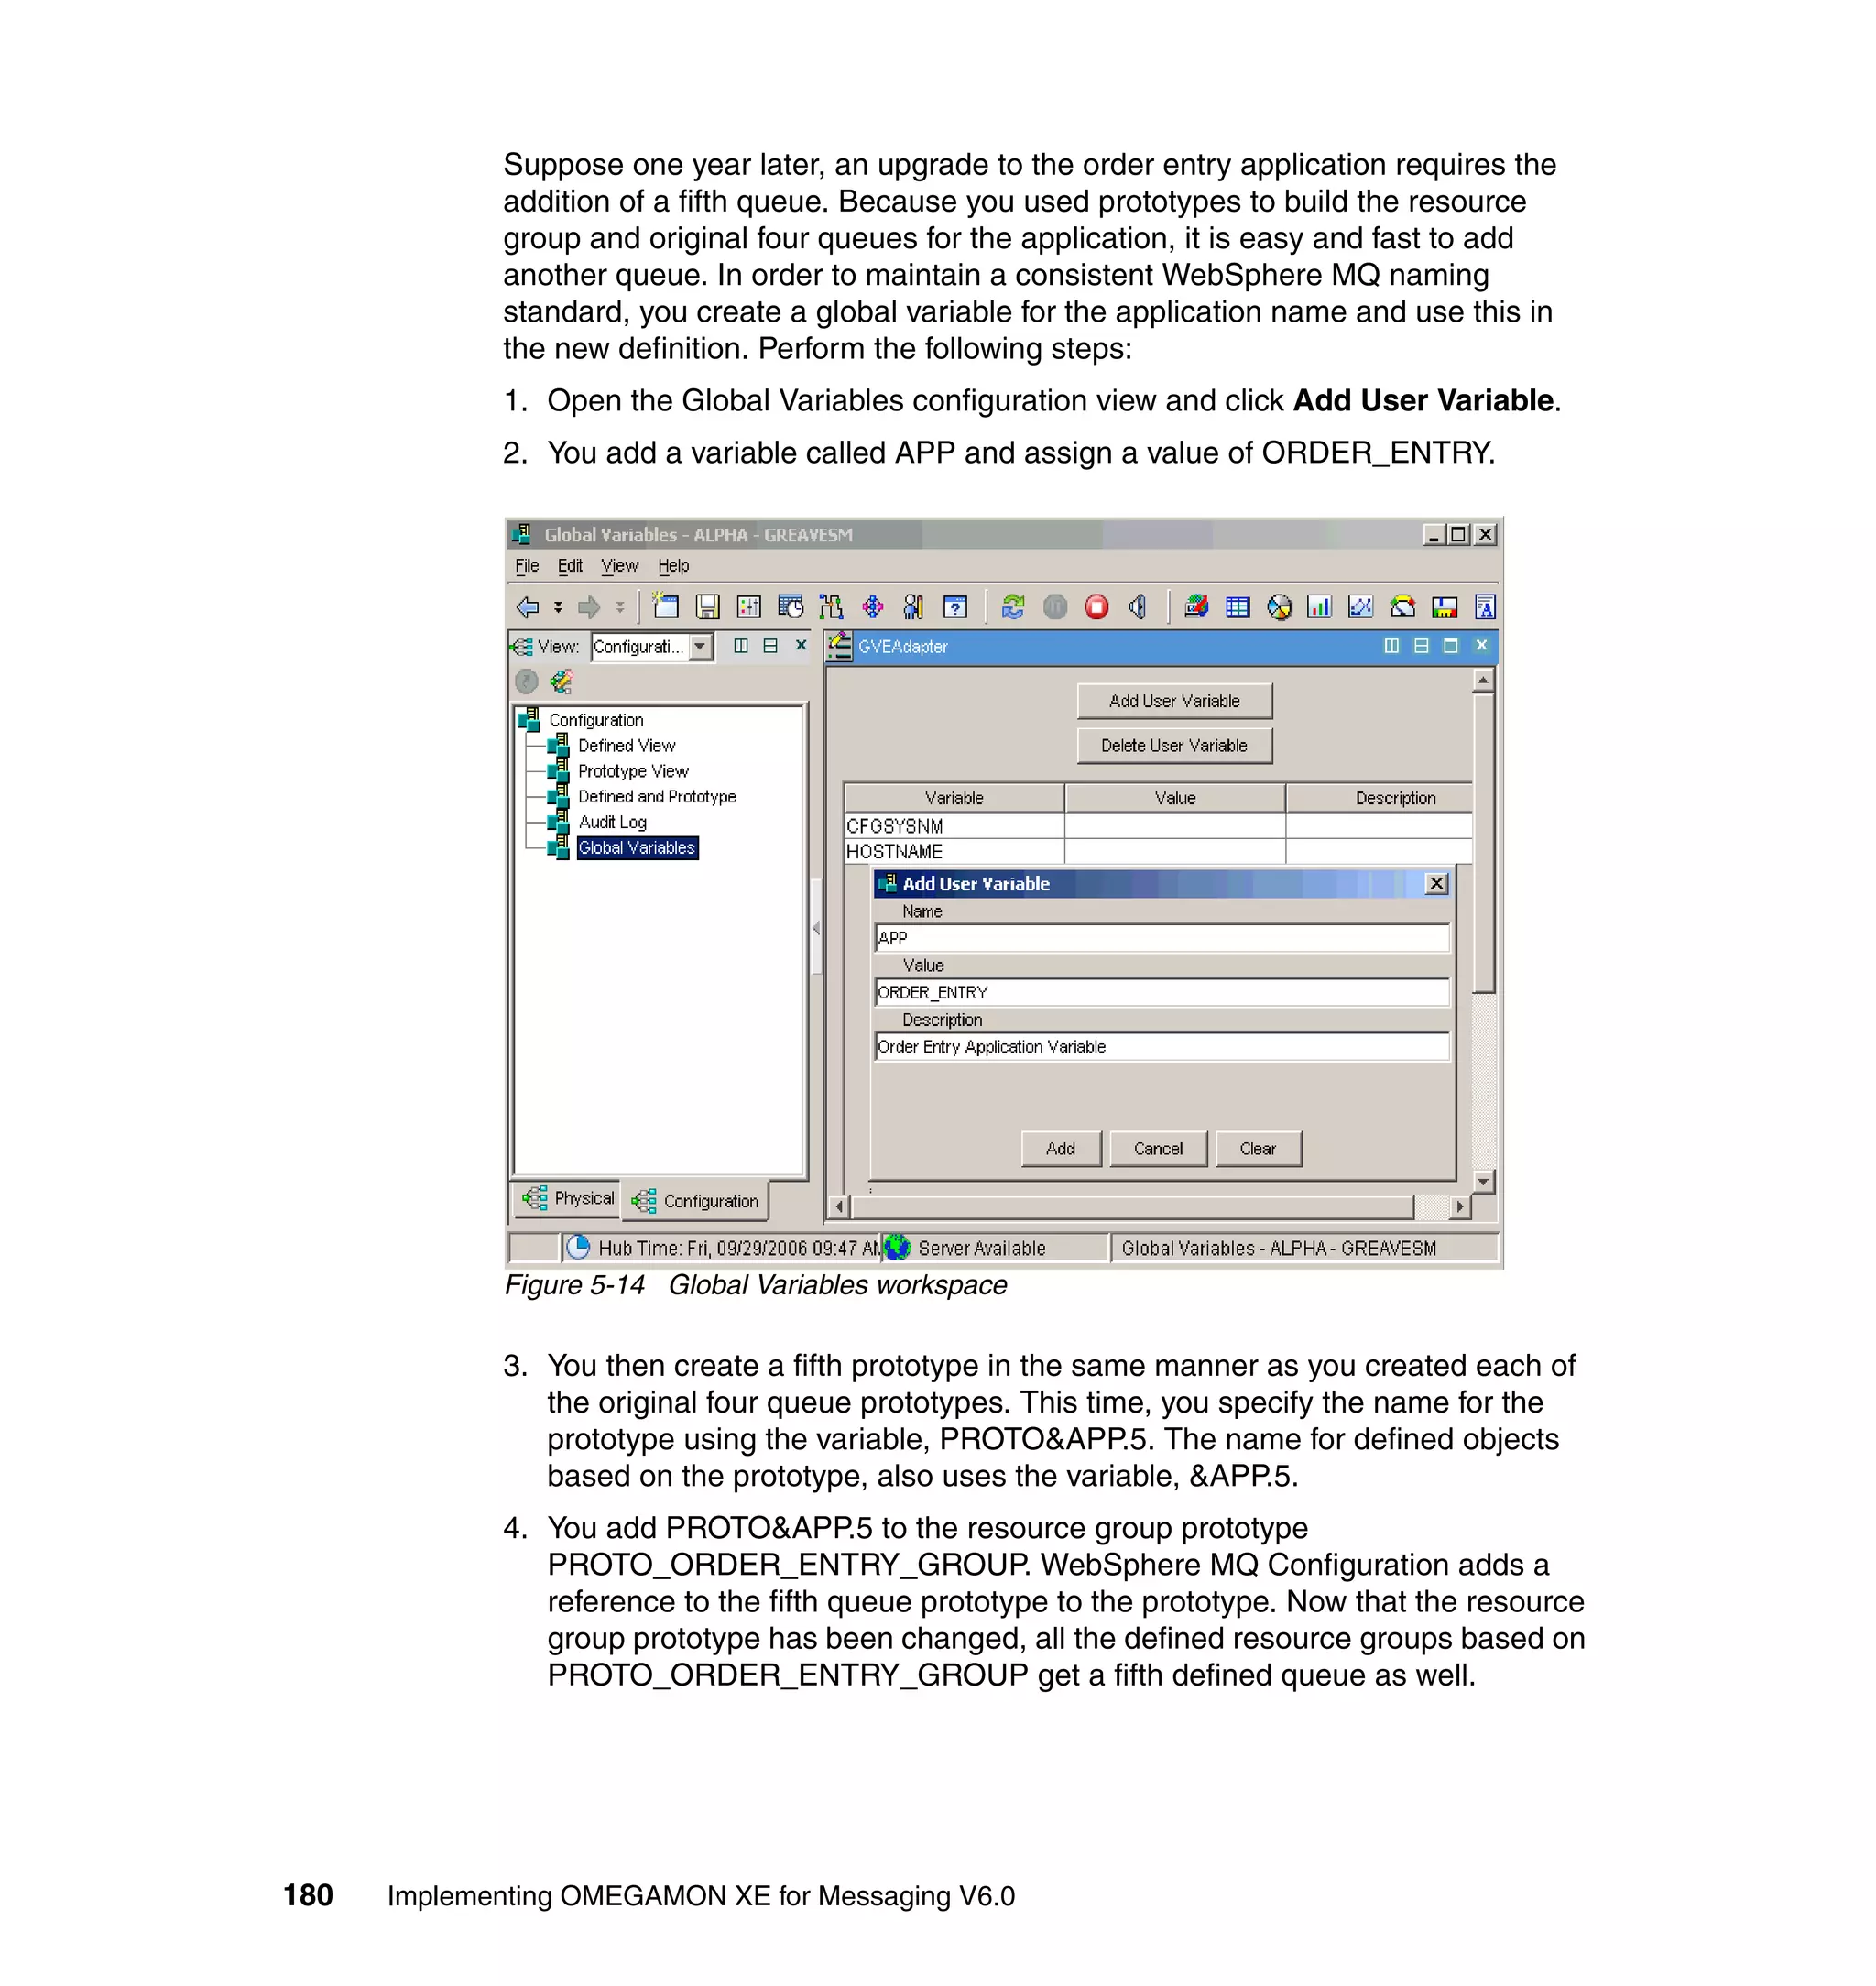
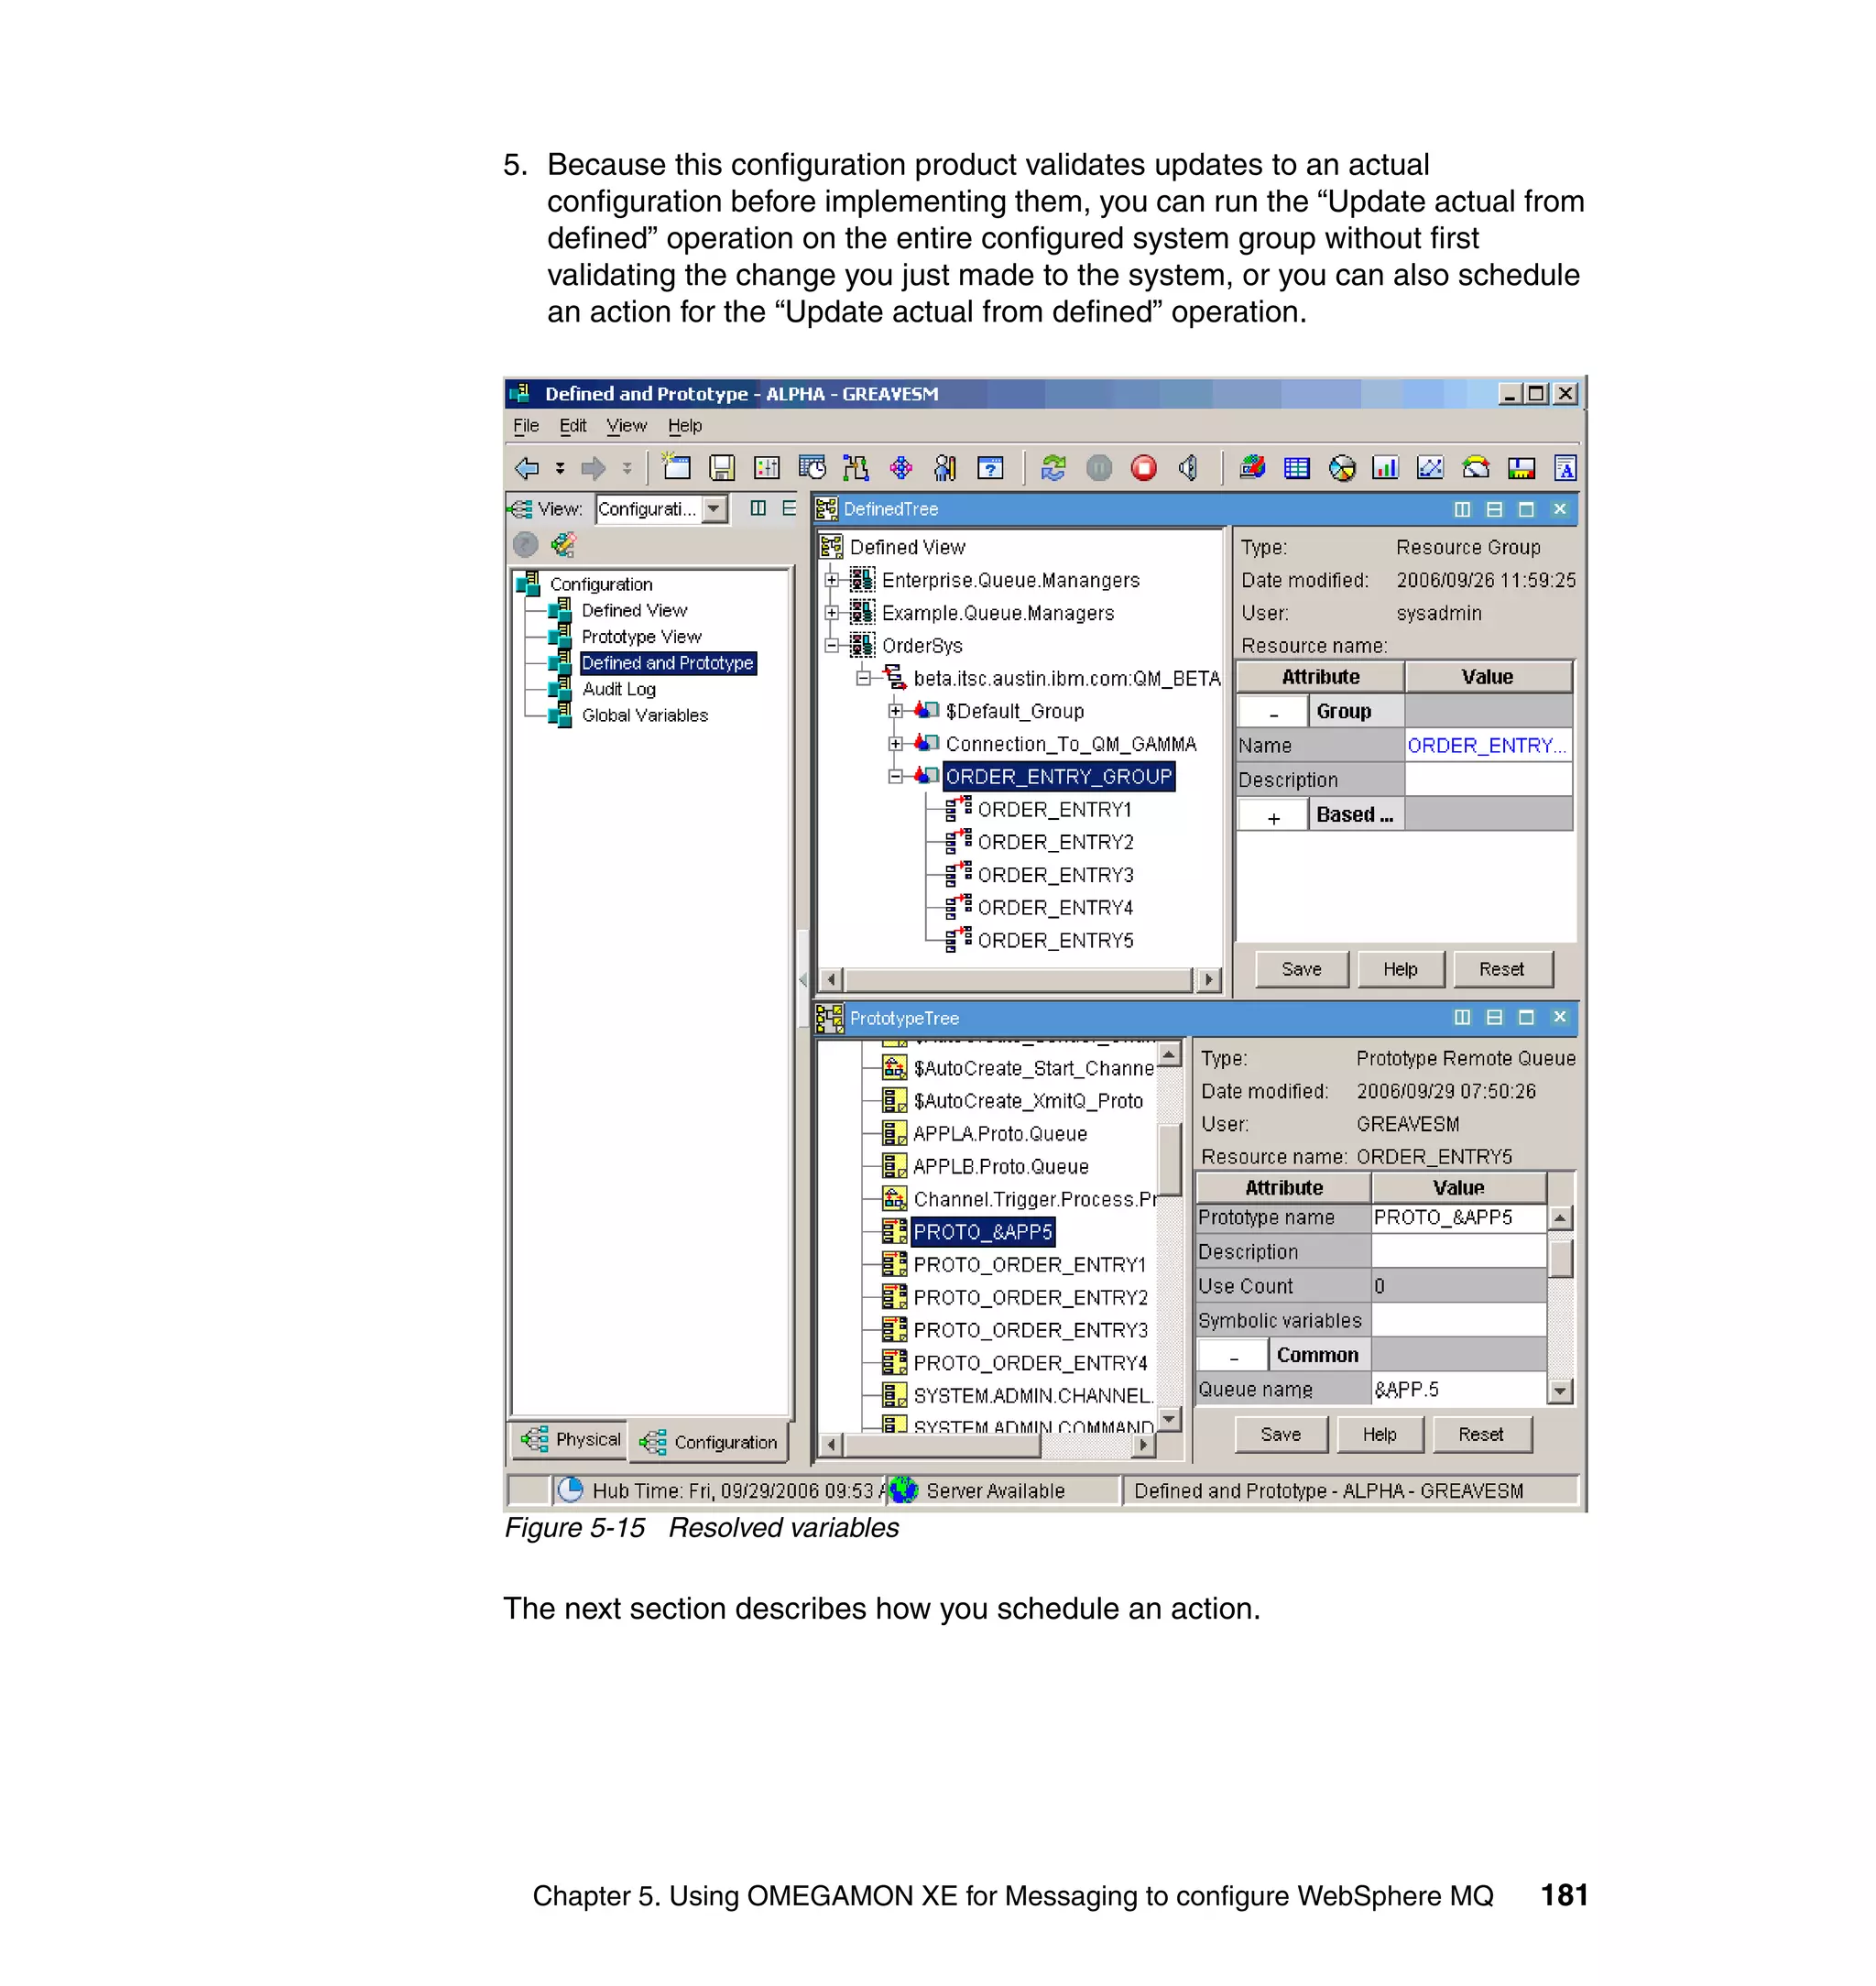
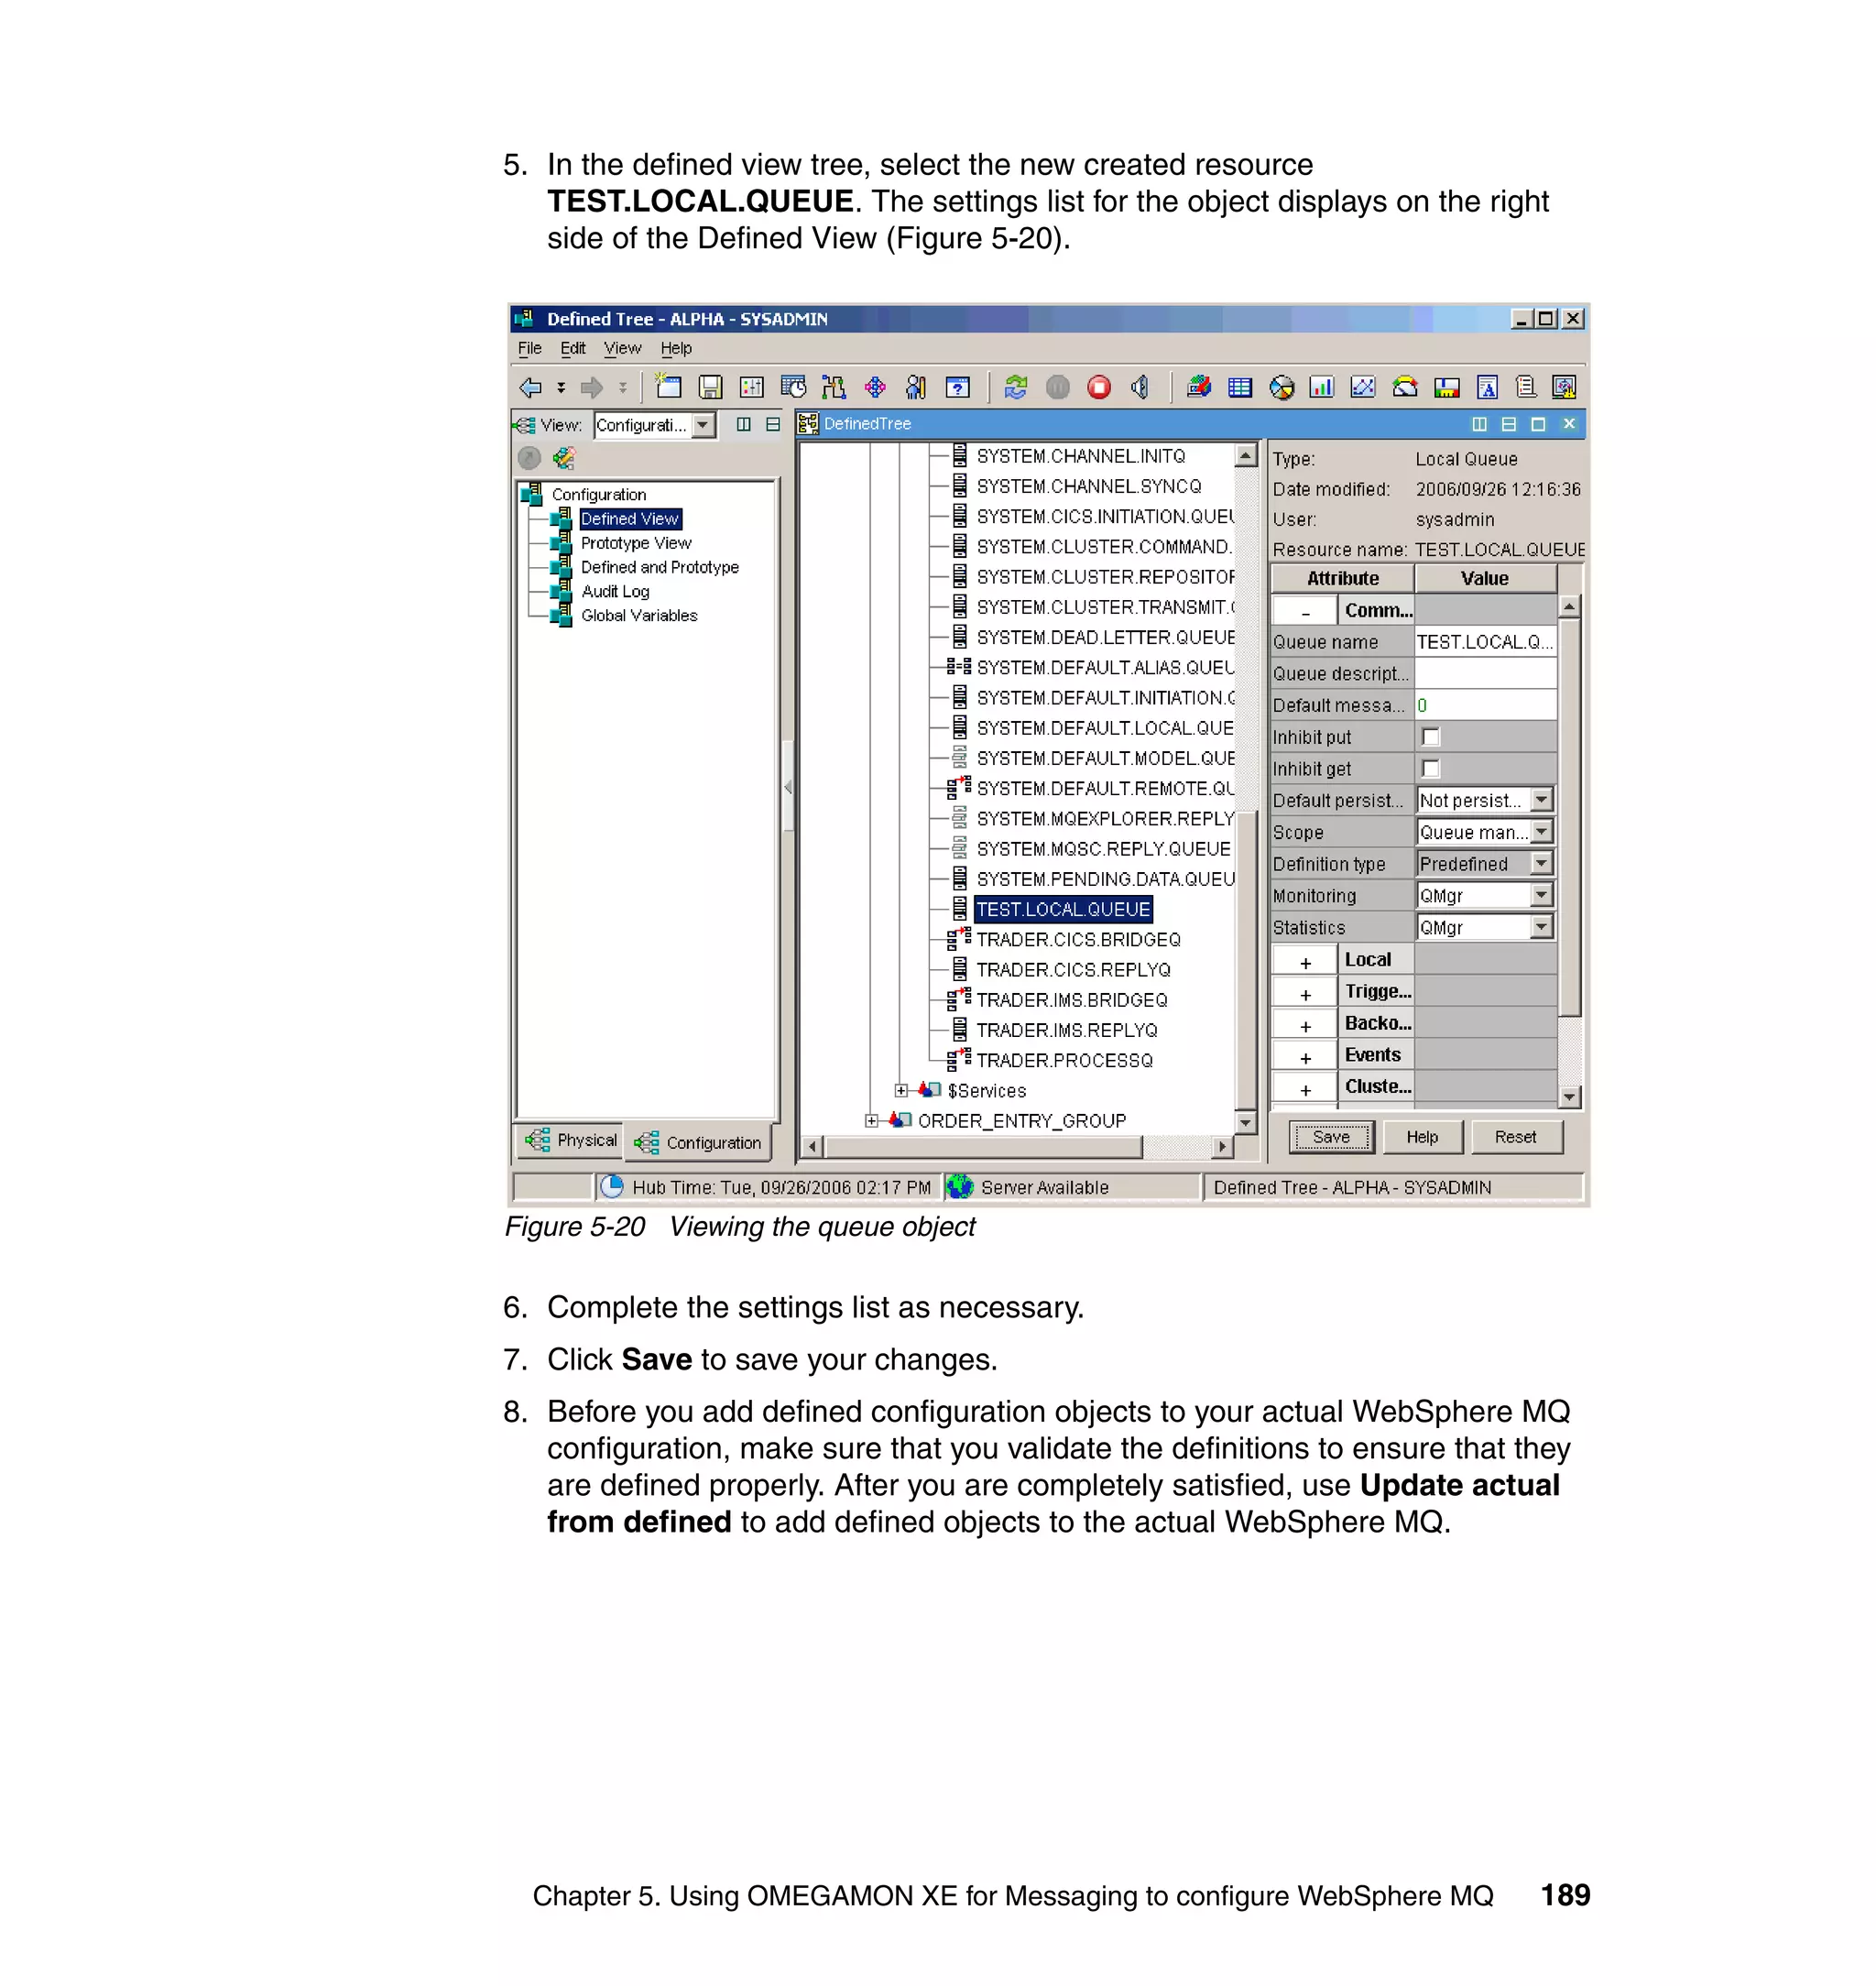
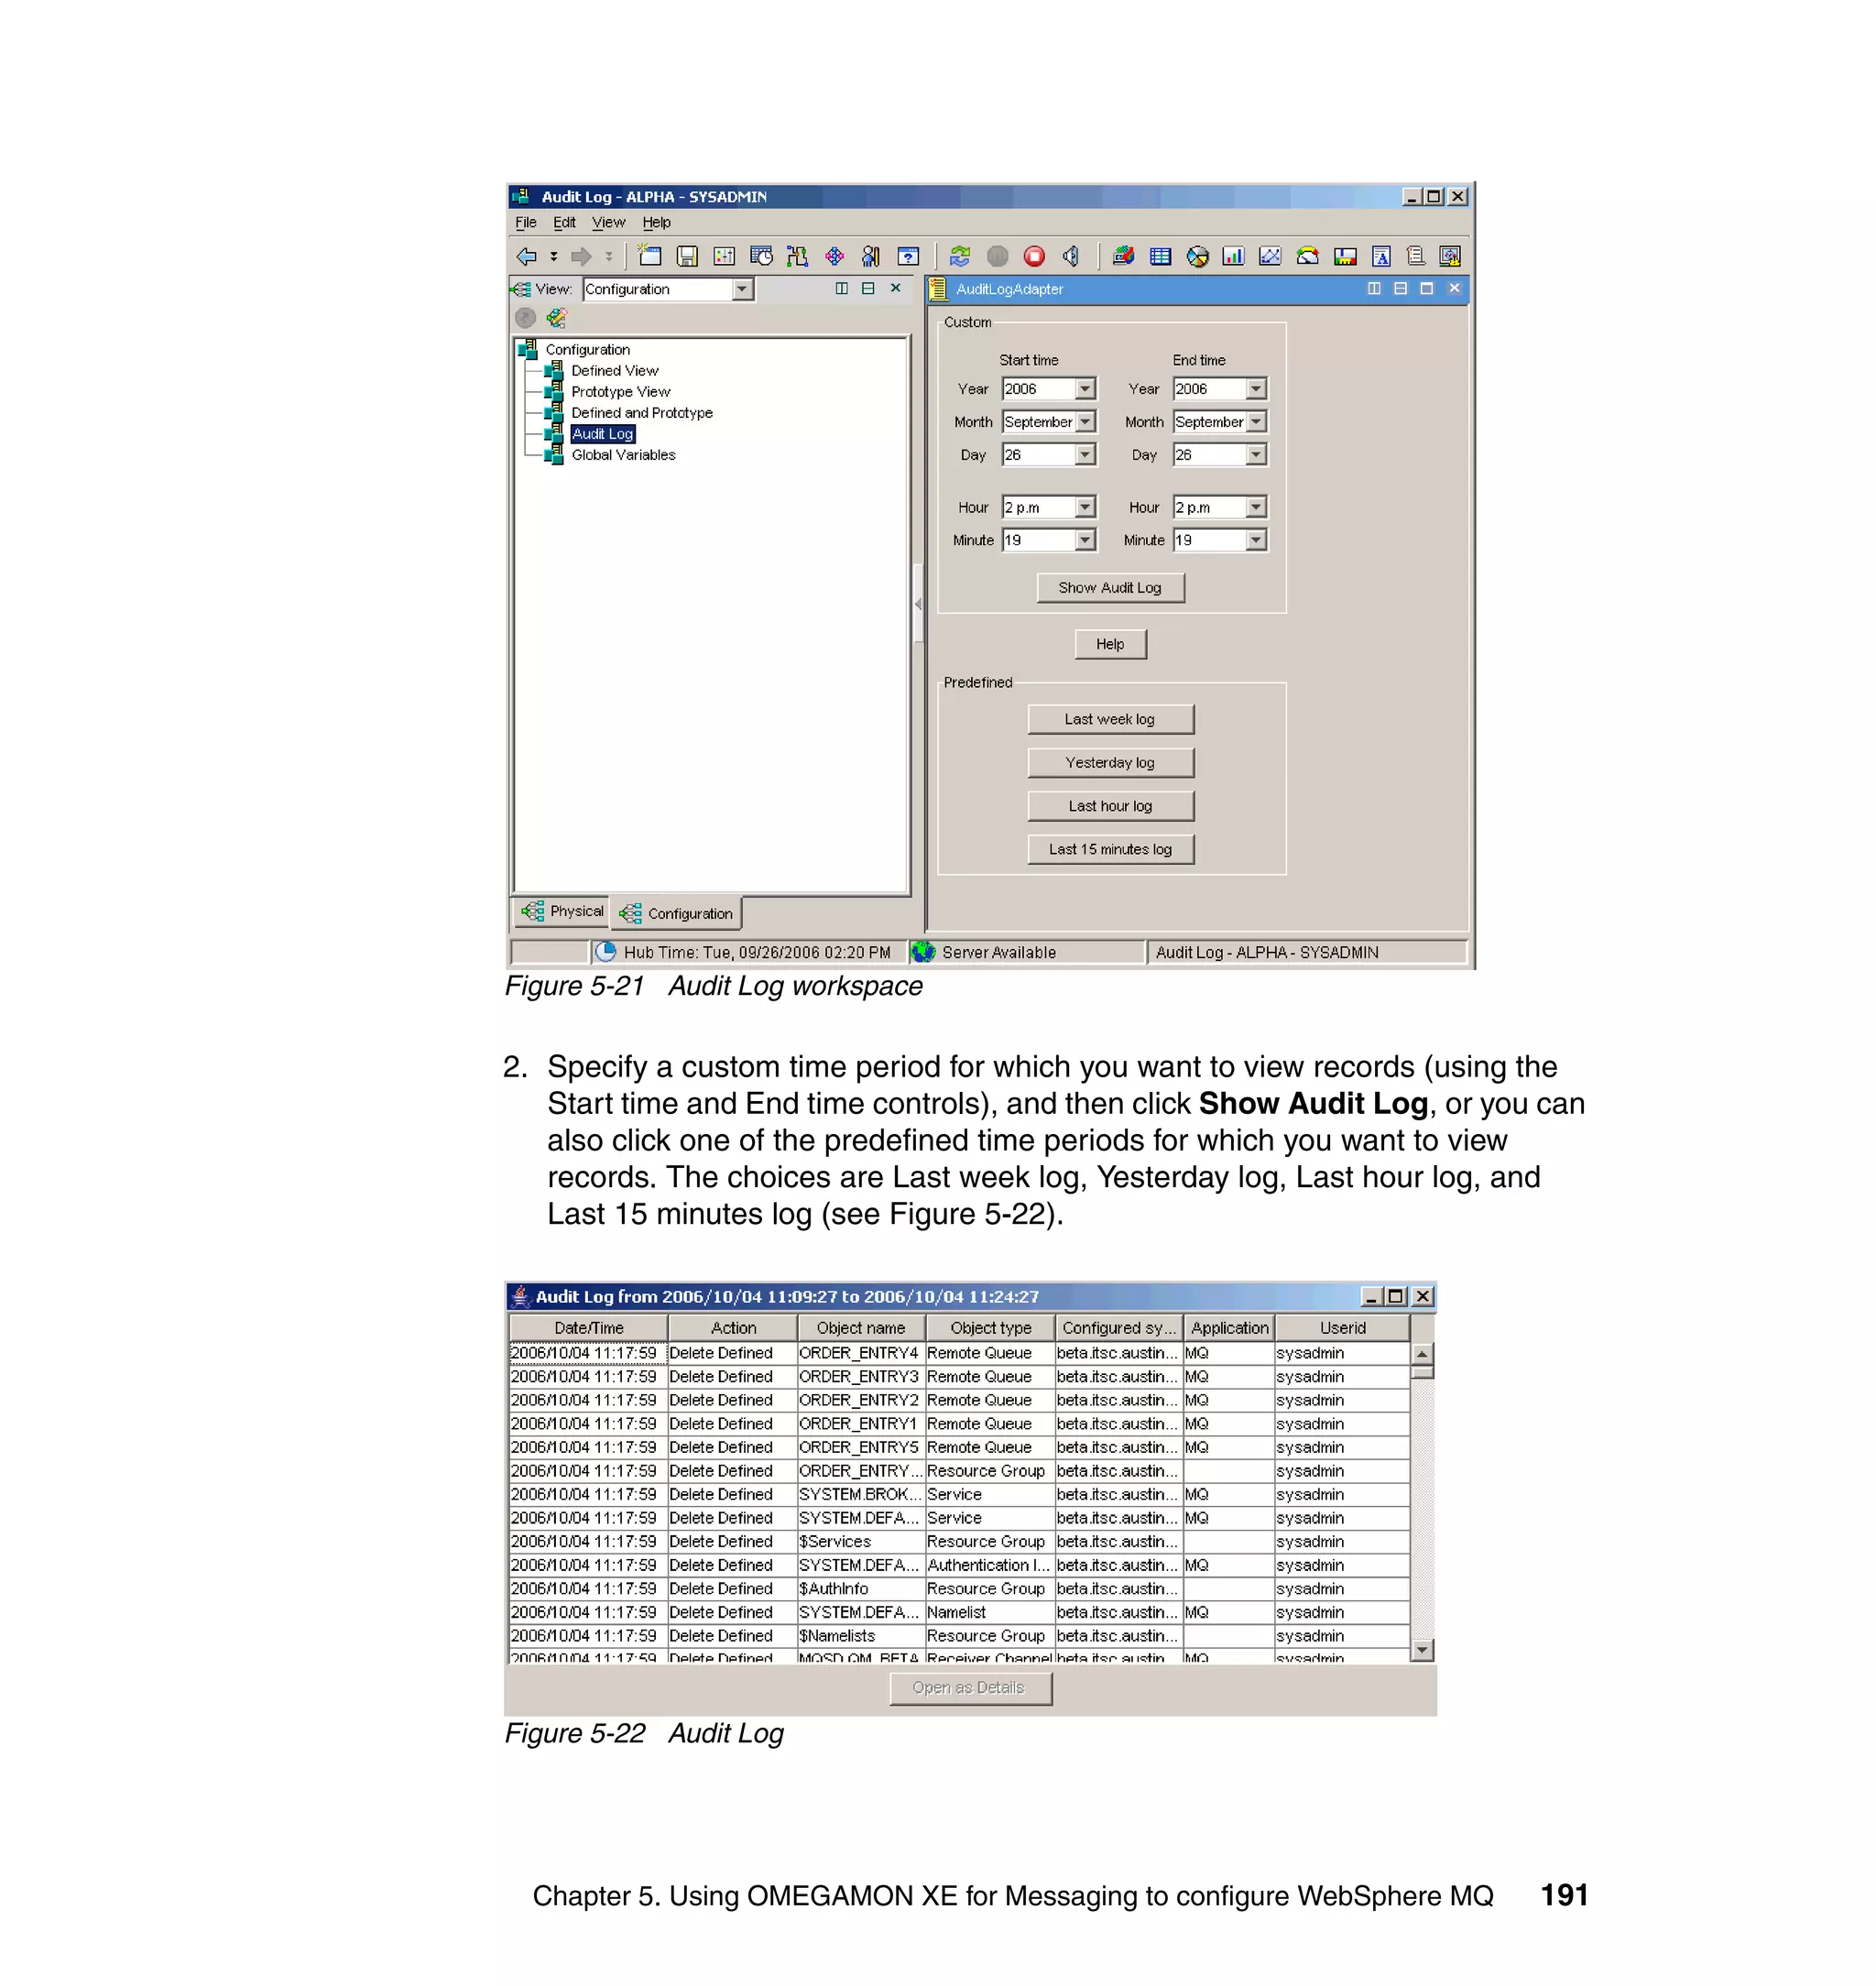
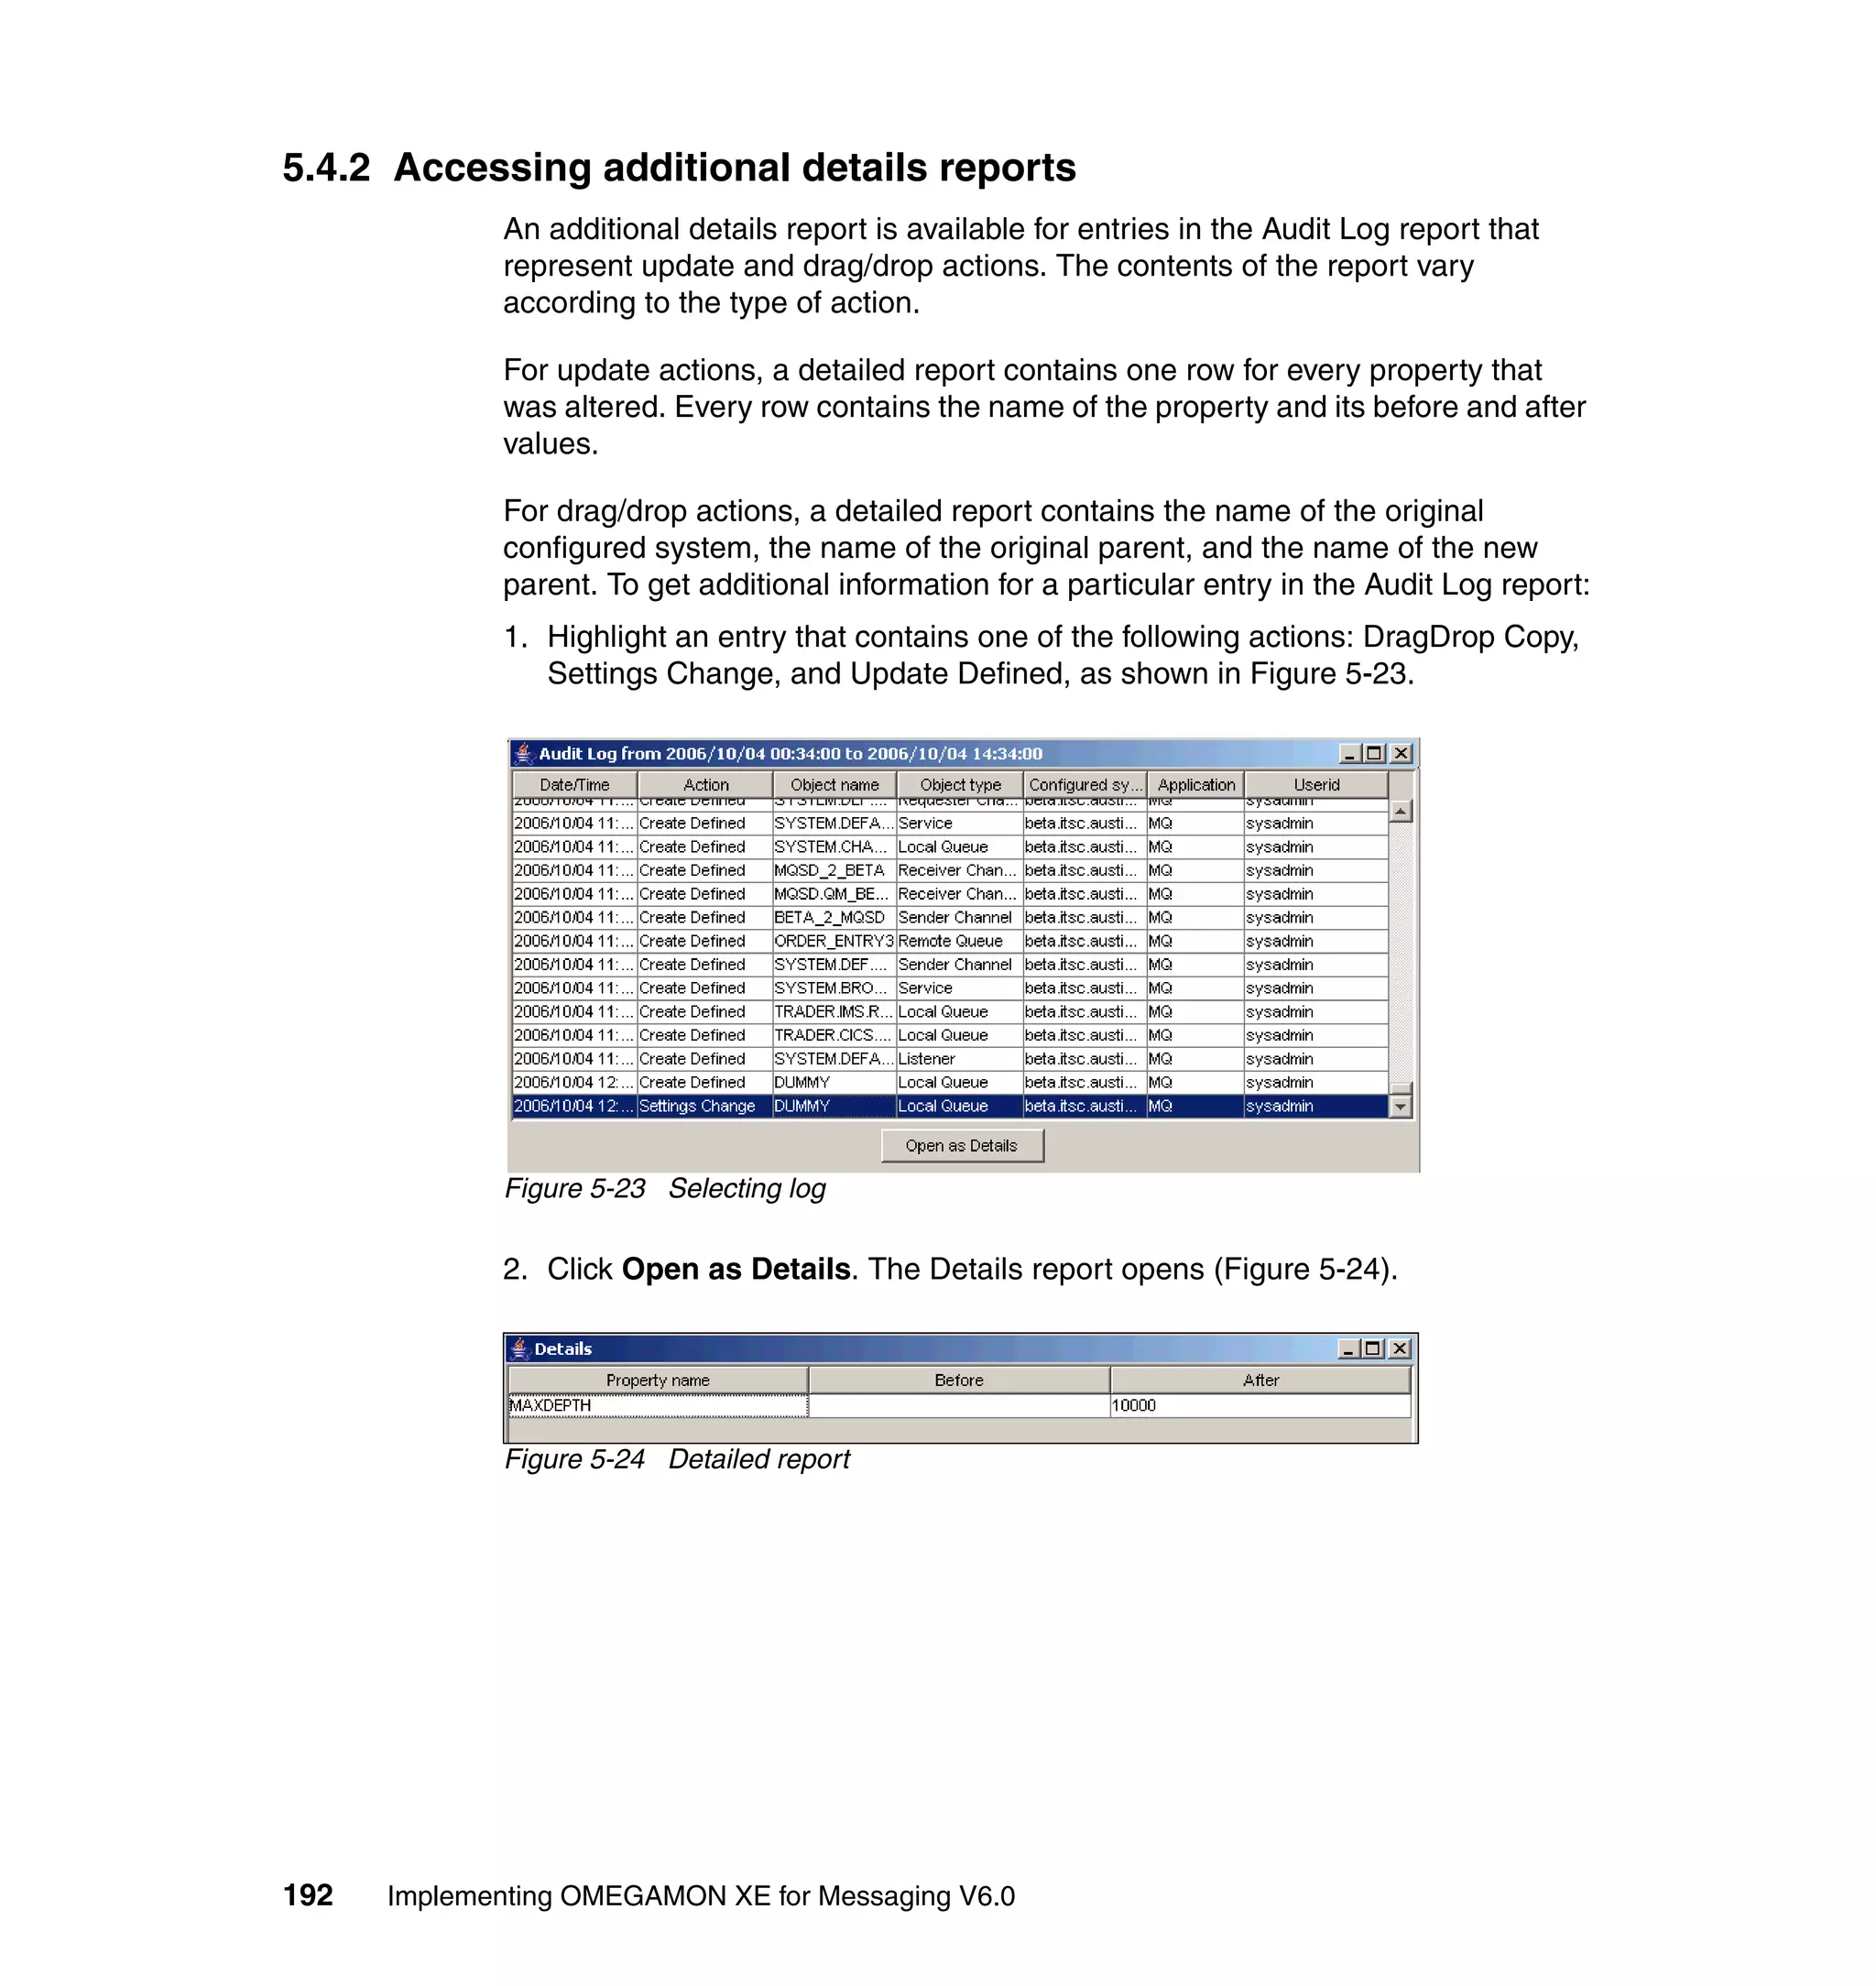
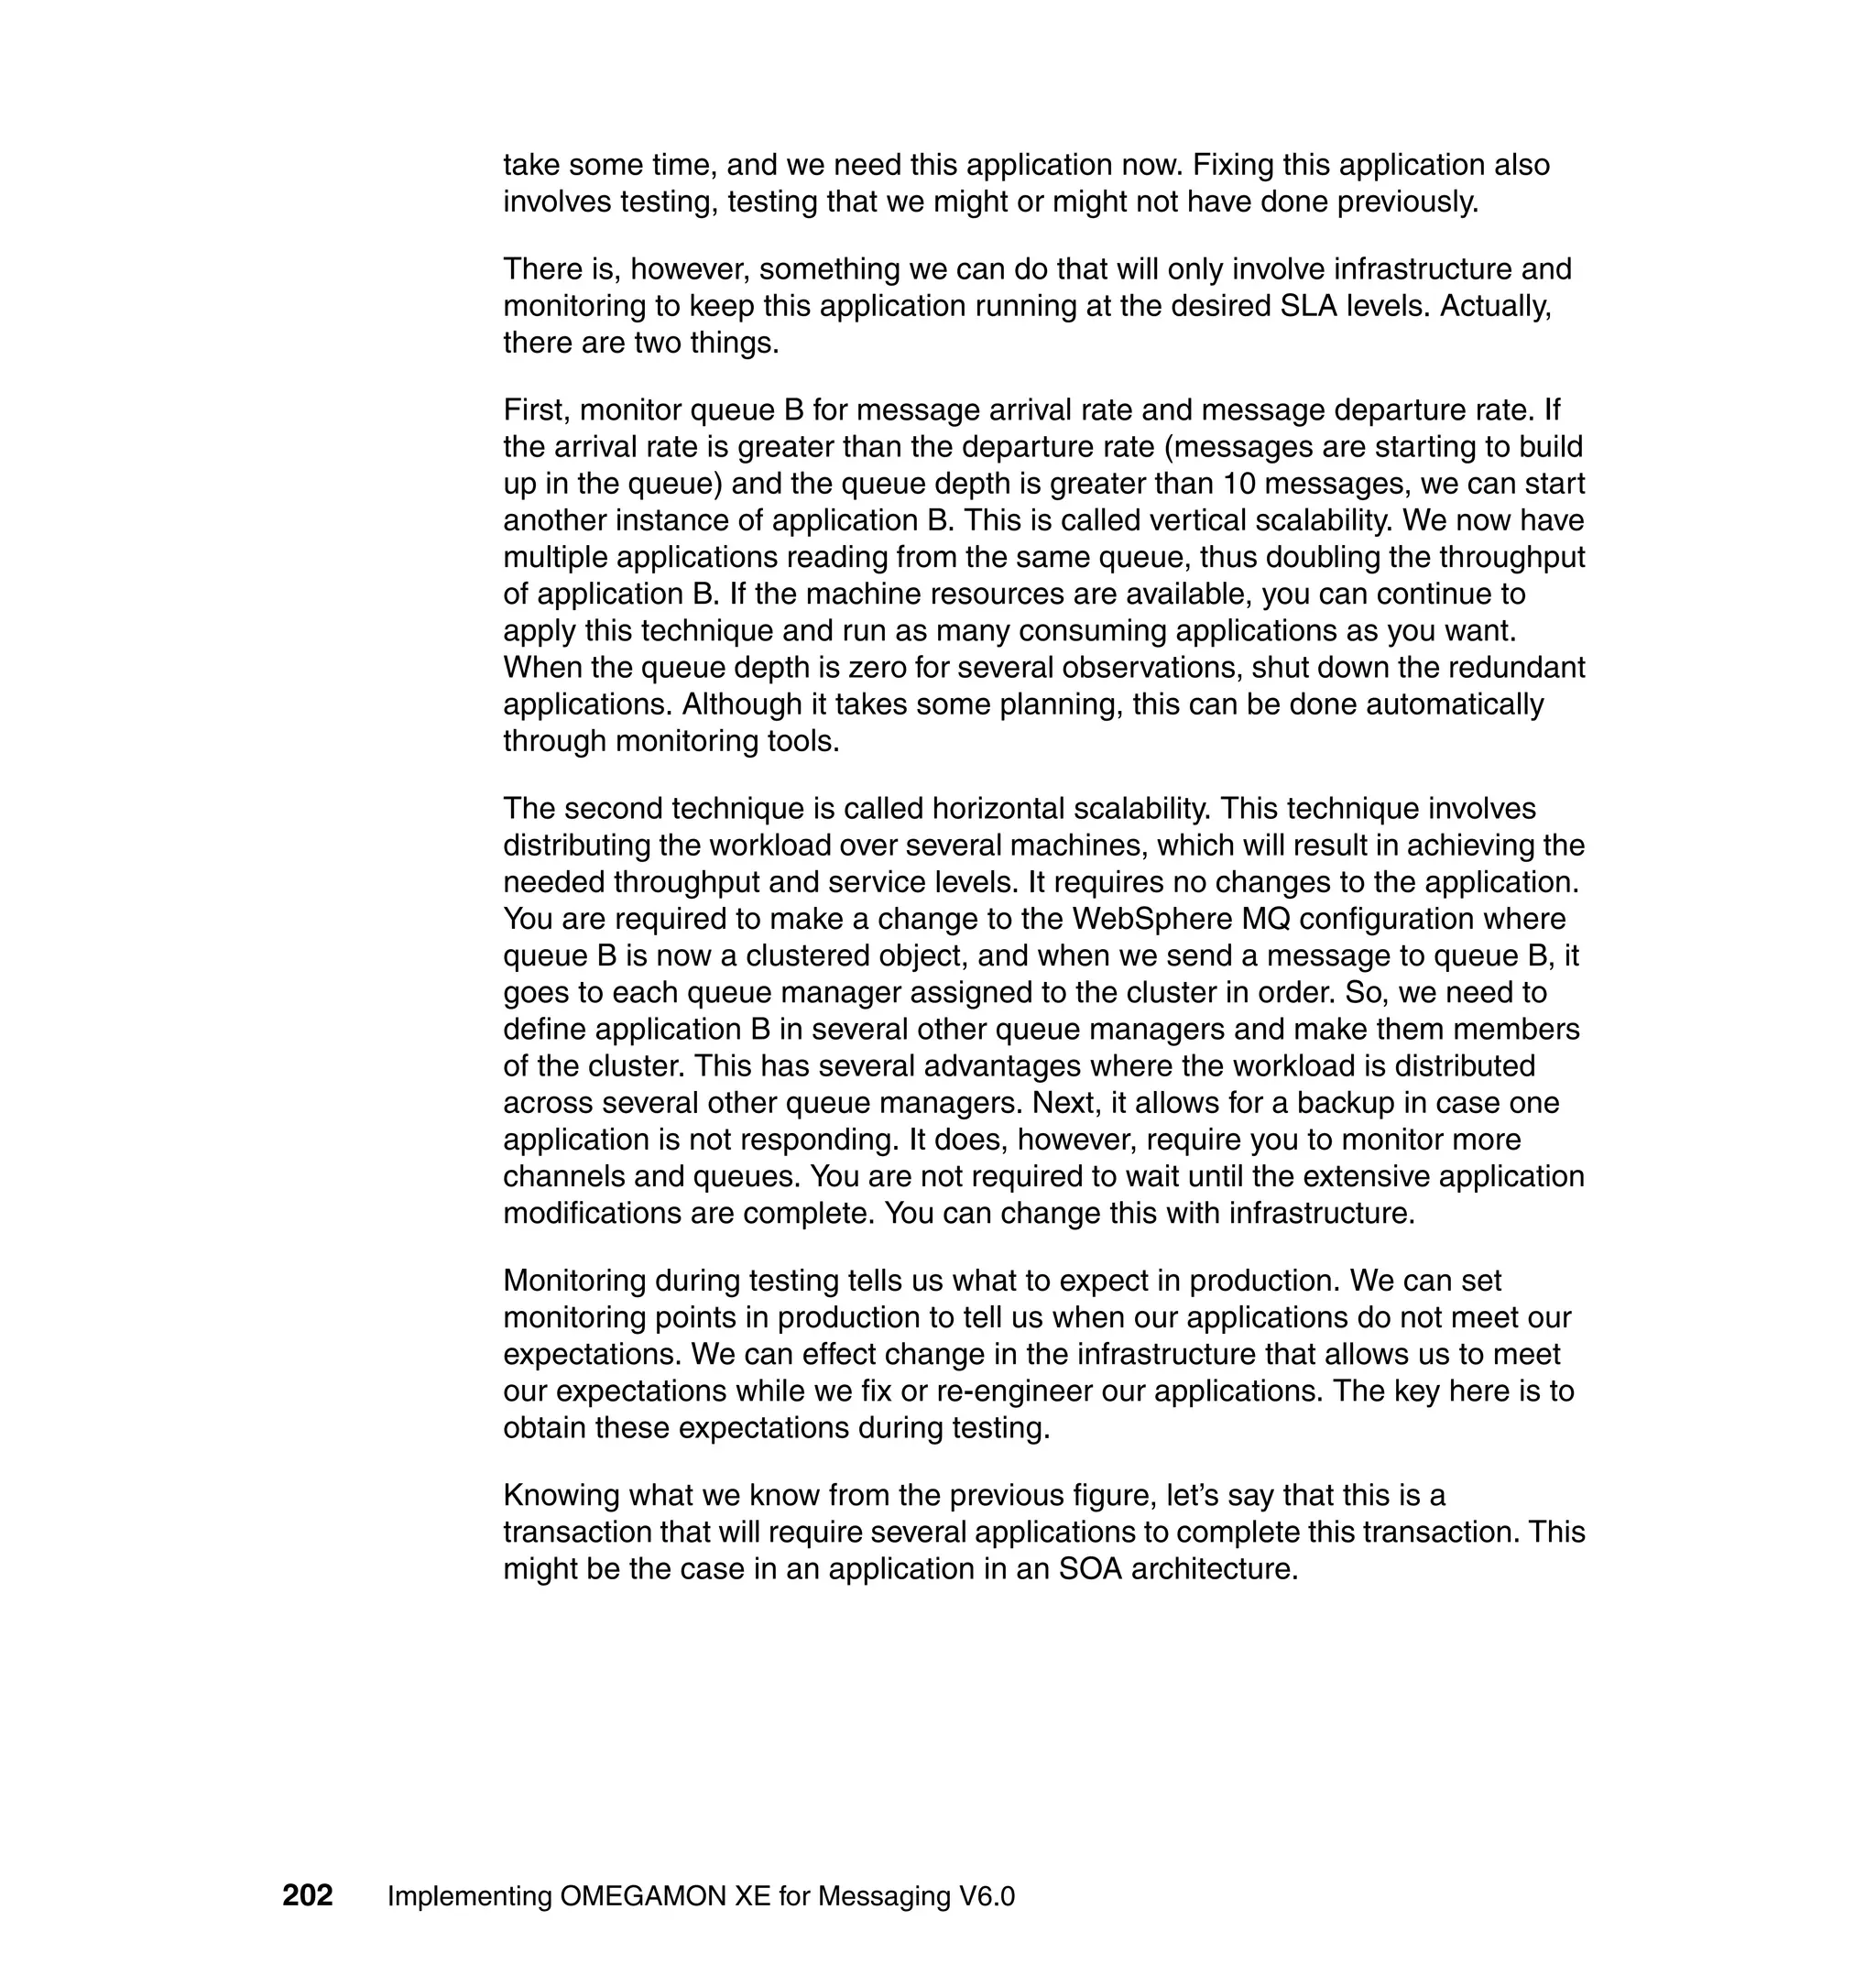
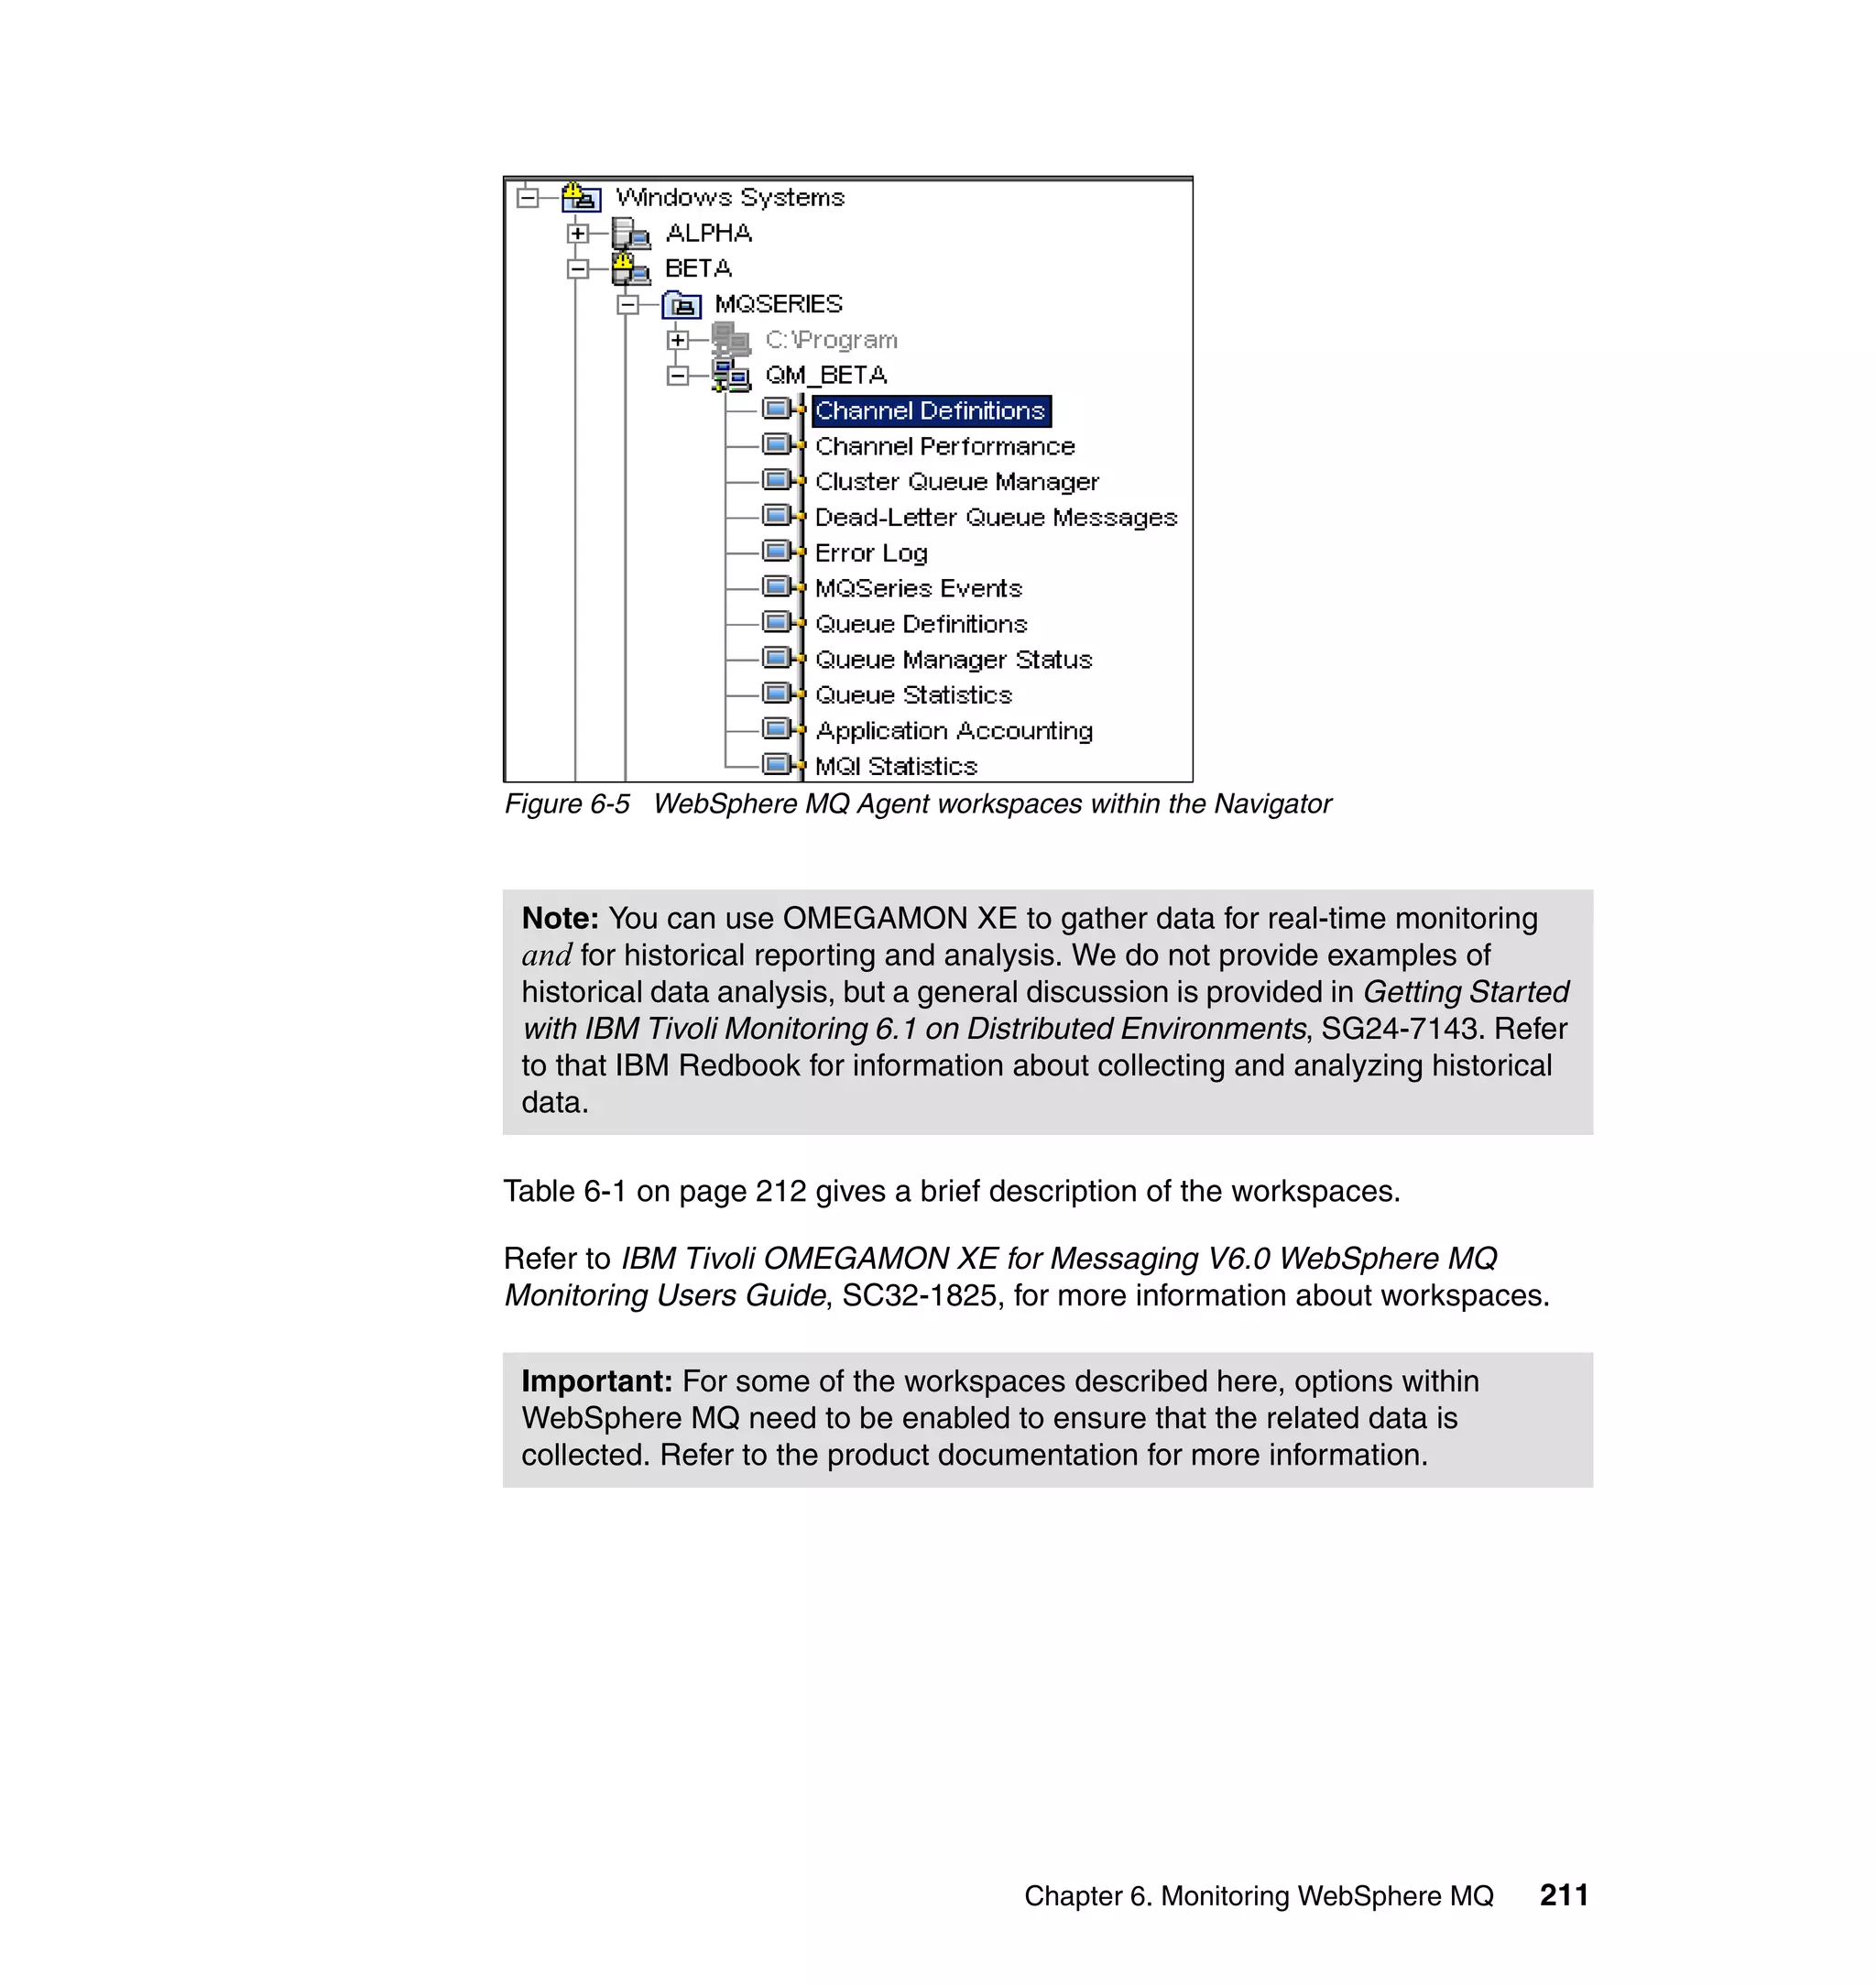
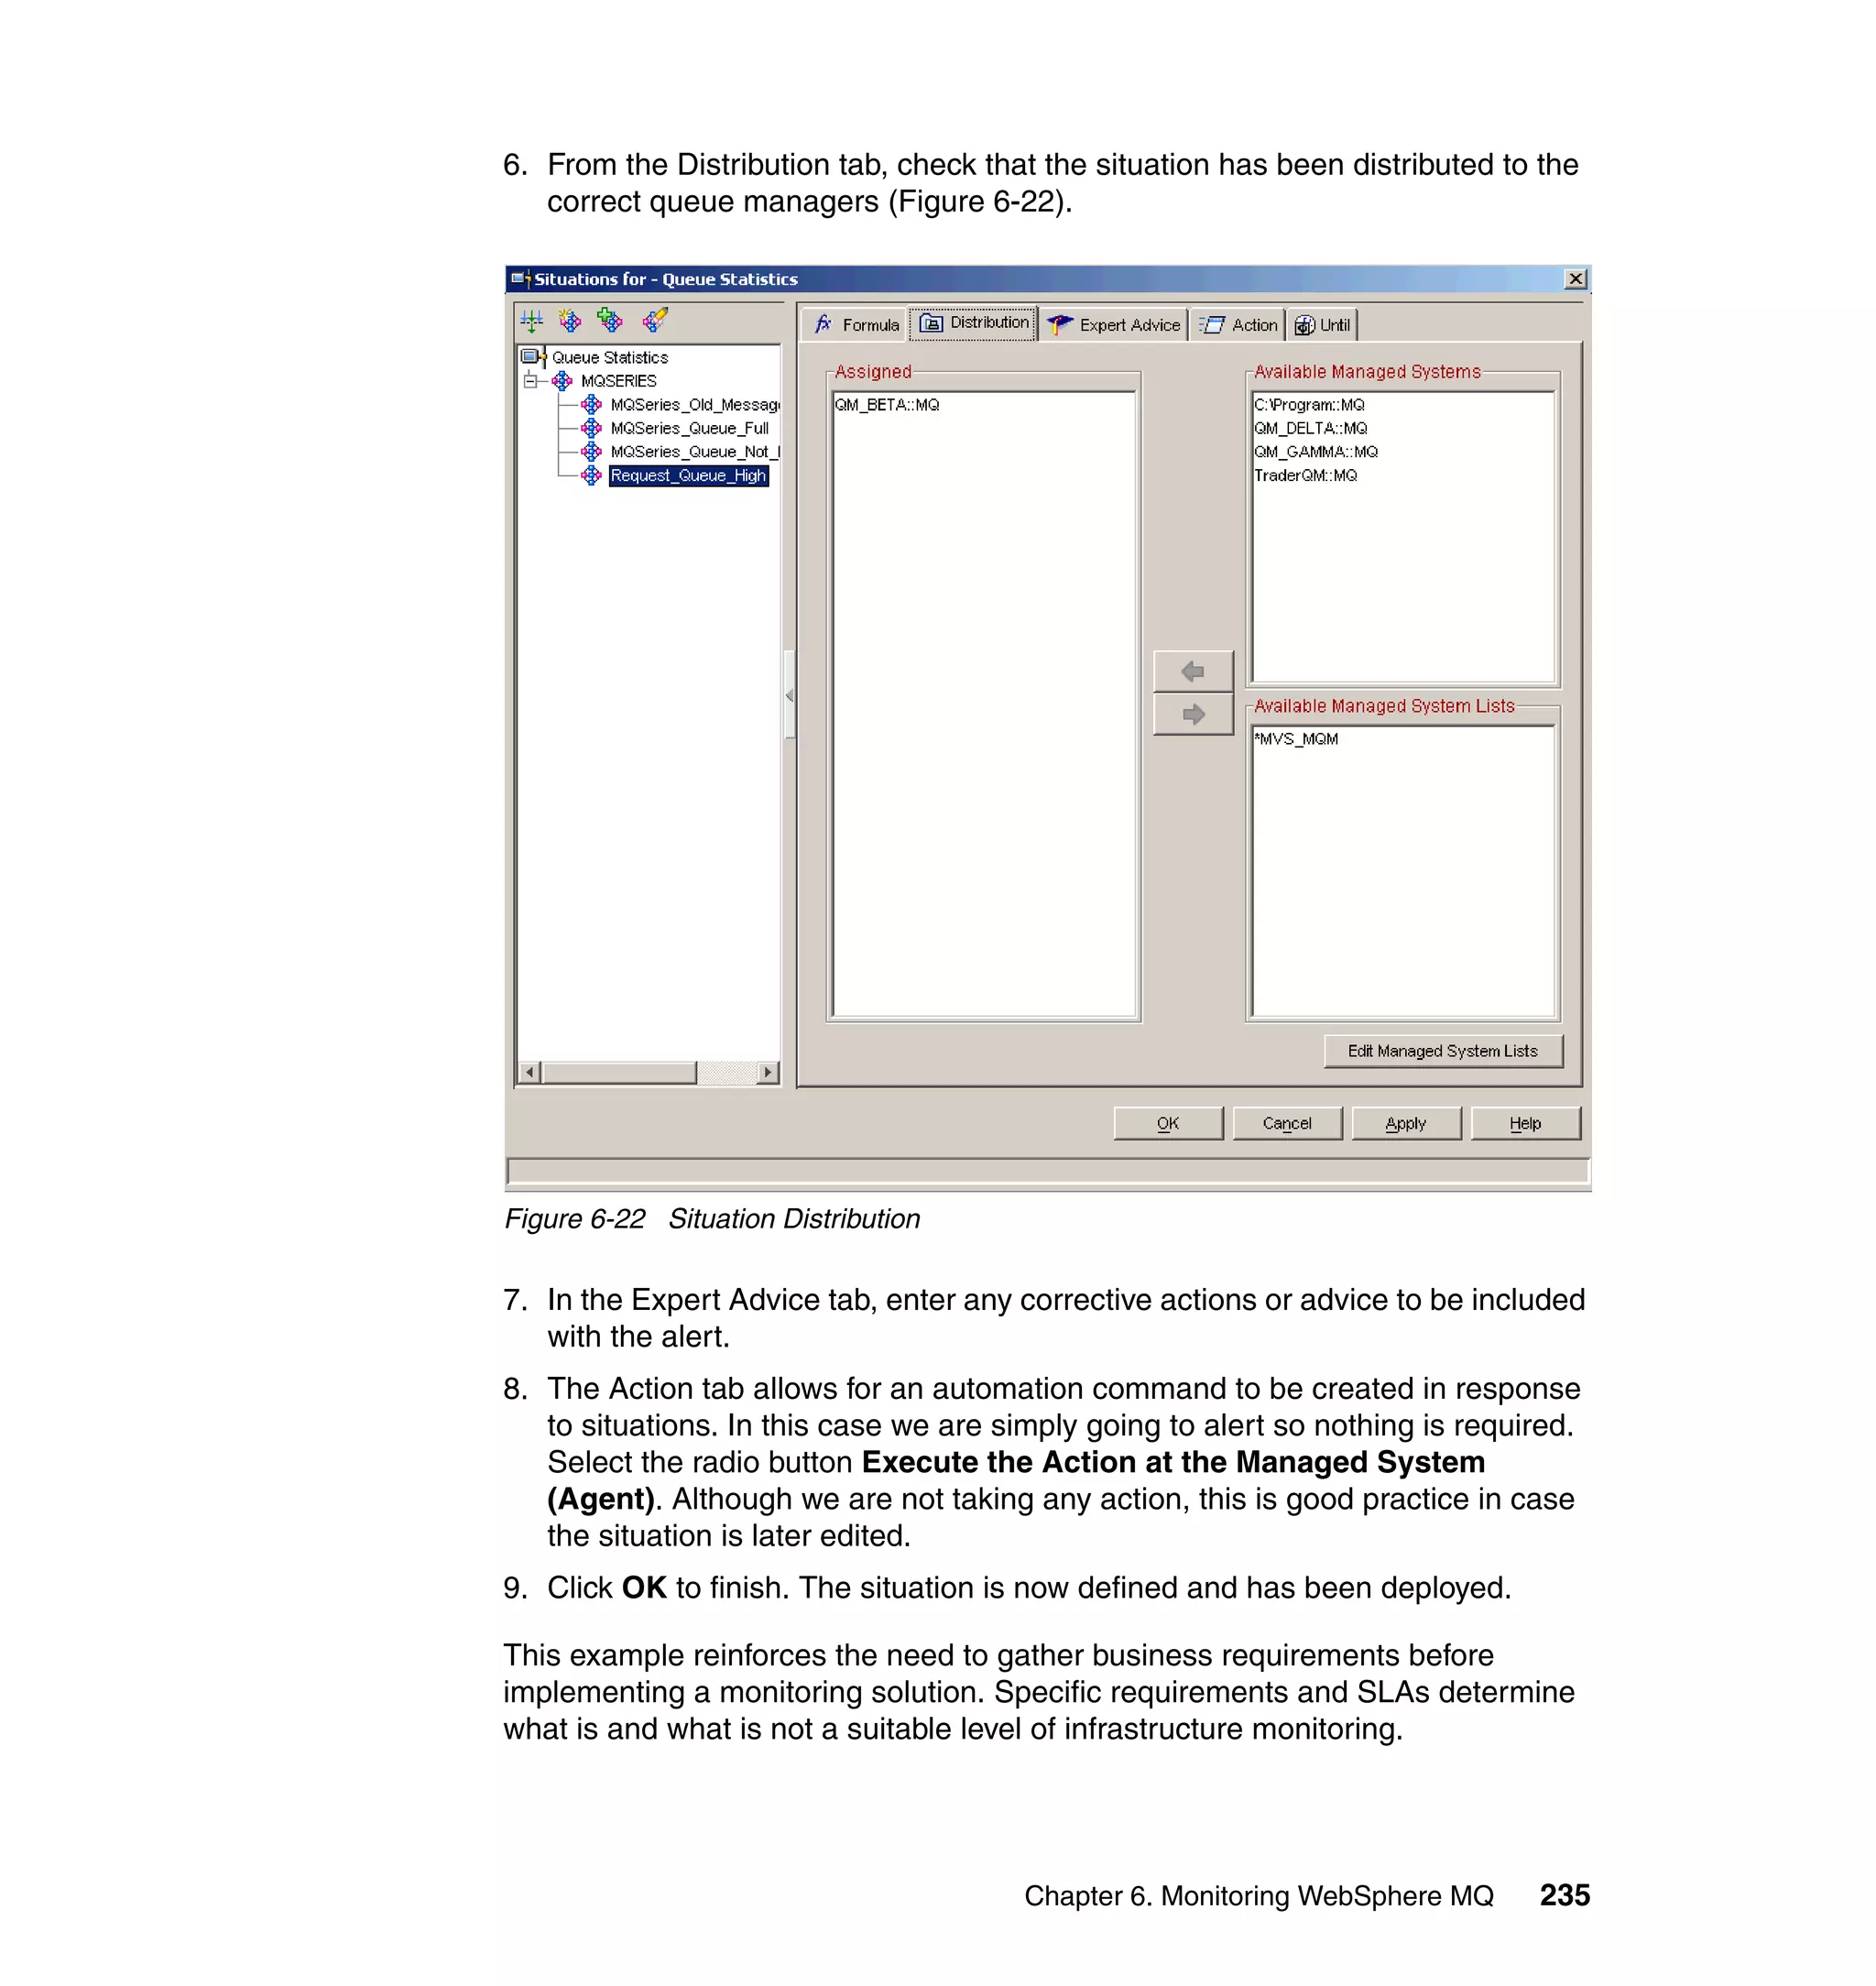
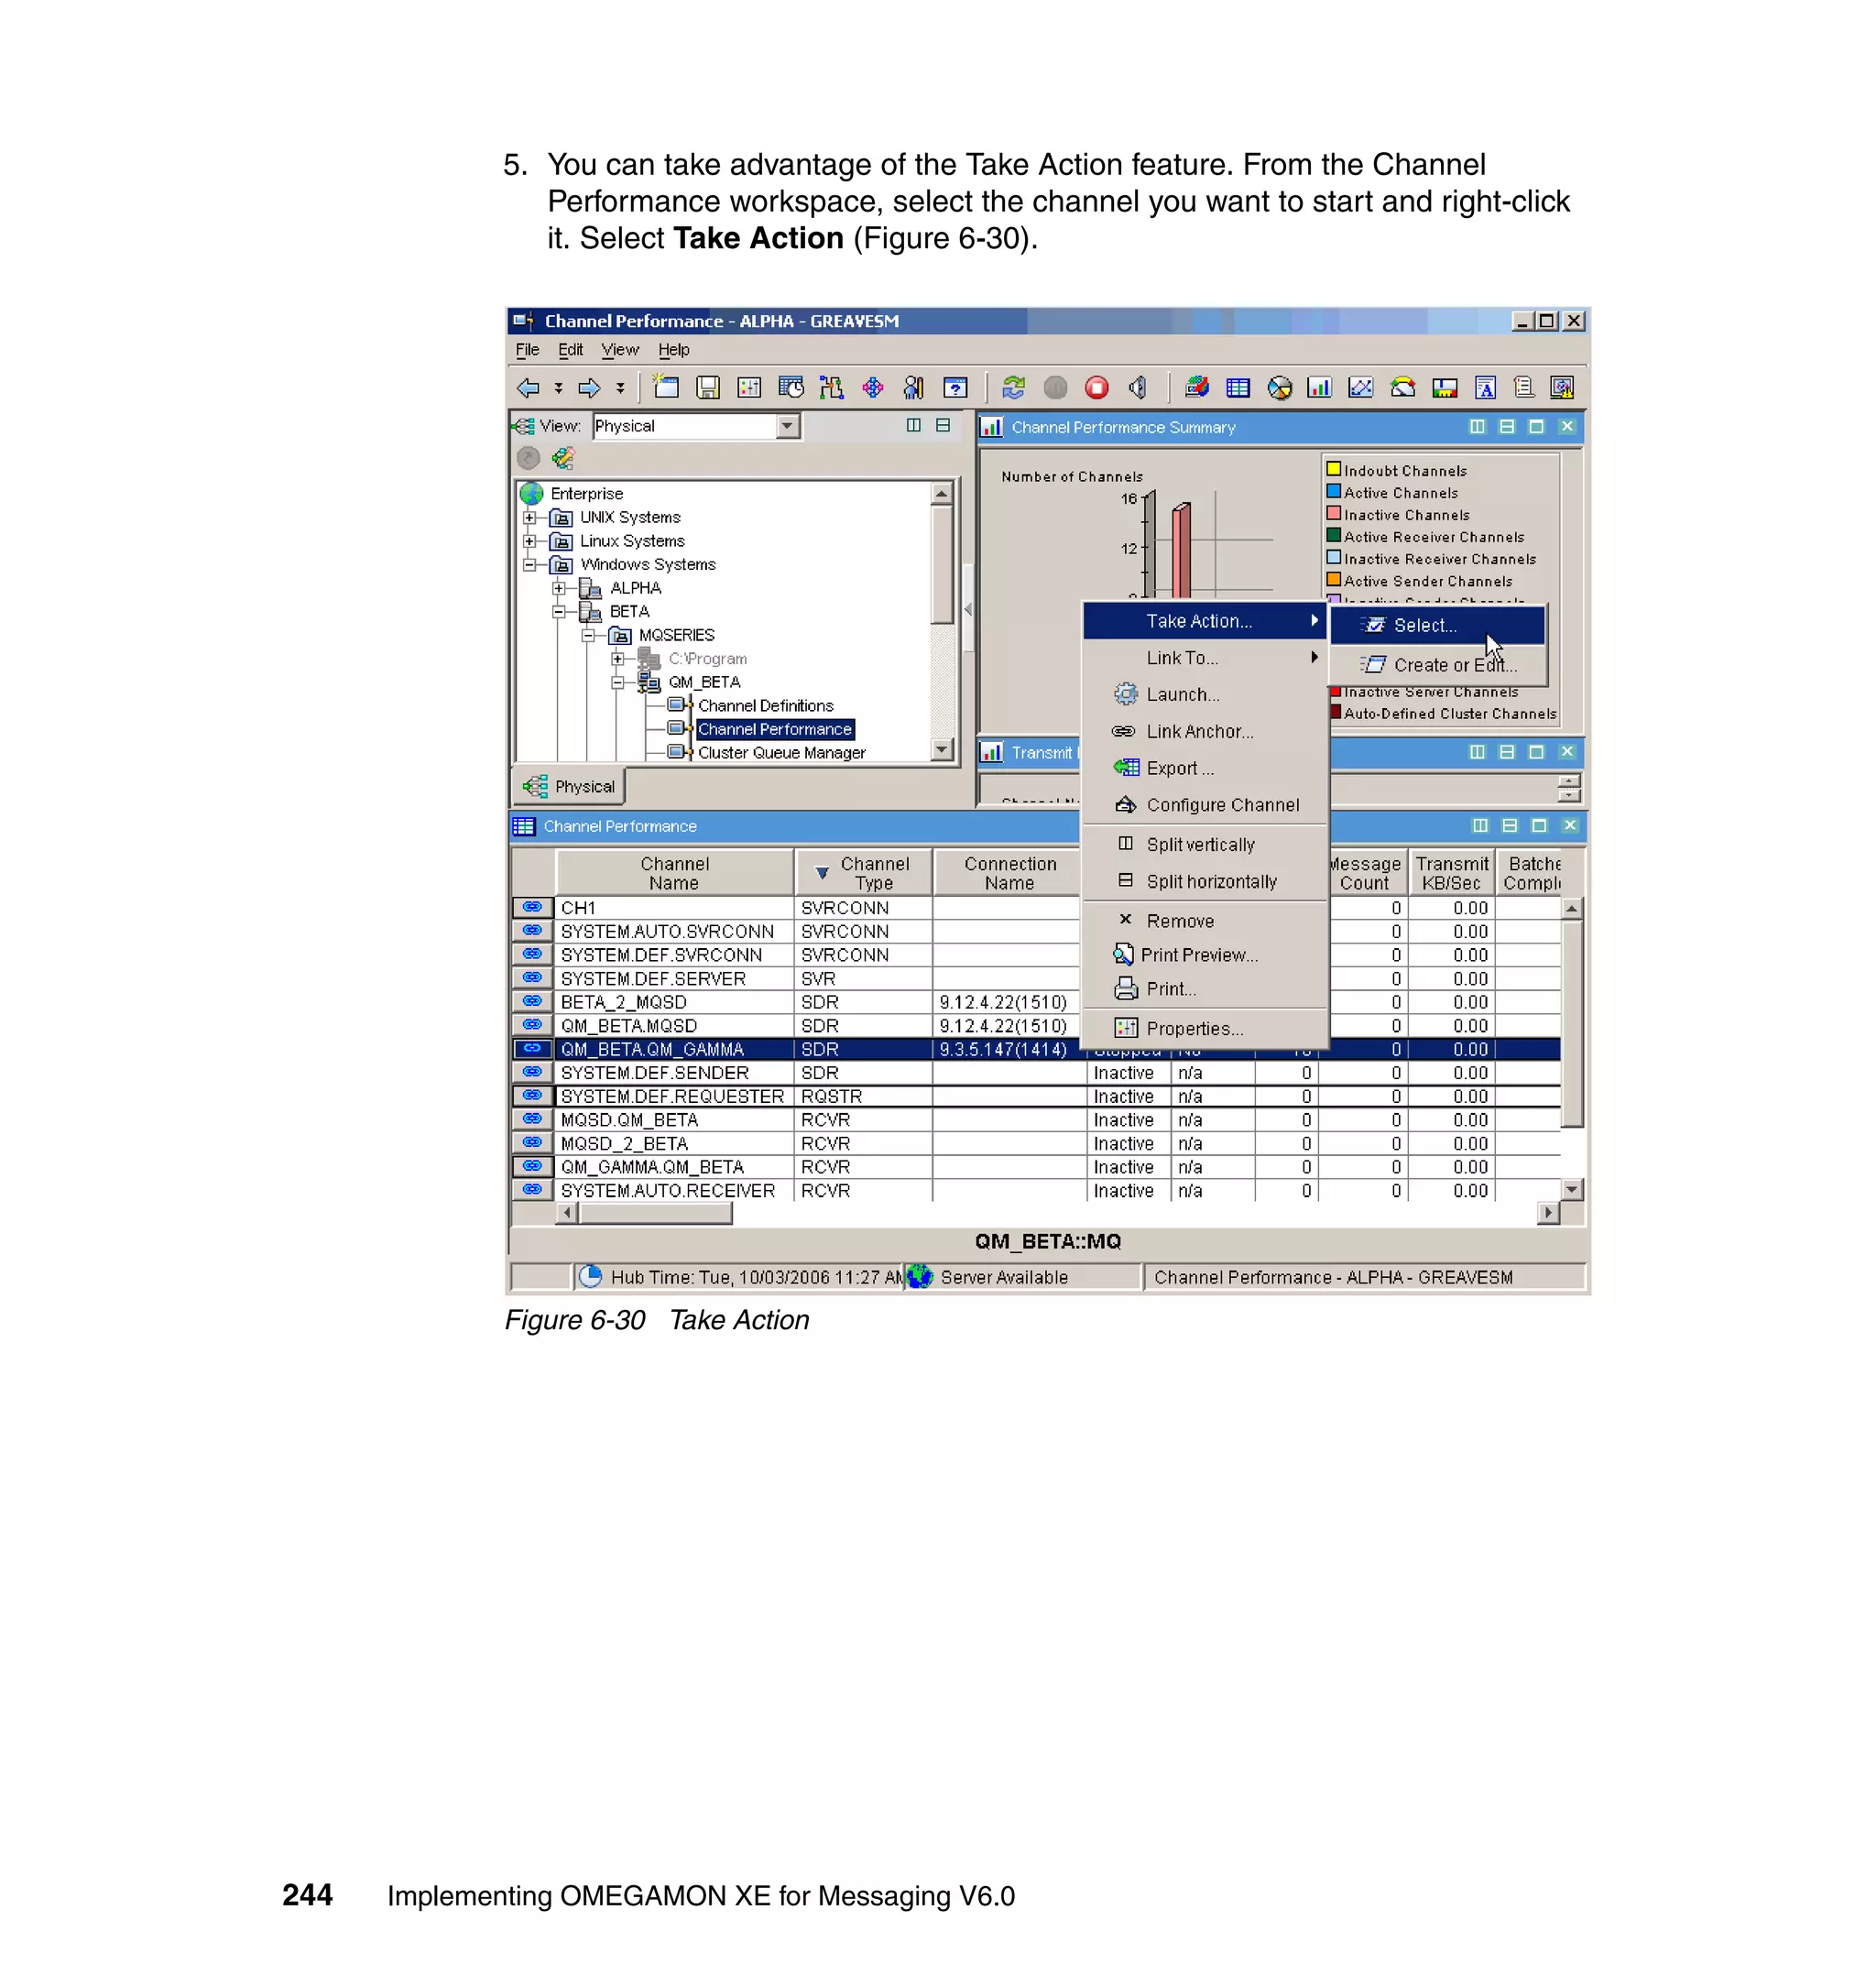
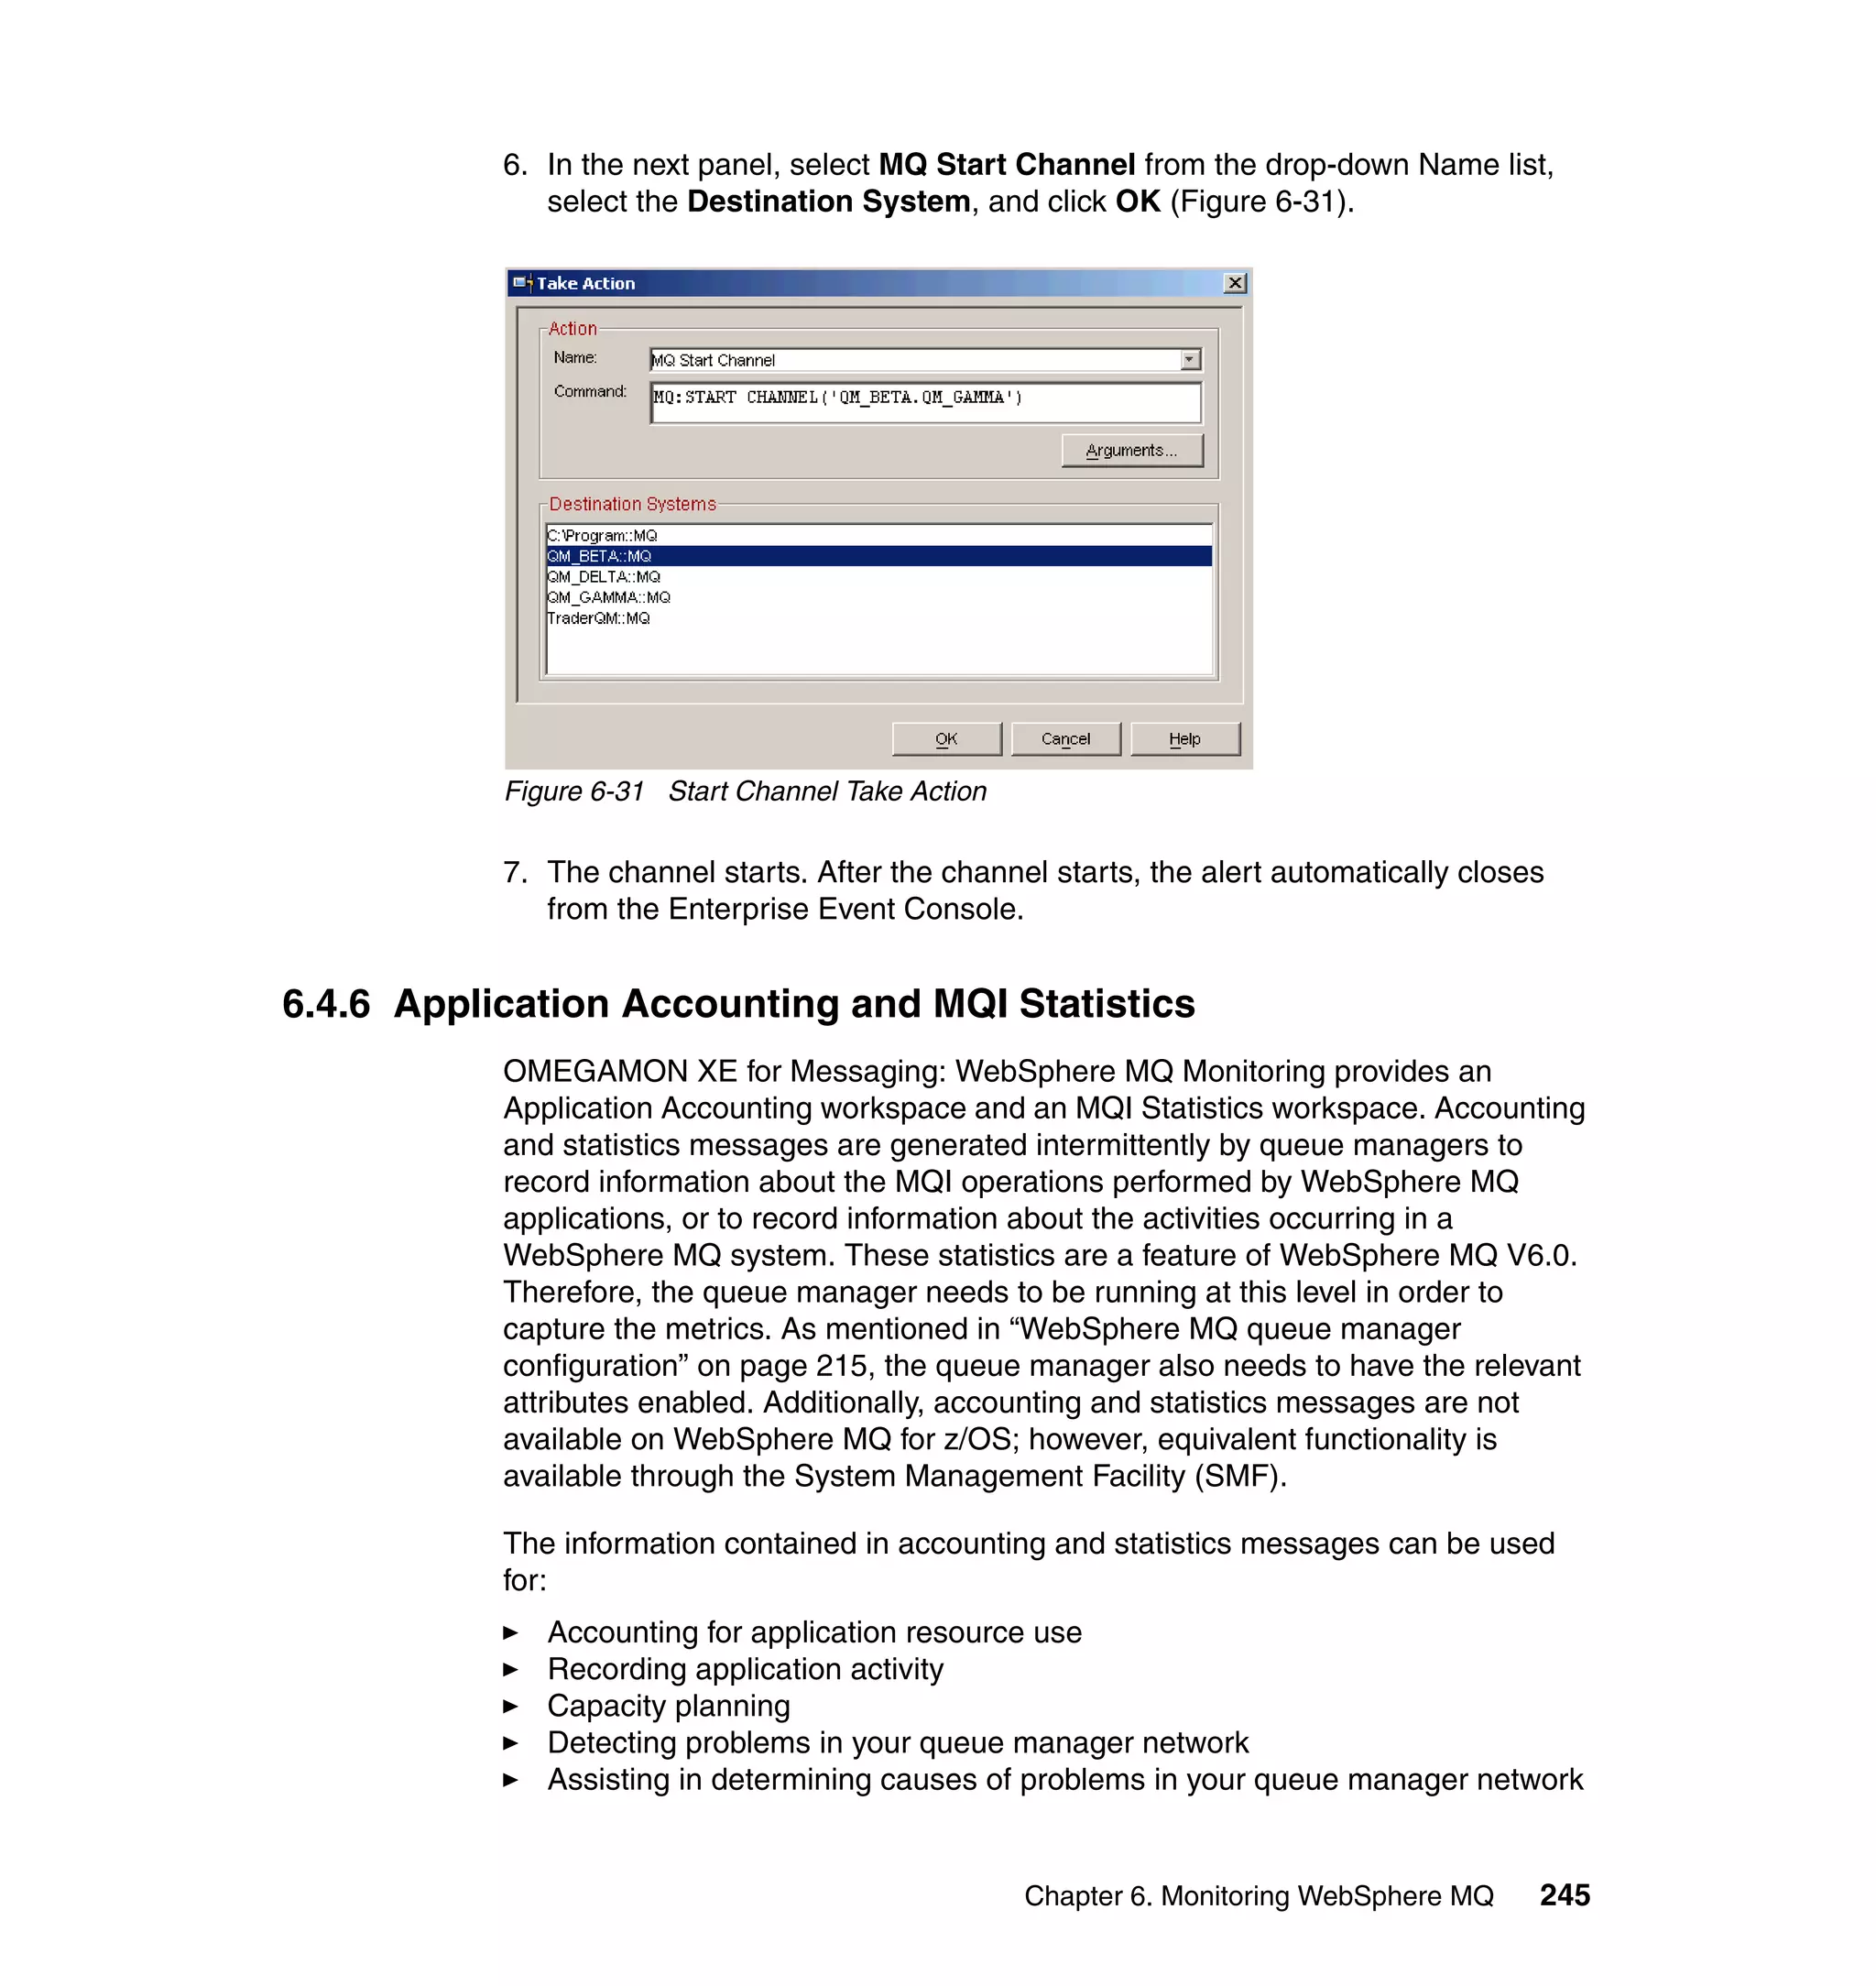
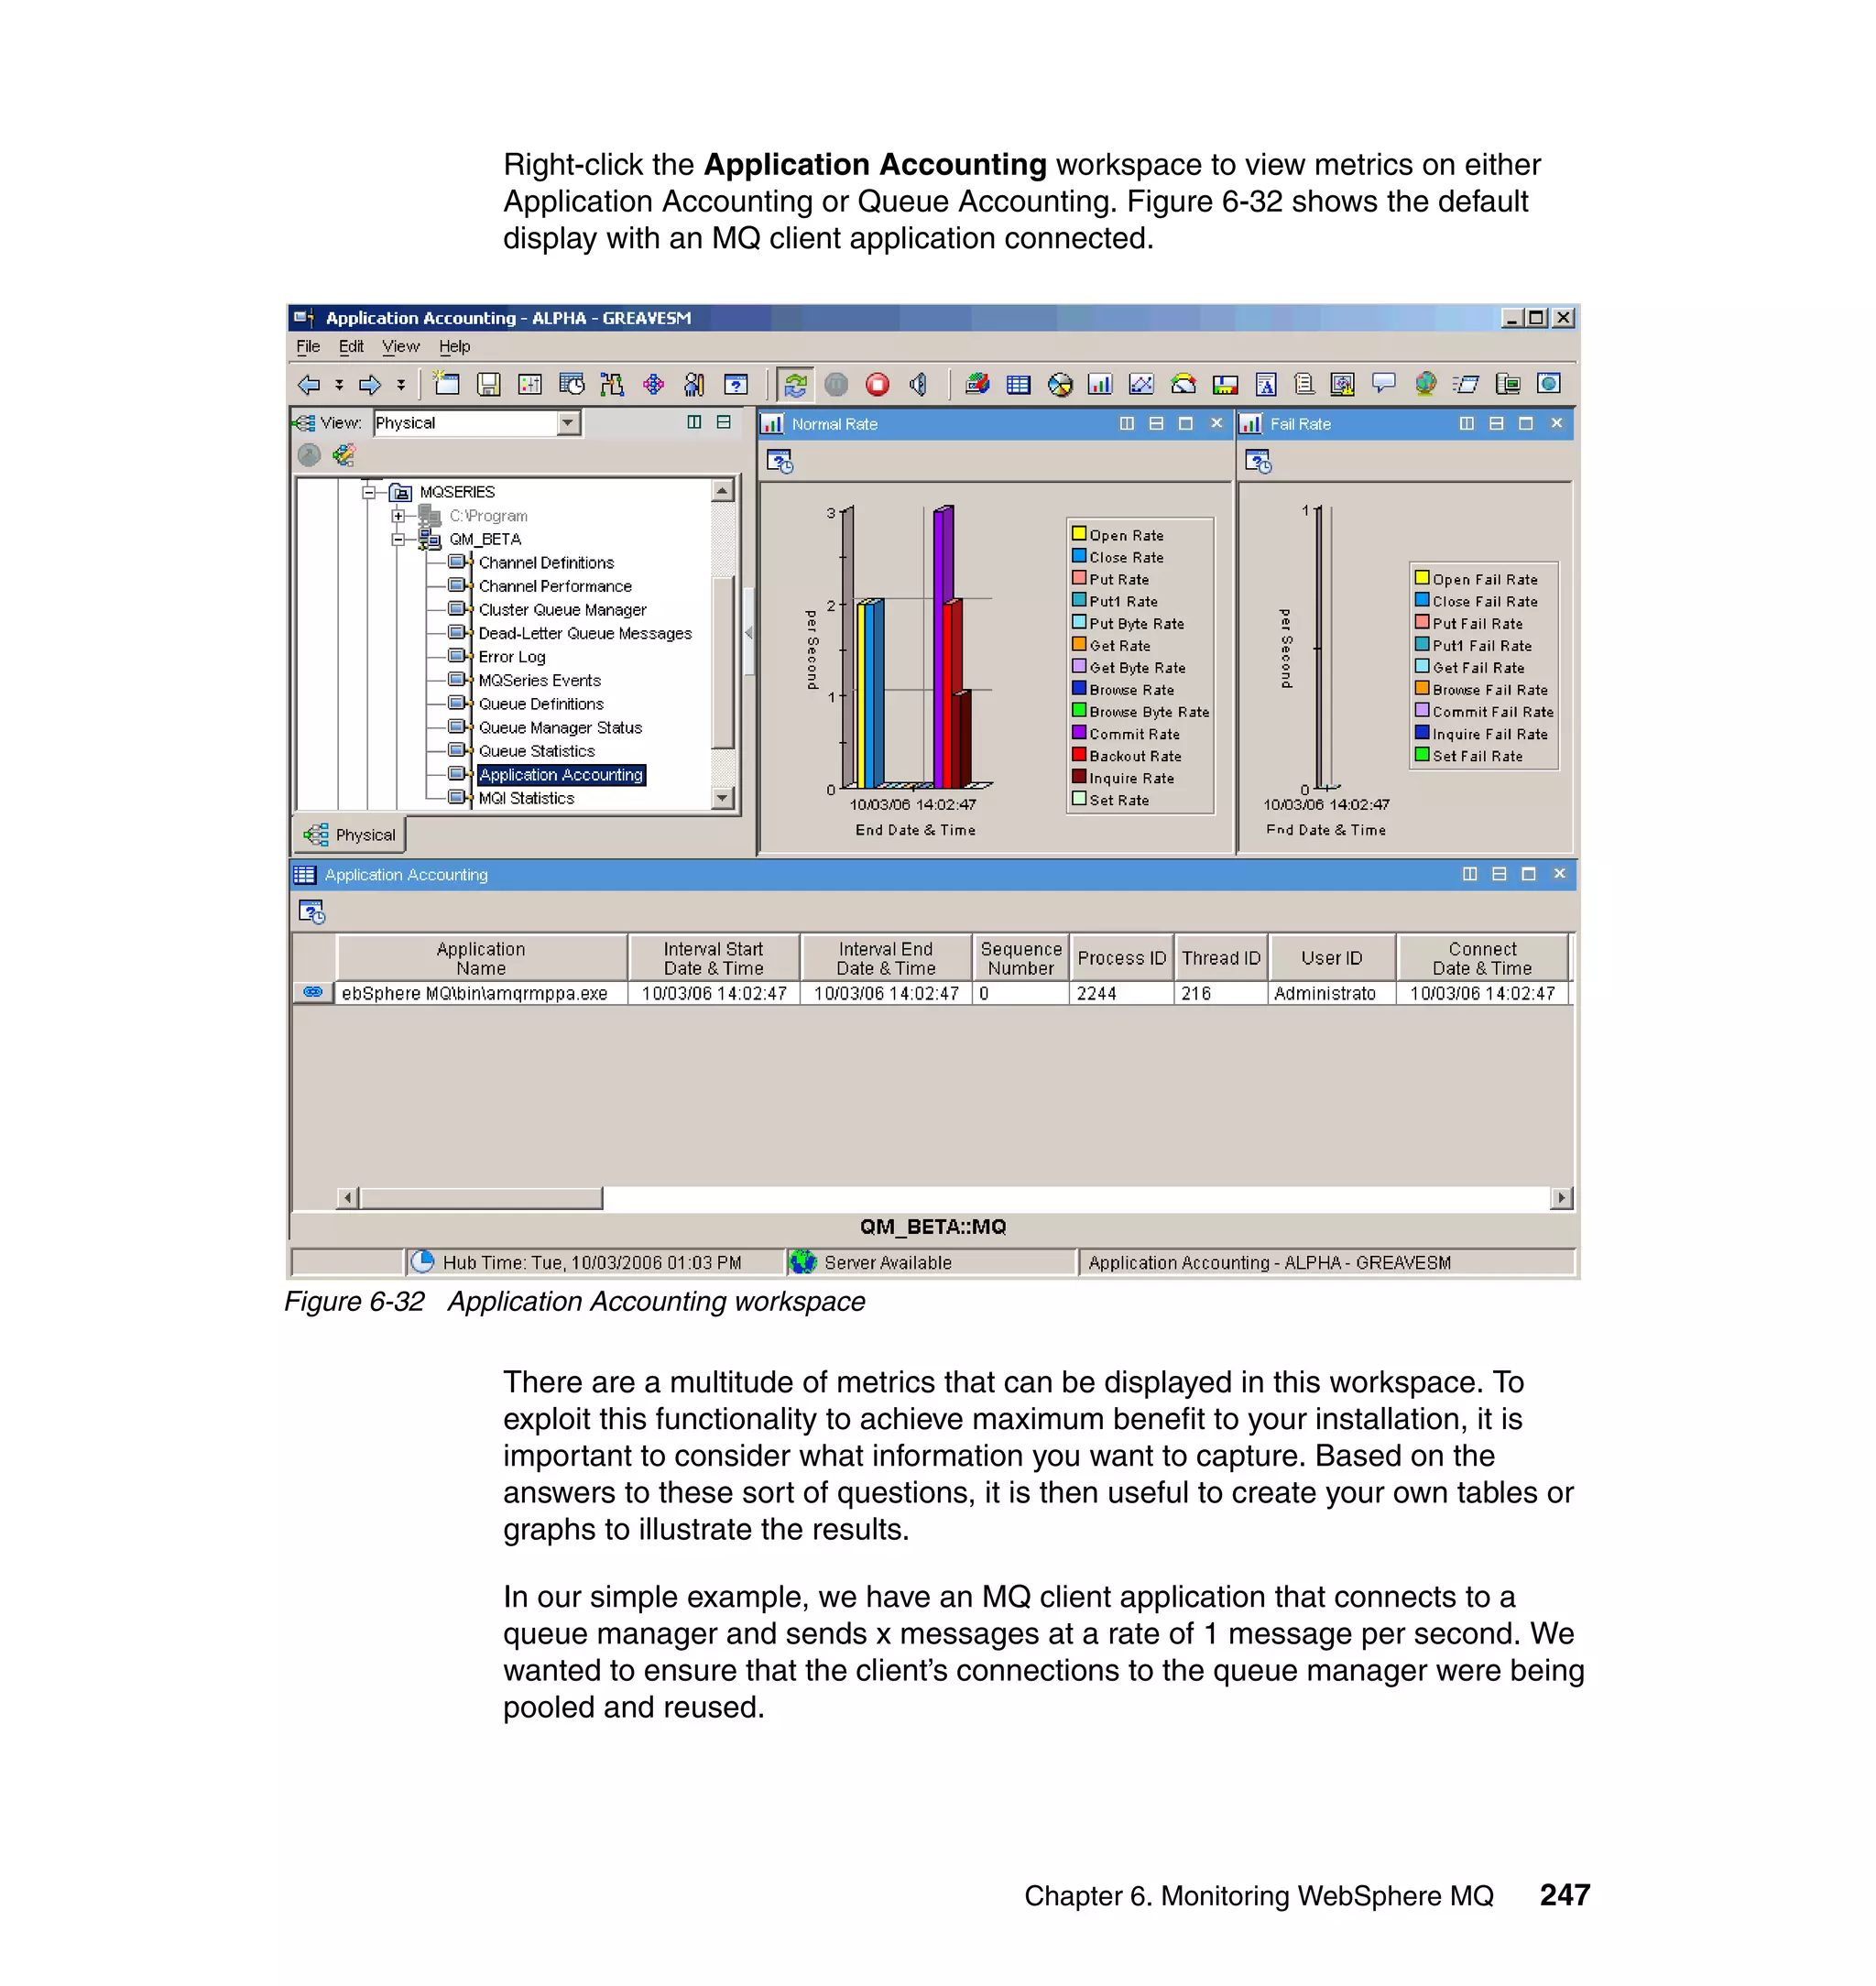
This document provides an overview of implementing OMEGAMON XE for Messaging V6.0: - It discusses WebSphere MQ, WebSphere Message Broker, and WebSphere InterChange Server as messaging middleware. - It describes the architecture and deployment scenarios of OMEGAMON XE. - It covers installing the OMEGAMON infrastructure including the Tivoli Enterprise Monitoring and Portal Servers. - It explains how to install and configure WebSphere MQ agents on z/OS, UNIX/Linux, and Windows. - It demonstrates using OMEGAMON XE to configure WebSphere MQ resources through its WebSphere MQ Configuration feature.


![Vibe Coding vs. Spec-Driven Development [Free Meetup]](https://cdn.slidesharecdn.com/ss_thumbnails/vibecodingvsspecdrivendevelopment-251209105622-43f455e7-thumbnail.jpg?width=640&height=640&fit=bounds)


