Downloaded 78 times

![Documentation Conventions
Documentation Conventions
Overview
This guide uses several conventions for special terms and actions, and operating
system-dependent commands and paths.
Panels and figures
The panels and figures in this document are representations. Actual product panels may
differ.
Required blanks
The slashed-b (!) character in examples represents a required blank. The following
example illustrates the location of two required blanks.
!eBA*ServiceMonitor!0990221161551000
!
Revision bars
Revision bars (|) may appear in the left margin to identify new or updated material.
Variables and literals
In examples of z/OS® command syntax, uppercase letters are actual values (literals) that
the user should type; lowercase letters are used for variables that represent data supplied
by the user. Default values are underscored.
LOGON APPLID (cccccccc)
In the above example, you type LOGON APPLID followed by an application identifier
(represented by cccccccc) within parentheses.
Symbols
The following symbols may appear in command syntax:
Table 1. Symbols in Command Syntax
Symbol Usage
| The “or” symbol is used to denote a choice. Either the argument on the left or
the argument on the right may be used. Example:
YES | NO
In this example, YES or NO may be specified.
[] Denotes optional arguments. Those arguments not enclosed in square brackets
are required. Example:
APPLDEST DEST [ALTDEST]
In this example, DEST is a required argument and ALTDEST is optional.
Preface 11](https://image.slidesharecdn.com/ibmtivoliomegamonxeforwebspheremq-usingibmtivoliomegamonxeforwebspheremqmonitoring-120524030104-phpapp01/75/Ibm-tivoli-omegamon-xe-for-web-sphere-mq-using-ibm-tivoli-omegamon-xe-for-websphere-mq-monitoring-11-2048.jpg)
![Documentation Conventions
Table 1. Symbols in Command Syntax
Symbol Usage
{} Some documents use braces to denote required arguments, or to group
arguments for clarity. Example:
COMPARE {workload} -
REPORT={SUMMARY | HISTOGRAM}
The workload variable is required. The REPORT keyword must be specified
with a value of SUMMARY or HISTOGRAM.
_ Default values are underscored. Example:
COPY infile outfile - [COMPRESS={YES | NO}]
In this example, the COMPRESS keyword is optional. If specified, the only
valid values are YES or NO. If omitted, the default is YES.
12 Using IBM Tivoli OMEGAMON XE for WebSphere MQ Monitoring, V3.7.0](https://image.slidesharecdn.com/ibmtivoliomegamonxeforwebspheremq-usingibmtivoliomegamonxeforwebspheremqmonitoring-120524030104-phpapp01/75/Ibm-tivoli-omegamon-xe-for-web-sphere-mq-using-ibm-tivoli-omegamon-xe-for-websphere-mq-monitoring-12-2048.jpg)


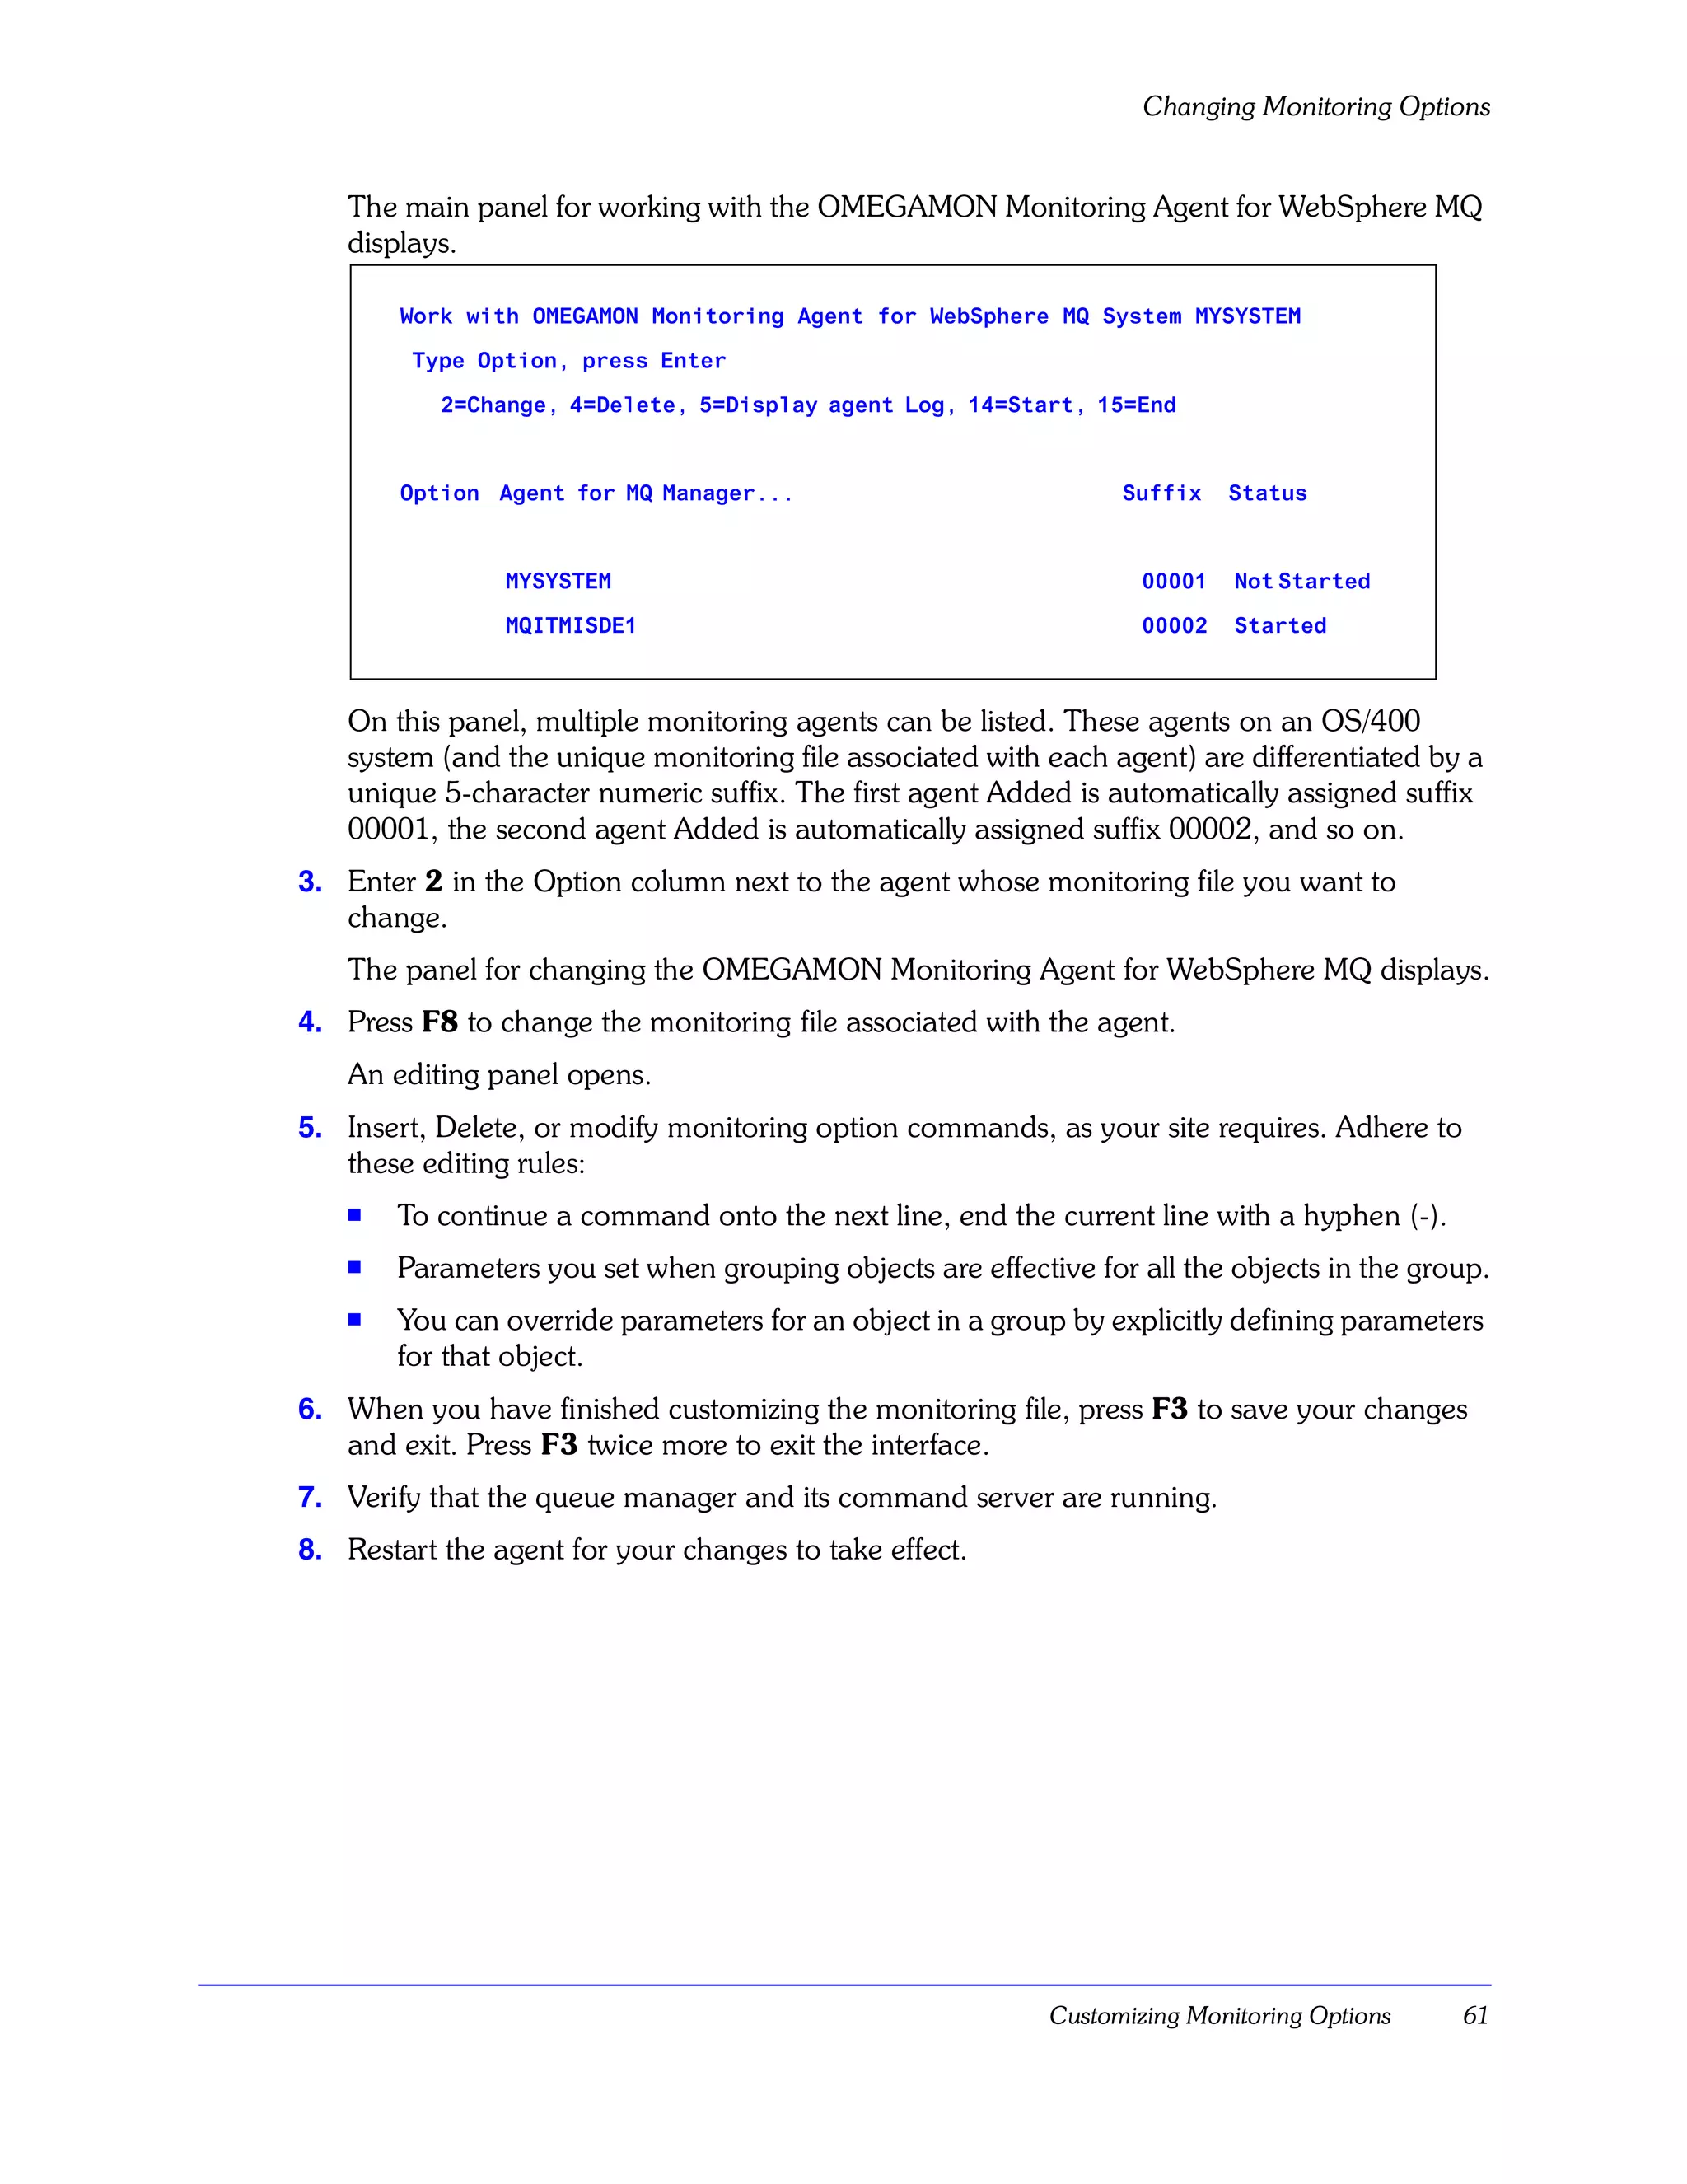
![Monitoring Options
Create a queue manager group: SET GROUP
Description
The SET GROUP command defines a group of queue managers that have common
monitoring characteristics. Within the group, you can override like-named parameters for
specific queue managers using the SET MANAGER command.
At least one SET GROUP command is required.
Syntax
SET GROUP NAME(group-name)
[DEFAULT(YES|NO)]
[AGGRHIST(aggregation-samples)]
[COMMAND(YES|NO)]
[ERRLOGCYCLE(sampling-interval)]
[ERRLOGMAX(max-messages-in-memory)]
[EVENTS(REMOVE|BROWSE|NO)]
[HLQ(high-level-qualifier)]
[ICYCLE(interval-cycle )]
[LIKE(like-group-name)]
[MSGACCESS(NONE|DESC|RETRY|DATA|DELETE)]
[RETAINHIST(historical-retention-value)]
[RQMODEL(reply-to-queue’s-model-queue)]
Parameters
NAME(group-name)
1–48 character group name. Subsequent commands refer to the group and its
parameter settings by this name. This parameter is required.
DEFAULT(YES|NO)
Specifies whether or not this is the default group. If YES, the settings on this
command apply to any SET MANAGER statement that omits the GROUP parameter.
The IBM-provided default group is named DEFAULT.
AGGRHIST(aggregation-samples)
Number of samples to maintain in recent history for all queue managers in this group.
The default value is 15.
COMMAND(YES|NO)
Controls the MQ Command feature. For more details, see the same parameter in
“Specify queue managers: SET MANAGER” on page 31.
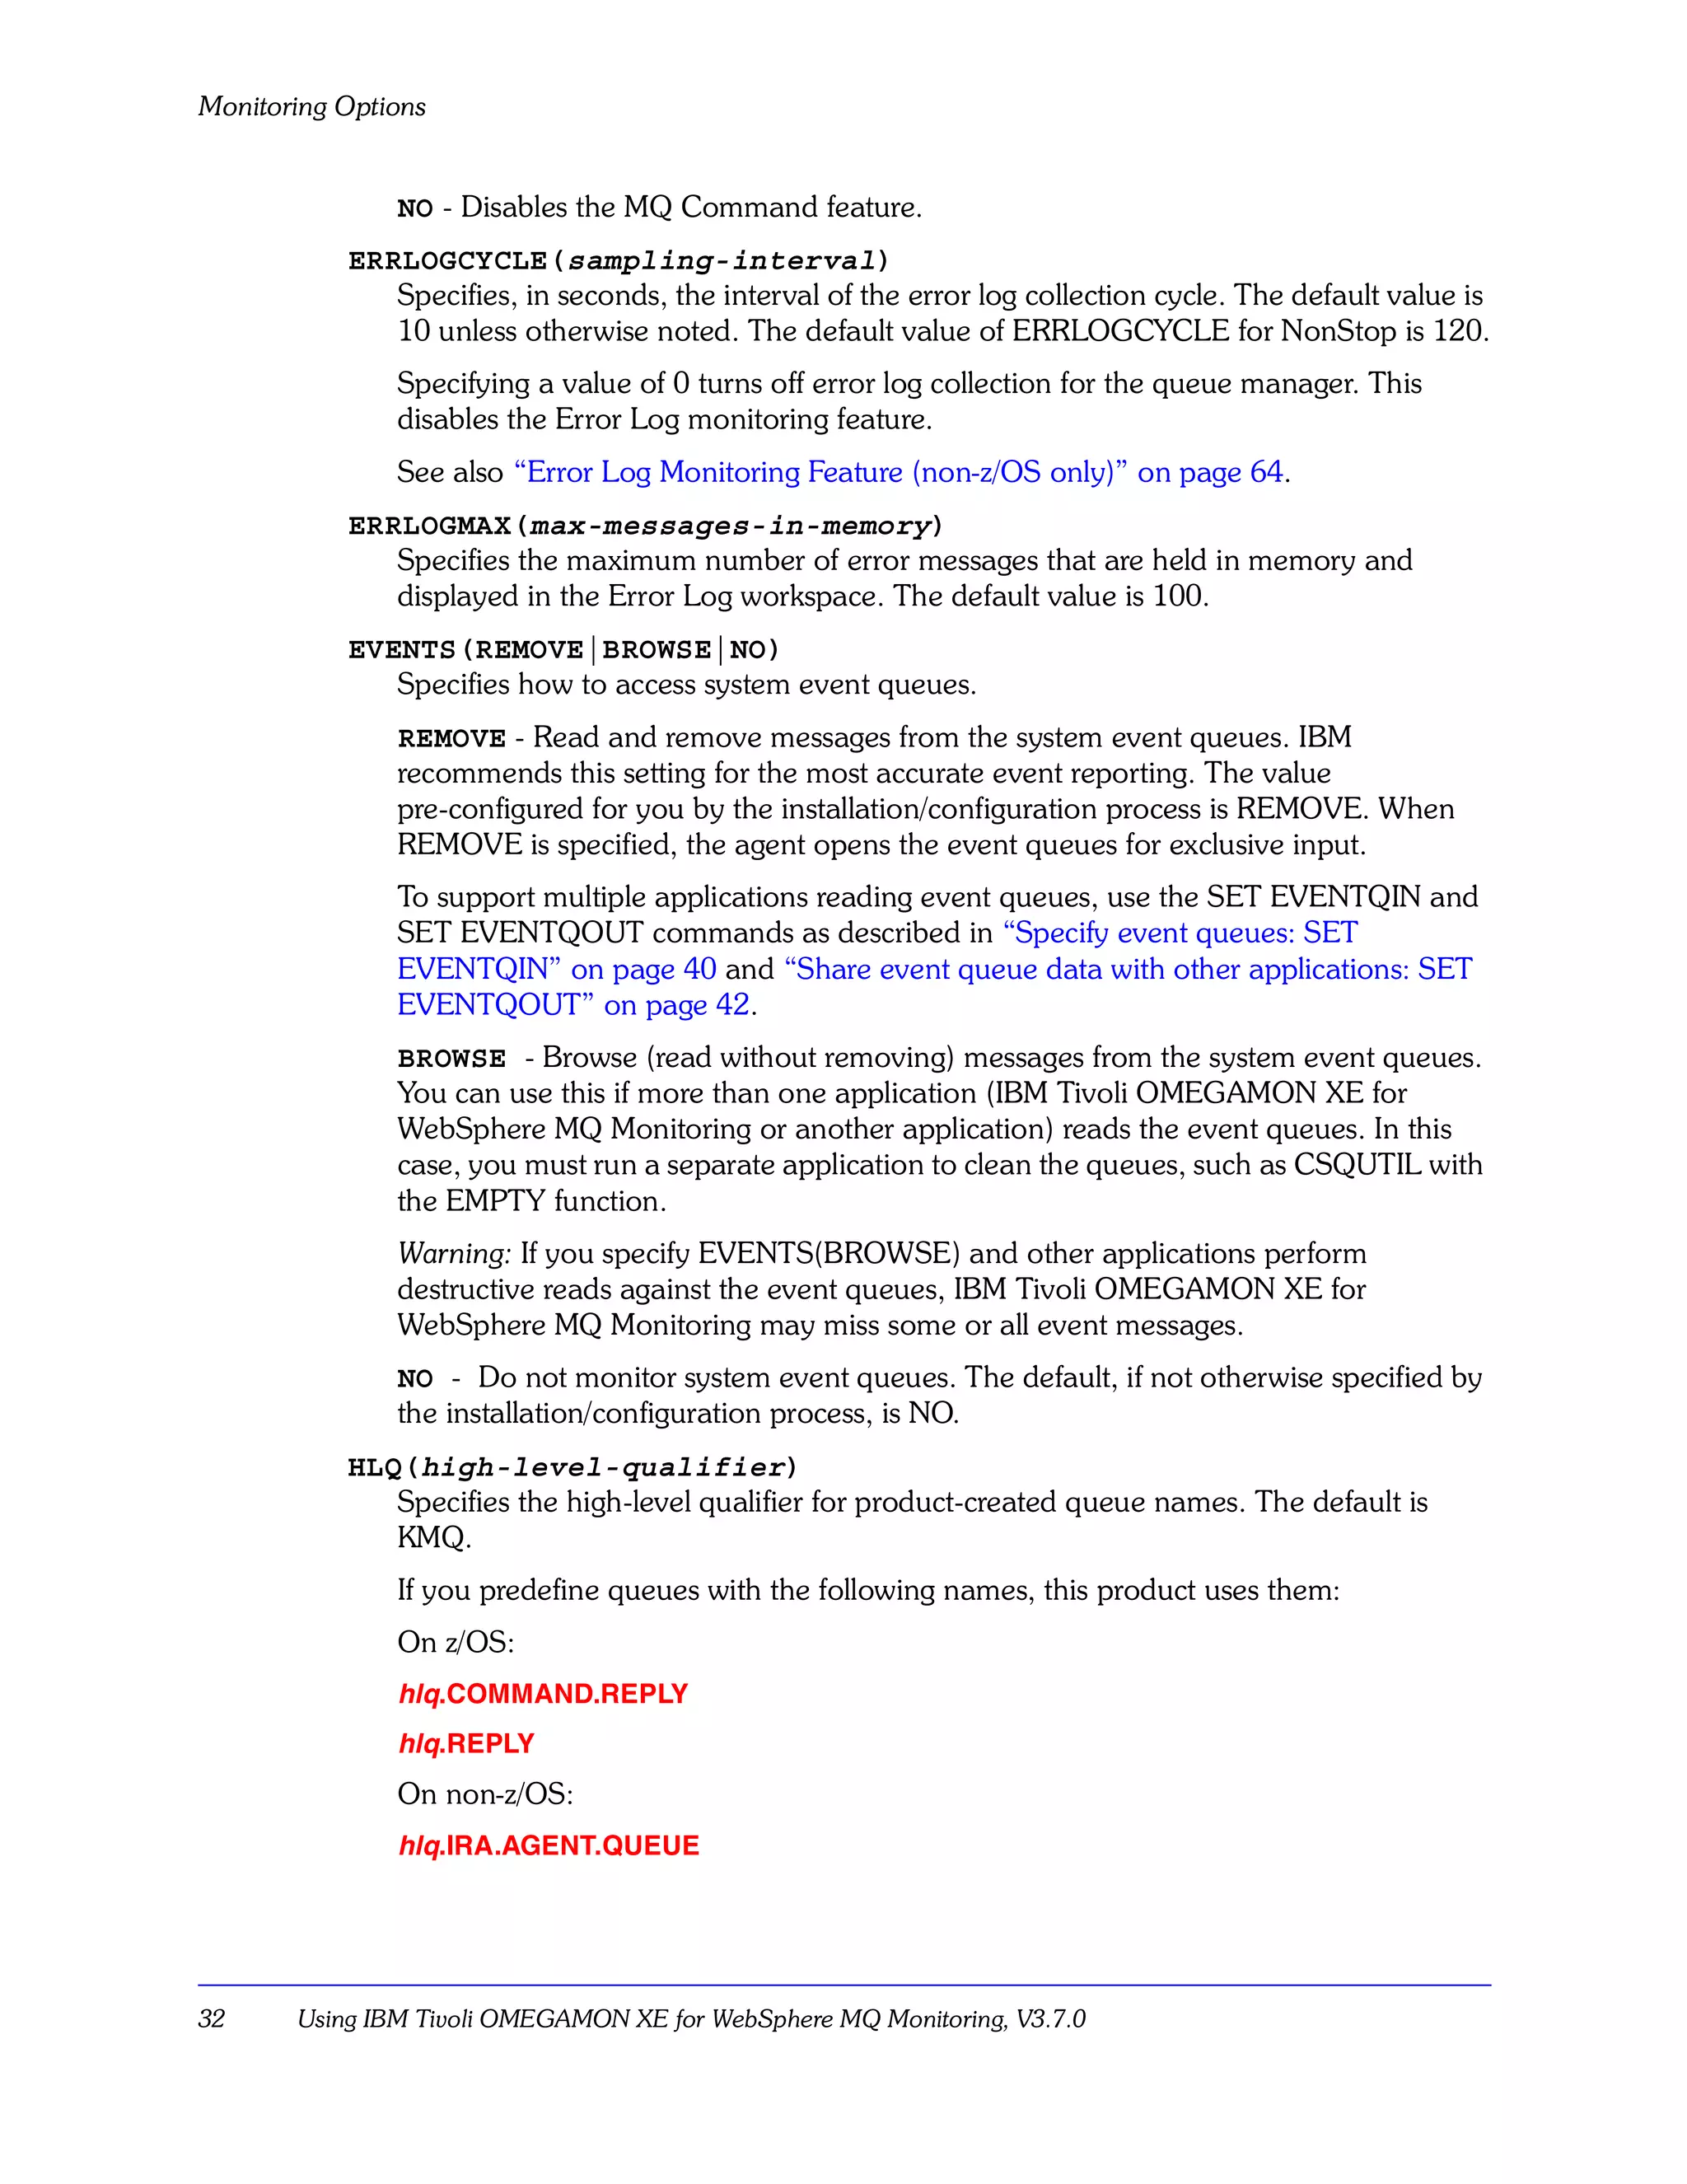
ERRLOGCYCLE(sampling-interval)
Specifies, in seconds, the interval of the error log collection cycle. For more details,
see the same parameter in “Specify queue managers: SET MANAGER” on page 31.
ERRLOGMAX(max-messages-in-memory)
Specifies the maximum number of error messages that are held in memory and
displayed in the Error Log workspace. For more details, see the same parameter in
“Specify queue managers: SET MANAGER” on page 31.
Customizing Monitoring Options 29](https://image.slidesharecdn.com/ibmtivoliomegamonxeforwebspheremq-usingibmtivoliomegamonxeforwebspheremqmonitoring-120524030104-phpapp01/75/Ibm-tivoli-omegamon-xe-for-web-sphere-mq-using-ibm-tivoli-omegamon-xe-for-websphere-mq-monitoring-29-2048.jpg)
![Monitoring Options
Specify queue managers: SET MANAGER
Description
The SET MANAGER command specifies queue managers to be monitored.
Syntax
SET MANAGER NAME(manager-name-mask)
[GROUP(group-name)]
[ACTIVE(YES|NO)]
[AGGRHIST(aggregation-samples)]
[COMMAND(YES|NO)]
[ERRLOGCYCLE(sampling-interval)]
[ERRLOGMAX(max-messages-in-memory)]
[EVENTS(REMOVE|BROWSE|NO)]
[HLQ(high-level-qualifier)]
[ICYCLE(interval-cycle )]
[LIKE(like-manager-name)]
[MSGACCESS(NONE|DESC|RETRY|DATA|DELETE)]
[NICKNAME(nickname)]
[RETAINHIST(historical-retention-value)]
[RQMODEL(reply-to-queue’s-model-queue)]
[STATUS(ADD|DELETE|RESET)]
[SYSNAME(z/OS-system-id)]
Parameters
NAME(manager-name-mask)
On z/OS, this is the 1–4 character specific or generic queue manager name to
monitor. To specify a generic name, enter a character string followed by an asterisk
(*). For example, to monitor all z/OS queue managers, specify NAME(*). This
parameter is required on z/OS.
On distributed platforms, this parameter can be (), in which case the default queue
manager is monitored, or is the name of the one queue manager this invocation of
the monitoring agent is to monitor.
GROUP(group-name)
Previously defined group whose parameters apply to this queue manager. The name
must exactly match the name specified on a prior SET GROUP statement. The
IBM-provided default group is named DEFAULT.
ACTIVE(YES|NO)
Indicates whether or not to actively monitor this queue manager. YES is the default.
AGGRHIST(aggregation-samples)
Number of samples to maintain in recent history for this queue manager.
COMMAND(YES|NO)
Controls the MQ Command feature, as follows:
YES - Enables the MQ Command feature, which allows the user to pass WebSphere
MQ commands to the queue manager from CandleNet Portal. YES is the default.
Customizing Monitoring Options 31](https://image.slidesharecdn.com/ibmtivoliomegamonxeforwebspheremq-usingibmtivoliomegamonxeforwebspheremqmonitoring-120524030104-phpapp01/75/Ibm-tivoli-omegamon-xe-for-web-sphere-mq-using-ibm-tivoli-omegamon-xe-for-websphere-mq-monitoring-31-2048.jpg)
![Monitoring Options
Specify queues: SET QUEUE
Description
The SET QUEUE command specifies the queues to be monitored. IBM Tivoli
OMEGAMON XE for WebSphere MQ Monitoring always monitors the dead-letter queue.
To monitor other system or application queues, specify them with the SET QUEUE
command.
Syntax
SET QUEUE NAME(queue-name-mask)
MGRNAME(manager-name) | GROUP(group-name)
[QDEFTYPE(PREDEFINED|PERMDYN|TEMPDYN|ALL)]
[STATISTICS(YES|NO)]
[STATUS(ADD|DELETE)]
Parameters
NAME(queue-name-mask)
Defines the 1–48 character specific or generic queue name to monitor. To specify a
generic name, enter a string of characters followed by an asterisk (*). This parameter
is required.
MGRNAME(manager-name)
Associates this SET QUEUE command with a queue manager defined on a previous
SET MANAGER command. You can use the name or nickname of the manager. The
name must exactly match the name specified on the corresponding SET MANAGER
command. This parameter is required if GROUP is not specified.
GROUP(group-name)
Associates this SET QUEUE statement with a group of queue managers defined on a
previous SET GROUP statement. The name must exactly match the name specified
on the corresponding SET GROUP statement. This parameter is required if
MGRNAME is not specified.
QDEFTYPE(PREDEFINED|PERMDYN|TEMPDYN|ALL)
Indicates which kinds of queues to monitor. Specify any or all of these definition
types:
PREDEFINED - Monitors only predefined queues matching the specific or generic
queue name.
PERMDYN - Monitors only permanent dynamic queues matching the specific or
generic queue name.
TEMPDYN - Monitors only temporary dynamic queues matching the specific or
generic queue name.
ALL - Monitors all queues matching the specific or generic queue name. This is the
default.
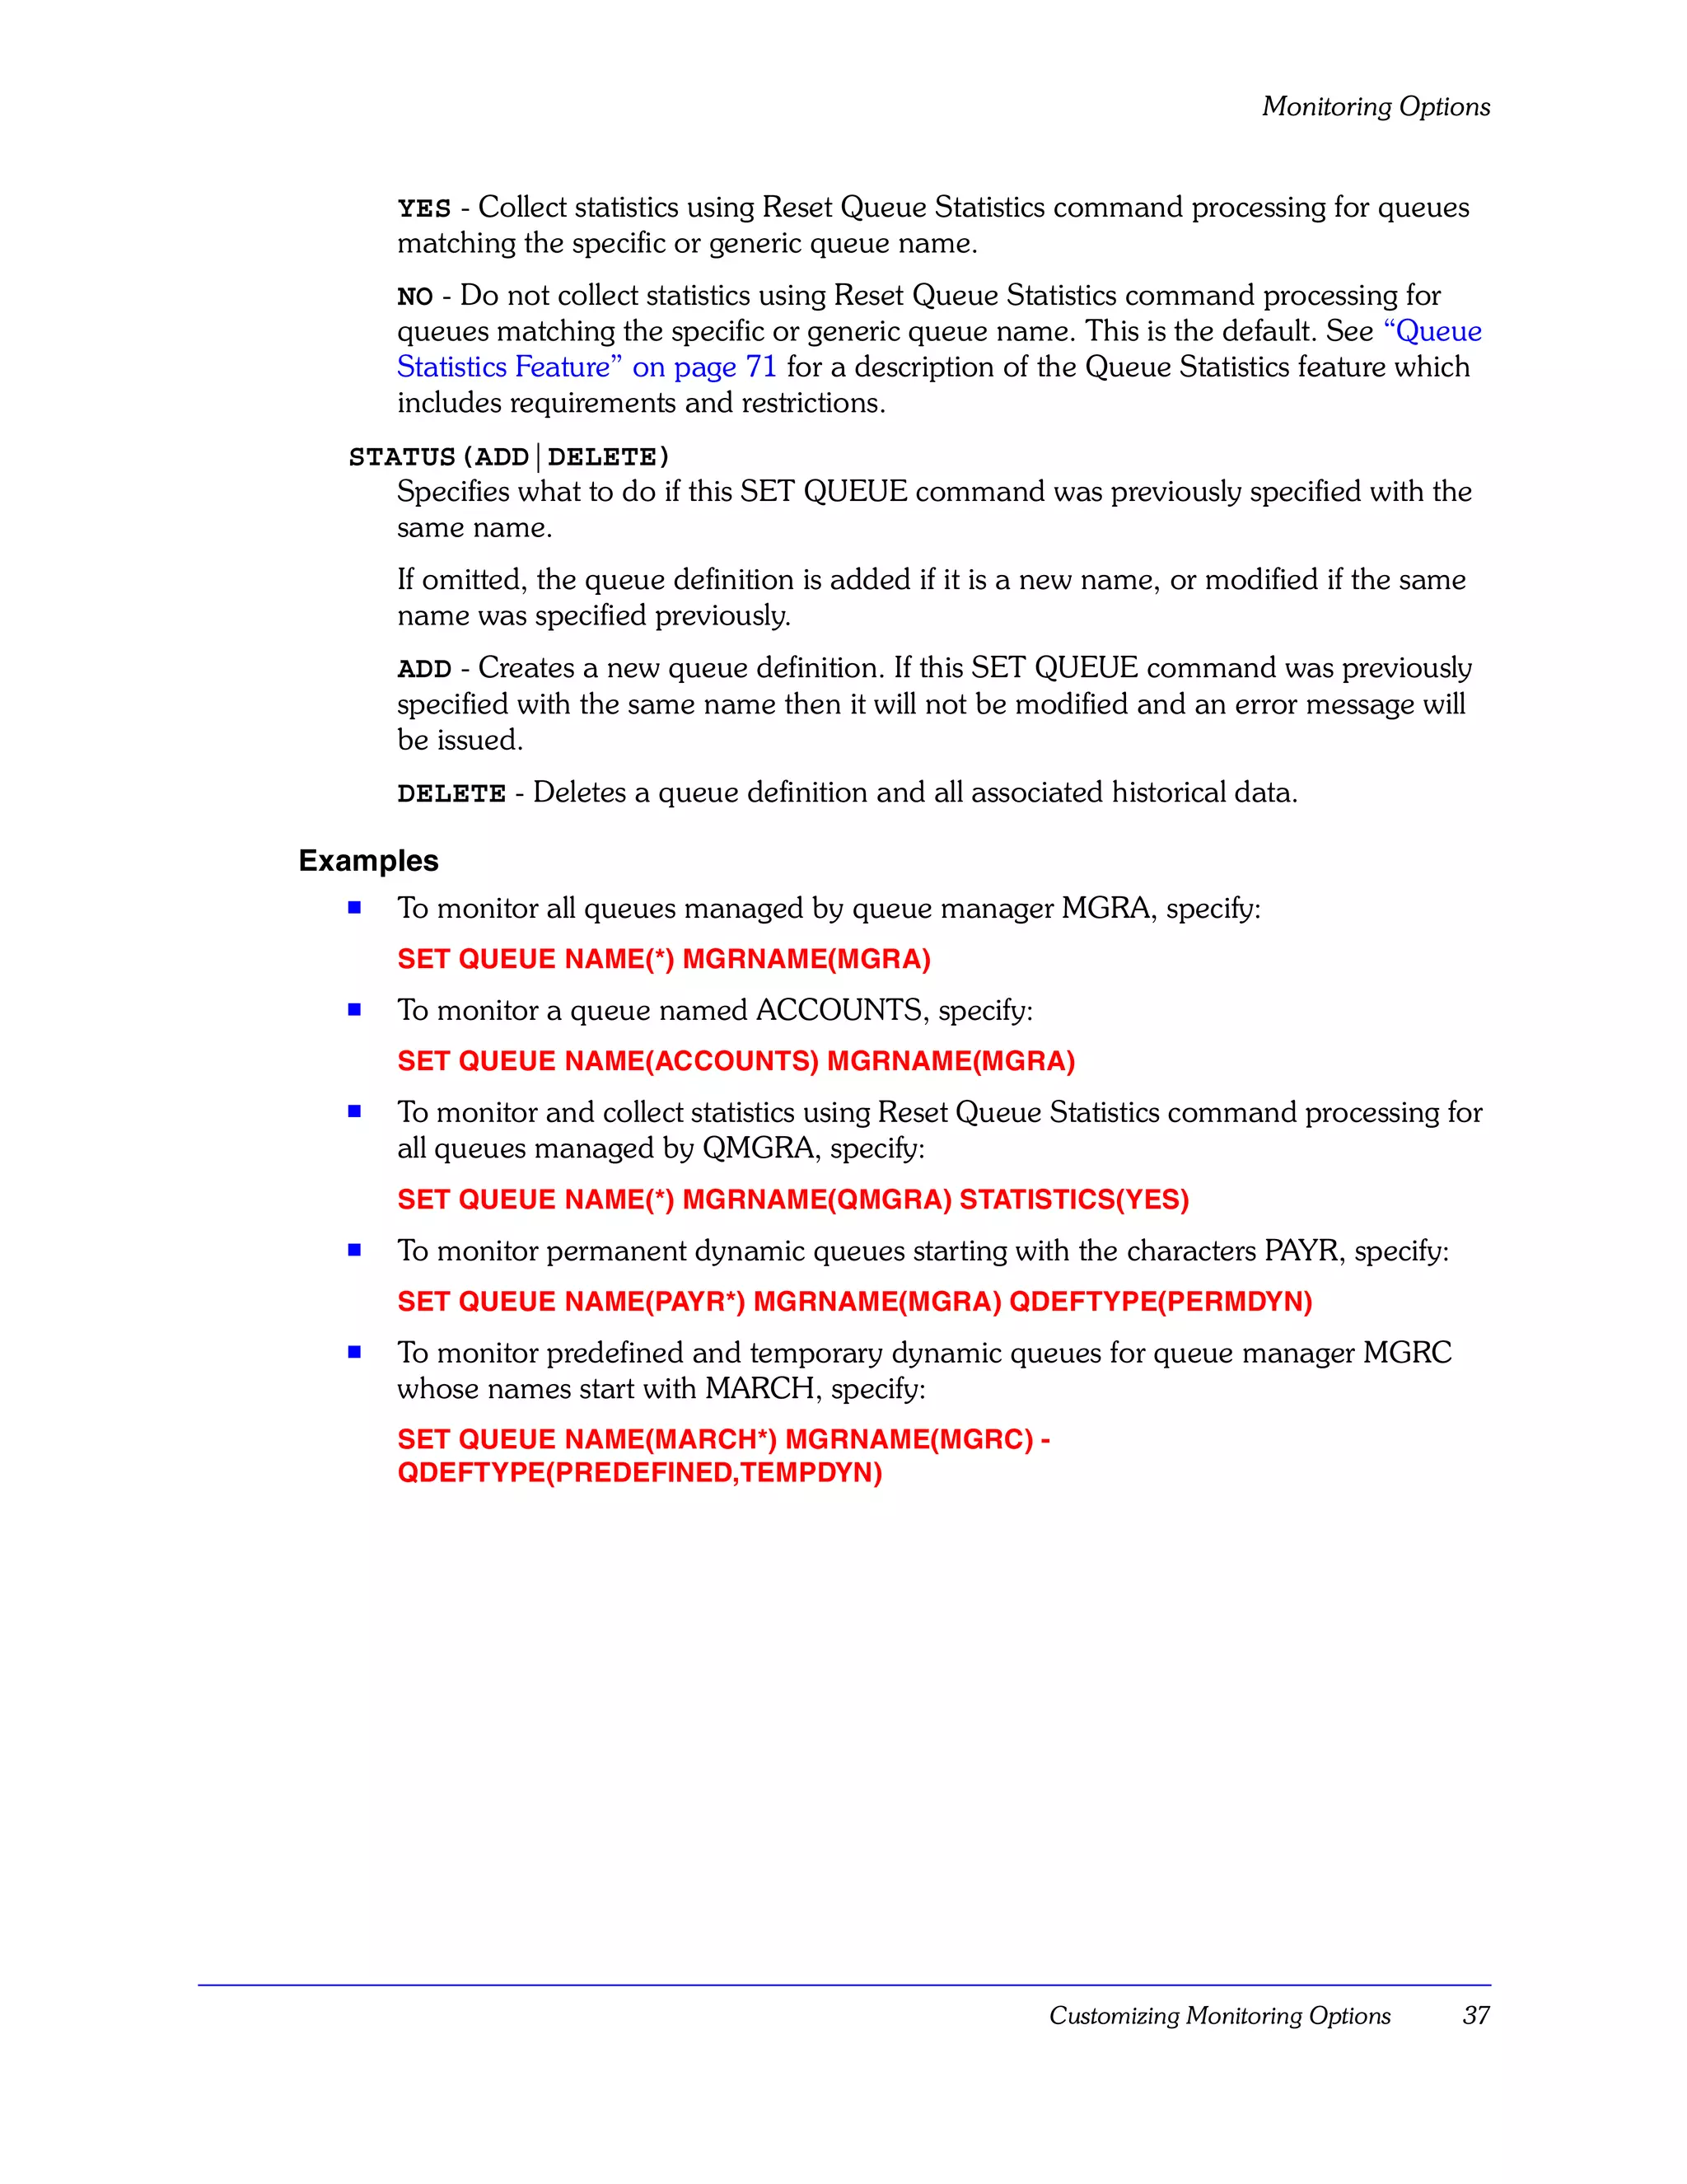
STATISTICS(YES|NO)
Specifies whether or not to collect queue statistics using WebSphere MQ Reset Queue
Statistics command processing.
36 Using IBM Tivoli OMEGAMON XE for WebSphere MQ Monitoring, V3.7.0](https://image.slidesharecdn.com/ibmtivoliomegamonxeforwebspheremq-usingibmtivoliomegamonxeforwebspheremqmonitoring-120524030104-phpapp01/75/Ibm-tivoli-omegamon-xe-for-web-sphere-mq-using-ibm-tivoli-omegamon-xe-for-websphere-mq-monitoring-36-2048.jpg)
![Monitoring Options
Specify channels: SET CHANNEL
Description
The SET CHANNEL command specifies channels to be monitored.
Syntax
SET CHANNEL NAME(channel-name-mask)
MGRNAME(manager-name) | GROUP(group-name)
[STATUS(ADD|DELETE)]
Parameters
NAME(channel-name-mask)
Defines the 1–20 character specific or generic channel name to monitor. To specify a
generic name, enter a string of characters followed by an asterisk (*). This field is
required.
MGRNAME(manager-name)
Associates this SET CHANNEL statement with a queue manager defined on a
previous SET MANAGER statement. You can use the name or nickname of the
manager. The name must exactly match the name specified on the corresponding
SET MANAGER statement. This parameter is required if GROUP is not specified.
GROUP(group-name)
Associates this SET CHANNEL statement with a group of queue managers defined
on a previous SET GROUP statement. The name must exactly match the name
specified on the corresponding SET GROUP statement. This parameter is required if
MGRNAME is not specified.
STATUS(ADD|DELETE)
Specifies what to do if this SET CHANNEL command was previously specified with
the same name.
If omitted, the result is the same as if ADD is specified.
ADD - Creates a new channel definition. If this SET CHANNEL command was
previously specified with the same name then it will not be modified and an error
message will be issued.
DELETE - Deletes a channel definition and all associated historical data.
Example
To monitor a channel named MONTANA owned by queue manager SMONICA, specify:
SET CHANNEL NAME(MONTANA) MGRNAME(SMONICA)
38 Using IBM Tivoli OMEGAMON XE for WebSphere MQ Monitoring, V3.7.0](https://image.slidesharecdn.com/ibmtivoliomegamonxeforwebspheremq-usingibmtivoliomegamonxeforwebspheremqmonitoring-120524030104-phpapp01/75/Ibm-tivoli-omegamon-xe-for-web-sphere-mq-using-ibm-tivoli-omegamon-xe-for-websphere-mq-monitoring-38-2048.jpg)
![Monitoring Options
Specify the event log: SET EVENTLOG
Description
The SET EVENTLOG command specifies the size, location, and other attributes of the
event log.
All parameters are optional; but, if the SET EVENTLOG statement is coded, at least one
parameter must be coded as well.
This command applies to all platforms except z/OS.
Syntax
SET EVENTLOG
[SIZE(n)]
[DIR(dir_name)]
[ARCHIVEFILE(arch_filename)]
[ARCHIVEOPTS( krarloff_options)]
Parameters
SIZE(n)
where n is the maximum event log file size in megabytes. If SIZE is not specified, the
default is 10. Specify SIZE(0) to disable the event log.
DIR(dir_name)
The directory to write the event log file to. If DIR is not specified, the default is the
value assigned to the ctira_hist_dir variable (@logpath@ — normally
C:CandleCmaLogs).
ARCHIVEFILE(arch_filename)
The archive directory and file name. If ARCHIVEFILE is not specified, the default is
@logpath@Qmeventh.arc. If this file already exists, krarloff appends the new data to
it.
ARCHIVEOPTS(krarloff_options)
If ARCHIVEOPTS is not specified, all krarloff defaults will be taken. See the Historical
Data Collection Guide for IBM Tivoli OMEGAMON XE Products for details of the
krarloff (kra rolloff) command.
Customizing Monitoring Options 39](https://image.slidesharecdn.com/ibmtivoliomegamonxeforwebspheremq-usingibmtivoliomegamonxeforwebspheremqmonitoring-120524030104-phpapp01/75/Ibm-tivoli-omegamon-xe-for-web-sphere-mq-using-ibm-tivoli-omegamon-xe-for-websphere-mq-monitoring-39-2048.jpg)
![Monitoring Options
Specify event queues: SET EVENTQIN
Description
The SET EVENTQIN command identifies the queue manager event queue, channel
event queue, performance event queue, and configuration event queue for a queue
manager or group of queue managers.
If no SET EVENTQIN command applies to a queue manager, the following default
WebSphere MQ names are used:
s SYSTEM.ADMIN.QMGR.EVENTS
s SYSTEM.ADMIN.CHANNEL.EVENTS
s SYSTEM.ADMIN.PERFM.EVENTS
s SYSTEM.ADMIN.CONFIG.EVENT (Configuration events are present on WebSphere
MQ for z/OS version 5.3 and above only.)
Syntax
SET EVENTQIN
MGRNAME(manager-name) | GROUP(group-name)
[QMGRQ(queue-name)]
[CHANNELQ(queue-name)]
[PERFMQ(queue-name)]
[CONFIGQ(queue-name)]
Parameters
MGRNAME(manager-name)
The queue manager that owns the specified event queue(s). You can use the name or
nickname of the queue manager. The name must exactly match the name specified
on the corresponding SET MANAGER statement. This parameter is required if
GROUP is not specified.
GROUP(group-name)
A group of queue managers (as specified on a previous SET GROUP statement),
each of which owns the specified event queue(s). The name must exactly match the
name specified on the corresponding SET GROUP statement. This parameter is
required if MGRNAME is not specified.
QMGRQ(queue-name)
Specifies the name of the queue manager event queue to monitor.
CHANNELQ(queue-name)
Specifies the name of the channel event queue to monitor.
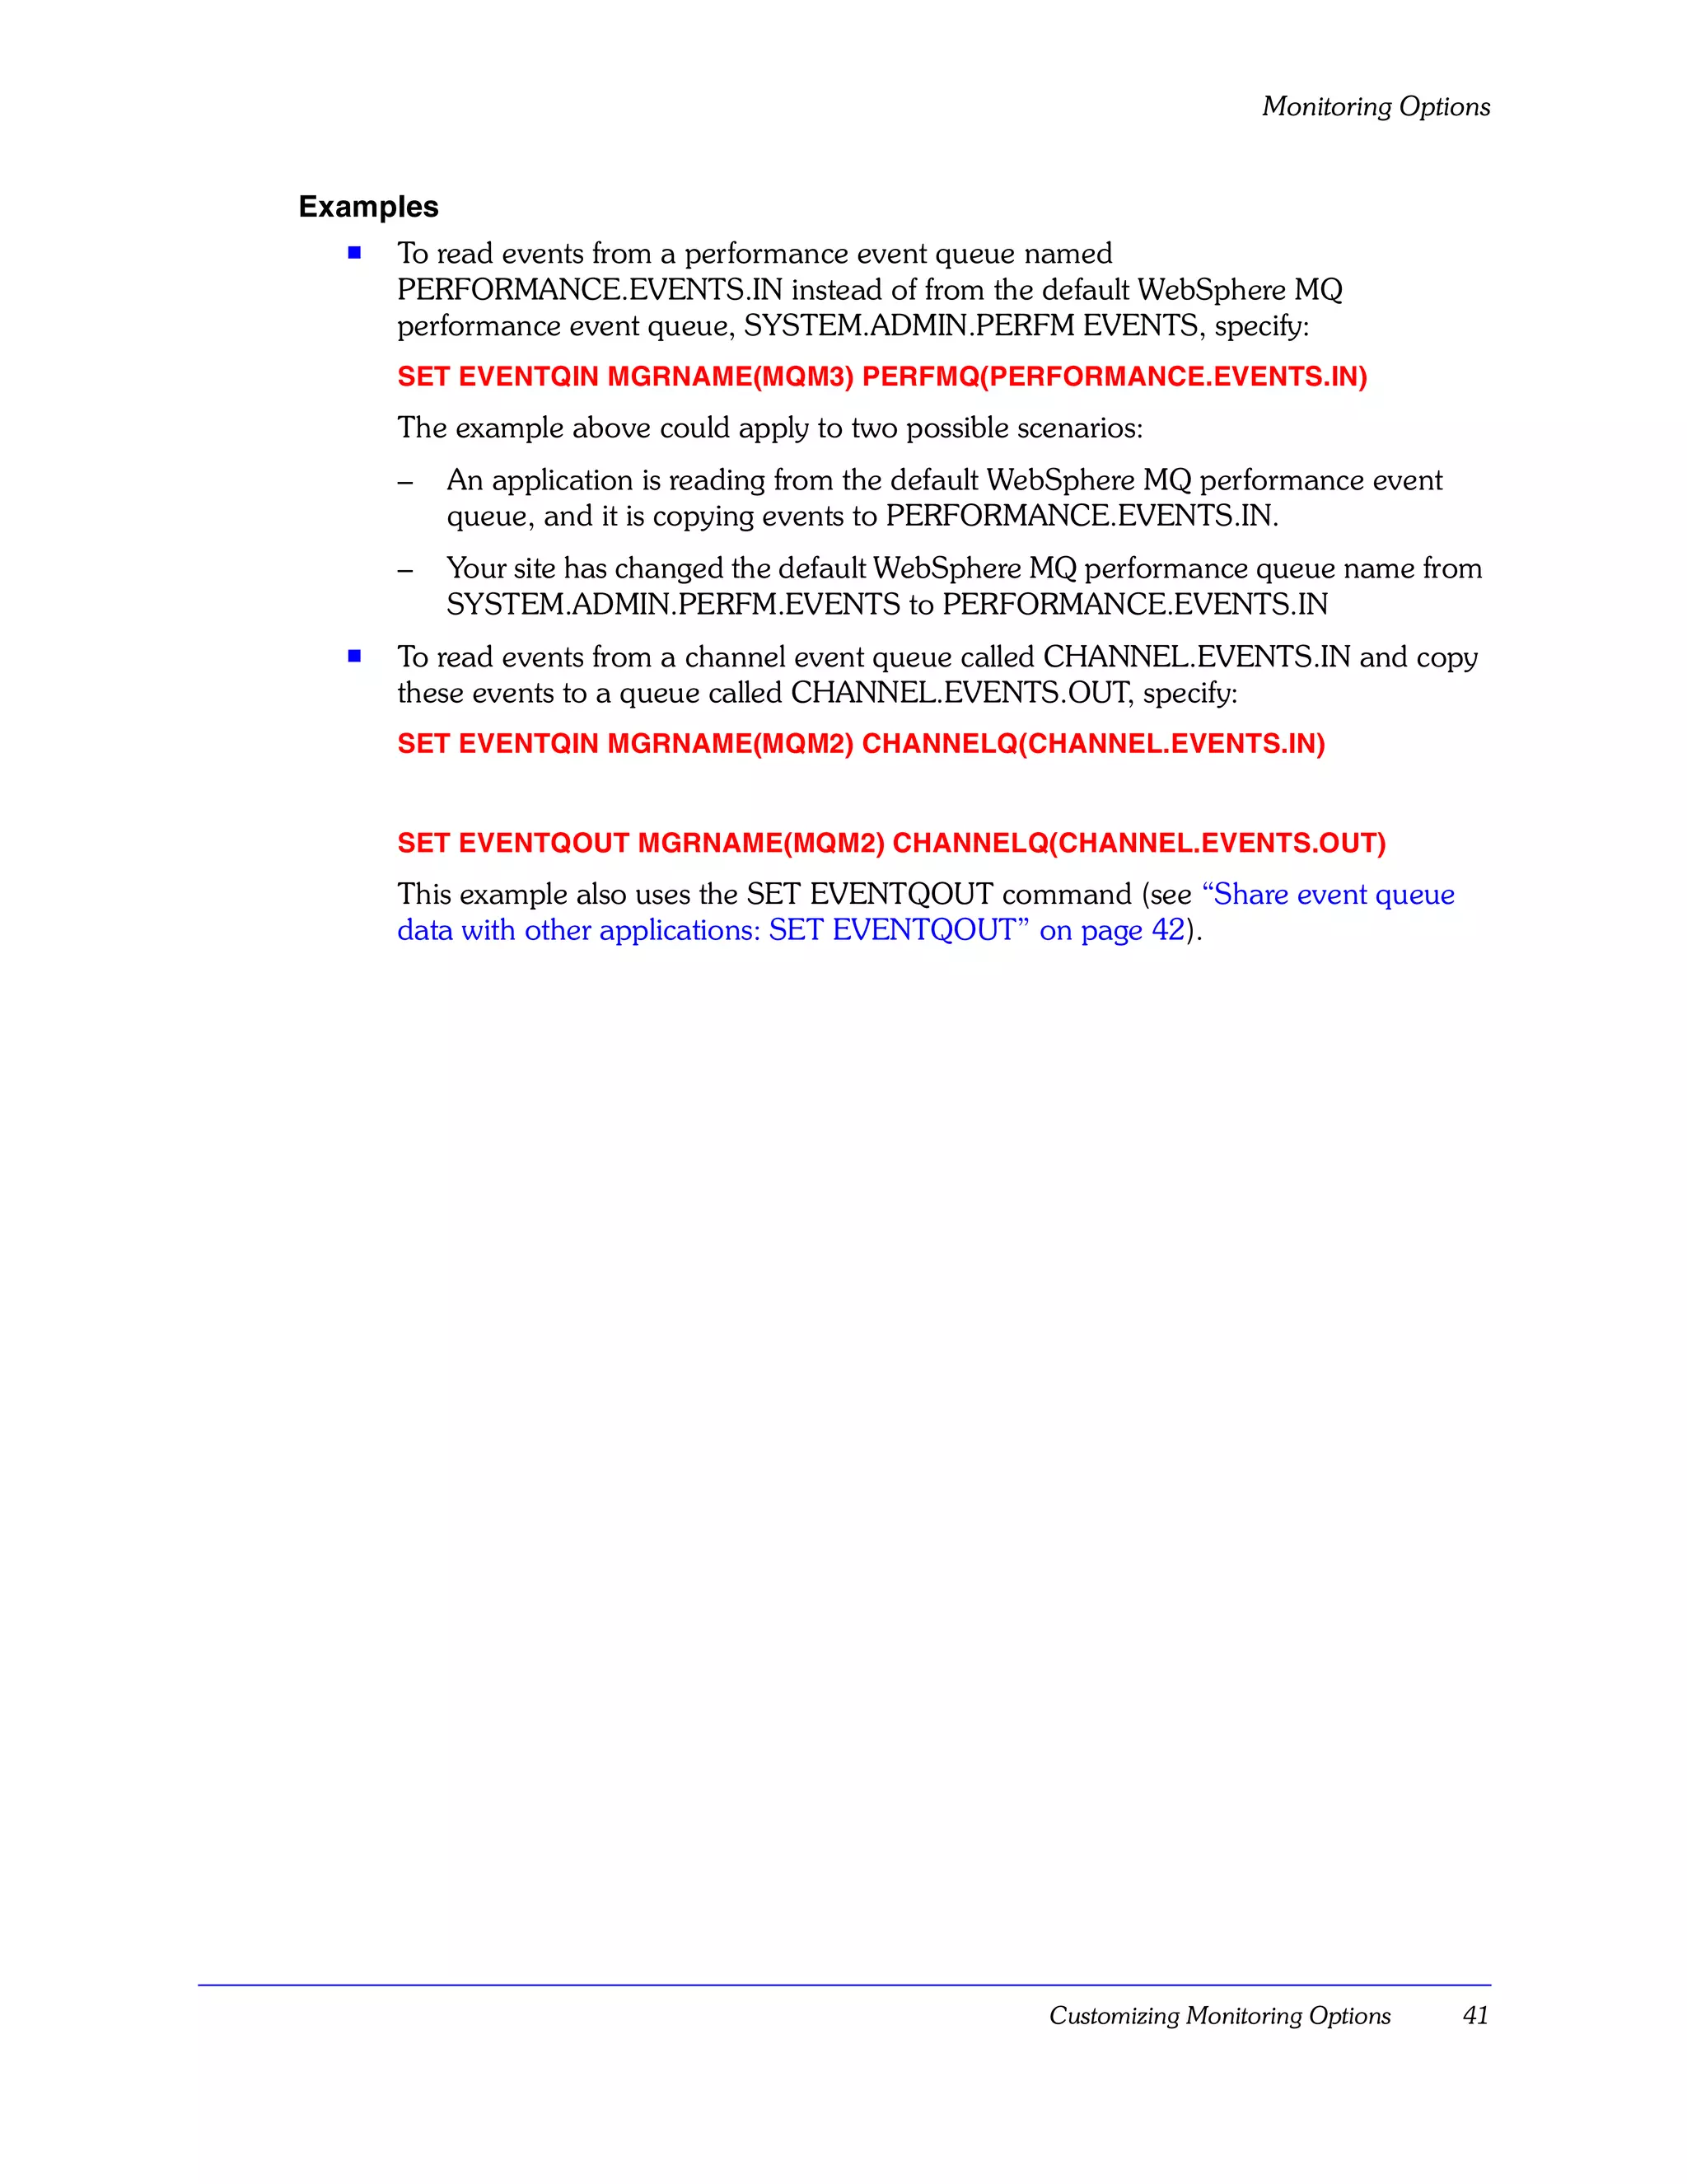
PERFMQ(queue-name)
Specifies the name of the performance event queue to monitor.
CONFIGQ(queue-name)
Specifies the name of the configuration event queue to monitor.
40 Using IBM Tivoli OMEGAMON XE for WebSphere MQ Monitoring, V3.7.0](https://image.slidesharecdn.com/ibmtivoliomegamonxeforwebspheremq-usingibmtivoliomegamonxeforwebspheremqmonitoring-120524030104-phpapp01/75/Ibm-tivoli-omegamon-xe-for-web-sphere-mq-using-ibm-tivoli-omegamon-xe-for-websphere-mq-monitoring-40-2048.jpg)
![Monitoring Options
Share event queue data with other applications: SET EVENTQOUT
Description
Once IBM Tivoli OMEGAMON XE for WebSphere MQ Monitoring has read an event
message from an event queue, it deletes the message to ensure that it is processed only
once. If another application running at your site requires access to event messages, you
can define an output queue where these messages are copied and point the other
application to that queue.
The SET EVENTQOUT command identifies the output queue(s) where queue manager
event information, channel event information, performance event information, and
configuration event information will be copied.
If no SET EVENTQOUT command applies to a queue manager, the event information is
discarded after being processed.
Syntax
SET EVENTQOUT
MGRNAME(manager-name) | GROUP(group-name)
[QMGRQ(queue-name)]
[CHANNELQ(queue-name)]
[PERFMQ(queue-name)]
[CONFIGQ(queue-name)]
Parameters
MGRNAME(manager-name)
The queue manager that owns the specified output queue(s). You can use the name
or nickname of the queue manager. The name must exactly match the name specified
on the corresponding SET MANAGER statement. This parameter is required if
GROUP is not specified.
GROUP(group-name)
The group of queue managers (as specified on a previous SET GROUP statement),
each of which owns the specified event queue(s). The name must exactly match the
name specified on the corresponding SET GROUP statement. This parameter is
required if MGRNAME is not specified.
QMGRQ(queue-name)
Specifies the name of the local queue where queue manager events are copied after
being processed. This queue must exist when the SET EVENTQOUT command is
processed.
CHANNELQ(queue-name)
Specifies the name of the local queue where channel events are copied after being
processed. This queue must exist when the SET EVENTQOUT command is
processed.
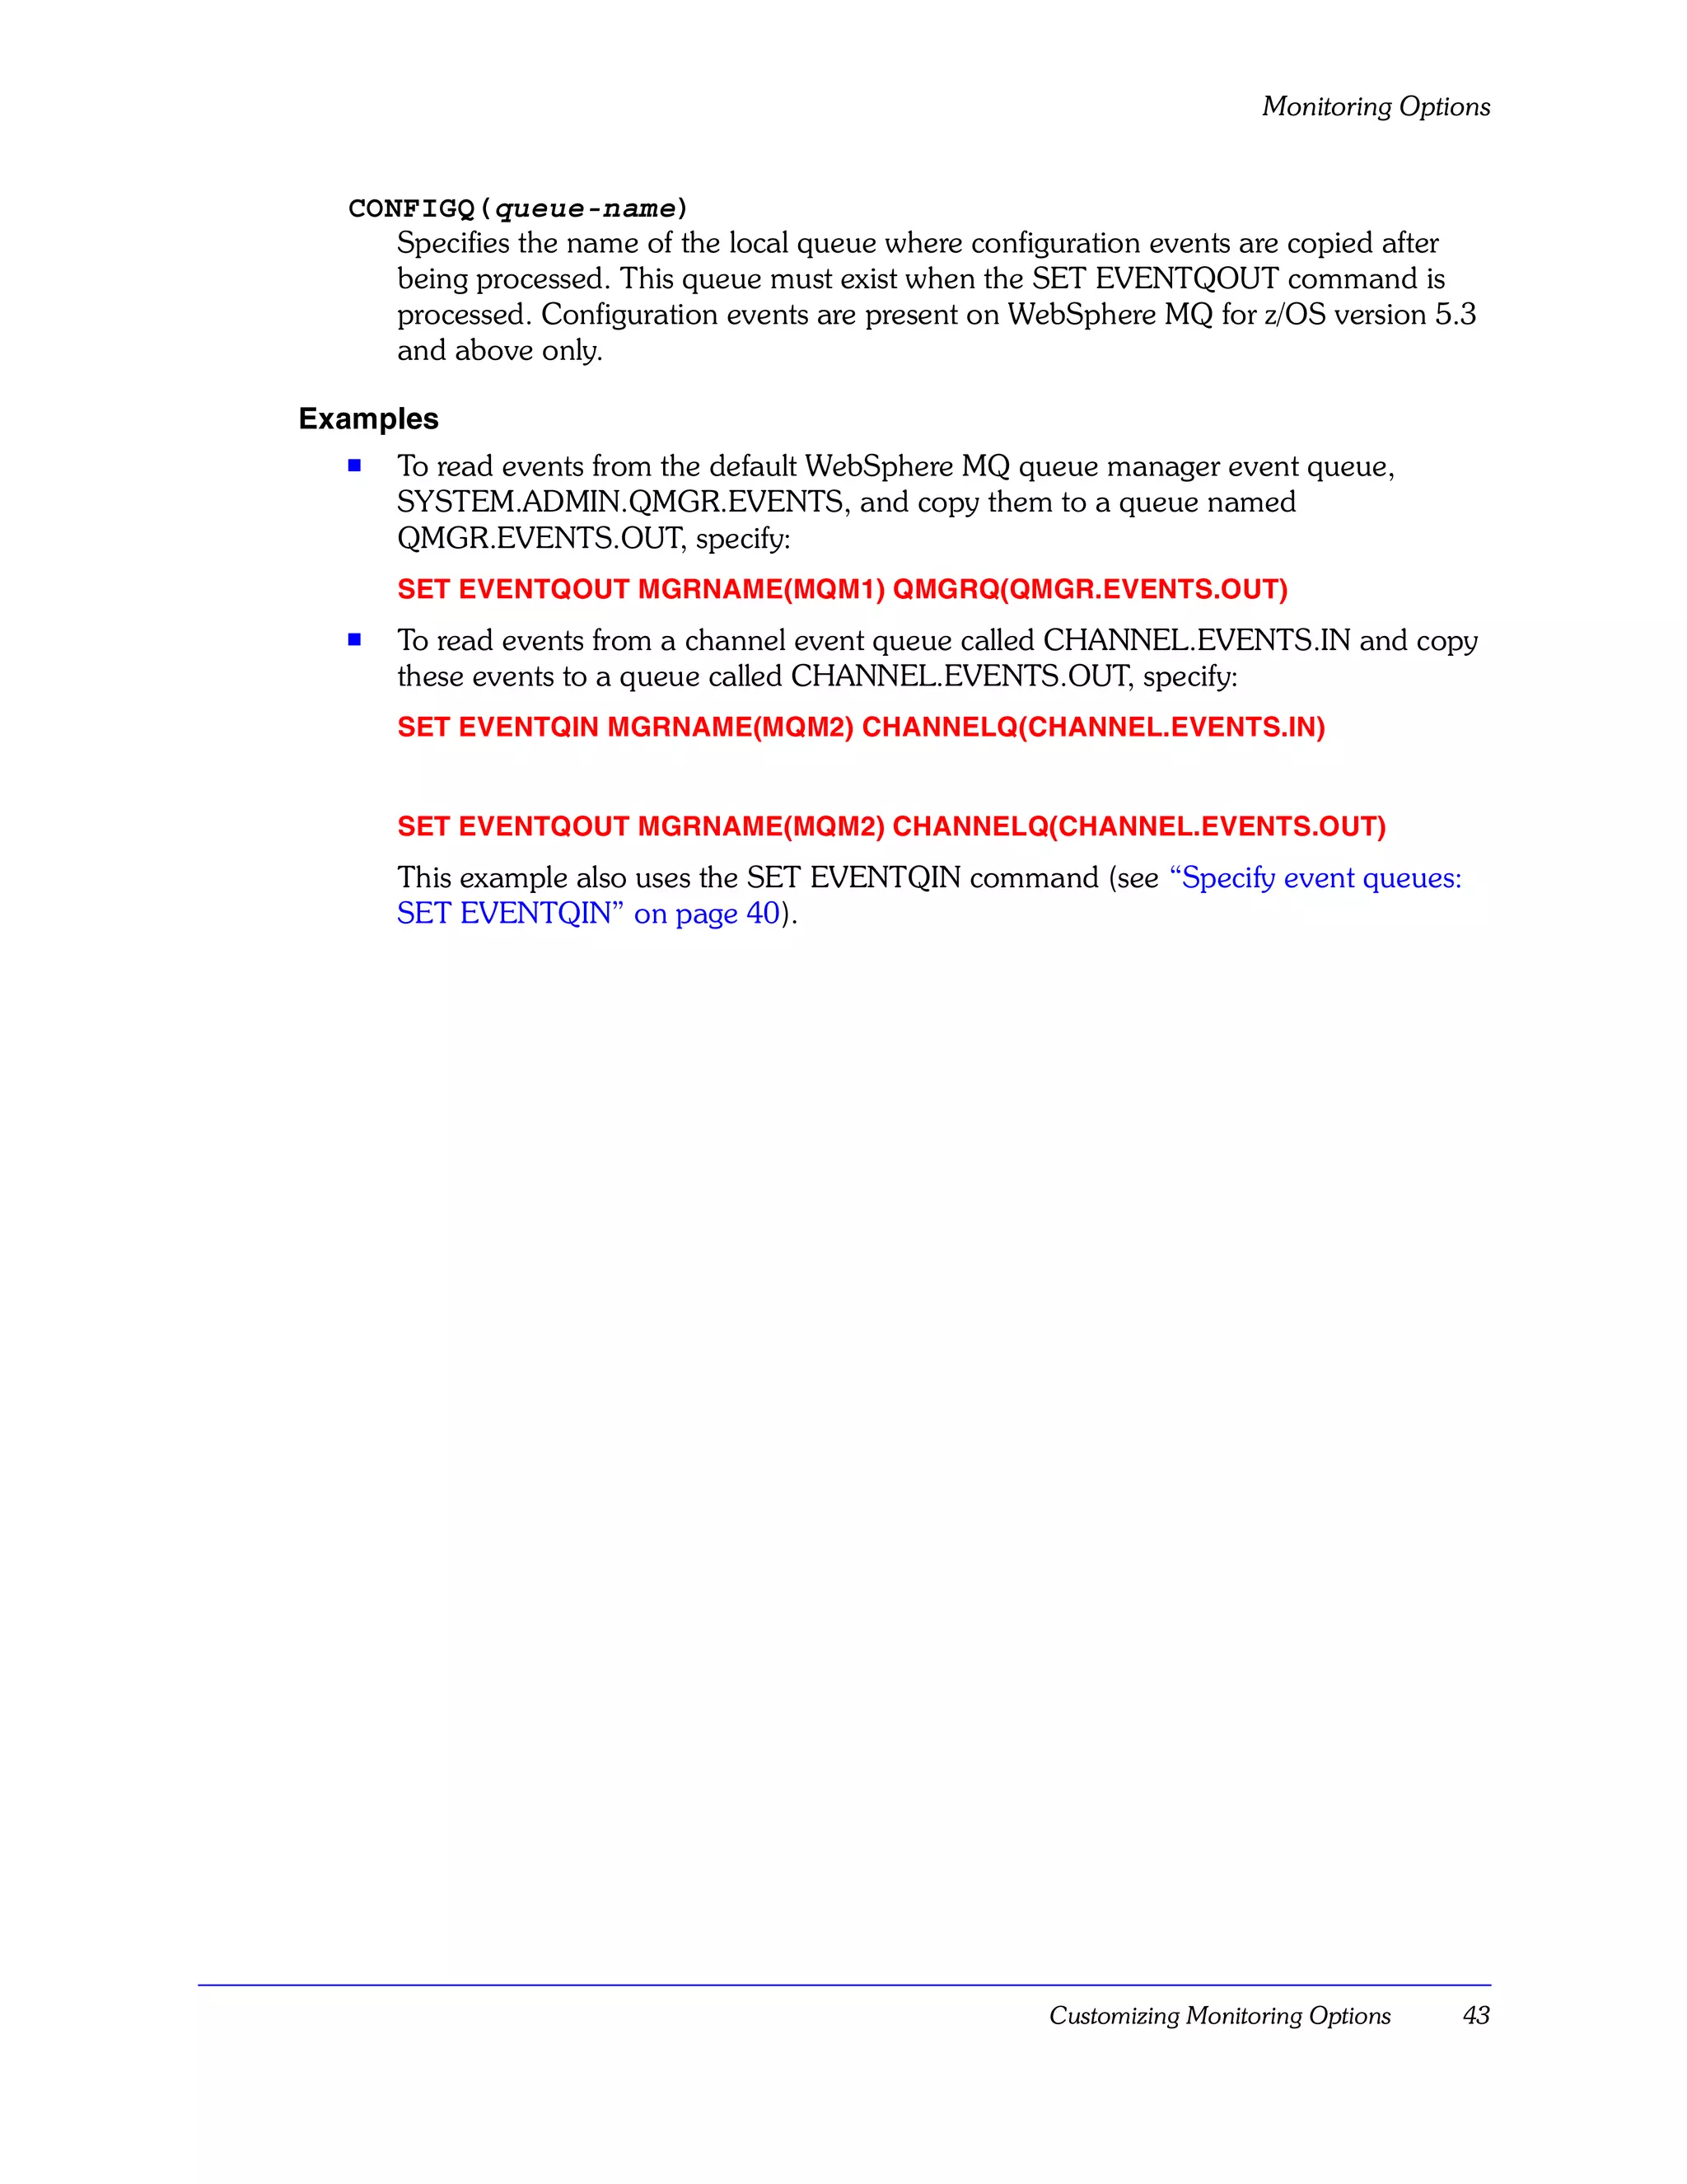
PERFMQ(queue-name)
Specifies the name of the local queue where performance events are copied after
being processed. This queue must exist when the SET EVENTQOUT command is
processed.
42 Using IBM Tivoli OMEGAMON XE for WebSphere MQ Monitoring, V3.7.0](https://image.slidesharecdn.com/ibmtivoliomegamonxeforwebspheremq-usingibmtivoliomegamonxeforwebspheremqmonitoring-120524030104-phpapp01/75/Ibm-tivoli-omegamon-xe-for-web-sphere-mq-using-ibm-tivoli-omegamon-xe-for-websphere-mq-monitoring-42-2048.jpg)
![Monitoring Options
Start monitoring: PERFORM STARTMON
Description
The PERFORM STARTMON command initiates monitoring of WebSphere MQ objects,
specifies the sampling interval for collecting WebSphere MQ data, and specifies whether
or not historical data will be collected.
The PERFORM STARTMON command is required.
Syntax
PERFORM STARTMON
SAMPINT(sample-interval)
HISTORY (YES|NO)
[ACTIVEONLY(YES|NO)]
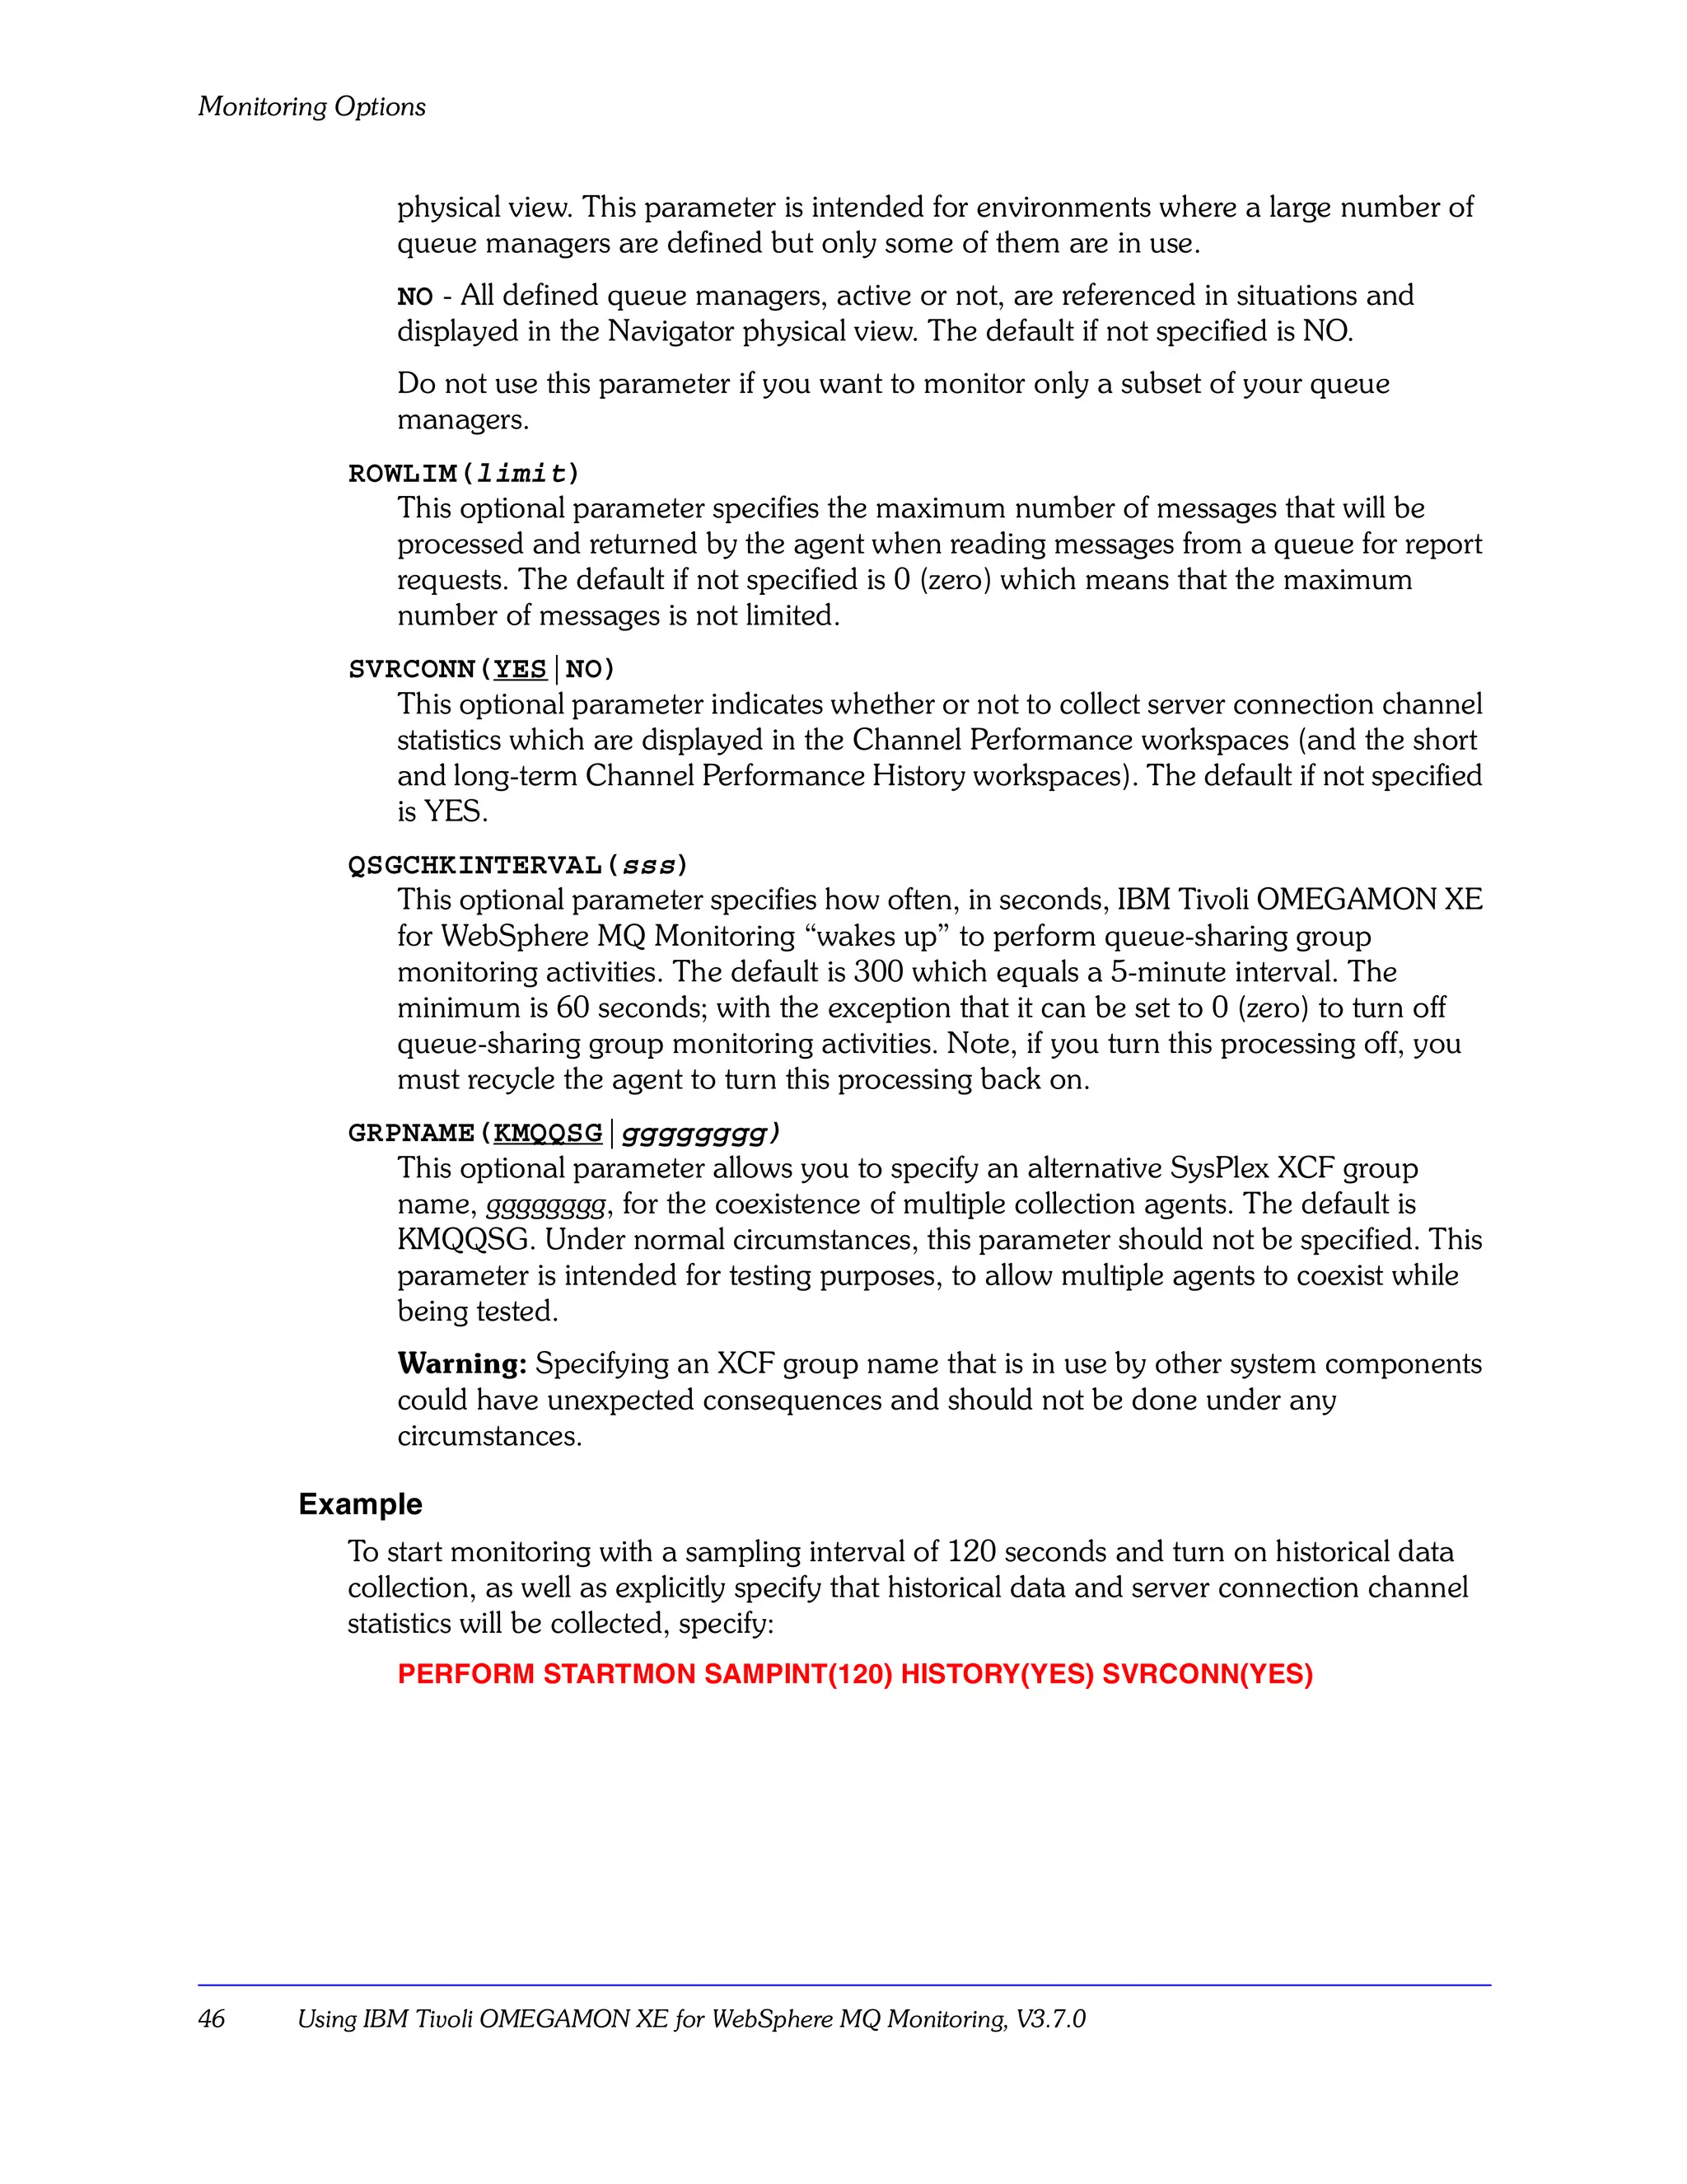
[ROWLIM(limit)]
[SVRCONN(YES|NO)]
[QSGCHKINTERVAL(sss)]
[GRPNAME(KMQQSG|gggggggg)]
Parameter
SAMPINT(sample-interval)
How often, in seconds, IBM Tivoli OMEGAMON XE for WebSphere MQ Monitoring
samples your queue manager(s) for performance data. The default is 60 seconds.
The minimum is 10 seconds.
If your site is monitoring large numbers of queues or channels, you may experience a
degradation in performance. If that occurs, IBM recommends that you increase the
value of SAMPINT to improve performance.
If your site is monitoring queue-sharing groups on z/OS, the sample interval should be
the same interval for all agents that monitor queue managers in queue-sharing
groups.
See also, ICYCLE.
HISTORY(YES|NO)
Defines whether or not historical data will be collected. On distributed platforms, the
value pre-configured for you by the installation/configuration process is NO. On z/OS,
the value pre-configured for you by the Configuration tool is YES. The default, if not
otherwise specified by the installation/configuration process, is NO. (For information
about using the historical data collection function see the CandleNet Portal online
help and the Historical Data Collection Guide for IBM Tivoli OMEGAMON XE
Products.)
ACTIVEONLY(YES|NO)
This parameter applies only to z/OS.
This optional parameter indicates whether or not to monitor only active queue
managers.
YES - Only queue managers that are running at agent startup time, or become active
while the agent is running, are referenced in situations and displayed in the Navigator
Customizing Monitoring Options 45](https://image.slidesharecdn.com/ibmtivoliomegamonxeforwebspheremq-usingibmtivoliomegamonxeforwebspheremqmonitoring-120524030104-phpapp01/75/Ibm-tivoli-omegamon-xe-for-web-sphere-mq-using-ibm-tivoli-omegamon-xe-for-websphere-mq-monitoring-45-2048.jpg)
![Monitoring Options
Monitor applications: SET APPL (z/OS only)
Description
The SET APPL command identifies the WebSphere MQ-based z/OS applications, CICS®
transactions, and IMS™ programs that should be monitored for application debugging
information and application statistics.
Use the SET APPL command together with the SET MQIMONITOR command to activate
the application debugging and application statistics features. See “Monitor applications:
SET MQIMONITOR (z/OS only)” on page 52 for a description of SET MQIMONITOR.
Syntax
SET APPL NAME(application-name)
[TRANPGM(program-name)]
[MGRNAME(manager-name)]
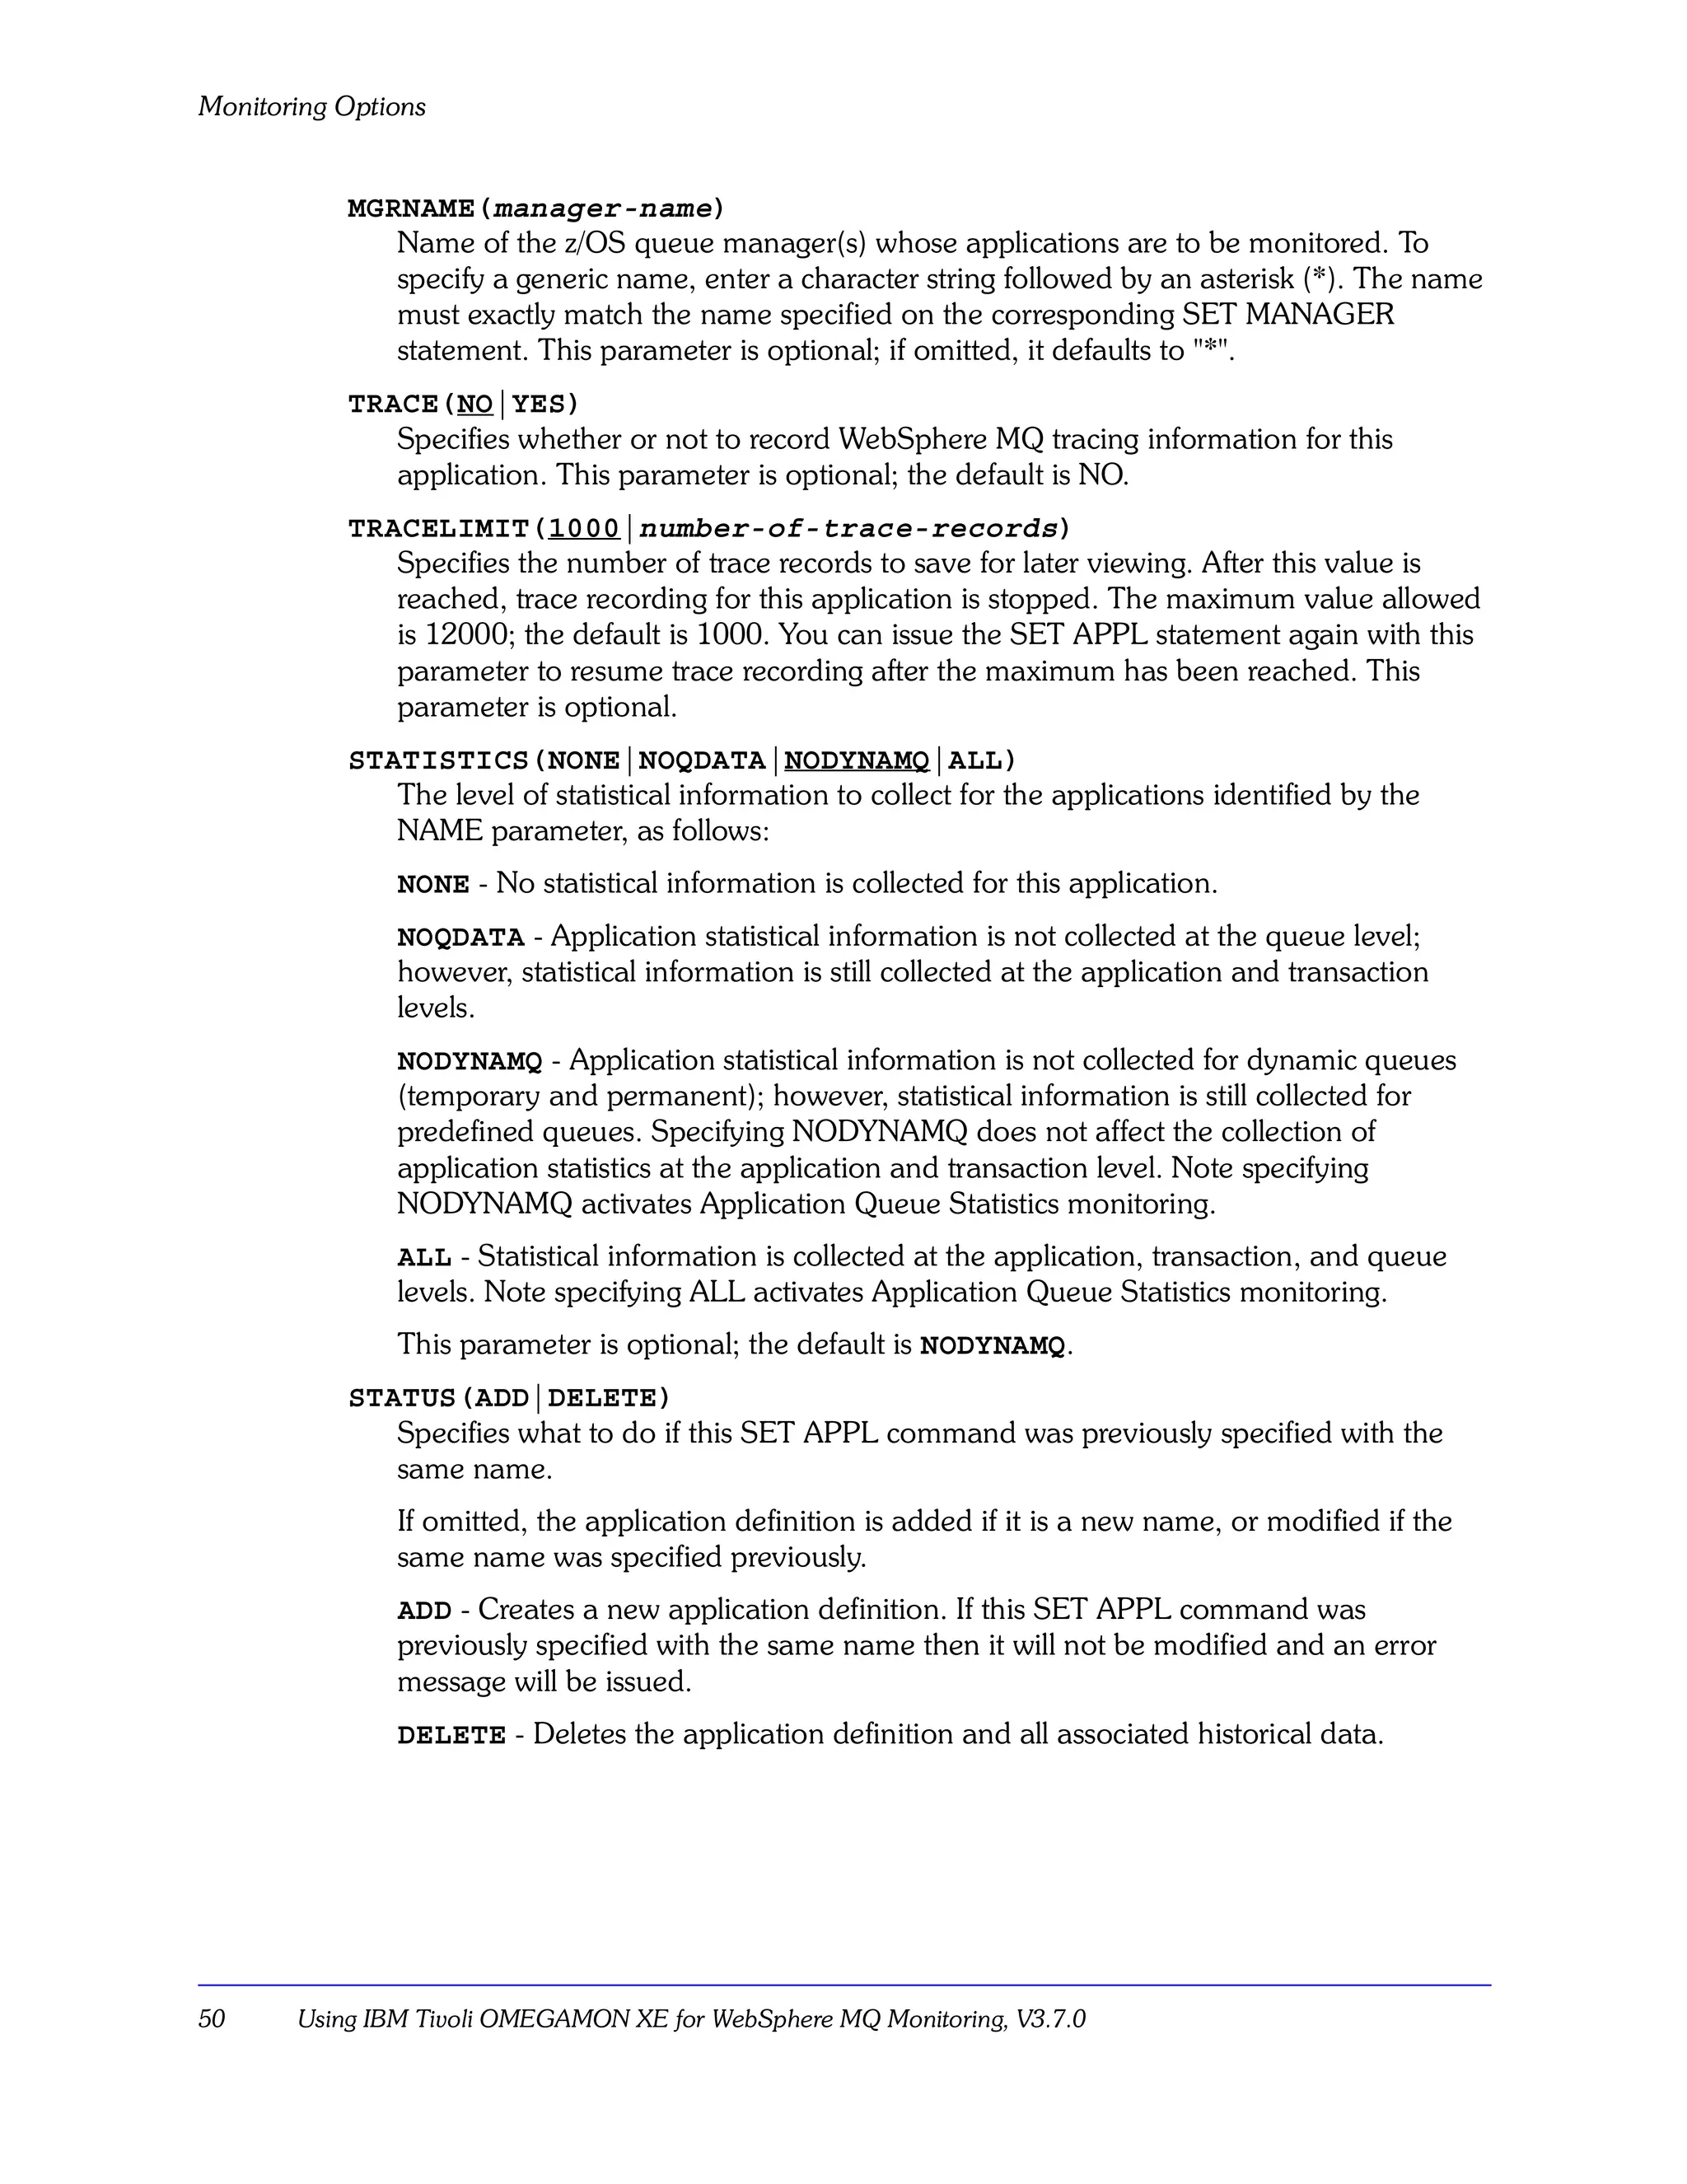
[TRACE(NO|YES)]
[TRACELIMIT(1000|number-of-trace-records)]
[STATISTICS(NONE|NOQDATA|NODYNAMQ|ALL)]
[STATUS(ADD|DELETE)]
Parameters
NAME(application-name)
1–8 character name of the z/OS application to monitor. To specify a generic name,
enter a character string followed by an asterisk (*).
– The application name format differs depending on the applications being
monitored:
– For batch applications it is the 1–8 character job name.
– For TSO applications it is the 1–7 character user ID of the TSO session.
– For CICS applications it is the 1–8 character VTAM applid.
– For IMS applications it is the 1–4 character IMS subsystem ID prefixed with the
characters “IMS” and padded with a blank.
This parameter is required.
TRANPGM(program-name)
Further identifies the program(s) to monitor, as follows:
– The 1–4 character name of the CICS transaction to monitor within the VTAM
applid identified by the NAME parameter.
– The 1–8 character name of the IMS program within the IMS subsystem identified
by the NAME parameter.
– The 1–8 character name of the batch or TSO program within the address space
identified by the NAME parameter.
To specify a generic name, enter a character string followed by an asterisk (*). This
parameter is optional; if omitted, it defaults to "*".
Customizing Monitoring Options 49](https://image.slidesharecdn.com/ibmtivoliomegamonxeforwebspheremq-usingibmtivoliomegamonxeforwebspheremqmonitoring-120524030104-phpapp01/75/Ibm-tivoli-omegamon-xe-for-web-sphere-mq-using-ibm-tivoli-omegamon-xe-for-websphere-mq-monitoring-49-2048.jpg)
![Monitoring Options
Monitor applications: SET MQIMONITOR (z/OS only)
Description
SET MQIMONITOR is supported on z/OS only.
The SET MQIMONITOR command activates monitoring for the applications you
specified using SET APPL. You must specify SET MQIMONITOR to turn on monitoring.
Use the SET MQIMONITOR command together with the SET APPL command to activate
the application debugging and application statistics features.
Syntax
SET MQIMONITOR STATUS(INSTALL|REMOVE|FREMOVE)
MGRNAME(manager-name) | GROUP(group-name)
[BUFFERSIZE(buffer-space)]
Parameters
STATUS(INSTALL|REMOVE|FREMOVE)
Required. Turns z/OS application monitoring on or off.
INSTALL - Application monitoring begins for the z/OS applications, CICS
transactions, and IMS programs identified on the SET APPL command. (If no SET
APPL command is specified, no data is collected.)
REMOVE - Application monitoring ends for the applications identified on the SET
APPL command. If monitoring has not already been activated by a previous SET
MQIMONITOR STATUS(INSTALL) command, the request is ignored.
FREMOVE - Use the FREMOVE option only if instructed to do so by IBM Software
Support. This parameter forces the removal and termination of application
monitoring.
MGRNAME(manager-name)
Application monitoring is installed or removed for the queue manager identified by a
previous SET MANAGER command. The name must exactly match the name
specified on the SET MANAGER command. This parameter is required if GROUP is
not specified.
GROUP(group-name)
Application monitoring is installed or removed for the group of queue managers
identified by a previous SET GROUP command. The name must exactly match the
name specified on the corresponding SET GROUP command. This parameter is
required if MGRNAME is not specified.
BUFFERSIZE(buffer-space)
Applies only when STATUS(INSTALL) is also specified. This parameter specifies the
size (in megabytes) of buffer data space for monitoring WebSphere MQ applications.
This parameter is optional, though IBM recommends using it for queue managers that
show more than 200 WebSphere MQ API calls per second. Use the following formula
to calculate the buffer space you need:
BUFFERSIZE=High MQSeries API rate/22
52 Using IBM Tivoli OMEGAMON XE for WebSphere MQ Monitoring, V3.7.0](https://image.slidesharecdn.com/ibmtivoliomegamonxeforwebspheremq-usingibmtivoliomegamonxeforwebspheremqmonitoring-120524030104-phpapp01/75/Ibm-tivoli-omegamon-xe-for-web-sphere-mq-using-ibm-tivoli-omegamon-xe-for-websphere-mq-monitoring-52-2048.jpg)
![Monitoring Options
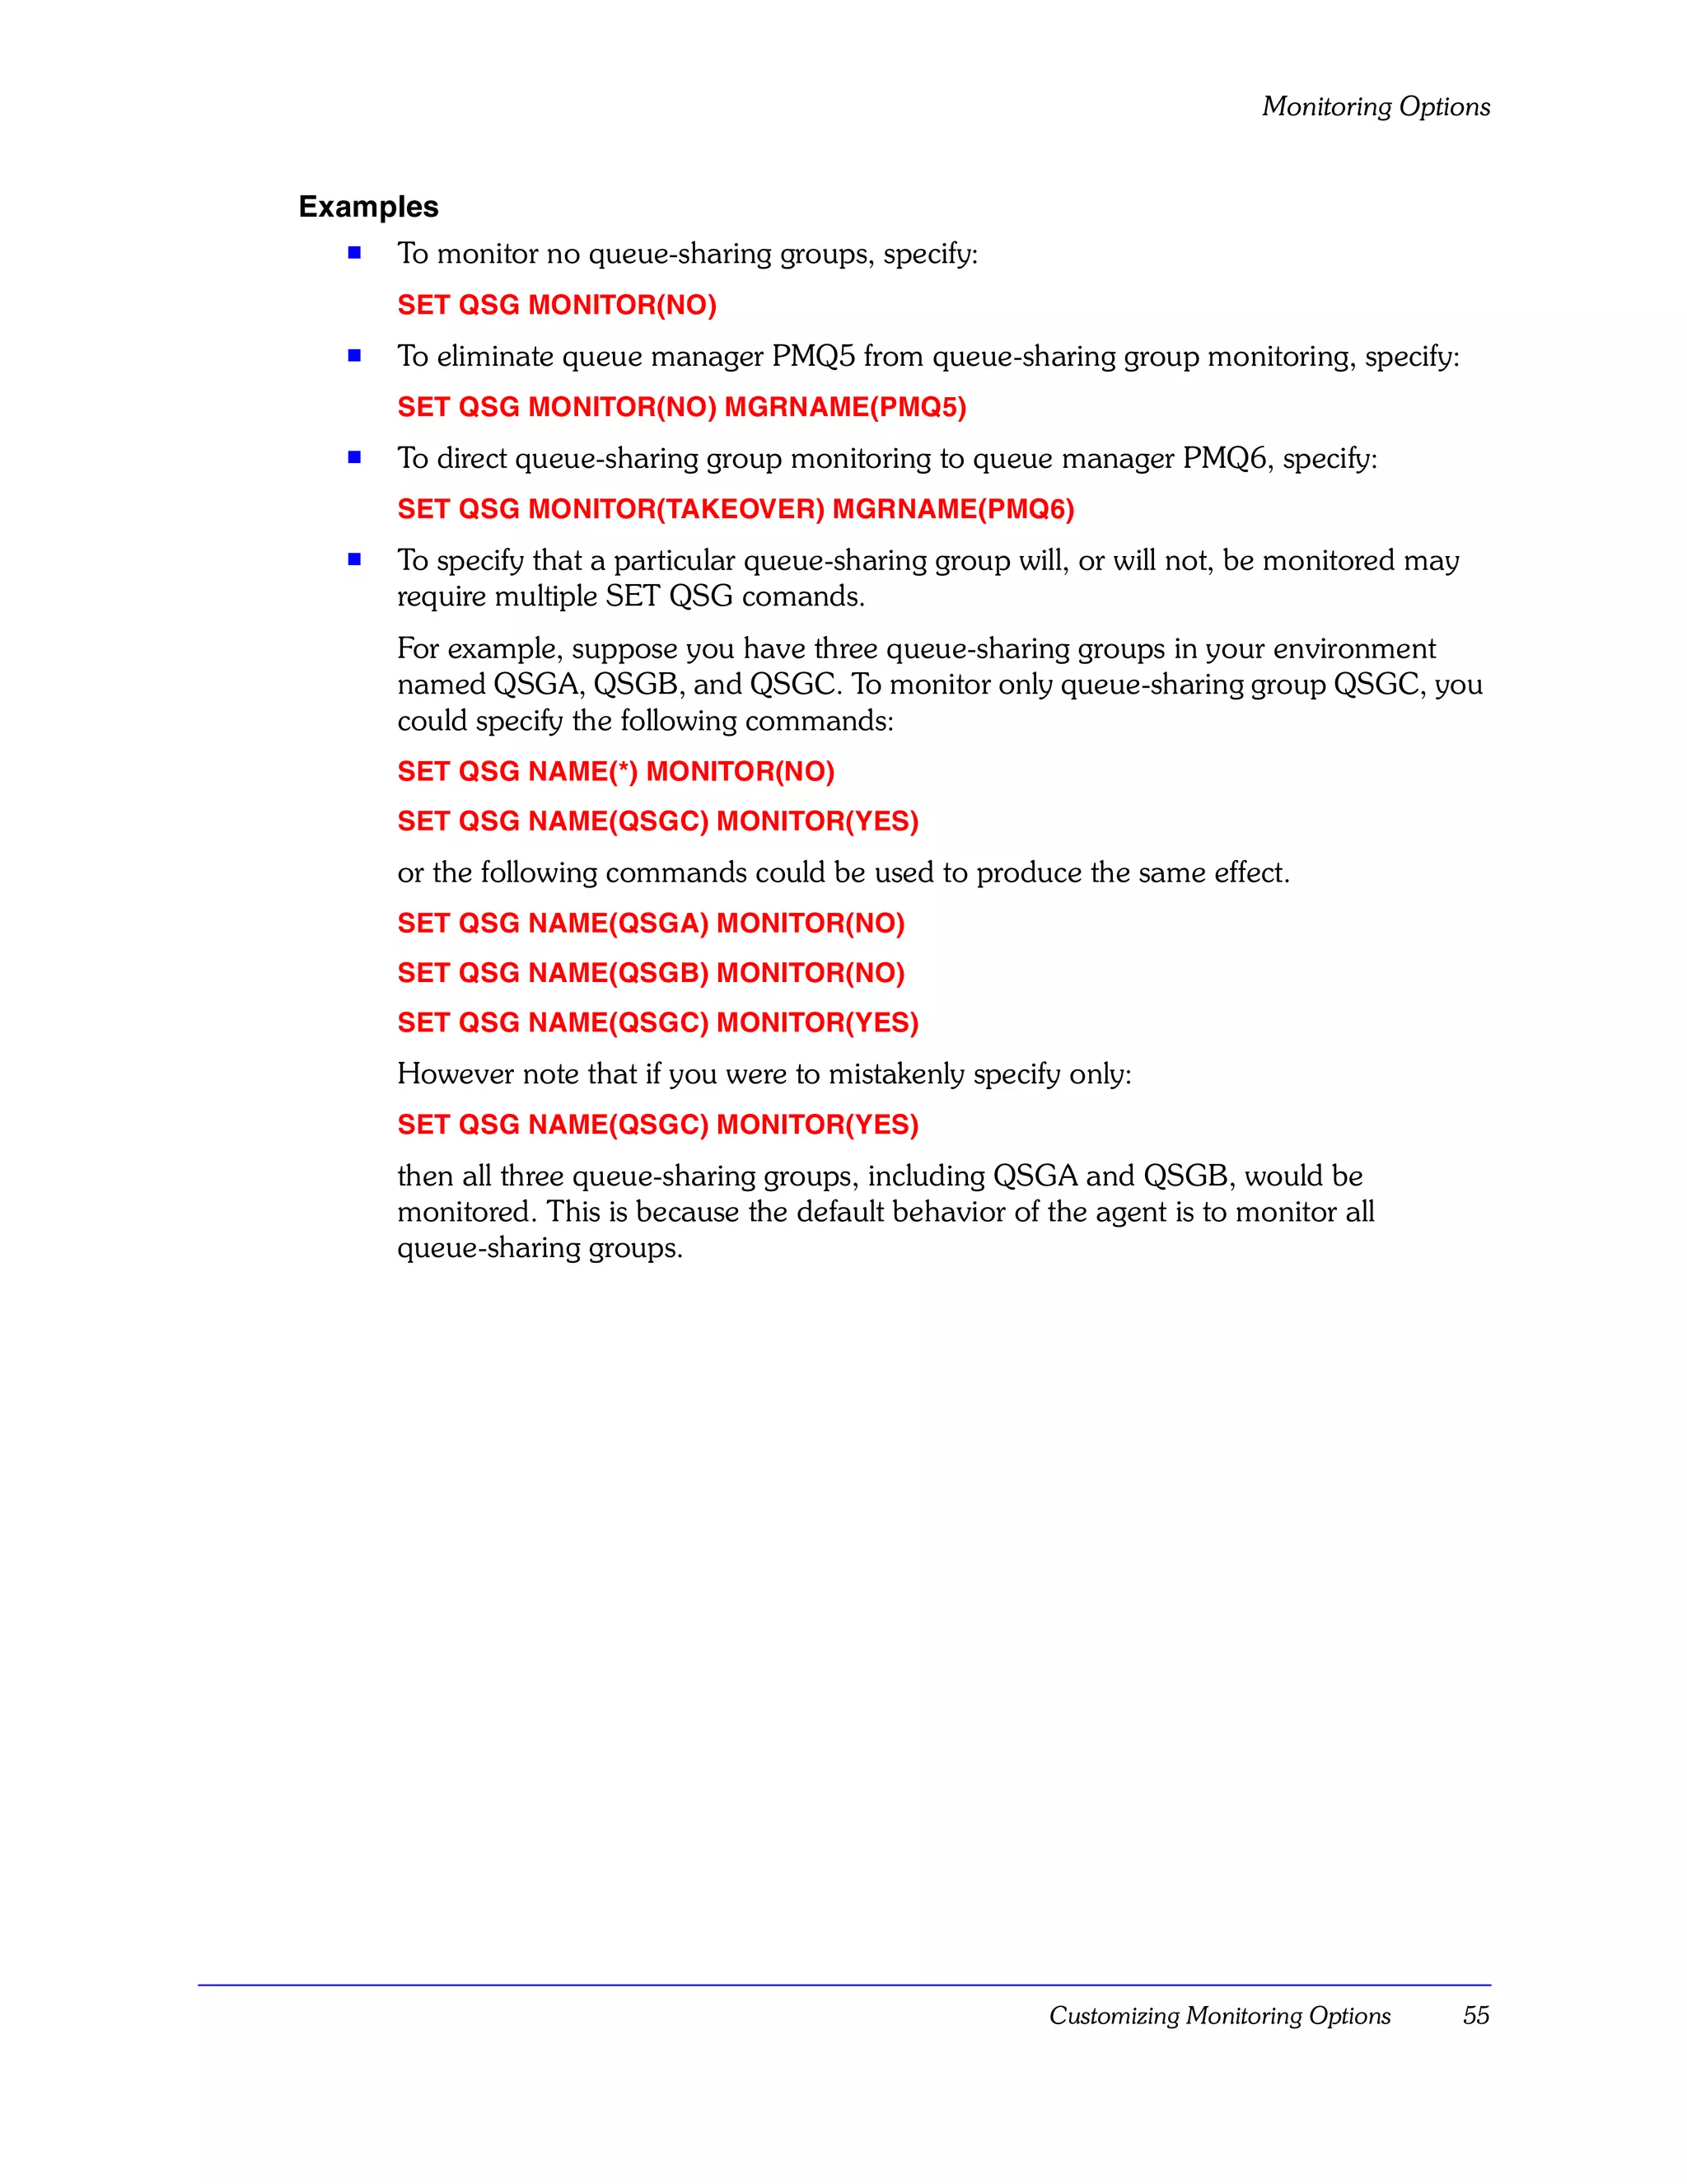
Queue sharing group monitoring: SET QSG (z/OS only)
Description
The SET QSG command specifies which queue-sharing groups the WebSphere MQ
monitoring agent on z/OS monitors and which queue managers the agent uses to collect
queue-sharing group data. At any given time, for a particular queue-sharing group, this
monitoring product uses only one queue manager to gather data. If that queue manager
becomes unavailable, data gathering will “fail over” to another queue manager.
The SET QSG command is optional. If not specified, the default behavior of the agent is
to monitor all queue-sharing groups that are associated with monitored queue managers.
You might use a SET QSG command to specify such things as:
s that no queue-sharing groups will be monitored.
s that a particular queue-sharing group will not be monitored.
s
that a particular queue manager should not be used to collect queue-sharing group
data.
Syntax
SET QSG [NAME(nnnn)]
[MGRNAME(mmmm)]
[MONITOR(NO|YES|TAKEOVER)]
Parameters
NAME(nnnn)
The NAME parameter specifies the name of a queue-sharing group. The NAME
parameter is optional. The default if not specified is NAME(*).
MGRNAME(mmmm)
The MGRNAME parameter specifies a queue manager name in a particular
queue-sharing group. The MGRNAME parameter is optional. The default if not
specified is MGRNAME(*).
MONITOR(NO|YES|TAKEOVER)
The MONITOR parameter specifies whether the agent monitors the specified
combination of queue-sharing group and queue manager. It also specifies whether
takover processing will be performed.
The MONITOR parameter is optional. The default if not specified is MONITOR(YES).
NO - The WebSphere MQ monitoring agent will not monitor the indicated
combination of queue-sharing group and queue manager.
YES - The WebSphere MQ monitoring agent will monitor the indicated combination
of queue-sharing group and queue manager. This is the default behavior.
TAKEOVER - The WebSphere MQ monitoring agent will takeover monitoring the
indicated queue-sharing group even if another WebSphere MQ monitoring agent is
already monitoring it. (Takeover processing does not occur if the other agent also
specified TAKEOVER.)
54 Using IBM Tivoli OMEGAMON XE for WebSphere MQ Monitoring, V3.7.0](https://image.slidesharecdn.com/ibmtivoliomegamonxeforwebspheremq-usingibmtivoliomegamonxeforwebspheremqmonitoring-120524030104-phpapp01/75/Ibm-tivoli-omegamon-xe-for-web-sphere-mq-using-ibm-tivoli-omegamon-xe-for-websphere-mq-monitoring-54-2048.jpg)

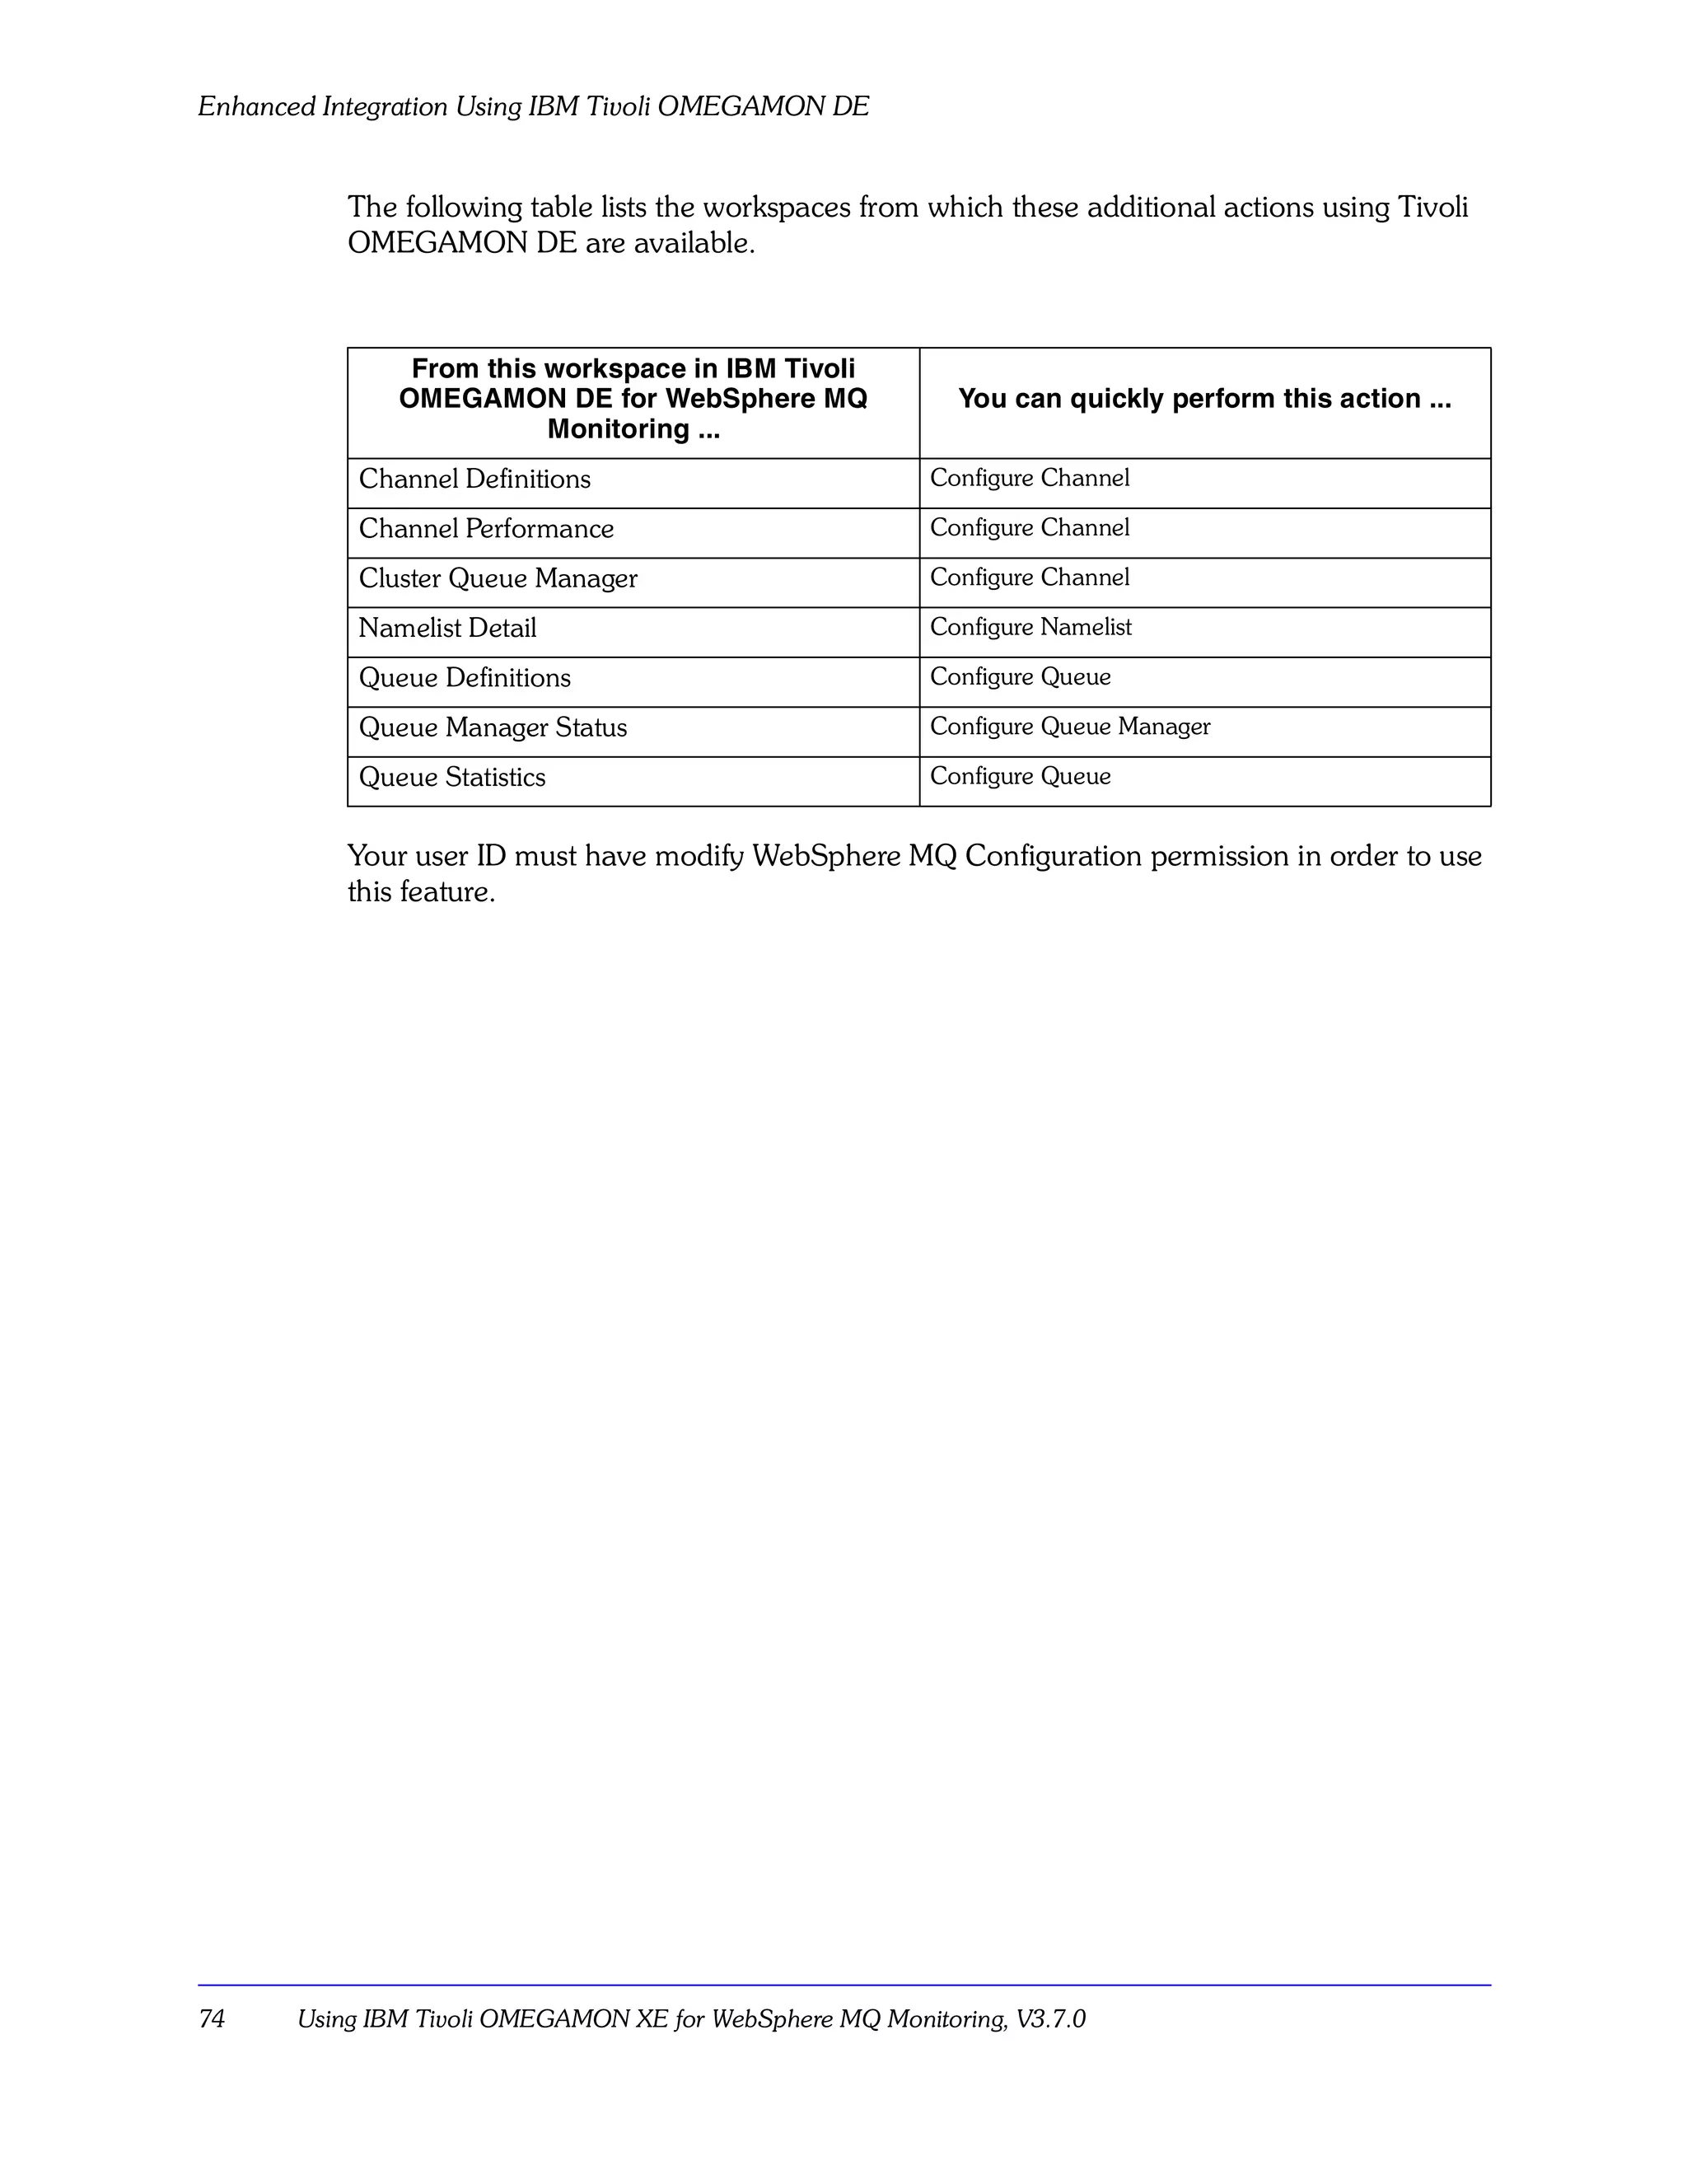


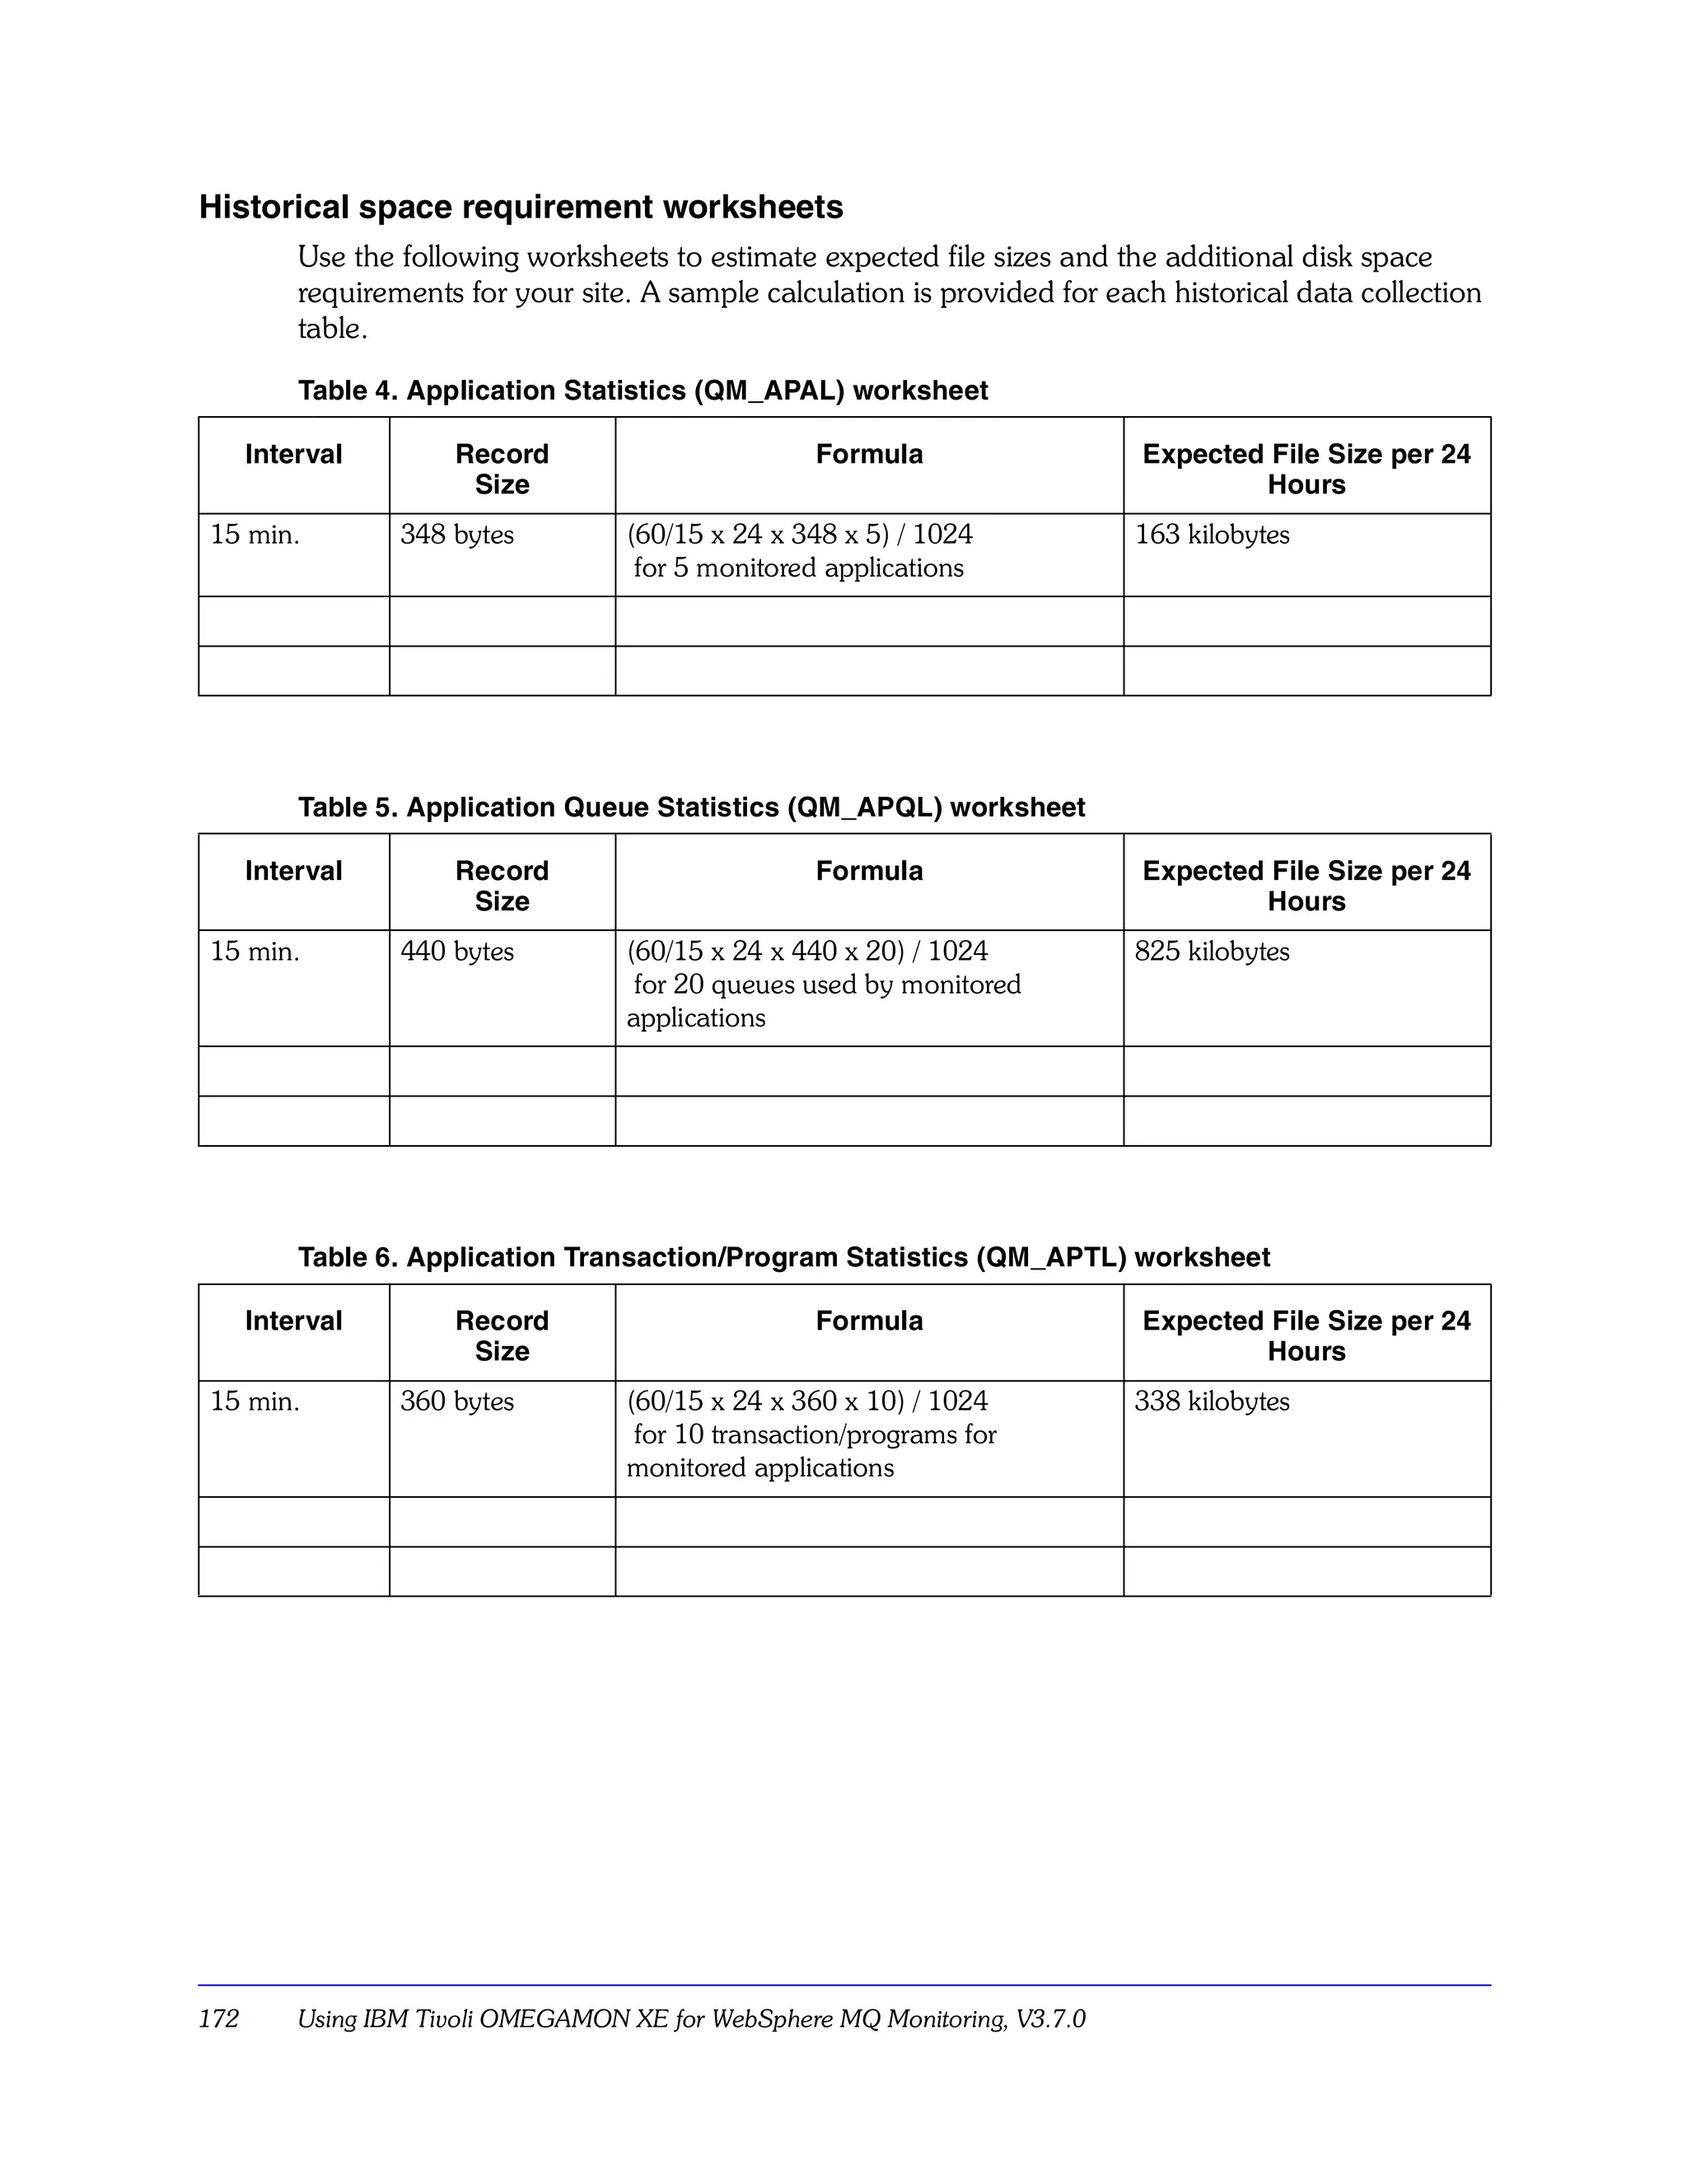


This document provides information about using IBM Tivoli OMEGAMON XE for WebSphere MQ Monitoring version 3.7.0. It introduces the product's key features for monitoring WebSphere MQ, describes how to customize monitoring options, and explains various features and workspaces. The document is intended for all users of the product and provides system administrators with details on customizing monitoring.


![Vibe Coding vs. Spec-Driven Development [Free Meetup]](https://cdn.slidesharecdn.com/ss_thumbnails/vibecodingvsspecdrivendevelopment-251209105622-43f455e7-thumbnail.jpg?width=640&height=640&fit=bounds)


![Coded Agents – with UiPath SDK + LangGraph [Virtual Hands-on Workshop]](https://cdn.slidesharecdn.com/ss_thumbnails/codedagentsdeck-251215155422-5497c599-thumbnail.jpg?width=640&height=640&fit=bounds)


