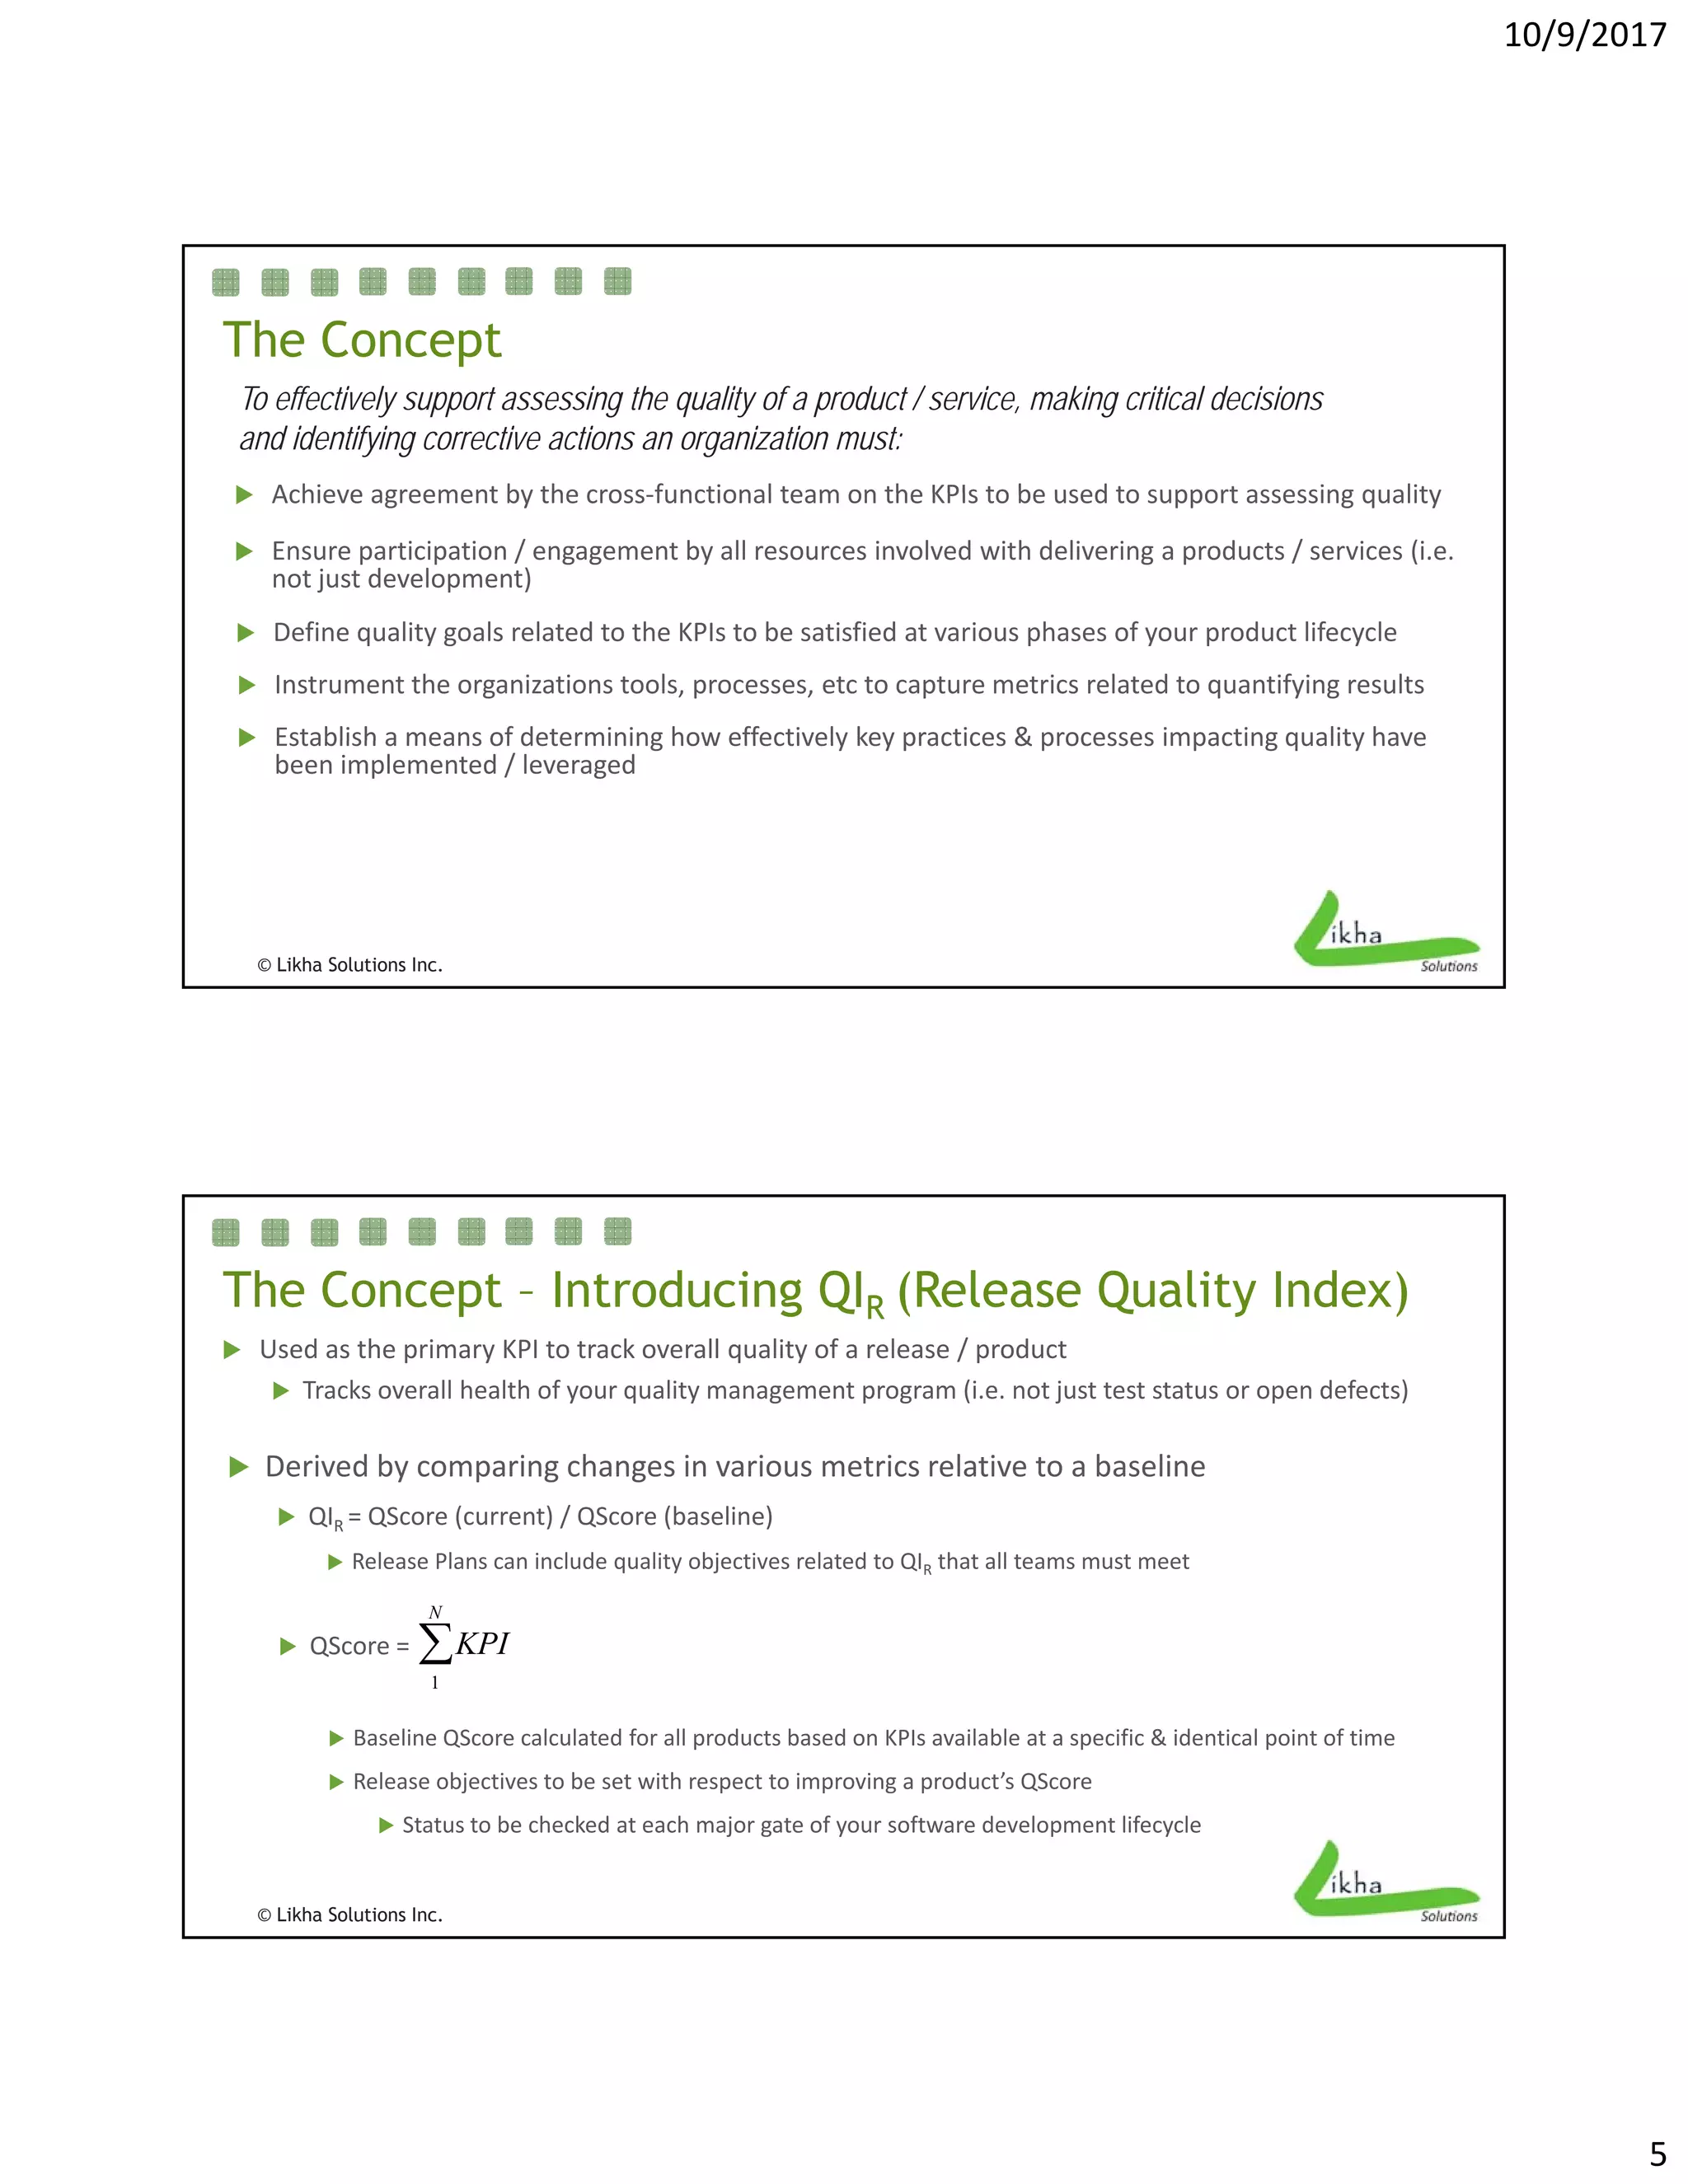
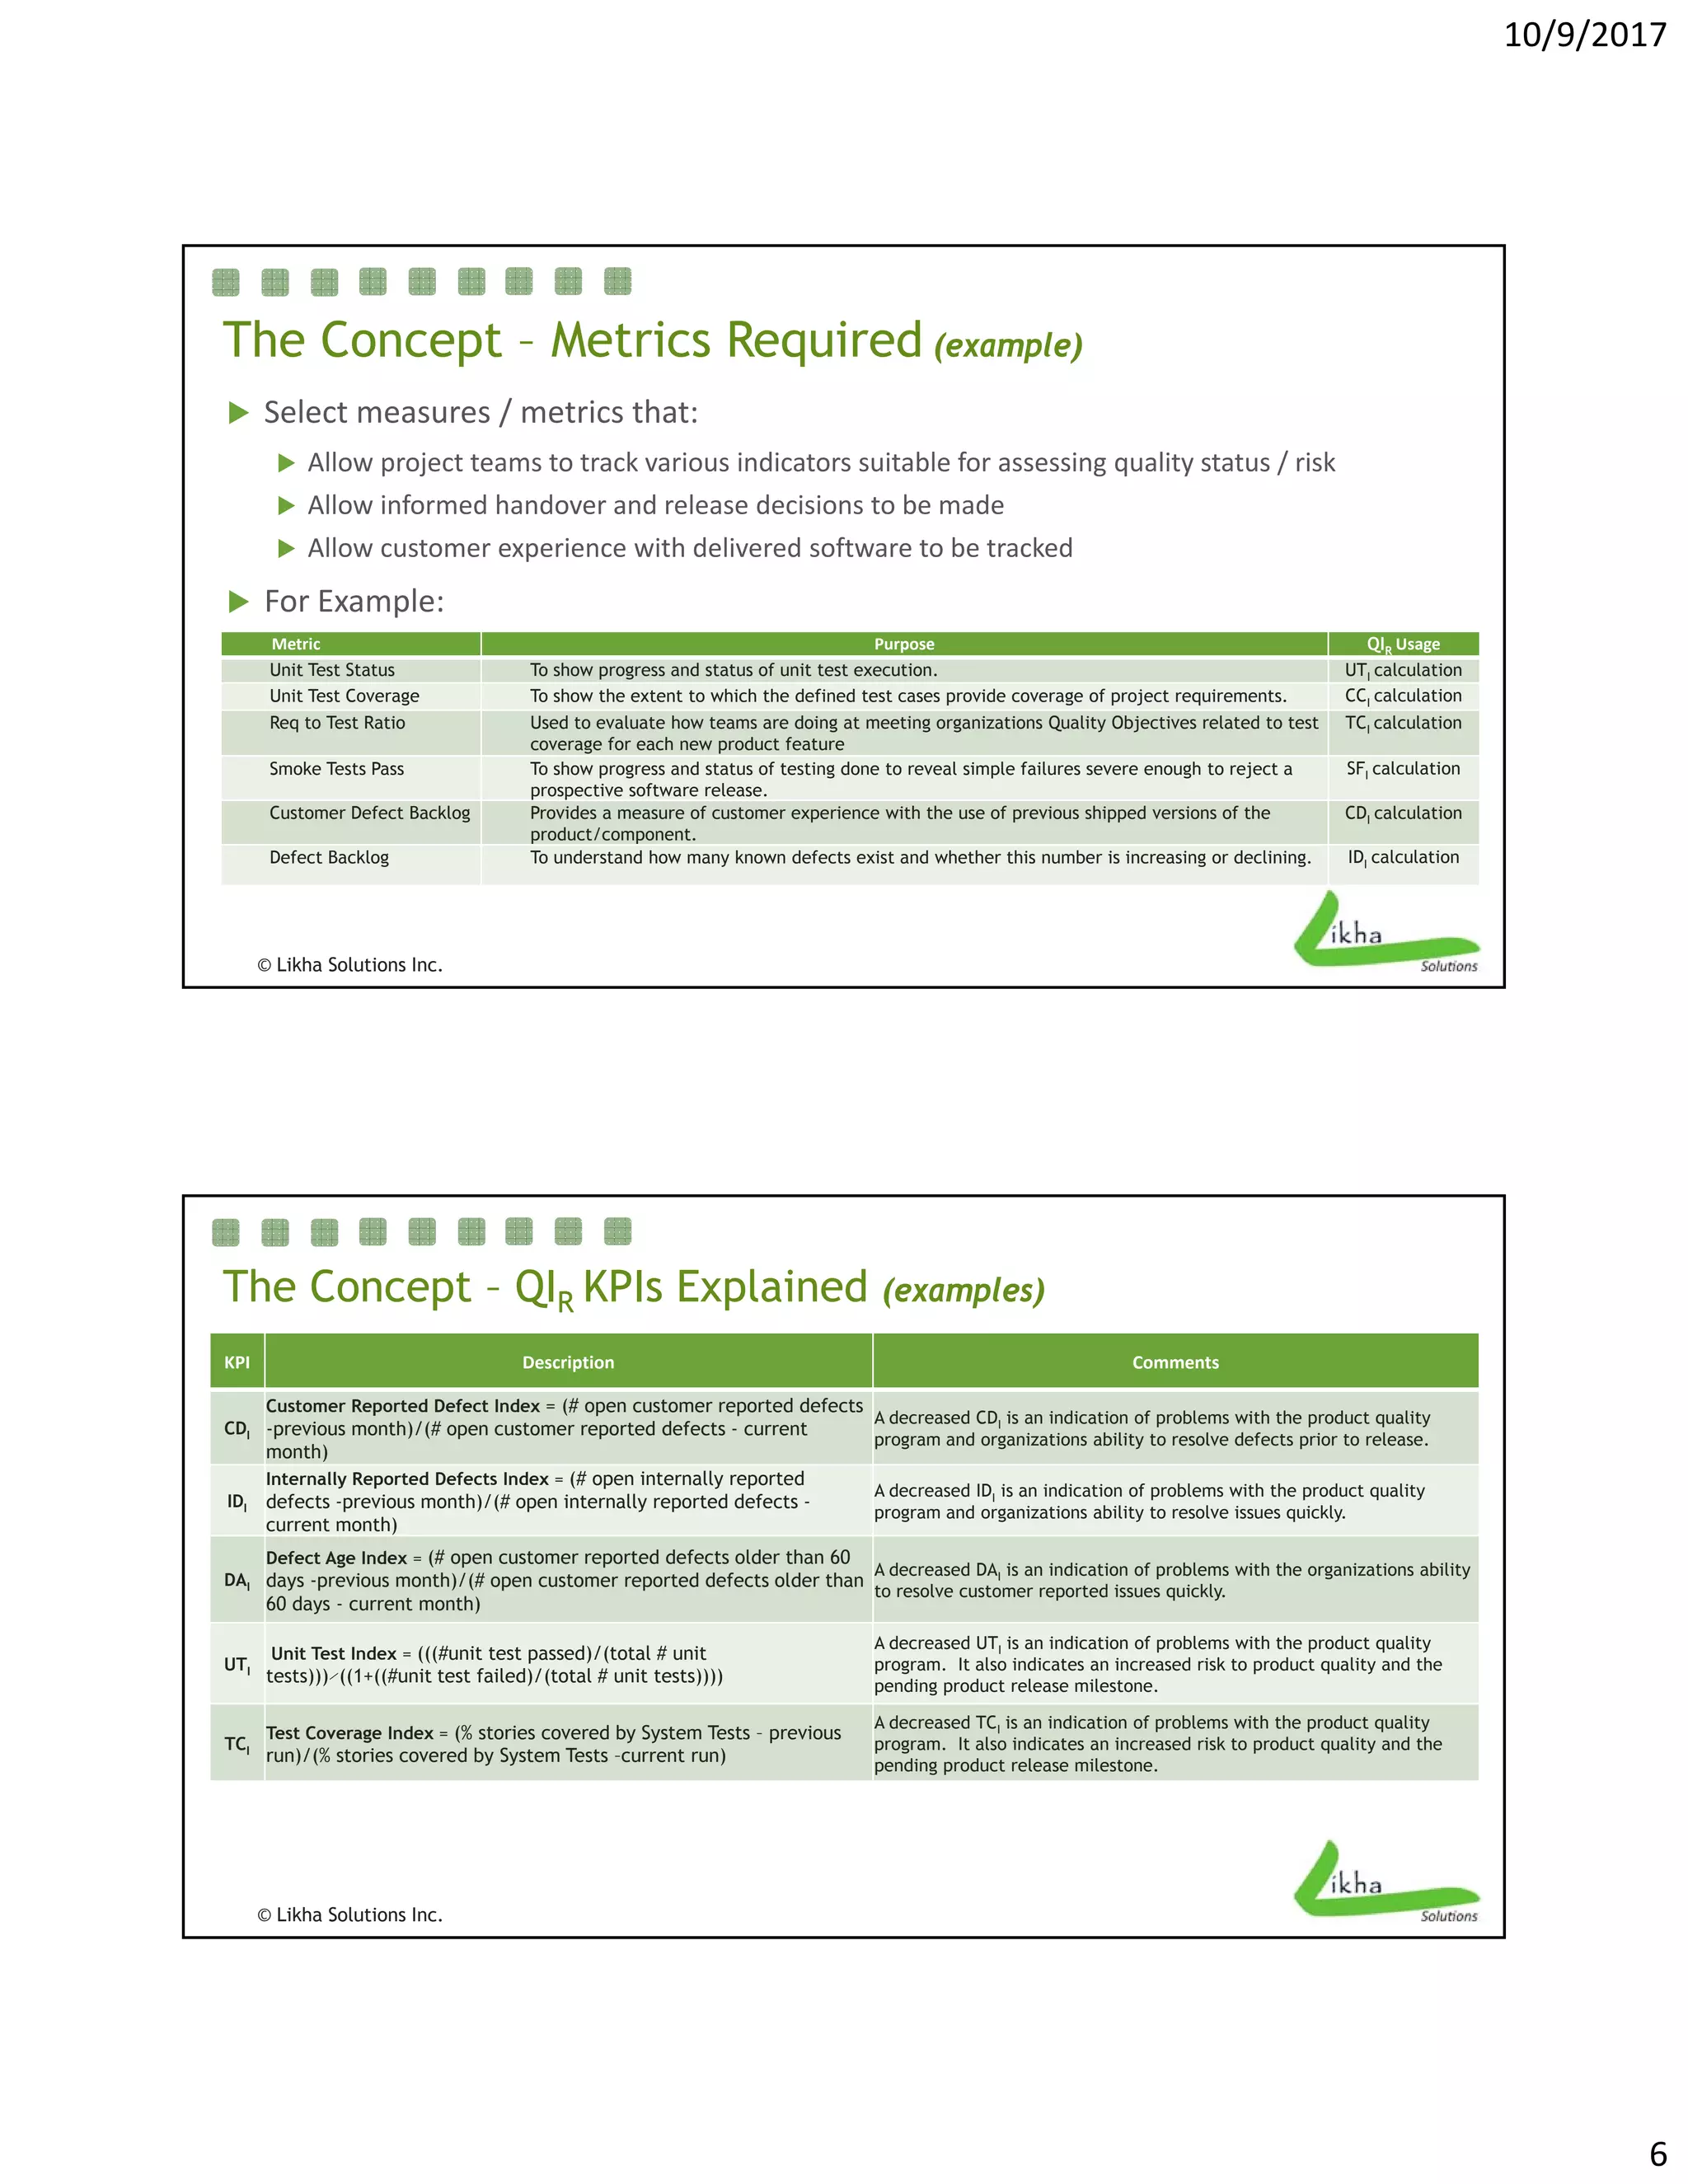
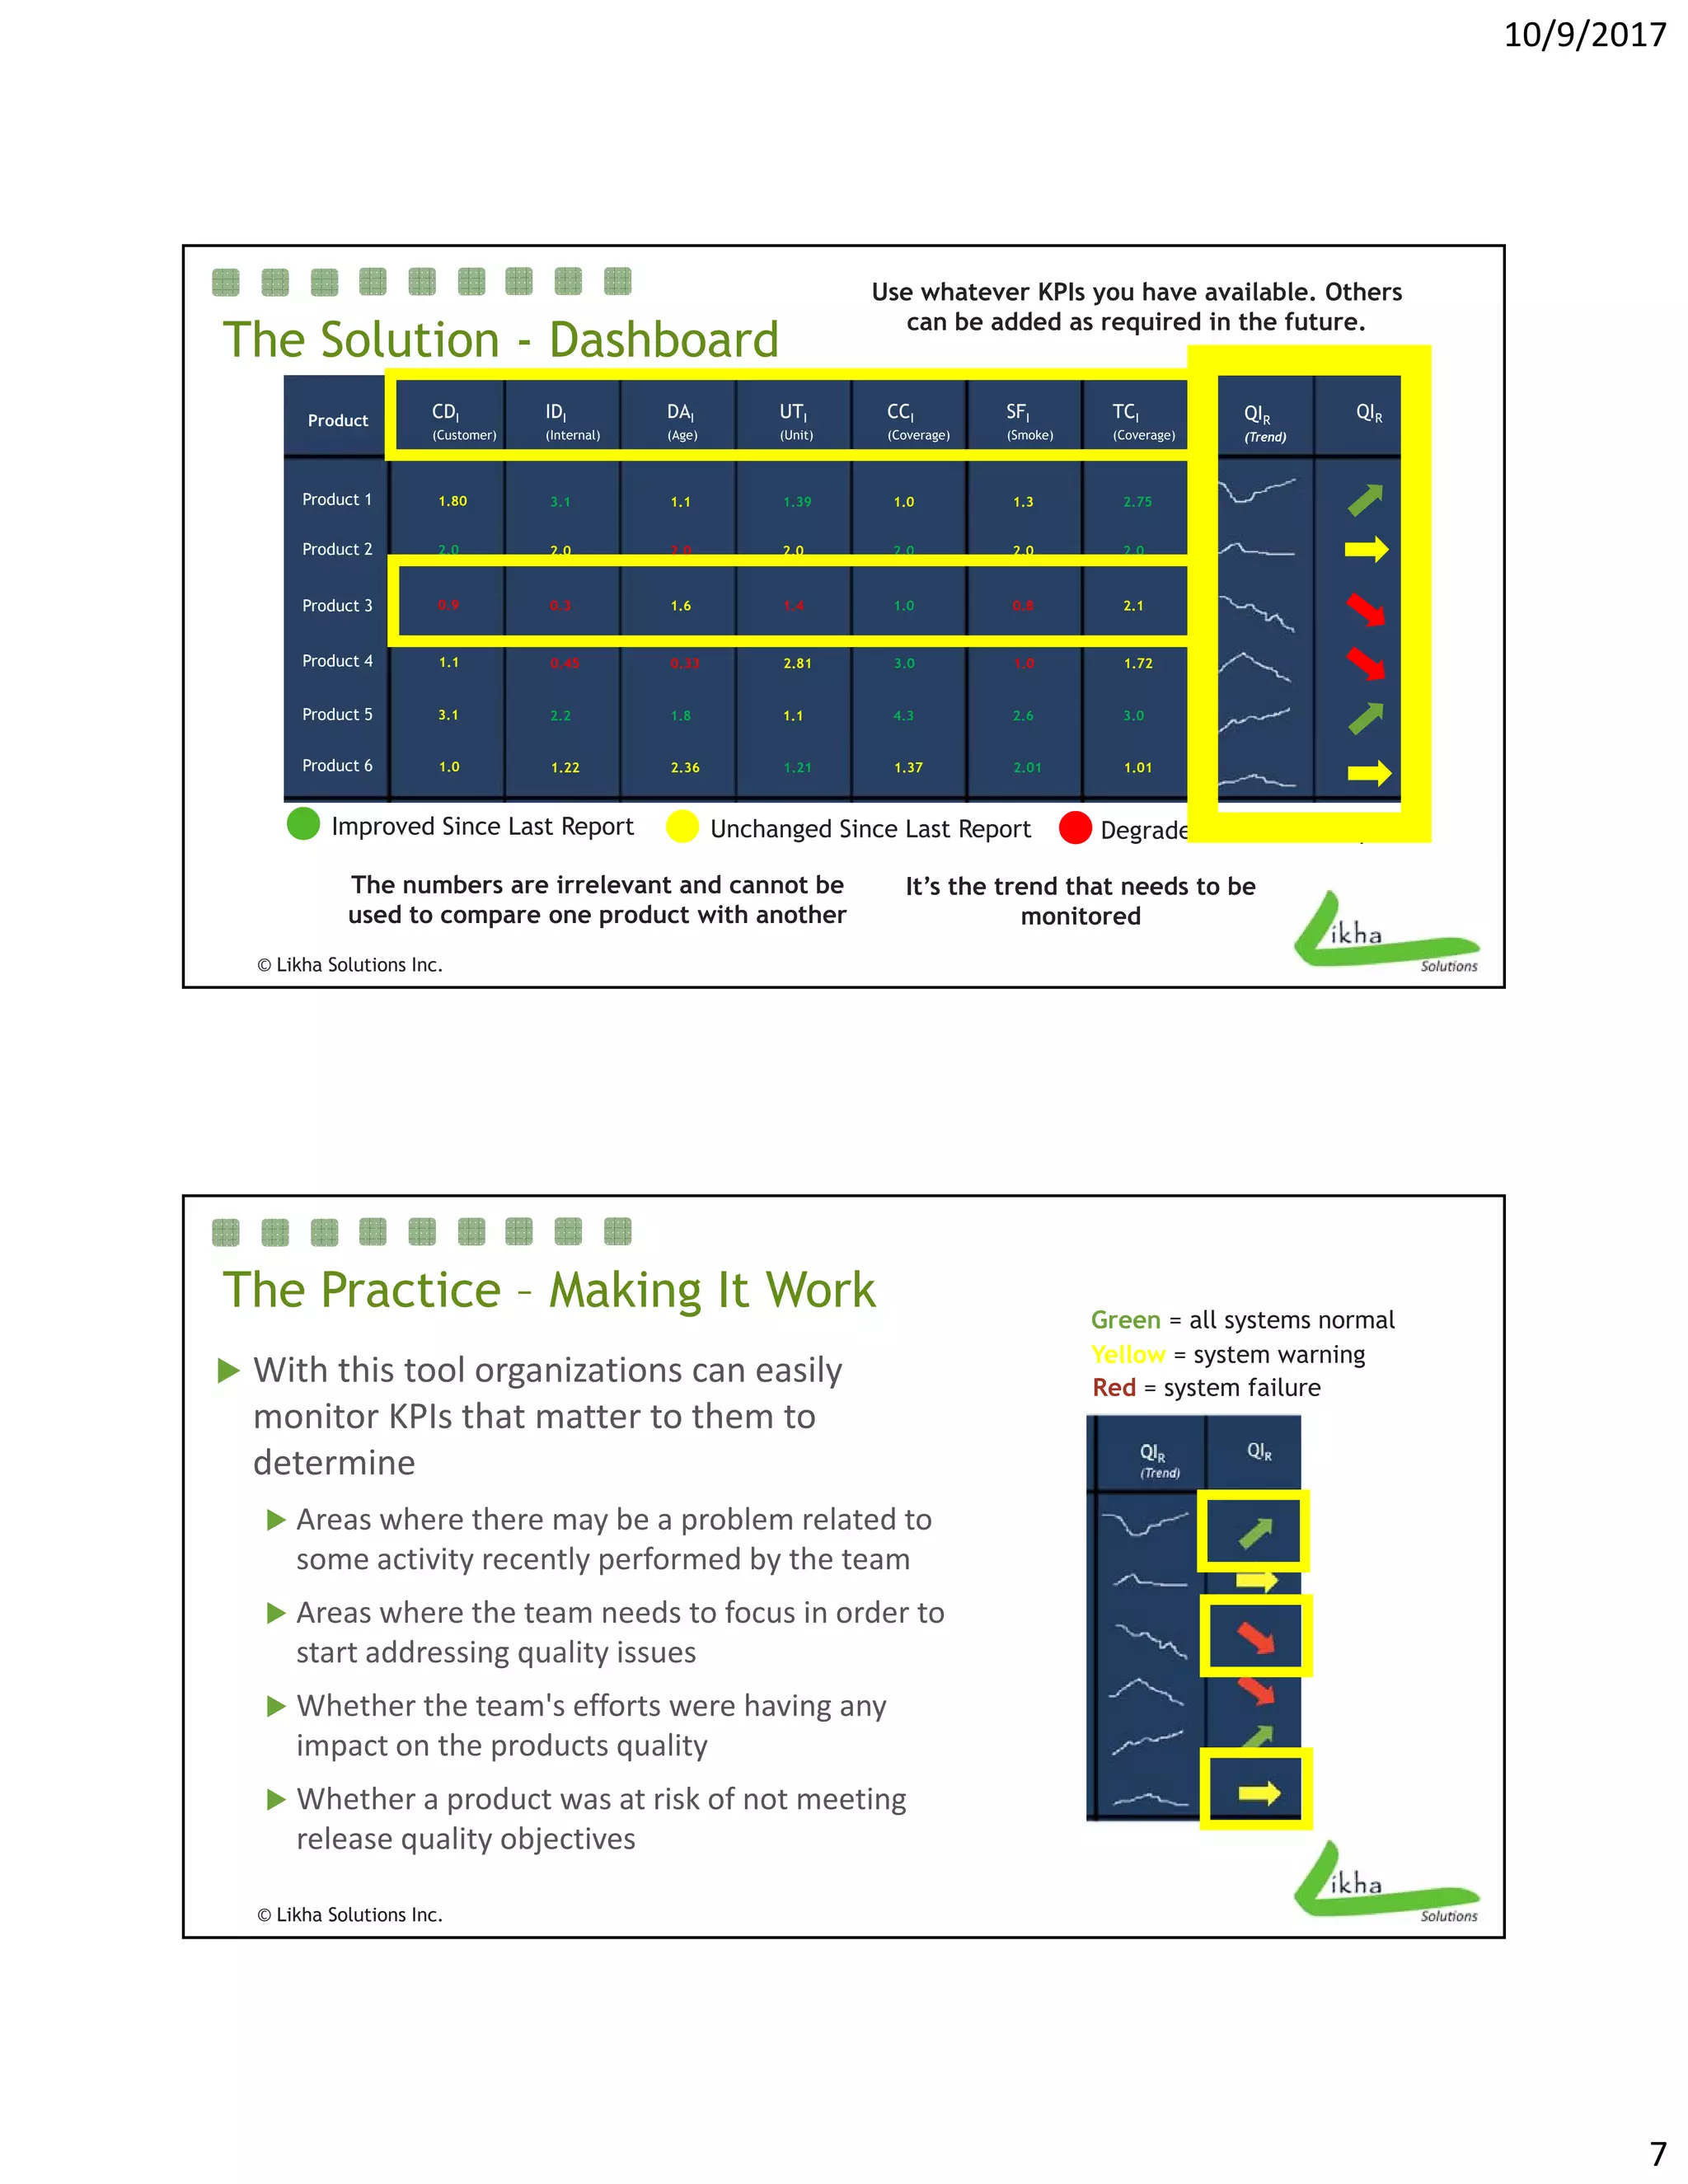
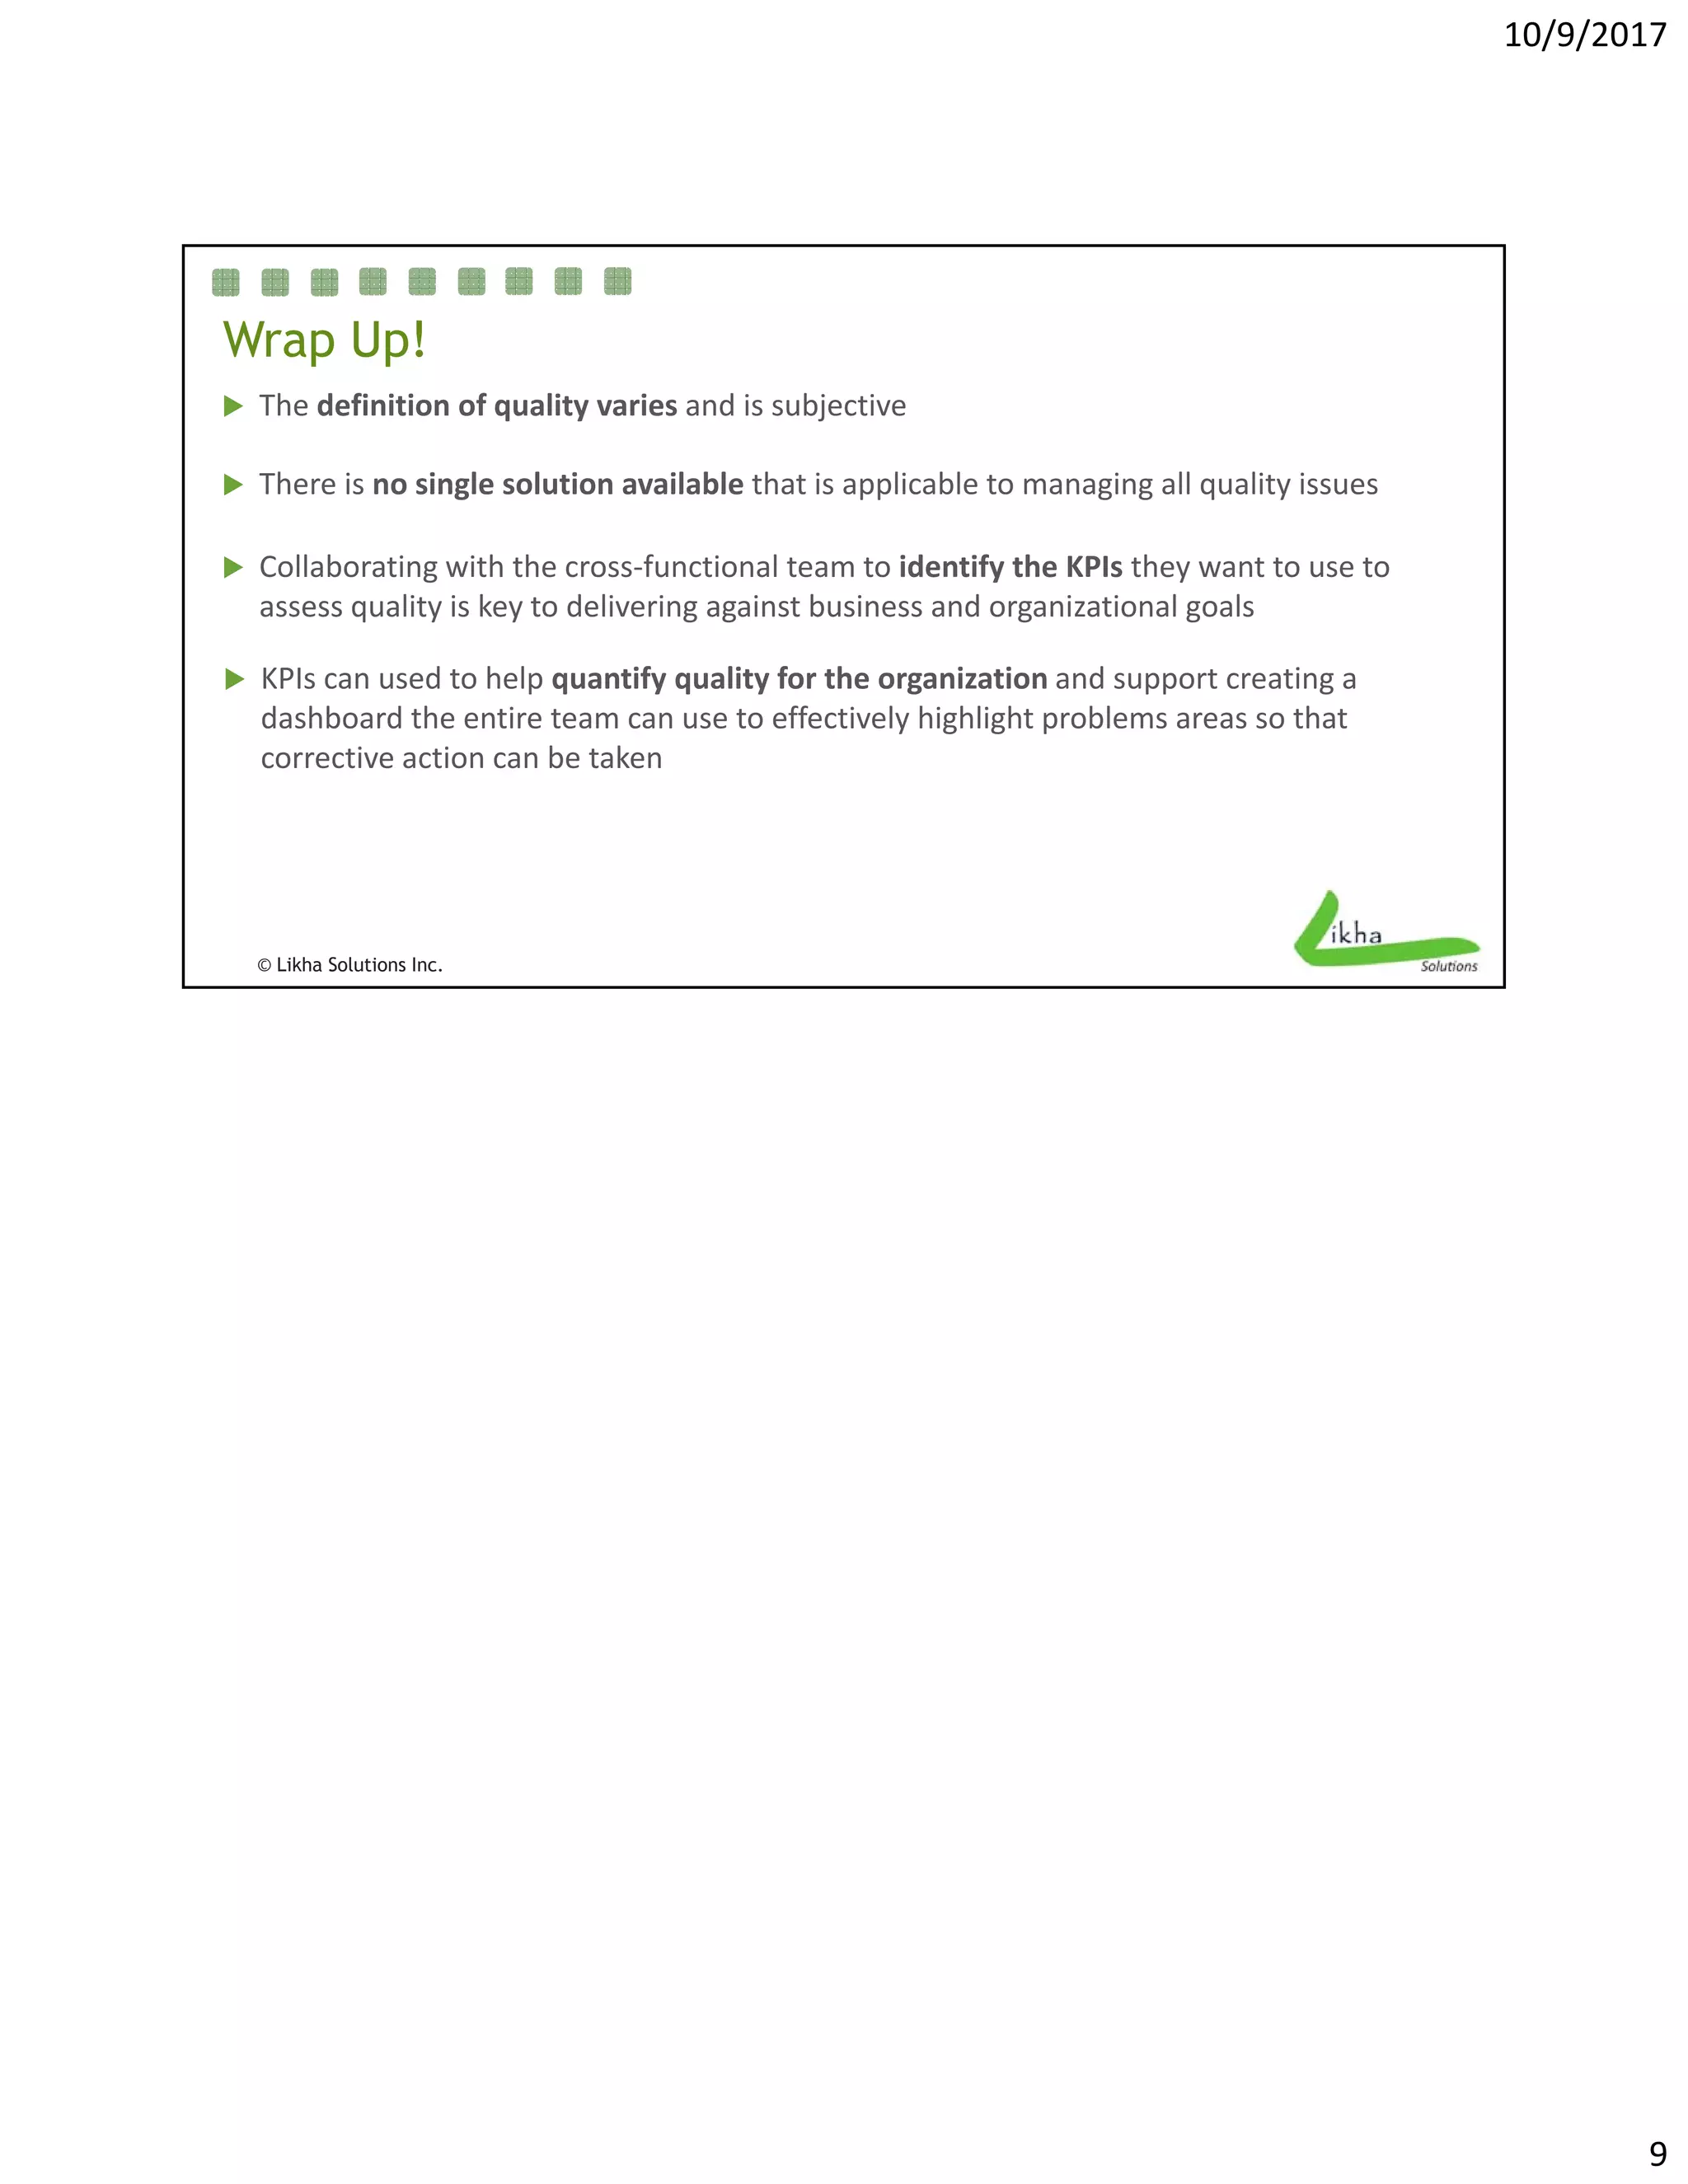
T5
Measuring Product Quality
10/19/2017 11:30:00 AM
Implementing a Test Dashboard to
Boost Quality
Presented by:
Scott Acker
Independent Consultant
Brought to you by:
350 Corporate Way, Suite 400, Orange Park, FL 32073
888-­‐268-­‐8770 ·∙ 904-­‐278-­‐0524 - info@techwell.com - https://www.techwell.com/
Scott Acker
Independent Consultant
Scott Acker is an accomplished executive and quality manager with more than
twenty years' experience in the IT industry. He has worked around the world,
performing key quality, test, and operations roles as part of small, medium, and
large companies. As a thought leader, mentor, and coach, Scott has worked with
local and globally distributed teams to create high-performing and motivated
departments that deliver bottom-line impact. Scott is a highly effective manager
adept at bringing quality and testing to the top of the conversation.
10/9/2017
1
Creating a Testing and Quality Dashboard
What is Your QScore?What	is	Your	QScore?
© Likha Solutions Inc.
Why Are You Here
 Looking for a “Silver Bullet” 
 Frustrated with lack of good tools 
 Just killing time
 Inspired by the awesome media used 
to promote this session
available to track and report issues 
impacting quality
© Likha Solutions Inc.
10/9/2017
2
What I Will Share
 The Problem
 The Answer – Not!
 The Principles
 Recap on Quality
 Quality Management
 The Concept
© Likha Solutions Inc.
 The Solution
 The Practice
The Problem
How do I know we are making How do I know we are making 
changes that are helping to improve 
the quality of the solution we 
deliver and how do I know when it is 
good enough to ship? 
© Likha Solutions Inc.
good enough to ship? 
10/9/2017
3
The Answer – Not!
 Things must be improving because:
 Fewer defects have been reported
 100% of the tests are passing
 Customer reported issues are on the decline
 The Product Support team is not complaining
 The Sales organization has not communicated any concerns
© Likha Solutions Inc.
Not The Answer – Right?
The Principles - Recap on Quality
 A subjective term for which each person has their own definition. In technical usage, 
quality can have two meanings:
 Th h t i ti f d t i th t b it bilit t ti f t t d i li d The characteristics of a product or service that bear on its ability to satisfy stated or implied 
needs 
 A product or service free of deficiencies
 The quality of a product or service refers to the perception of the degree to which the 
product or service meets the customer's expectations 
 Quality has no specific meaning unless related to a specific function and/or object 
© Likha Solutions Inc.
y p g p j
 Quality is a perceptual, conditional and somewhat subjective attribute
10/9/2017
4
The Principles - Quality Management
Quality Assurance Quality Control (aka testing)
Planned and systematic pattern of all
actions necessary to provide adequate
confidence that the product optimally
Function that includes any activity that
examines products to determine if they meet
their specificationconfidence that the product optimally
fulfills customer's expectations.
their specification
1. Makes sure that we are doing this the
right way
2. Involves collecting metrics to assess
quality
3. Focuses on building in quality and
hence preventing defects
4. Deals with process
5. Happens throughout the product
lifecycle
1. Makes sure the results of what we’ve done
are what we expected
2. Involves collecting metrics to assess
quality
3. Focuses on testing for quality and hence
detecting defects
4. Deals with product
5. Happens during the validation phase
6 Is a corrective process
© Likha Solutions Inc.
lifecycle
6. Is a preventive process
7. Involves cross-functional team
• Product Mgt
• Development
• Test Engineering
• Technical Communications
• Services & Support
6. Is a corrective process
7. Involves Test Engineers
QUALITY requires more than testing!
Everyone has a role to play!
 The definition of quality 
The Principles – Bottom Line!
 There is no single solution 
varies from one company to 
the next, from one individual 
to the next and could vary 
from one product to another 
within the same company
available that is applicable to 
managing and addressing 
every organization's quality 
issues 
© Likha Solutions Inc.
p y
10/9/2017
5
The Concept
To effectively support assessing the quality of a product / service, making critical decisions
and identifying corrective actions an organization must:
 Achieve agreement by the cross functional team on the KPIs to be used to support assessing quality
 Establish a means of determining how effectively key practices & processes impacting quality have
 Instrument the organizations tools, processes, etc to capture metrics related to quantifying results
 Achieve agreement by the cross‐functional team on the KPIs to be used to support assessing quality
 Ensure participation / engagement by all resources involved with delivering a products / services (i.e. 
not just development)
 Define quality goals related to the KPIs to be satisfied at various phases of your product lifecycle
© Likha Solutions Inc.
 Establish a means of determining how effectively key practices & processes impacting quality have 
been implemented / leveraged
The Concept – Introducing QIR (Release Quality Index)
 Used as the primary KPI to track overall quality of a release / product
 Tracks overall health of your quality management program (i.e. not just test status or open defects)
 QScore = KPI
1
N

 Derived by comparing changes in various metrics relative to a baseline
 QIR = QScore (current) / QScore (baseline)
 Release Plans can include quality objectives related to QIR that all teams must meet 
© Likha Solutions Inc.
 Baseline QScore calculated for all products based on KPIs available at a specific & identical point of time
 Release objectives to be set with respect to improving a product’s QScore
 Status to be checked at each major gate of your software development lifecycle
10/9/2017
6
The Concept – Metrics Required (example)
 Select measures / metrics that:
 Allow project teams to track various indicators suitable for assessing quality status / risk
Metric Purpose QIR Usage
Unit Test Status To show progress and status of unit test execution. UTI calculation
Unit Test Coverage To show the extent to which the defined test cases provide coverage of project requirements. CCI calculation
Req to Test Ratio Used to evaluate how teams are doing at meeting organizations Quality Objectives related to test
co erage for each ne prod ct feat re
TCI calculation
 Allow informed handover and release decisions to be made
 Allow customer experience with delivered software to be tracked
 For Example:
© Likha Solutions Inc.
coverage for each new product feature
Smoke Tests Pass To show progress and status of testing done to reveal simple failures severe enough to reject a
prospective software release.
SFI calculation
Customer Defect Backlog Provides a measure of customer experience with the use of previous shipped versions of the
product/component.
CDI calculation
Defect Backlog To understand how many known defects exist and whether this number is increasing or declining. IDI calculation
KPI Description Comments
CDI
Customer Reported Defect Index = (# open customer reported defects
-previous month)/(# open customer reported defects - current
A decreased CDI is an indication of problems with the product quality
program and organizations ability to resolve defects prior to release
The Concept – QIR KPIs Explained (examples)
month)
program and organizations ability to resolve defects prior to release.
IDI
Internally Reported Defects Index = (# open internally reported
defects -previous month)/(# open internally reported defects -
current month)
A decreased IDI is an indication of problems with the product quality
program and organizations ability to resolve issues quickly.
DAI
Defect Age Index = (# open customer reported defects older than 60
days -previous month)/(# open customer reported defects older than
60 days - current month)
A decreased DAI is an indication of problems with the organizations ability
to resolve customer reported issues quickly.
UTI
Unit Test Index = (((#unit test passed)/(total # unit
tests)))⁄((1+((#unit test failed)/(total # unit tests))))
A decreased UTI is an indication of problems with the product quality
program. It also indicates an increased risk to product quality and the
pending product release milestone.
© Likha Solutions Inc.
pending product release milestone.
TCI
Test Coverage Index = (% stories covered by System Tests – previous
run)/(% stories covered by System Tests –current run)
A decreased TCI is an indication of problems with the product quality
program. It also indicates an increased risk to product quality and the
pending product release milestone.
10/9/2017
7
The Solution - Dashboard
QIRCDI
(Customer)
DAI
(Age)
IDI
(Internal)
SFI
(Smoke)
UTI
(Unit)
CCI
(Coverage)
TCI
(Coverage)
QIR
(Trend)
Product
Use whatever KPIs you have available. Others
can be added as required in the future.
1.80
2.0
0.9
1.1
3.1
3.1
2.0
0.3
0.45
2.2
1.1
2.0
1.6
0.33
1.8
1.39
2.0
1.4
2.81
1.1
1.0
2.0
1.0
3.0
4.3
1.3
2.0
0.8
1.0
2.6
2.75
2.0
2.1
1.72
3.0
Product 1
Product 2
Product 3
Product 4
Product 5
© Likha Solutions Inc.
1.0 1.22 2.36 1.21 1.37 2.01 1.01Product 6
Improved Since Last Report Unchanged Since Last Report Degraded Since Last Report
The numbers are irrelevant and cannot be
used to compare one product with another
It’s the trend that needs to be
monitored
The Practice – Making It Work
 With this tool organizations can easily 
monitor KPIs that matter to them to 
Green = all systems normal
Yellow = system warning
Red = system failure
determine
 Areas where there may be a problem related to 
some activity recently performed by the team
 Areas where the team needs to focus in order to 
start addressing quality issues
© Likha Solutions Inc.
 Whether the team's efforts were having any 
impact on the products quality
 Whether a product was at risk of not meeting 
release quality objectives
10/9/2017
8
The Practice – Making It Work
Similar to an automobile dashboard
© Likha Solutions Inc.
The Practice – Example
Product 1
 QIR is trending positive; however, several KPIs are “Yellow”, meaning:
© Likha Solutions Inc.
 There has not been any improvement done by the team for these indicators that has helped the products overall QScore
Product 4
 QIR is trending negative and there are several KPIs that are “Red”, meaning:
 The team needs to take action to determine what steps are necessary to drive improvements (e.g. address customer reported 
issues, internally reported issues, etc)
10/9/2017
9
Wrap Up!
 The definition of quality varies and is subjective
 There is no single solution available that is applicable to managing all quality issues There is no single solution available that is applicable to managing all quality issues 
 Collaborating with the cross‐functional team to identify the KPIs they want to use to 
assess quality is key to delivering against business and organizational goals
 KPIs can used to help quantify quality for the organization and support creating a 
dashboard the entire team can use to effectively highlight problems areas so that 
© Likha Solutions Inc.
corrective action can be taken

Implementing a Test Dashboard to Boost Quality

  • 1.
    T5 Measuring Product Quality 10/19/201711:30:00 AM Implementing a Test Dashboard to Boost Quality Presented by: Scott Acker Independent Consultant Brought to you by: 350 Corporate Way, Suite 400, Orange Park, FL 32073 888-­‐268-­‐8770 ·∙ 904-­‐278-­‐0524 - info@techwell.com - https://www.techwell.com/
  • 2.
    Scott Acker Independent Consultant ScottAcker is an accomplished executive and quality manager with more than twenty years' experience in the IT industry. He has worked around the world, performing key quality, test, and operations roles as part of small, medium, and large companies. As a thought leader, mentor, and coach, Scott has worked with local and globally distributed teams to create high-performing and motivated departments that deliver bottom-line impact. Scott is a highly effective manager adept at bringing quality and testing to the top of the conversation.
  • 3.
    10/9/2017 1 Creating a Testingand Quality Dashboard What is Your QScore?What is Your QScore? © Likha Solutions Inc. Why Are You Here  Looking for a “Silver Bullet”   Frustrated with lack of good tools   Just killing time  Inspired by the awesome media used  to promote this session available to track and report issues  impacting quality © Likha Solutions Inc.
  • 4.
    10/9/2017 2 What I WillShare  The Problem  The Answer – Not!  The Principles  Recap on Quality  Quality Management  The Concept © Likha Solutions Inc.  The Solution  The Practice The Problem How do I know we are making How do I know we are making  changes that are helping to improve  the quality of the solution we  deliver and how do I know when it is  good enough to ship?  © Likha Solutions Inc. good enough to ship? 
  • 5.
    10/9/2017 3 The Answer –Not!  Things must be improving because:  Fewer defects have been reported  100% of the tests are passing  Customer reported issues are on the decline  The Product Support team is not complaining  The Sales organization has not communicated any concerns © Likha Solutions Inc. Not The Answer – Right? The Principles - Recap on Quality  A subjective term for which each person has their own definition. In technical usage,  quality can have two meanings:  Th h t i ti f d t i th t b it bilit t ti f t t d i li d The characteristics of a product or service that bear on its ability to satisfy stated or implied  needs   A product or service free of deficiencies  The quality of a product or service refers to the perception of the degree to which the  product or service meets the customer's expectations   Quality has no specific meaning unless related to a specific function and/or object  © Likha Solutions Inc. y p g p j  Quality is a perceptual, conditional and somewhat subjective attribute
  • 6.
    10/9/2017 4 The Principles -Quality Management Quality Assurance Quality Control (aka testing) Planned and systematic pattern of all actions necessary to provide adequate confidence that the product optimally Function that includes any activity that examines products to determine if they meet their specificationconfidence that the product optimally fulfills customer's expectations. their specification 1. Makes sure that we are doing this the right way 2. Involves collecting metrics to assess quality 3. Focuses on building in quality and hence preventing defects 4. Deals with process 5. Happens throughout the product lifecycle 1. Makes sure the results of what we’ve done are what we expected 2. Involves collecting metrics to assess quality 3. Focuses on testing for quality and hence detecting defects 4. Deals with product 5. Happens during the validation phase 6 Is a corrective process © Likha Solutions Inc. lifecycle 6. Is a preventive process 7. Involves cross-functional team • Product Mgt • Development • Test Engineering • Technical Communications • Services & Support 6. Is a corrective process 7. Involves Test Engineers QUALITY requires more than testing! Everyone has a role to play!  The definition of quality  The Principles – Bottom Line!  There is no single solution  varies from one company to  the next, from one individual  to the next and could vary  from one product to another  within the same company available that is applicable to  managing and addressing  every organization's quality  issues  © Likha Solutions Inc. p y
  • 7.
    10/9/2017 5 The Concept To effectivelysupport assessing the quality of a product / service, making critical decisions and identifying corrective actions an organization must:  Achieve agreement by the cross functional team on the KPIs to be used to support assessing quality  Establish a means of determining how effectively key practices & processes impacting quality have  Instrument the organizations tools, processes, etc to capture metrics related to quantifying results  Achieve agreement by the cross‐functional team on the KPIs to be used to support assessing quality  Ensure participation / engagement by all resources involved with delivering a products / services (i.e.  not just development)  Define quality goals related to the KPIs to be satisfied at various phases of your product lifecycle © Likha Solutions Inc.  Establish a means of determining how effectively key practices & processes impacting quality have  been implemented / leveraged The Concept – Introducing QIR (Release Quality Index)  Used as the primary KPI to track overall quality of a release / product  Tracks overall health of your quality management program (i.e. not just test status or open defects)  QScore = KPI 1 N   Derived by comparing changes in various metrics relative to a baseline  QIR = QScore (current) / QScore (baseline)  Release Plans can include quality objectives related to QIR that all teams must meet  © Likha Solutions Inc.  Baseline QScore calculated for all products based on KPIs available at a specific & identical point of time  Release objectives to be set with respect to improving a product’s QScore  Status to be checked at each major gate of your software development lifecycle
  • 8.
    10/9/2017 6 The Concept –Metrics Required (example)  Select measures / metrics that:  Allow project teams to track various indicators suitable for assessing quality status / risk Metric Purpose QIR Usage Unit Test Status To show progress and status of unit test execution. UTI calculation Unit Test Coverage To show the extent to which the defined test cases provide coverage of project requirements. CCI calculation Req to Test Ratio Used to evaluate how teams are doing at meeting organizations Quality Objectives related to test co erage for each ne prod ct feat re TCI calculation  Allow informed handover and release decisions to be made  Allow customer experience with delivered software to be tracked  For Example: © Likha Solutions Inc. coverage for each new product feature Smoke Tests Pass To show progress and status of testing done to reveal simple failures severe enough to reject a prospective software release. SFI calculation Customer Defect Backlog Provides a measure of customer experience with the use of previous shipped versions of the product/component. CDI calculation Defect Backlog To understand how many known defects exist and whether this number is increasing or declining. IDI calculation KPI Description Comments CDI Customer Reported Defect Index = (# open customer reported defects -previous month)/(# open customer reported defects - current A decreased CDI is an indication of problems with the product quality program and organizations ability to resolve defects prior to release The Concept – QIR KPIs Explained (examples) month) program and organizations ability to resolve defects prior to release. IDI Internally Reported Defects Index = (# open internally reported defects -previous month)/(# open internally reported defects - current month) A decreased IDI is an indication of problems with the product quality program and organizations ability to resolve issues quickly. DAI Defect Age Index = (# open customer reported defects older than 60 days -previous month)/(# open customer reported defects older than 60 days - current month) A decreased DAI is an indication of problems with the organizations ability to resolve customer reported issues quickly. UTI Unit Test Index = (((#unit test passed)/(total # unit tests)))⁄((1+((#unit test failed)/(total # unit tests)))) A decreased UTI is an indication of problems with the product quality program. It also indicates an increased risk to product quality and the pending product release milestone. © Likha Solutions Inc. pending product release milestone. TCI Test Coverage Index = (% stories covered by System Tests – previous run)/(% stories covered by System Tests –current run) A decreased TCI is an indication of problems with the product quality program. It also indicates an increased risk to product quality and the pending product release milestone.
  • 9.
    10/9/2017 7 The Solution -Dashboard QIRCDI (Customer) DAI (Age) IDI (Internal) SFI (Smoke) UTI (Unit) CCI (Coverage) TCI (Coverage) QIR (Trend) Product Use whatever KPIs you have available. Others can be added as required in the future. 1.80 2.0 0.9 1.1 3.1 3.1 2.0 0.3 0.45 2.2 1.1 2.0 1.6 0.33 1.8 1.39 2.0 1.4 2.81 1.1 1.0 2.0 1.0 3.0 4.3 1.3 2.0 0.8 1.0 2.6 2.75 2.0 2.1 1.72 3.0 Product 1 Product 2 Product 3 Product 4 Product 5 © Likha Solutions Inc. 1.0 1.22 2.36 1.21 1.37 2.01 1.01Product 6 Improved Since Last Report Unchanged Since Last Report Degraded Since Last Report The numbers are irrelevant and cannot be used to compare one product with another It’s the trend that needs to be monitored The Practice – Making It Work  With this tool organizations can easily  monitor KPIs that matter to them to  Green = all systems normal Yellow = system warning Red = system failure determine  Areas where there may be a problem related to  some activity recently performed by the team  Areas where the team needs to focus in order to  start addressing quality issues © Likha Solutions Inc.  Whether the team's efforts were having any  impact on the products quality  Whether a product was at risk of not meeting  release quality objectives
  • 10.
    10/9/2017 8 The Practice –Making It Work Similar to an automobile dashboard © Likha Solutions Inc. The Practice – Example Product 1  QIR is trending positive; however, several KPIs are “Yellow”, meaning: © Likha Solutions Inc.  There has not been any improvement done by the team for these indicators that has helped the products overall QScore Product 4  QIR is trending negative and there are several KPIs that are “Red”, meaning:  The team needs to take action to determine what steps are necessary to drive improvements (e.g. address customer reported  issues, internally reported issues, etc)
  • 11.
    10/9/2017 9 Wrap Up!  The definition of quality varies and is subjective There is no single solution available that is applicable to managing all quality issues There is no single solution available that is applicable to managing all quality issues   Collaborating with the cross‐functional team to identify the KPIs they want to use to  assess quality is key to delivering against business and organizational goals  KPIs can used to help quantify quality for the organization and support creating a  dashboard the entire team can use to effectively highlight problems areas so that  © Likha Solutions Inc. corrective action can be taken