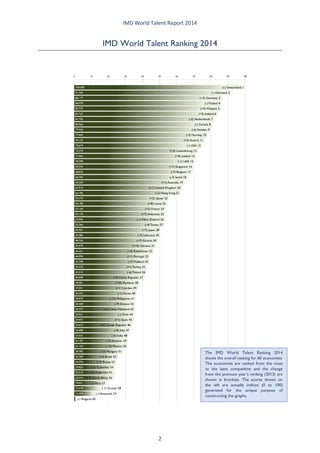
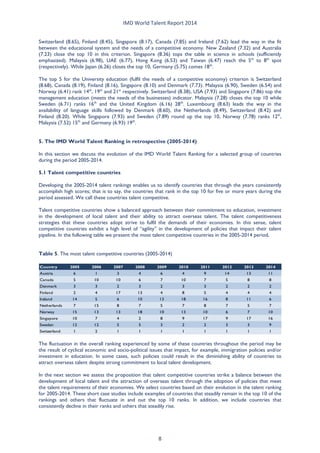
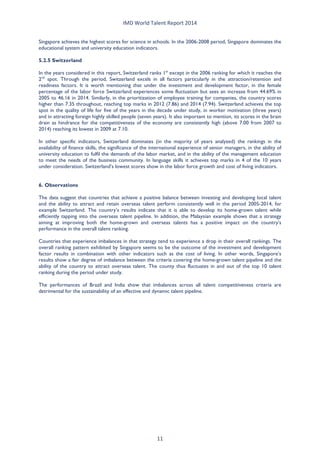
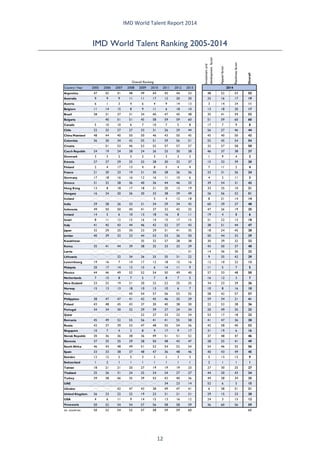
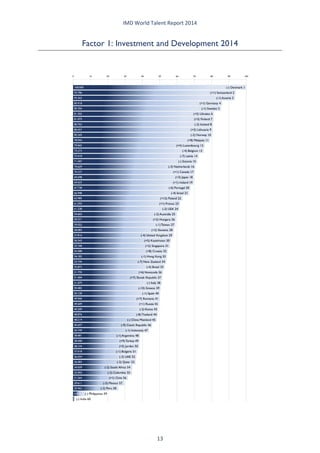
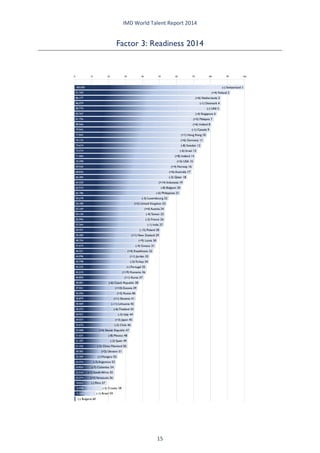
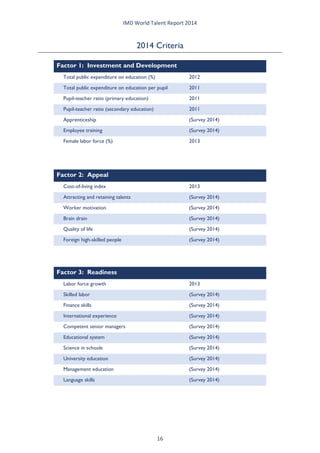
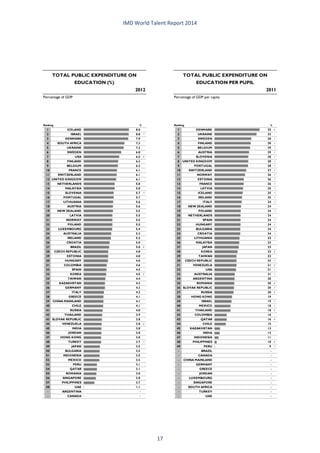
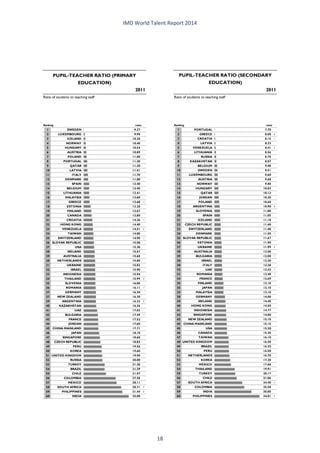
2014 
IMD World 
Talent Report 
By the IMD World Competitiveness Center
IMD World Talent Report 2014 
November 2014 
IMD World Talent Report 2014 
Copyright © 2014 by IMD: 
Institute for Management Development, Lausanne, Switzerland 
For further information, please contact the 
IMD World Competitiveness Center at: 
IMD 
23, Ch. de Bellerive 
P.O. Box 915 
CH-1001 Lausanne 
Switzerland 
Tel : +41 21 618 02 51 
Fax : +41 21 618 02 04 
e-mail : wccinfo@imd.org 
Internet: www.imd.org/wcc 
eShop: www.wcceshop.org 
The IMD World Competitiveness Center team: 
At IMD Professor Arturo Bris Director of IMD World Competitiveness Center 
José Caballero Research Fellow 
Anne-France Borgeaud Pierazzi Senior Economist & Head of WCC Operations 
Madeleine Hediger Data Research and Online Services Specialist 
Carin Grydbeck Projects, Marketing and Press Coordinator 
William Milner Information Researcher 
Catherine Jobin Order and Sales administrator 
Luchia Mallet Programs and Client Relationship Associate Manager 
With the collaboration of IMD’s Information Center and Information Systems Department 
At KAESCO Jean-François Kaeser 
Consulting 
We also have the privilege of collaborating with a unique network of Partner Institutes, and other organizations, which guarantees the relevance of the data gathered.
IMD World Talent Report 2014 
Table of Contents 
IMD World Talent Ranking 2014 ............................................................................................................. 2 
Analysis ................................................................................................................................................... 3 
IMD World Talent Ranking 2005-2014 ................................................................................................. 12 
Factor Rankings 2014 ............................................................................................................................ 13 
2014 Criteria ......................................................................................................................................... 16 
Notes and Sources ................................................................................................................................ 29 
Partner Institutes .................................................................................................................................. 32 
1
IMD World Talent Report 2014 
IMD World Talent Ranking 2014 
The IMD World Talent Ranking 2014 shows the overall ranking for 60 economies. The economies are ranked from the most to the least competitive and the change from the previous year’s ranking (2013) are shown in brackets. The scores shown on the left are actually indices (0 to 100) generated for the unique purpose of constructing the graphs. 2
IMD World Talent Report 2014 
Analysis 
1. Introduction 
The IMD World Competitiveness Center is delighted to present its IMD World Talent Report 2014, which includes a talent ranking for all countries that are part of the IMD World Competitiveness Yearbook (60 countries as of 2014). The data are gathered from the Center’s extensive database, which encompasses 19 years of competitiveness-related data. Access to such a comprehensive repository of data allows us to trace the evolution of the ranking over the last decade. 
The objective of the IMD World Talent Ranking is to assess the ability of countries to develop, attract and retain talent to sustain the talent pool available for enterprises operating in those economies. To this aim, it is important to assess how countries evolve within the talent ranking. Relevant data have thus been compiled from 2005 to 2014 and the ranking is based on both hard data and survey data. While the hard data have been gathered from various sources (see Appendix1), the survey data were obtained from the Center’s executive opinion survey, designed for the World Competitiveness Yearbook. 
We first present the 2014 World Talent Ranking to set the stage for the discussion and assessment of the evolution of the ranking. Although in the discussion that follows, we make reference to details of the performance of selected countries at the overall ranking and criterion level, we do not include all data in this report. Rather, for the evolution of the ranking we present only the overall ranking for all the years included in the report. We present data at all levels (i.e., criterion, factor and overall ranking) for the 2014 ranking. Interested readers can access data for all criteria employed in the development of this report through the World Competitiveness Online website. 
We have identified a list of talent competitive countries based on their 2005 to 2014 performance in the World Talent Ranking. These are the countries that have achieved a top 10 spot in the ranking for five or more years during the period of study. Such a performance is the result of an approach to talent competitiveness based on a balanced commitment to the development of home-grown talent and the attraction of overseas talent through policies that strive to meet the talent demands of the country. 
2. The structure of the IMD World Talent Ranking 
The ranking is structured according to three factors: 1) investment and development, 2) appeal and 3) readiness: 
The investment and development factor takes into account the investment in and development of the home- grown talent. It traces the size of public investment on education by incorporating an indicator of public expenditure. It also looks at the quality of education through indicators related to pupil-teacher ratios. The development of talent is covered by variables related to the implementation of apprenticeship and the priority of employee training for companies. It also looks at the development of the female labor force. 
The appeal factor goes beyond the focus on the local labor force to incorporate into the analysis the ability of the country to tap into the overseas talent pool. It does so by including indicators such as the cost of living and quality of life in a particular economy. Specifically, it examines the ability of a country to attract highly-skilled foreign labor. In addition, it assesses the way enterprises prioritize the attraction and retention of talent. Another component of this factor evaluates the impact of brain drain on the competitiveness of countries. It also takes into account the level of worker motivation. 
The success of the investment in and development of talent and the ability to attract and retain talent is reflected in the availability of skills and competencies to sustain an economy’s talent pool. The readiness factor looks at the context of the talent pool. It considers the growth of the labor force and the quality of the skills available. It also takes into consideration the experience and competencies of the existing senior managers’ pool. The readiness factor focuses, in addition, on the ability of the educational system to meet the talent needs of enterprises. It examines the way in which the educational system fulfils the talent demands of the economy, the ability of higher education to meet that demand and the languages skills available. 
3
IMD World Talent Report 2014 
4 
Figure 1: Structure of the IMD World Talent Ranking 
Such a comprehensive set of criteria enables us to observe how countries perform in terms of sustaining their talent pool. In developing the talent ranking, we have omitted measures of the regulation of labor and productivity. The reason for this is because our objective is to assess the development and retention of talent, and the regulation of labor and its focus on conflict resolution could be perceived as peripheral to that objective. Similarly, productivity is an outcome of what we want to assess. 
Table 1: Components of the talent factors 
The IMD World Talent Ranking 
Investment and development factor 
Appeal factor 
Readiness factor 
Investment and development factor 
•Total public expenditure on education 
•Total public expenditure on education (per pupil) 
•Pupil-teacher ratio (primary) 
•Pupil-teacher ratio (secondary) 
•Apprenticeship 
•Employee training 
•Female labor force 
Appeal factor 
•Cost of living 
•Attracting and retaining 
•Worker motivation 
•Brain drain 
•Quality of life 
•Foreign skilled people 
Readiness factor 
•Labor force growth 
•Skilled labor 
•Finance skills 
•International experience 
•Competent senior managers 
•Educational system 
•Science in schools 
•University education 
•Management education 
•Language skills
IMD World Talent Report 2014 
3. Constructing the IMD World Talent Ranking 
In order to calculate the IMD World Talent Ranking, we: 
 Normalize data to the 0 to 1 values in order to bring all indicators into the same value range 
 Calculate the average of the normalized criteria 
 Use averaged criteria to generate the three talent competitiveness factors 
 Aggregate factors to build the overall talent ranking 
 Normalize the overall ranking to the 0 to 100 range to facilitate the interpretation of results 
However, there are some caveats. For certain years, our sample varies according to the evolution of the IMD World Competitiveness Yearbook. That is to say, some countries appear in the talent ranking only for the years in which they are part of the Yearbook. For example, Latvia only appears in the 2013 and 2014 talent rankings because it became part of the Yearbook in 2013. Similarly, rankings for Iceland are only available from 2010. 
Table 2: Sample size (2005-2014) 
Year# Countries200550200652200754200855200957201058201159201259201360201460 
The survey data follow the evolution of the Yearbook. The executive opinion survey employed in the Yearbook is constantly updated and a relevant question for the talent ranking may only have been incorporated in recent years. Therefore the availability of data for that particular indicator could be restricted to only a segment of the decade considered in this report. Specifically, the apprenticeship indicator is available for 2013 and 2014. The attracting and retaining talent and management education indicators are available from 2007 and 2008 (respectively) to the present. Additionally, hard data may not be available for specific countries in specific years. Whenever possible, we use the most recent data available. 
In Table 3 we present all the definitions and relevant survey question. Note that the value range for all survey based criteria is of 0 to 10. 
5
6 
Table 3: Criteria definitions and survey questions 
Criterion Definition/question 
Total public expenditure on education Total public expenditure on education as percentage of GDP 
Total public expenditure on education (per pupil) Total public expenditure on education per pupil as percentage of GDP per capita 
Pupil-teacher ratio (primary) Ratio of students to teaching staff, primary school 
Pupil-teacher ratio (secondary) Ratio of students to teaching staff, secondary school 
Apprenticeship Apprenticeship is sufficiently implemented 
Employee training Employee training is a high priority in companies 
Female labor force Percentage of total labor force 
Cost of living Index of a basket of goods & services in major cities, including housing (New York City = 100) 
Attracting and retaining Attracting and retaining talents is a priority in companies 
Worker motivation Worker motivation in companies is high 
Brain drain Brain drain (well-educated and skilled people) does not hinder competitiveness in your economy 
Quality of life Quality of life is high 
Foreign skilled people Foreign high-skilled people are attracted to your country's business environment 
Labor force growth Percentage change in labor force 
Skilled labor Skilled labor is readily available 
Finance skills Finance skills are readily available 
International experience International experience of senior managers is generally significant 
Competent senior managers Competent senior managers are readily available 
Educational system The educational system meets the needs of a competitive economy 
Science in schools Science in schools is sufficiently emphasized 
University education University education meets the needs of a competitive economy 
Management education Management education meets the needs of the business community 
Language skills Language skills are meeting the needs of enterprises 
Panel A: Investment and development factor 
Panel B: Appeal factor 
Panel C: Readiness factor 
4. The IMD World Talent Ranking 2014 – Results 
The 2014 IMD World Talent Ranking is led by Switzerland, Denmark, Germany, Finland and Malaysia (1st to 5th 
respectively). In Table 4 we present the 2014 top 10 countries and in the sub-sections that follow, we discuss 
in detail the performance of several countries in the three talent competitiveness factors. 
Table 4: Top 10 talent raking, 2014 
2014 Ranking Country 
1 Switzerland 
2 Denmark 
3 Germany 
4 Finland 
5 Malaysia 
6 Ireland 
7 Netherlands 
8 Canada 
9 Sweden 
10 Norway 
Top 10 countries
IMD World Talent Report 2014 
4.1 Investment and development factor 
Denmark leads the investment and development factor while Switzerland reaches the 2nd spot in the same factor. Austria follows in third place with Germany and Sweden ranking 4th and 5th place respectively. Within this factor, Iceland achieves the highest score in total expenditure on education (as a percentage of GDP) and Denmark leads in the total public expenditure on education per pupil indicator. The pupil-teacher ratios are headed by Sweden (primary school) and Portugal (secondary school). Portugal reaches the 20th position in the factor. Germany obtains the highest mark in the apprenticeship indicator followed closely by Switzerland (8.52) and Austria (7.63). For the same criterion, Malaysia (7.12), Japan (6.91), Indonesia (6.11) and Lithuania (5.97) make the top 10 (fourth, fifth, seventh and eighth, respectively). Ukraine comes 11th with a score of 5.47 and Turkey 12th with 5.46. 
Switzerland leads the way in employee training. Germany (7.79) and Japan (7.78) reach 2nd and 3rd respectively. In the same indicator, Romania achieves 7th place with 7.43, Estonia 14th with 6.63 and Lithuania 15th with 6.59. In terms of female labor force (as a percentage of the total labor force), Latvia (14th spot in the investment and development factor) obtains the highest score. While Lithuania (50.06%), Kazakhstan (49.13%) and Estonia (49.09%) reach the 2nd to 4th spots, Finland (48.34%) comes 6th and France 7th (47.84%). In this indicator, USA (46.80%) reaches 17th position, Switzerland (46.16) 24th and Germany (45.94%) 27th. 
4.2 Appeal factor 
Switzerland heads the talent appeal factor with Germany, USA, Ireland and Malaysia (2nd to 5th respectively) completing the top 5. Luxembourg makes it to the 10th position in this factor. Within the appeal factor, in terms of the cost of living, USA is the least expensive (75.08) among the top 10 countries in the factor. Malaysia (78.60) and Germany (78.61) follow closely. The most expensive countries among the top 10 are Denmark (103.30), Norway (109.10) and Switzerland (115.90). In the quality of life criterion, Switzerland (9.73), Norway (9.47) and Germany (9.38) head the top 10 ranking while UAE (8.58), USA (8.33) and Malaysia (7.48) close it. Luxembourg obtains the lowest mark (6.93) in terms of attracting and retaining talents among the top10 countries in the factor. Other countries at the top of this indicator are Switzerland (8.38), Germany (8.00), Ireland (8.00), Denmark (7.87) and Norway (7.78). 
In the criterion of the level of worker motivation in companies, Malaysia ranks third with 7.68, only surpassed by Denmark (7.87) and Switzerland (7.94). In the same criterion, Austria (14th in the appeal factor) and Japan (24th) make it to the top 10 with 7.59 and 7.56 respectively. Finland (11th) and Sweden (13th) close ranks in the top 10 of the criterion obtaining 7.49 and 7.24 respectively. Norway (8.09) heads the brain drain (as hindrance for competitiveness in the economy) criterion. Switzerland (7.78) and Finland (7.76) follow. While Ukraine reaches 11th place with 6.34, the United Kingdom comes 12th with 6.27 and Hong Kong 14th with 5.95. The ability to attract foreign highly skilled people is led by Switzerland (8.87). Singapore obtains 8.17 (third place) while the United Kingdom (7.78) reaches eighth place, Hong Kong (7.47) ninth and Chile (7.43) 10th. 
4.3 Readiness factor 
Switzerland heads the readiness factor followed by Finland (2nd), Netherlands (3rd), Denmark (4th) and UAE (5th). Within this factor, in the labor growth (percentage change) criterion Qatar achieves top score (14.55%) followed by UAE (9.31%), Venezuela (6.10%), Mexico (4.06%) and Peru (3.52%). Switzerland (1.41%) reaches 19th place, Germany (0.37%) 38th and Denmark (-0.12%) 48th position. In terms of skilled labor (readily available), Ireland (8.09) heads the top with Finland (7.76), Denmark (7.57), the Netherlands (7.48) and the Philippines (7.37) rounding up the top of the table. Malaysia (6.95) reaches 6th spot, Sweden (6.89) 8th, Switzerland (6.68) 10th and Germany (5.45) a distant 37th spot. Switzerland (8.33) leads in the availability of finance skills. Ireland (8.29) and Canada (8.19) complete the top 3. While Hong Kong (7.92) makes it to the 8th place, Israel (7.74) comes 10th, the United Kingdom (7.66) 11th and France (7.60) 12th. 
Switzerland (7.92) reaches the top in the international experience of senior managers (generally significant), the Netherlands (7.45) and Luxembourg (7.26) follow. Malaysia (7.23) reaches 4th spot, Ireland (7.17) 6th and Germany (6.84) 8th rank. Singapore (6.69) closes the top 10 with Denmark (5.50) in a distant 26th. In terms of competent senior managers (readily available), Malaysia (7.44), the Netherlands (7.34) and Ireland (7.33) lead the table. Hong Kong (6.92), Canada (6.89), Switzerland (6.87), Finland (6.80) and Sweden (6.80) reach the 6th to 10th positions. 7
IMD World Talent Report 2014 
Switzerland (8.65), Finland (8.45), Singapore (8.17), Canada (7.85) and Ireland (7.62) lead the way in the fit between the educational system and the needs of a competitive economy. New Zealand (7.32) and Australia (7.23) close the top 10 in this criterion. Singapore (8.36) tops the table in science in schools (sufficiently emphasized). Malaysia (6.98), UAE (6.77), Hong Kong (6.53) and Taiwan (6.47) reach the 5th to 8th spot (respectively). While Japan (6.26) closes the top 10, Germany (5.75) comes 18th. 
The top 5 for the University education (fulfil the needs of a competitive economy) criterion is Switzerland (8.68), Canada (8.19), Finland (8.16), Singapore (8.10) and Denmark (7.73). Malaysia (6.90), Sweden (6.54) and Norway (6.41) rank 14th, 19th and 21st respectively. Switzerland (8.38), USA (7.93) and Singapore (7.86) top the management education (meets the needs of the businesses) indicator. Malaysia (7.28) closes the top 10 while Sweden (6.71) ranks 16th and the United Kingdom (6.16) 28th. Luxembourg (8.63) leads the way in the availability of language skills followed by Denmark (8.60), the Netherlands (8.49), Switzerland (8.42) and Finland (8.20). While Singapore (7.93) and Sweden (7.89) round up the top 10, Norway (7.78) ranks 12th, Malaysia (7.52) 15th and Germany (6.93) 19th. 
5. The IMD World Talent Ranking in retrospective (2005-2014) 
In this section we discuss the evolution of the IMD World Talent Ranking for a selected group of countries during the period 2005-2014. 
5.1 Talent competitive countries 
Developing the 2005-2014 talent rankings enables us to identify countries that through the years consistently accomplish high scores; that is to say, the countries that rank in the top 10 for five or more years during the period assessed. We call these countries talent competitive. 
Talent competitive countries show a balanced approach between their commitment to education, investment in the development of local talent and their ability to attract overseas talent. The talent competitiveness strategies that these countries adopt strive to fulfil the demands of their economies. In this sense, talent competitive countries exhibit a high level of “agility” in the development of policies that impact their talent pipeline. In the following table we present the most talent competitive countries in the 2005-2014 period, 
Table 5. The most talent competitive countries (2005-2014) 
Country2005200620072008200920102011201220132014Austria6134649141311Canada5101067107588Denmark3323233222Finland241713485444Ireland1456101318168116Netherlands71587578757Norway151313181013106710Singapore10742891791716Sweden121255322339Switzerland1211111111 
The fluctuation in the overall ranking experienced by some of these countries throughout the period may be the result of cyclical economic and socio-political issues that impact, for example, immigration policies and/or investment in education. In some cases, such policies could result in the diminishing ability of countries to attract overseas talent despite strong commitment to local talent development. 
In the next section we assess the proposition that talent competitive countries strike a balance between the development of local talent and the attraction of overseas talent through the adoption of policies that meet the talent requirements of their economies. We select countries based on their evolution in the talent ranking for 2005-2014. These short case studies include examples of countries that steadily remain in the top 10 of the rankings and others that fluctuate in and out the top 10 ranks. In addition, we include countries that consistently decline in their ranks and others that steadily rise. 8
IMD World Talent Report 2014 
5.2 Case studies 
5.2.1 Brazil 
In the overall talent ranking, Brazil peaks at 28th in 2005 and experiences a decline to 52nd position in 2014. When comparing Brazil’s scores for 2005 and 2014 we observe that it has experienced a decline in most of the indicators and a particularly sharp drop in some of the criteria encompassed by the readiness factor. Among these we find several indicators. Brazil sees the labor force growth indicator steeply decline from 4.57% in 2005 to 0.75% in 2014. Similarly, the availability of skilled labor scores drop from 5.34 and 3.16 in the same period. 
The availability of finance skills falls sharply from 6.17 (2005) to 4.93 (2014) while the access to competent senior managers dwindles from 6.20 to 3.45. The ability of the country’s educational institutions to fulfil the talent demands of the market suffers a similar decrease. The educational system criterion steeply falls from 3.34 in 2005 to 1.80 in 2014 while the emphasis on science in schools drops from a value of 3.68 to 2.06. 
Such a considerable decline in the readiness factor occurs despite a somewhat stable investment and development factor. Brazil sees an increase in its total public expenditure on education from 4.60% in 2005 to 4.97% in 2014. The pupil-teacher ratio in primary education improves from 24.05 to 21.29. Similarly the pupil- teacher ratio secondary school is enhanced from 19.12 in 2005 to 16.35 in 2014. The prioritization of employee training slightly improves from 5.86 to 5.90 while the percentage of female labor force increases from 43.11% to 43.30%. 
Brazil ranks inconsistently in the appeal factor. It experiences a sharp increase in the cost of living index from 59.80 in 2005 to 95.30 in 2014. The level of worker motivation in the country also takes a dive from 6.66 to 5.43 while the brain drain indicator drops from 5.63 to 4.61. At the same time, the quality of life improves from 4.34 to 4.40 and the attracting and retaining talents indicator also increases from 6.59 in 2007 to 7.25 in 2014. The ability of the country to attract foreign highly skilled people slightly increases from 5.06 in 2005 to 5.17 in 2014. 
5.2.2 India 
In the period 2005 to 2014 India rises from 29th place in 2005 to 26th in 2007, dropping to 34th in 2010. It returns to the 29th spot in 2011 to drop to 48th place in 2014. 
In the investment and development factor, results show that India increases the total public expenditure on education from 3.14% in 2005 to 3.80% in 2014. We observe a similar trend in pupil-teacher ratio in primary schools, which improves from 40.66 to 35.00. Likewise, the pupil-teacher ratio for secondary school improves from 32.32 to 30.00. Conversely, India’s total public expenditure on education per pupil decreases from 12.64% in 2012 to 11.78% in 2014. The country’s implementation of apprenticeship programs declines from 4.74 in 2013 to 4.51 in 2014. The prioritization of employee training in companies dwindles from 5.36 in 2005 to 5.08 in 2014. India’s percentage of female labor force also decreases from 31.65% in 2005 to 25.30% in 2014. 
In the appeal factor, India also sees a decline in the level of worker motivation criterion from 5.80 in 2005 to 5.11 in 2014. Brain drain as a hindrance to competitiveness also observes the same pattern, declining from 6.25 (2005) to 5.54 (2014). The ability of India to attract foreign highly skilled people similarly decreases from 4.96 in 2005 to 4.41 in 2014. 
India’s quality of life indicator decreases slightly from 4.64 in 2005 to 4.46 in 2014, while the attracting and retaining talents indicator also falls from 7.93 in 2007 to 6.86 in 2014. 
The country fares similarly in the readiness factor. The access to skilled labor sharply drops from 7.58 in 2005 to 5.75 in 2014. The availability of finance skills falls from 7.78 to 7.00 and likewise the international experience criterion somewhat increases from 5.11 to 5.29 during the same period. At the management level, the availability of competent senior managers indicator drops from 6.50 in 2005 to 5.63 in 2014. The management education fit to the needs of the business community also falls from 6.85 in 2008 to 6.16 in 2014. 
The readiness of India’s educational institutions to meet the demands of the economy likewise sees a decline in the period of study. The criterion of educational system obtains a score of 6.20 in 2005 but drops to 4.89 in 
9
IMD World Talent Report 2014 
2014. In addition, the indicator for the emphasis assigned to science in schools decreases from 7.06 in 2005 to 5.97 in 2014. Similarly the university education criterion drops from 6.62 to 5.17 during the same years while the language skills indicator declines from 7.53 in 2005 to 6.25 in 2014. 
5.2.3 Malaysia 
Malaysia experiences an opposite pattern to that of Brazil and India, steadily improving its position on the overall World Talent Ranking from 20th place in 2005 to the 6th spot in 2010 and up to the 5th rank in 2014. 
Within the readiness factor, Malaysia sees an increase in the score of the employee training criterion from 6.17 in 2005 to 7.71 in 2014. The availability of skilled labor improves from 5.77 to 6.95 while access to finance skills is enhanced from 6.15 to 7.40. At the senior management level, Malaysia improves in international experience from 5.83 in 2005 to 7.23 in 2014. Likewise, access to competent senior managers increases from 5.89 to 7.44. 
The ability of the country’s educational institutions to meet the talent requirement of the market is also enhanced in the 2005-2014 period. The educational system indicator rises from 5.54 to 6.86. Likewise, the university education criterion increases from 5.49 to 6.90, while that of language skills improves from 5.60 to 7.52. In addition, the emphasis that schools assign to science increases from 6.04 to 6.98 in the period under consideration. 
Malaysia’s appeal factor also improves. The level of worker motivation in companies increases from 6.08 in 2005 to 7.68 in 2014. At the same time, the criterion covering the brain drain as a hindrance to the competitiveness of the country improves from 4.84 and 6.51. Similarly, the ability of the country to attract foreign highly skilled people increases from 6.42 in 2005 to 7.24 in 2014, while the quality of life improves from 6.76 in 2005 to 7.48 in 2014. 
Similar improvements occur under the investment and development factor in the period 2005-2014. Malaysia’s pupil-teacher ratio for both primary and secondary education improves from 18.08 to 12.60 and from 16.50 to 13.10, respectively. The percentage of the country’s female labor force slightly increases from 36.06% in 2005 to 37.03% in 2014. The country’s implementation of apprenticeship programs increases from 6.49 in 2013 to 7.12 in 2014. Although Malaysia’s total public expenditure on education decreases from 6.98% in 2005 to 5.80% in 2014, the country’s total public expenditure on education per pupil improves from 20.54% in 2007 to 23.15% in 2014. 
5.2.4 Singapore 
In the overall ranking, Singapore experiences an increase from the 10th spot in 2005, peaking at 2nd place in 2008 then descending to 9th in 2009 and 16th in 2014. The country’s scores in the investment and development factor seem low and cost of living is high – suggesting that Singapore currently has a large pool of talent that it has nurtured and attracted, but that this pool may shrink slightly in the future. 
While the total public expenditure on education peaks at 3.72% in 2005, it reaches its lowest (2.80%) in 2009. The primary school pupil-teacher ratio peaks at 25.00 in 2006 and steadily improves to 18.60 in 2014. The female percentage of the labor force criterion experiences a similar pattern, improving from 41.30% in 2005 to 44.68% in 2014. In the implementation of apprenticeship programs, Singapore’s scores of 5.26 in 2013 and 5.25 in 2014 are somewhat low when compared with those of countries that have moved up the overall ranking. For example, Denmark obtains 6.50 in 2013 and 6.26 in 2014. In terms of the prioritization of employee training, Singapore’s scores fluctuate from a high of 7.32 (2008) to a low of 6.27 in 2013 while Denmark remains above 7.32 throughout the decade with a highest of 8.24 in 2009. 
In the cost of living indicator, Singapore receives 83.60 in 2005; living costs increase to 125.11 in 2013 and 122.40 in 2014 (the most expensive in the sample). Scores for the quality of life are consistently high (above 8.00) with a lowest value of 8.00 in 2005 and a highest of 8.96 in 2007. In the attracting and retaining indicator Singapore achieves the highest mark of the sample in 2008 with a value of 8.33. Scores for the brain drain criterion are relatively high throughout. At the same time, Singapore’s ability to attract foreign highly skilled people receives extremely high marks, albeit with a lowest score of 7.95 in 2013 from a high of 8.74 in 2008. 
Within the readiness factor, Singapore scores are consistently high for the educational system, science in schools, university education and management education criteria. Moreover, in all the years under study 10
IMD World Talent Report 2014 
Singapore achieves the highest scores for science in schools. In the 2006-2008 period, Singapore dominates the educational system and university education indicators. 
5.2.5 Switzerland 
In the years considered in this report, Switzerland ranks 1st except in the 2006 ranking for which it reaches the 2nd spot. Through the period, Switzerland excels in all factors particularly in the attraction/retention and readiness factors. It is worth mentioning that under the investment and development factor, in the female percentage of the labor force Switzerland experiences some fluctuation but sees an increase from 44.69% in 2005 to 46.16 in 2014. Similarly, in the prioritization of employee training for companies, the country scores higher than 7.35 throughout, reaching top marks in 2012 (7.86) and 2014 (7.94). Switzerland achieves the top spot in the quality of life for five of the years in the decade under study, in worker motivation (three years) and in attracting foreign highly skilled people (seven years). It also important to mention, its scores in the brain drain as hindrance for the competitiveness of the economy are consistently high (above 7.00 from 2007 to 2014) reaching its lowest in 2009 at 7.10. 
In other specific indicators, Switzerland dominates (in the majority of years analyzed) the rankings in the availability of finance skills, the significance of the international experience of senior managers, in the ability of university education to fulfil the demands of the labor market, and in the ability of the management education to meet the needs of the business community. In language skills it achieves top marks in 4 of the 10 years under consideration. Switzerland’s lowest scores show in the labor force growth and cost of living indicators. 
6. Observations 
The data suggest that countries that achieve a positive balance between investing and developing local talent and the ability to attract and retain overseas talent perform consistently well in the period 2005-2014, for example Switzerland. The country’s results indicate that it is able to develop its home-grown talent while efficiently tapping into the overseas talent pipeline. In addition, the Malaysian example shows that a strategy aiming at improving both the home-grown and overseas talents has a positive impact on the country’s performance in the overall talent ranking. 
Countries that experience imbalances in that strategy tend to experience a drop in their overall rankings. The overall ranking pattern exhibited by Singapore seems to be the outcome of the investment and development factor results in combination with other indicators such as the cost of living. In other words, Singapore’s results show a fair degree of imbalance between the criteria covering the home-grown talent pipeline and the ability of the country to attract overseas talent. The county thus fluctuates in and out of the top 10 talent ranking during the period under study. 
The performances of Brazil and India show that imbalances across all talent competitiveness criteria are detrimental for the sustainability of an effective and dynamic talent pipeline. 
11
IMD World Talent Report 2014 
12 
IMD World Talent Ranking 2005-2014 
Investment and development factorAppeal factorReadiness factorOverall Country  Year200520062007200820092010201120122013Argentina47424148494445445348525355Australia99911111712202025161719Austria613464914133142411Belgium11141589116181013182017Brazil28313731344047454835415952Bulgaria405151455859596051596060Canada51010671075817798Chile22252727333126294456274644China Mainland48444050504643504545405043Colombia36303442555139565155455454Croatia515346535557575732575858Czech Republic24192428242625302846373837Denmark3323233221942Estonia27272925322830323715323930Finland2417134854471124France21202319212028262623312624Germany1718161612161110642113Greece31322836403644463339543142Hong Kong1381817182120131933251021Hungary16242026303338394926565251Iceland5412188211414India29282633313429344260292748Indonesia49505040413732423247261925Ireland14561013181681119486Israel8111215161415171521221318Italy41454344464252374338514447Japan32292530232931413518244528Jordan40393323445353365050443339Kazakhstan353237283830393232Korea35414439383533333943503740Latvia3114363023Lithuania323426253531229354229Luxembourg1916714171218151612102213Malaysia201714121561411911575Mexico44464952525450494057334850Netherlands7158757875161237New Zealand23221921202222252534232926Norway15131318101310671081610Peru45545756535558425757Philippines38474741424546352959342141Poland43484543373040383022532836Portugal34343032293927243420493533Qatar222723222453171822Romania45495255564141555841473638Russia42373953474855545642584053Singapore1074289179173119616Slovak Republic30363638364951515237484746Slovenia37353529285048434728554149South Africa46434849515254525454465556Spain33333837484736484640434945Sweden12125532233513129Switzerland1211111112111Taiwan18212120271919192327302527Thailand25263124252424272744204334Turkey39384635394342403649283435UAE342314526515Ukraine424743384947416385131United Kingdom26232222192321212129152320USA4611914151316122431512Venezuela50525454575658585936605659no. countries50525455575859596060Overall Ranking2014
IMD World Talent Report 2014 
Factor 1: Investment and Development 2014 
13
IMD World Talent Report 2014 
Factor 2: Appeal 2014 
14
IMD World Talent Report 2014 
Factor 3: Readiness 2014 
15
IMD World Talent Report 2014 
2014 Criteria 
Factor 1: Investment and Development 
Total public expenditure on education (%) 
2012 
Total public expenditure on education per pupil 
2011 
Pupil-teacher ratio (primary education) 
2011 
Pupil-teacher ratio (secondary education) 
2011 
Apprenticeship 
(Survey 2014) 
Employee training 
(Survey 2014) 
Female labor force (%) 
2013 
Factor 2: Appeal 
Cost-of-living index 
2013 
Attracting and retaining talents 
(Survey 2014) 
Worker motivation 
(Survey 2014) 
Brain drain 
(Survey 2014) 
Quality of life 
(Survey 2014) 
Foreign high-skilled people 
(Survey 2014) 
Factor 3: Readiness 
Labor force growth 
2013 
Skilled labor 
(Survey 2014) 
Finance skills 
(Survey 2014) 
International experience 
(Survey 2014) 
Competent senior managers 
(Survey 2014) 
Educational system 
(Survey 2014) 
Science in schools 
(Survey 2014) 
University education 
(Survey 2014) 
Management education 
(Survey 2014) 
Language skills 
(Survey 2014) 
16
IMD World Talent Report 2014 
1ICELAND8.02ISRAEL8.013DENMARK7.94SOUTH AFRICA7.35UKRAINE7.26SWEDEN6.87USA6.538FINLAND6.39BELGIUM6.310FRANCE6.111SWITZERLAND6.112UNITED KINGDOM6.113NETHERLANDS5.814MALAYSIA5.815SLOVENIA5.7116PORTUGAL5.717LITHUANIA5.618AUSTRIA5.619NEW ZEALAND5.520LATVIA5.521NORWAY5.522POLAND5.523LUXEMBOURG5.424AUSTRALIA5.325IRELAND5.226CROATIA5.027BRAZIL5.0228CZECH REPUBLIC4.829ESTONIA4.830HUNGARY4.831COLOMBIA4.632SPAIN4.533KOREA4.5234TAIWAN4.435KAZAKHSTAN4.336GERMANY4.337ITALY4.238GREECE4.139CHINA MAINLAND4.140CHILE4.141RUSSIA4.042THAILAND3.943SLOVAK REPUBLIC3.844VENEZUELA3.8345INDIA3.846JORDAN3.847HONG KONG3.848TURKEY3.7149JAPAN3.550BULGARIA3.551INDONESIA3.552MEXICO3.553PERU3.154QATAR3.155ROMANIA3.056SINGAPORE3.057PHILIPPINES2.758UAE1.1-ARGENTINA- -CANADA- Ranking2012% Percentage of GDPTOTAL PUBLIC EXPENDITURE ON EDUCATION (%) 1DENMARK3522UKRAINE333SWEDEN3014FINLAND3015BELGIUM2916AUSTRIA2917SLOVENIA2818UNITED KINGDOM2819PORTUGAL28110SWITZERLAND27111NORWAY26112ESTONIA26113FRANCE26114LATVIA25115ICELAND25116IRELAND25117ITALY24118NEW ZEALAND2419POLAND24120NETHERLANDS2421SPAIN24122HUNGARY24123BULGARIA24124CROATIA24125LITHUANIA23126MALAYSIA2327JAPAN2328KOREA222 29TAIWAN2230CZECH REPUBLIC22131VENEZUELA21232USA21133AUSTRALIA21134ARGENTINA2035ROMANIA20236SLOVAK REPUBLIC20137RUSSIA20338HONG KONG1939ISRAEL19140MEXICO18141THAILAND18242COLOMBIA1643QATAR16344CHILE1545KAZAKHSTAN1246INDIA1247INDONESIA1148PHILIPPINES10349PERU91-BRAZIL- -CANADA- -CHINA MAINLAND- -GERMANY- -GREECE- -JORDAN- -LUXEMBOURG- -SINGAPORE- -SOUTH AFRICA- -TURKEY- -UAE- Ranking2011% Percentage of GDP per capitaTOTAL PUBLIC EXPENDITURE ON EDUCATION PER PUPIL 
17
IMD World Talent Report 2014 
1SWEDEN9.272LUXEMBOURG9.903ICELAND10.204NORWAY10.405HUNGARY10.546AUSTRIA10.897POLAND11.008PORTUGAL11.209QATAR11.2810LATVIA11.41 11ITALY11.7012DENMARK11.8013SPAIN12.4014BELGIUM12.4015LITHUANIA12.4116MALAYSIA12.6017GREECE12.68118ESTONIA13.2019FINLAND13.6720CANADA13.8021CROATIA14.26122HONG KONG14.4023VENEZUELA14.51224TAIWAN14.8025SWITZERLAND14.90126SLOVAK REPUBLIC15.0827USA15.3028IRELAND15.5729AUSTRALIA15.6030NETHERLANDS15.8031UKRAINE15.8332ISRAEL15.9033INDONESIA15.9434THAILAND15.99335SLOVENIA16.0036ROMANIA16.11137GERMANY16.3037NEW ZEALAND16.3039ARGENTINA16.33340KAZAKHSTAN16.3641UAE17.0342BULGARIA17.49143FRANCE17.5244JORDAN17.6045CHINA MAINLAND17.7146JAPAN18.1047SINGAPORE18.6048CZECH REPUBLIC18.8249PERU19.5650KOREA19.6051UNITED KINGDOM19.9052RUSSIA20.0053TURKEY21.2854BRAZIL21.2955CHILE21.9756COLOMBIA27.5857MEXICO28.1158SOUTH AFRICA30.71259PHILIPPINES31.44260INDIA35.00Ranking2011ratioRatio of students to teaching staffPUPIL-TEACHER RATIO (PRIMARY EDUCATION) 1PORTUGAL7.702GREECE8.0043CROATIA8.1514LATVIA8.335VENEZUELA8.4126LITHUANIA8.567RUSSIA8.708KAZAKHSTAN8.879BELGIUM9.4010SWEDEN9.5111LUXEMBOURG9.6012AUSTRIA9.6813NORWAY9.8014HUNGARY10.0315QATAR10.1316JORDAN10.2017POLAND10.6018ARGENTINA10.90319SLOVENIA11.0020SPAIN11.0521ICELAND11.1022CZECH REPUBLIC11.4022SWITZERLAND11.40124DENMARK11.50125SLOVAK REPUBLIC11.6726ESTONIA11.9027UKRAINE11.99228AUSTRALIA12.0029BULGARIA12.08130ISRAEL12.2030ITALY12.2032UAE12.42133ROMANIA12.48134FRANCE12.6935FINLAND13.1035JAPAN13.1035MALAYSIA13.1038GERMANY14.0039IRELAND14.4040HONG KONG14.5041INDONESIA14.7742SINGAPORE14.8043NEW ZEALAND15.1044CHINA MAINLAND15.1545USA15.2046CANADA15.3047TAIWAN16.1048UNITED KINGDOM16.3049BRAZIL16.3550PERU16.5051NETHERLANDS16.7052KOREA17.2053MEXICO17.6854THAILAND19.9155TURKEY20.1756CHILE21.0657SOUTH AFRICA24.40158COLOMBIA25.5859INDIA30.0060PHILIPPINES34.812Ranking2011ratioRatio of students to teaching staffPUPIL-TEACHER RATIO (SECONDARY EDUCATION) 
18
IMD World Talent Report 2014 
1GERMANY8.532SWITZERLAND8.523AUSTRIA7.634MALAYSIA7.125JAPAN6.916DENMARK6.267INDONESIA6.118LITHUANIA5.979UAE5.9610NETHERLANDS5.9311UKRAINE5.4712TURKEY5.4613LUXEMBOURG5.3614IRELAND5.3315SINGAPORE5.2516TAIWAN5.1717CANADA5.1518NORWAY5.1419KAZAKHSTAN5.1320COLOMBIA5.1221QATAR4.8722FINLAND4.7823HONG KONG4.7524JORDAN4.6725CHINA MAINLAND4.6426ICELAND4.6427THAILAND4.6328LATVIA4.6229PHILIPPINES4.5530PORTUGAL4.5231AUSTRALIA4.5232INDIA4.5133ESTONIA4.5034BRAZIL4.4635RUSSIA4.4336MEXICO4.3937POLAND4.3138ISRAEL4.3039CHILE4.2340KOREA4.1741SWEDEN4.0342USA3.9843UNITED KINGDOM3.9844VENEZUELA3.9545PERU3.8646BELGIUM3.8547HUNGARY3.7748FRANCE3.7449NEW ZEALAND3.6250GREECE3.5851ITALY3.5652ARGENTINA3.3753CROATIA3.2454SPAIN3.1155SLOVAK REPUBLIC3.0856CZECH REPUBLIC2.9157SLOVENIA2.6958SOUTH AFRICA2.4359BULGARIA1.9360ROMANIA1.49Ranking2014APPRENTICESHIPis not sufficiently implementedis sufficiently implementedApprenticeship1SWITZERLAND7.942GERMANY7.793JAPAN7.784MALAYSIA7.715AUSTRIA7.536DENMARK7.517ROMANIA7.438FINLAND7.029IRELAND6.9210UAE6.8511NORWAY6.8212SWEDEN6.7713NETHERLANDS6.7714ESTONIA6.6315LITHUANIA6.5916LUXEMBOURG6.4917SINGAPORE6.3018TAIWAN6.2119CHINA MAINLAND6.1020THAILAND6.1021BELGIUM6.0422KOREA6.0023COLOMBIA5.9724ICELAND5.9625KAZAKHSTAN5.9026BRAZIL5.9027SLOVAK REPUBLIC5.8828CANADA5.8529ISRAEL5.8330UKRAINE5.8231PHILIPPINES5.7832USA5.7633QATAR5.7434TURKEY5.6935AUSTRALIA5.6536INDONESIA5.6437HONG KONG5.5838JORDAN5.3839LATVIA5.3740FRANCE5.3241MEXICO5.2842UNITED KINGDOM5.2343SOUTH AFRICA5.1944VENEZUELA5.1445CZECH REPUBLIC5.0946INDIA5.0847CHILE5.0548POLAND4.8849RUSSIA4.8750SLOVENIA4.8351NEW ZEALAND4.7552HUNGARY4.6453ITALY4.4254PERU4.3855ARGENTINA4.3656CROATIA4.2157PORTUGAL4.0958GREECE3.8959SPAIN3.8660BULGARIA3.64Ranking2014EMPLOYEE TRAININGis not a high priority in companiesis a high priority in companiesEmployee training 
19
IMD World Talent Report 2014 
1LATVIA50.292LITHUANIA50.063KAZAKHSTAN49.134ESTONIA49.095HONG KONG48.366FINLAND48.347FRANCE47.848UKRAINE47.779ICELAND47.7310DENMARK47.7011CANADA47.6812PORTUGAL47.6013SWEDEN47.4814NEW ZEALAND47.1815NORWAY47.1216ISRAEL46.8317USA46.8018BULGARIA46.7119AUSTRIA46.44120RUSSIA46.2221NETHERLANDS46.2222UNITED KINGDOM46.2223CROATIA46.1924SWITZERLAND46.1625HUNGARY46.0226SPAIN45.9927GERMANY45.94128BELGIUM45.9029SLOVENIA45.8330AUSTRALIA45.7831THAILAND45.75132SOUTH AFRICA45.1633POLAND44.7534SINGAPORE44.6835SLOVAK REPUBLIC44.6836IRELAND44.6637ROMANIA44.2838PERU44.21139TAIWAN44.0640BRAZIL43.30141COLOMBIA42.9742GREECE42.6543JAPAN42.6344ITALY42.0745KOREA41.7546CHILE41.2047CZECH REPUBLIC40.3948VENEZUELA39.9149PHILIPPINES39.1550MEXICO38.3851LUXEMBOURG38.1652INDONESIA37.92153MALAYSIA37.0354TURKEY30.6855INDIA25.30156JORDAN17.5457QATAR12.7358UAE12.37-ARGENTINA- -CHINA MAINLAND- Ranking2013% Percentage of total labor forceFEMALE LABOR FORCE (%) 1SOUTH AFRICA62.652BULGARIA65.303INDIA67.944ROMANIA68.105QATAR68.906MEXICO70.157POLAND72.008SLOVENIA72.709LITHUANIA73.3010CROATIA74.60 11HUNGARY74.8012ESTONIA75.0013USA75.0814UNITED KINGDOM78.1015PERU78.5016MALAYSIA78.6017GERMANY78.6118PORTUGAL79.5019PHILIPPINES79.9019UKRAINE79.9021KAZAKHSTAN80.9022SLOVAK REPUBLIC81.2023GREECE81.9024JORDAN82.2025CANADA82.2226LATVIA82.3027TURKEY82.5027UAE82.5029SPAIN82.8030LUXEMBOURG83.8031CZECH REPUBLIC84.2032INDONESIA85.0033BELGIUM85.1034THAILAND85.8035NEW ZEALAND86.1036CHILE86.6037TAIWAN86.7038IRELAND86.9039COLOMBIA87.3040FRANCE87.5541ARGENTINA87.6042FINLAND88.0043NETHERLANDS88.40 44AUSTRIA90.1045CHINA MAINLAND91.9346ITALY92.6547SWEDEN93.0048BRAZIL95.3049ISRAEL97.6050AUSTRALIA102.5050VENEZUELA102.5052DENMARK103.3053KOREA108.0054NORWAY109.1055JAPAN110.7756RUSSIA113.6557SWITZERLAND115.9058HONG KONG121.8059SINGAPORE122.40-ICELAND- Ranking2013indexIndex of a basket of goods & services in major cities, including housing (New York City = 100) COST-OF-LIVING INDEX 
20
IMD World Talent Report 2014 
1SWITZERLAND8.382ROMANIA8.223GERMANY8.003IRELAND8.005DENMARK7.876NORWAY7.787JAPAN7.678USA7.559BELGIUM7.5510UAE7.5311AUSTRIA7.48 12KOREA7.4813MALAYSIA7.4614SINGAPORE7.4415SWEDEN7.4016ISRAEL7.3517AUSTRALIA7.3118CANADA7.2819BRAZIL7.2520THAILAND7.2021NETHERLANDS7.1622HONG KONG7.1523ESTONIA7.1424FINLAND7.1425UKRAINE6.9826LITHUANIA6.9727ICELAND6.9628LUXEMBOURG6.9329INDIA6.8630UNITED KINGDOM6.7031CHINA MAINLAND6.6731TAIWAN6.6733TURKEY6.6334QATAR6.6235INDONESIA6.5135PHILIPPINES6.5137FRANCE6.4838NEW ZEALAND6.4539SOUTH AFRICA6.2140SLOVAK REPUBLIC6.1541VENEZUELA6.0942KAZAKHSTAN5.9243CHILE5.8744JORDAN5.8545LATVIA5.8446CZECH REPUBLIC5.8247MEXICO5.8248ITALY5.7949COLOMBIA5.6950ARGENTINA5.6351PERU5.4152PORTUGAL5.2453SPAIN5.1154GREECE5.0855HUNGARY4.9456RUSSIA4.8657BULGARIA4.7058CROATIA4.6259POLAND4.3860SLOVENIA4.22Ranking2014ATTRACTING AND RETAINING TALENTSis not a priority in companiesis a priority in companiesAttracting and retaining talents1SWITZERLAND7.942DENMARK7.873MALAYSIA7.684IRELAND7.665AUSTRIA7.596JAPAN7.567NORWAY7.568FINLAND7.499GERMANY7.4910SWEDEN7.2411TAIWAN6.8912CANADA6.7013LUXEMBOURG6.6714SINGAPORE6.6315HONG KONG6.6316ICELAND6.6317NETHERLANDS6.6218USA6.5619UAE6.5420ISRAEL6.4321INDONESIA6.4222LATVIA6.3323NEW ZEALAND6.3023PHILIPPINES6.3025UNITED KINGDOM6.3026AUSTRALIA6.2527THAILAND6.1728TURKEY6.1529BELGIUM5.9630MEXICO5.8231CHINA MAINLAND5.7832COLOMBIA5.6733LITHUANIA5.6034CHILE5.5235QATAR5.5036KAZAKHSTAN5.5037ESTONIA5.4838BRAZIL5.4339CZECH REPUBLIC5.4240PERU5.2941UKRAINE5.2642SLOVAK REPUBLIC5.2543JORDAN5.1144INDIA5.1145ITALY4.9246FRANCE4.7747SPAIN4.7748PORTUGAL4.6649KOREA4.5750ARGENTINA4.5651POLAND4.3552HUNGARY4.3453SLOVENIA4.2054RUSSIA4.1455GREECE3.8956SOUTH AFRICA3.7557ROMANIA3.7558CROATIA3.7259VENEZUELA3.6760BULGARIA3.57Ranking2014WORKER MOTIVATIONlowhighWorker motivation in companies is 
21
IMD World Talent Report 2014 
1NORWAY8.092SWITZERLAND7.783FINLAND7.764USA7.285DENMARK7.286GERMANY6.877SWEDEN6.788UAE6.659NETHERLANDS6.5410MALAYSIA6.5111UKRAINE6.3412UNITED KINGDOM6.2713IRELAND5.9614HONG KONG5.9515CANADA5.8916LUXEMBOURG5.8117ISRAEL5.7418AUSTRALIA5.7319SINGAPORE5.7020BELGIUM5.6721CHILE5.5822INDIA5.5423TURKEY5.4124QATAR5.2925INDONESIA5.2626THAILAND5.2327FRANCE5.2028ICELAND5.1529AUSTRIA4.9830ARGENTINA4.9731CZECH REPUBLIC4.8532JAPAN4.7633BRAZIL4.6134JORDAN4.5835LATVIA4.5536PERU4.5337POLAND4.3938GREECE4.3439MEXICO4.2940COLOMBIA4.2441SPAIN4.1142KAZAKHSTAN4.0043ITALY3.9044PHILIPPINES3.8245CHINA MAINLAND3.7946KOREA3.7447NEW ZEALAND3.7048ESTONIA3.6849PORTUGAL3.4750TAIWAN3.4151SOUTH AFRICA3.3952SLOVENIA3.1753SLOVAK REPUBLIC3.0954LITHUANIA2.9855RUSSIA2.8256ROMANIA2.7657CROATIA2.2858VENEZUELA2.1959HUNGARY2.0860BULGARIA1.35Ranking2014BRAIN DRAINhinders competitiveness in your economydoes not hinder competitiveness in your economyBrain drain (well-educated and skilled people) 1SWITZERLAND9.732AUSTRIA9.553NORWAY9.474SWEDEN9.445GERMANY9.386NETHERLANDS9.217DENMARK9.138NEW ZEALAND9.139AUSTRALIA9.1110CANADA9.0411FINLAND9.0212IRELAND9.0012LUXEMBOURG9.0014ICELAND8.7915BELGIUM8.6316UAE8.5817FRANCE8.4818SINGAPORE8.3719USA8.3320JAPAN8.2221SPAIN7.9522UNITED KINGDOM7.7323ISRAEL7.6524CZECH REPUBLIC7.5625MALAYSIA7.4826QATAR7.4627HONG KONG7.0028TAIWAN6.6829CHILE6.4830ITALY6.4631PORTUGAL6.0932THAILAND5.9833INDONESIA5.8134LATVIA5.7735LITHUANIA5.6736SLOVENIA5.6437SLOVAK REPUBLIC5.4038ESTONIA5.3639SOUTH AFRICA5.2640GREECE5.2541KOREA5.2342TURKEY5.1543CROATIA5.1044MEXICO5.0345PHILIPPINES4.9546KAZAKHSTAN4.9447PERU4.9348ARGENTINA4.8449JORDAN4.7950CHINA MAINLAND4.6151INDIA4.4652BRAZIL4.4053RUSSIA4.3754HUNGARY4.0055COLOMBIA3.9756POLAND3.6957ROMANIA3.3758UKRAINE2.8059BULGARIA2.5760VENEZUELA1.32Ranking2014QUALITY OF LIFElowhighQuality of life is 
22
IMD World Talent Report 2014 
1SWITZERLAND8.872USA8.503SINGAPORE8.174UAE8.045CANADA7.926IRELAND7.927LUXEMBOURG7.818UNITED KINGDOM7.789HONG KONG7.4710CHILE7.4311AUSTRALIA7.3312MALAYSIA7.2413QATAR7.2314NETHERLANDS6.9615GERMANY6.6516KAZAKHSTAN6.3417PERU6.2018CHINA MAINLAND6.0819THAILAND6.0020NORWAY5.9621AUSTRIA5.8522NEW ZEALAND5.8123INDONESIA5.6024COLOMBIA5.5225SWEDEN5.3026MEXICO5.2327DENMARK5.1828BRAZIL5.1729BELGIUM5.1530TURKEY5.1031PHILIPPINES4.8732JORDAN4.7733SPAIN4.6634RUSSIA4.6535FRANCE4.5636LITHUANIA4.4737LATVIA4.4338ISRAEL4.4339INDIA4.4140PORTUGAL4.4041ESTONIA4.3942SOUTH AFRICA4.3543KOREA4.3444CZECH REPUBLIC4.3045TAIWAN4.2746FINLAND4.2047UKRAINE4.1748JAPAN3.9349SLOVAK REPUBLIC3.5850HUNGARY3.5451POLAND3.2752ROMANIA3.1953ARGENTINA3.0053ICELAND3.0055ITALY2.9356GREECE2.6257SLOVENIA2.1858BULGARIA2.0759CROATIA1.7660VENEZUELA1.02Ranking2014FOREIGN HIGH-SKILLED PEOPLEare not attracted to your country's business environmentare attracted to your country's business environmentForeign high-skilled people1QATAR14.552UAE9.313VENEZUELA6.104MEXICO4.065PERU3.526TURKEY3.417ARGENTINA2.948SOUTH AFRICA2.889ICELAND2.7210SINGAPORE2.4411MALAYSIA2.3712ROMANIA1.9913ISRAEL1.9714HONG KONG1.9515CHILE1.7616LUXEMBOURG1.6917AUSTRALIA1.5018KOREA1.4619SWITZERLAND1.4120NEW ZEALAND1.3021AUSTRIA1.2022BELGIUM1.1023SWEDEN1.0924NORWAY1.0125UNITED KINGDOM0.9426CZECH REPUBLIC0.9327TAIWAN0.9228IRELAND0.9129PHILIPPINES0.8830COLOMBIA0.8731BULGARIA0.8132NETHERLANDS0.7733BRAZIL0.75134KAZAKHSTAN0.6635INDIA0.5136POLAND0.4237CHINA MAINLAND0.40138GERMANY0.37139HUNGARY0.3440JAPAN0.3441SLOVAK REPUBLIC0.2742USA0.2743INDONESIA0.1244JORDAN0.0745GREECE0.0046THAILAND-0.0247RUSSIA-0.0948DENMARK-0.1249UKRAINE-0.1450ITALY-0.4351ESTONIA-0.5052FRANCE-0.5153FINLAND-0.5654SLOVENIA-0.5955LITHUANIA-0.6056SPAIN-1.3357LATVIA-1.6058CROATIA-1.7059PORTUGAL-1.9260CANADA-2.44Ranking2013% Percentage changeLABOR FORCE GROWTH 
23
IMD World Talent Report 2014 
1IRELAND8.092FINLAND7.763DENMARK7.574NETHERLANDS7.485PHILIPPINES7.376MALAYSIA6.957ICELAND6.898SWEDEN6.899UAE6.7310SWITZERLAND6.6811GREECE6.6812CANADA6.6713ISRAEL6.6514INDONESIA6.4415USA6.3816SPAIN6.3817RUSSIA6.3818NORWAY6.3619FRANCE6.2620AUSTRALIA6.2221UNITED KINGDOM6.0222TURKEY5.9623TAIWAN5.9524ROMANIA5.9425ITALY5.9026KAZAKHSTAN5.8827HONG KONG5.8128CZECH REPUBLIC5.7829JAPAN5.7830SLOVENIA5.7631INDIA5.7532KOREA5.7433PORTUGAL5.7034LATVIA5.5935JORDAN5.5536SINGAPORE5.4637GERMANY5.4538POLAND5.4239BELGIUM5.3740THAILAND5.3141SLOVAK REPUBLIC5.2842MEXICO5.1943AUSTRIA5.1544CROATIA5.1445CHINA MAINLAND5.0246COLOMBIA4.8047LUXEMBOURG4.7548HUNGARY4.7249NEW ZEALAND4.6850QATAR4.4451ARGENTINA4.3652LITHUANIA4.3353UKRAINE4.3154VENEZUELA4.0555CHILE4.0056PERU3.1957ESTONIA3.1658BRAZIL3.1659BULGARIA3.0960SOUTH AFRICA2.96Ranking2014SKILLED LABORis not readily availableis readily availableSkilled labor1SWITZERLAND8.332IRELAND8.293CANADA8.194DENMARK8.145FINLAND8.126SWEDEN8.037USA7.948HONG KONG7.929NETHERLANDS7.8810ISRAEL7.7411UNITED KINGDOM7.6612FRANCE7.6013NORWAY7.5114AUSTRALIA7.4615MALAYSIA7.4016ICELAND7.2917GERMANY7.2718SINGAPORE7.1719UAE7.0420INDIA7.0020TURKEY7.0022NEW ZEALAND6.9623LUXEMBOURG6.9124LATVIA6.8925AUSTRIA6.8526CHILE6.8427KAZAKHSTAN6.6928PHILIPPINES6.6929TAIWAN6.6130GREECE6.5731JAPAN6.5332BELGIUM6.5233POLAND6.5034INDONESIA6.4835RUSSIA6.3736THAILAND6.2437SPAIN6.2238KOREA6.1739JORDAN6.0340SLOVAK REPUBLIC5.9241ARGENTINA5.8942ITALY5.8443MEXICO5.7944QATAR5.7745ROMANIA5.7146SLOVENIA5.6047VENEZUELA5.4548CHINA MAINLAND5.4249HUNGARY5.4050PORTUGAL5.3851COLOMBIA5.3452CZECH REPUBLIC5.1953SOUTH AFRICA5.0554BRAZIL4.9355LITHUANIA4.9256ESTONIA4.8357CROATIA4.6658PERU4.3859UKRAINE4.2760BULGARIA3.56Ranking2014FINANCE SKILLSare not readily availableare readily availableFinance skills 
24
IMD World Talent Report 2014 
1SWITZERLAND7.922NETHERLANDS7.453LUXEMBOURG7.264MALAYSIA7.235HONG KONG7.226IRELAND7.177UAE6.968GERMANY6.849SWEDEN6.7010SINGAPORE6.6911QATAR6.5912JORDAN6.2913INDONESIA6.2614FINLAND6.1215AUSTRIA5.9316ISRAEL5.9117UNITED KINGDOM5.8918BELGIUM5.8119CANADA5.7820POLAND5.7621SLOVAK REPUBLIC5.7422CHILE5.7123PHILIPPINES5.6424KAZAKHSTAN5.6325PERU5.6226DENMARK5.5027USA5.4928TURKEY5.3829LATVIA5.3630AUSTRALIA5.33 31THAILAND5.3132CZECH REPUBLIC5.3133INDIA5.2934HUNGARY5.2835UKRAINE5.2636LITHUANIA5.1837ARGENTINA5.1838GREECE5.1339TAIWAN5.1340MEXICO5.0641ROMANIA5.0042COLOMBIA4.9843VENEZUELA4.9344ICELAND4.8845ESTONIA4.8746NORWAY4.8647ITALY4.7848KOREA4.6949SOUTH AFRICA4.6750BRAZIL4.5551FRANCE4.4352NEW ZEALAND4.3453SPAIN4.2754PORTUGAL4.0355SLOVENIA3.9256BULGARIA3.6157CHINA MAINLAND3.5958RUSSIA3.5859JAPAN3.2460CROATIA2.86Ranking2014INTERNATIONAL EXPERIENCElowsignificantInternational experience of senior managers is generally1MALAYSIA7.442NETHERLANDS7.343IRELAND7.334DENMARK7.155USA6.926HONG KONG6.927CANADA6.898SWITZERLAND6.879FINLAND6.809SWEDEN6.8011NORWAY6.7612UNITED KINGDOM6.6913UAE6.5814PHILIPPINES6.4015INDONESIA6.3516AUSTRALIA6.2717SINGAPORE6.2318ICELAND6.2119ISRAEL6.1720JORDAN6.1021GERMANY6.0021TURKEY6.0023FRANCE5.9324KAZAKHSTAN5.8825BELGIUM5.8126AUSTRIA5.7027INDIA5.6328TAIWAN5.5529CHILE5.5230GREECE5.5131THAILAND5.5032LUXEMBOURG5.4133NEW ZEALAND5.3234QATAR5.2435CZECH REPUBLIC5.2036ROMANIA5.1737POLAND5.1538ITALY5.1539RUSSIA5.0740KOREA5.0641LATVIA5.0542SPAIN4.8943PORTUGAL4.8544CHINA MAINLAND4.8345ARGENTINA4.8246LITHUANIA4.7547MEXICO4.7448SLOVAK REPUBLIC4.5449SLOVENIA4.4450SOUTH AFRICA4.3951COLOMBIA4.3852VENEZUELA4.1453HUNGARY4.1254PERU3.8655ESTONIA3.7556JAPAN3.7457UKRAINE3.7158BRAZIL3.4559CROATIA2.8360BULGARIA2.73Ranking2014COMPETENT SENIOR MANAGERSare not readily availableare readily availableCompetent senior managers 
25
IMD World Talent Report 2014 
1SWITZERLAND8.652FINLAND8.453SINGAPORE8.174CANADA7.855IRELAND7.626GERMANY7.597DENMARK7.448NETHERLANDS7.369NEW ZEALAND7.3210AUSTRALIA7.2311MALAYSIA6.8612ICELAND6.8313UAE6.8114BELGIUM6.7215NORWAY6.3616HONG KONG6.1917FRANCE6.1618QATAR5.9719AUSTRIA5.9620INDONESIA5.8921USA5.8922LUXEMBOURG5.8423UNITED KINGDOM5.8424ISRAEL5.8325TAIWAN5.8126ESTONIA5.7227JAPAN5.7228POLAND5.5729KOREA5.4830SWEDEN5.3631PHILIPPINES5.3132PORTUGAL5.1433JORDAN5.1034CZECH REPUBLIC5.0235INDIA4.8936KAZAKHSTAN4.8337LATVIA4.7538LITHUANIA4.6639SPAIN4.5740SLOVENIA4.4441ITALY4.3842RUSSIA4.2543HUNGARY4.19 44ROMANIA4.1645UKRAINE4.0946TURKEY3.9647GREECE3.9248CHINA MAINLAND3.6749THAILAND3.6250COLOMBIA3.4951CHILE3.3652SLOVAK REPUBLIC3.2853CROATIA3.2154MEXICO3.2155ARGENTINA2.7256PERU2.6857VENEZUELA2.0958BULGARIA1.9359BRAZIL1.8060SOUTH AFRICA1.71Ranking2014EDUCATIONAL SYSTEMdoes not meet the needs of a competitive economymeets the needs of a competitive economyThe educational system1SINGAPORE8.362SWITZERLAND7.583FINLAND7.334CANADA7.005MALAYSIA6.986UAE6.777HONG KONG6.538TAIWAN6.479DENMARK6.3010JAPAN6.2611FRANCE6.2612NETHERLANDS6.1213IRELAND6.0914INDIA5.9715INDONESIA5.9616QATAR5.9417POLAND5.7618GERMANY5.7519ESTONIA5.6820BELGIUM5.5221AUSTRALIA5.3522CHINA MAINLAND5.3323KAZAKHSTAN5.3324ISRAEL5.2825LUXEMBOURG5.2726ICELAND5.2527NEW ZEALAND5.2328USA5.1629RUSSIA5.1330JORDAN4.9931UNITED KINGDOM4.9132PHILIPPINES4.7033KOREA4.6734NORWAY4.6235PORTUGAL4.5236HUNGARY4.5037ROMANIA4.4838SLOVENIA4.4639CZECH REPUBLIC4.4240SWEDEN4.4041GREECE4.3442ITALY4.1243LATVIA4.1044THAILAND4.0545LITHUANIA4.0346SPAIN4.0047AUSTRIA3.9348UKRAINE3.8849SLOVAK REPUBLIC3.6650TURKEY3.4651CHILE3.3952MEXICO3.3853COLOMBIA2.9754CROATIA2.8655BULGARIA2.5156PERU2.4957VENEZUELA2.4558ARGENTINA2.3659BRAZIL2.0660SOUTH AFRICA1.85Ranking2014SCIENCE IN SCHOOLSis not sufficiently emphasizedis sufficiently emphasizedScience in schools 
26
IMD World Talent Report 2014 
1SWITZERLAND8.682CANADA8.193FINLAND8.164SINGAPORE8.105DENMARK7.736GERMANY7.727USA7.648IRELAND7.619ISRAEL7.5310NETHERLANDS7.4811BELGIUM7.2212UAE7.0013HONG KONG6.9914MALAYSIA6.9015AUSTRIA6.8516AUSTRALIA6.8417ICELAND6.6018NEW ZEALAND6.5719SWEDEN6.5420INDONESIA6.4221NORWAY6.4122UNITED KINGDOM6.2823QATAR6.2624FRANCE6.1025LUXEMBOURG6.0025PORTUGAL6.0027ESTONIA5.9628PHILIPPINES5.8529LATVIA5.7030POLAND5.5731TAIWAN5.4532CHILE5.1732INDIA5.1734LITHUANIA5.0835RUSSIA5.0436CZECH REPUBLIC4.9837JORDAN4.9637SOUTH AFRICA4.9639ITALY4.8740ROMANIA4.7641JAPAN4.7442UKRAINE4.7443HUNGARY4.7244KAZAKHSTAN4.6345VENEZUELA4.5946SPAIN4.5847MEXICO4.5548THAILAND4.5349ARGENTINA4.5150TURKEY4.5051GREECE4.4252COLOMBIA4.4153KOREA4.3454SLOVENIA4.3055CHINA MAINLAND4.2656SLOVAK REPUBLIC3.6257PERU3.5358BRAZIL3.2759CROATIA3.0260BULGARIA2.25Ranking2014UNIVERSITY EDUCATIONdoes not meet the needs of a competitive economymeets the needs of a competitive economyUniversity education1SWITZERLAND8.382USA7.933SINGAPORE7.864DENMARK7.805FINLAND7.566CANADA7.477GERMANY7.398NORWAY7.389NETHERLANDS7.3310MALAYSIA7.2811ICELAND7.2311IRELAND7.2313HONG KONG7.0114UAE6.9615ISRAEL6.8116SWEDEN6.7117AUSTRALIA6.6718PORTUGAL6.6519AUSTRIA6.4920UKRAINE6.4721NEW ZEALAND6.4222BELGIUM6.3823LATVIA6.3424TAIWAN6.2625PHILIPPINES6.2626INDONESIA6.2227INDIA6.1628UNITED KINGDOM6.1629ESTONIA6.1530FRANCE6.0031QATAR5.9732CZECH REPUBLIC5.8233POLAND5.7634SOUTH AFRICA5.5735TURKEY5.2736LUXEMBOURG5.1937GREECE5.1338HUNGARY5.1239SLOVENIA5.0540KAZAKHSTAN5.0141LITHUANIA4.9542THAILAND4.8943ITALY4.8844RUSSIA4.8745CHINA MAINLAND4.8246JORDAN4.8147KOREA4.8148ROMANIA4.7349JAPAN4.5950SLOVAK REPUBLIC4.5851CHILE4.4852MEXICO4.3953SPAIN4.2554COLOMBIA3.8055BRAZIL3.6656CROATIA3.5457VENEZUELA3.4558ARGENTINA3.1659PERU3.0460BULGARIA2.36Ranking2014MANAGEMENT EDUCATIONdoes not meet the needs of the business communitymeets the needs of the business communityManagement education 
27
IMD World Talent Report 2014 
1LUXEMBOURG8.632DENMARK8.603NETHERLANDS8.494SWITZERLAND8.425FINLAND8.206UAE8.207ICELAND8.178CANADA8.009SINGAPORE7.9310SWEDEN7.8911GREECE7.8912NORWAY7.7813LATVIA7.7114ISRAEL7.7015MALAYSIA7.5216BELGIUM7.3717PORTUGAL7.1718PHILIPPINES7.0519GERMANY6.9320SLOVENIA6.8621POLAND6.8222ROMANIA6.7323INDONESIA6.6524AUSTRIA6.6425LITHUANIA6.5626ESTONIA6.4927QATAR6.4628INDIA6.2529HONG KONG5.9530KOREA5.9431CROATIA5.6732SLOVAK REPUBLIC5.5133UKRAINE5.4334CZECH REPUBLIC5.3135TAIWAN5.2536AUSTRALIA5.2537KAZAKHSTAN5.1538JORDAN5.1439SOUTH AFRICA5.0940USA5.0541IRELAND5.0442NEW ZEALAND5.0042TURKEY5.0044CHINA MAINLAND4.9545ARGENTINA4.8246MEXICO4.4647BULGARIA4.4048FRANCE3.9449RUSSIA3.8950UNITED KINGDOM3.6651THAILAND3.6452ITALY3.5553PERU3.3354JAPAN3.1155HUNGARY3.0856SPAIN3.0557COLOMBIA3.0258VENEZUELA3.0059CHILE2.9560BRAZIL2.46Ranking2014LANGUAGE SKILLSare not meeting the needs of enterprisesare meeting the needs of enterprisesLanguage skills 
28
IMD World Talent Report 2014 
Notes and Sources 
Collaboration with 55 Partner Institutes worldwide helps us gather complete, up-to-date and reliable statistics. 
The date shown in the criteria table is the reference year of the data. When statistical data is not available the name appears at the bottom of the statistical table and a dash is shown. When the data is one-year old, a “1” is shown next to the criterion value, a “2” represents data from two previous years, etc. 
Total public expenditure on education (%) 
Government Finance Statistics Yearbook 2013 
Eurostat April 2014 
National sources 
Jordan, Chile and Luxembourg: Budgetary central government. 
Total public expenditure on education per pupil 
Government Finance Statistics Yearbook 2013 
National sources 
Croatia: Sum of expenditure from central government and local governments. Jordan, Chile and Luxembourg: Budgetary central government. 
Pupil-teacher ratio (primary education) 
UNESCO http://stats.uis.unesco.org 
OECD Education at a Glance 2013 
National sources 
For public and private institutions, based on full-time equivalent. Primary education (ISCED level 1): level of which the main function is to provide the basic elements of education at such establishments as elementary schools, primary schools. The ratio of students to teaching staff is calculated as the total number of full-time equivalent students divided by the total number of full-time equivalent educational personal. Teaching staff refers to professional personnel directly involved in teaching students. The classification includes classroom teachers; special education teacher; and other teachers who work with students as a whole class in a classroom, in small groups in a resource room, or in one-to-one teaching inside a regular classroom. Teaching staff also includes chairpersons of departments whose duties include some amount of teaching, but it does not include non-professional personnel who support teachers in providing instructions to students, such as teacher’s aides and other paraprofessional personnel. Data are UNESCO or OECD estimates and from national statistics. Australia, Israel, Italy, Norway, and Russia: public institutions only. Hong Kong: figures refer to the position as at mid-September of the respective years (i.e. the beginning of an academic year spanning two calendar years). Teaching staff includes teachers as well as principles; figures cover local schools, special and international schools. 
Pupil-teacher ratio (secondary education) 
UNESCO http://stats.uis.unesco.org 
OECD Education at a Glance 2013 
National sources 
For public and private institutions, based on full-time equivalent. Secondary education (ISCED levels 2 and 3): level providing general and/or specialized instruction at middle schools, secondary schools, high schools, teacher training schools and schools of a vocational or technical nature. The ratio of students to teaching staff is calculated as the total number of full-time equivalent students divided by the total number of full-time equivalent educational personal. Teaching staff refers to professional personnel directly involved in teaching students. The classification includes classroom teachers; special education teacher; and other teachers who work with students as a whole class in a classroom, in small groups in a resource room, or in one-to-one 
29
IMD World Talent Report 2014 
teaching inside a regular classroom. Teaching staff also includes chairpersons of departments whose duties include some amount of teaching, but it does not include non-professional personnel who support teachers in providing instructions to students, such as teacher’s aides and other paraprofessional personnel. Data are UNESCO or OECD estimates and from national statistics. Australia, Canada, Ireland, Israel, Italy, Jordan, Norway and Russia: public institutions only. Australia: includes only programs in upper secondary education. Belgium: excludes independent private institutions. Hong Kong: figures refer to the position as at mid- September of the respective years (i.e. the beginning of an academic year spanning two calendar years). Teaching staff includes teachers as well as principles; figures cover local schools, special and international schools. 
Female labor force (%) 
OECD (2014), Main Economic Indicators - complete database 
National sources 
Estimate for 2013. Austria: break in series in 2008. Denmark: break in series in 2009. Indonesia: as of August for 2010. Malaysia: break in series in 2010. Portugal: methodological change in 2011. Romania: break in series in 2002, third quarter for 2013. Spain: break in series in 2005. 
Labor force growth 
OECD (2013), “Main Economic Indicators - complete database 
National sources 
Estimates for 2013. Austria: break in series in 2008. Denmark: break in series in 2009. Lithuania: break in series 2011 - census revised labor force figure downwards by 10% (emigration to EU over past decade). Latvia: break in series in 2012. Malaysia: break in series in 2010. Romania: break in series in 2002, third quarter for 2013. Portugal: methodological change in 2011. Spain: break in series in 2005. Lithuania: break in series 2011 - census revised labor force figure downwards by 10% (emigration to EU over past decade). 
Cost-of-living index 
MERCER Cost of Living survey, March 2013 
www.mercer.com 
The Mercer survey covers 214 cities across five continents and measures the comparative cost of over 200 items in each location, including housing, transport, food, clothing, household goods and entertainment. It is the world’s most comprehensive cost of living survey and is used to help multinational companies and governments determine compensation allowance for their expatriate employees. New York is used as the base city (=100) for the index and all cities are compared against New York. Currency movements are measured against the US dollar. The cost of housing – often the biggest expense for expats - plays an important part in determining where cities are ranked. 
Mercer data is shown for cities (sometimes several data per country). Therefore, the WCC team made an average for each WCY country. Data is not always comparable over years (money fluctuations in 2010 and 2011). 
Executive Opinion Survey 
Every year, for our flagship publication, The IMD World Competitiveness Yearbook, we conduct an Executive Opinion Survey in order to complement the statistics that we use from international, national and regional sources. Whereas the Hard Data shows how competitiveness is measured over a specific period of time, the Survey Data measures competitiveness as it is perceived. The survey was designed to quantify issues that are not easily measured, for example: management practices, labor relations, corruption, environmental concerns or quality of life. The survey responses reflect present and future perceptions of competitiveness by business executives who are dealing with international business situations. Their responses are more recent and closer to reality since there is no time lag, which is often a problem with Hard Data that shows a “picture of the past”. 
The Executive Opinion Survey is sent to executives in top- and middle management in all of the economies covered by the WCY. In order to be statistically representative, we select a sample size which is proportional 30
IMD World Talent Report 2014 
to the GDP of each economy. The sample of respondents are representative of the entire economy, covering a cross-section of the business community in each economic sector: primary, manufacturing and services, based on their contribution to the GDP of the economy. The survey respondents are nationals or expatriates, located in local and foreign enterprises in the economy and which, in general, have an international dimension. They are asked to evaluate the present and expected competitiveness conditions of the economy in which they work and have resided during the past year, drawing from the wealth of their international experience, thereby ensuring that the evaluations portray an in-depth knowledge of their particular environment. We try to contact most IMD alumni and all responses returned to IMD are treated as confidential. The surveys are sent in January and are returned in April; in 2014, we received 4,300 responses from the 60 economies worldwide. The respondents assess the competitiveness issues by answering the questions on a scale of 1 to 6. The average value for each economy is then calculated and converted into a 0 to 10 scale. 
31
IMD World Talent Report 2014 
Partner Institutes 
Argentina 
Economic Development and Institutions Research Program Faculty of Economic Science Catholic University of Argentina, Buenos Aires Dr. Carlos G. Garaventa, Dean Dr. Marcelo F. Resico, Senior Economist Dr. Ernesto A. O’Connor, Senior Economist Ms. Sofía Ahualli, Research Assistant www.uca.edu.ar/index.php/site/index/es/uca/facultad-ciencias-economicas/ 
Australia 
CEDA - Committee for Economic Development of Australia, Melbourne Professor the Hon. Stephen Martin, Chief Executive Officer Ms. Roxanne Punton, National Communications and Marketing Manager Ms. Sarah-Jane Derby, Senior Research Analyst www.ceda.com.au 
Austria 
Federation of Austrian Industries, Vienna Austrian Institute of Economic Research, Vienna Dr. Christian Helmenstein, Chief Economist Ms. Helena Zwickl Mr. Michael Oliver http://www.iv-net.at 
Belgium 
FEB - Federation of Enterprises in Belgium, Brussels Ms. Morgane Haid, Economist www.vbo-feb.be 
Brazil 
Fundação Dom Cabral, Minas Gerais, Innovation Center Professor Carlos Arruda, Associate Dean of Business Partnership and Professor of Innovation and Competitiveness at FDC Ms. Herica Righi, Assistant Professor at FDC Ms. Ludmila Pimenta, Economics Student and Intern at FDC Innovation Center www.fdc.org.br 
Bulgaria 
Center for the Study of Democracy, Sofia Mr. Ruslan Stefanov, Director, Economic Program Ms. Daniela Mineva, Research Fellow, Economic Program Mr. Martin Tsanov, Analyst, Economic Program www.csd.bg 
Canada 
Institute for Competitiveness & Prosperity, Toronto Mr. Jamison Steeve, Executive Director Ms. Dorinda So, Policy Analyst http://www.competeprosper.ca/ Intifin Group, Toronto Mr. Brett Berman, Managing Director www.intifin.com/ 32
IMD World Talent Report 2014 
Chile 
Universidad de Chile, School of Economics and Business Dr. Enrique Manzur, Vice Dean Dr. Sergio Olavarrieta, Graduate Dean Mr. Pedro Hidalgo, Department Head www.fen.uchile.cl 
China Hong Kong 
Hong Kong Trade Development Council Mr. Daniel Poon, Principal Economist Ms. Wenda Ma, Economist www.hktdc.com 
China Mainland 
China Institute for Development Planning, Tsinghua University Prof. Youqiang Wang, Executive Director Dr. Yongheng Yang, Associate Professor, Assistant Director Dr. Yizhi Xiong, Associate Professor Mr. Pu Gong, PhD Student Mr. Haoyuan Li, MPhil Student Ms. Liang Li, MPhil Student 
Colombia 
National Planning Department, Bogota Mrs. Tatyana Orozco de la Cruz, General Director Mr. Rodrigo Moreira, Enterprise Development Director Mr. John Rodríguez, Project Manager Mrs. Sara Patricia Rivera, Research Analyst www.dnp.gov.co 
Croatia 
National Competitiveness Council, Zagreb Ms. Jadranka Gable, Advisor Mr. Kresimir Jurlin, PhD, Researcher 
Czech Republic 
CERGE-EI, Prague Mr. Daniel Münich Dr. Vilem Semerak www.cerge-ei.cz 
Denmark 
Confederation of Danish Industry (DI) Mr. Allan Sorensen http://di.dk/English/Pages/English.aspx 
Estonia 
Estonian Institute of Economic Research, Tallinn Ms. Marje Josing Ms. Ingrid Niklus Mr. Koit Nilson, Researcher www.ki.ee 
Enterprise Estonia, Tallinn Mr. Ülari Alamets, Head of the Board 33
IMD World Talent Report 2014 
Finland 
ETLA, The Research Institute of the Finnish Economy, Helsinki Mr. Petri Rouvinen, Research Director Mr. Markku Kotilainen, Head of the Forecasting Group Mr. Vesa Vihriälä, Managing Director www.etla.fi 
France 
Invest in France Agency, Paris Ms. Sylvie Montout, Economist www.invest-in-france.org 
Germany 
Federation of German Industries (BDI), Berlin Ms. Soveigh Jaeger, Department of Economic and Industrial Policy www.bdi-online.de 
Greece 
Federation of Industries of Northern Greece, Thessaloniki Dr. Christos Georgiou, Director, Research and Documentation Department Mr. Constantinos Styliaras, MBA, Economist, Research and Documentation Department 
Foundation for Economic and Industrial Research (FEIR/IOBE), Athens Dr. Aggelos Tsakanikas, Research Director 
Hungary 
ICEG European Center, Budapest Ms. Renata Anna Jaksa, Director Mr. Oliver Kovacs, Research Fellow www.icegec.org 
Iceland 
Icelandic Chamber of Commerce, Reykjavik Mr. Leifur Porbergsson www.chamber.is 
India 
National Productivity Council, New Delhi Dr. K.P.Sunny, Group Head (Economic Services & Administration), Project Director Mr. Deepak Gupta, Assistant Director (Economic Services), Project Associate www.npcindia.gov.in 
Indonesia 
Center for Strategic and International Studies, Jakarta Dr. Yose Rizal Damuri, Head of Department of Economics Ms. Pratiwi Kartika Mr. Dandy Rafitrandi, Research Assistant www.csis.or.id 
Ireland 
IDA Ireland, Investment and Development Agency, Dublin www.idaireland.com 
Israel 
The Federation of Israeli Chambers of Commerce, Tel-Aviv Ms. Israela Many, Deputy Managing Director of Economy and Tax Mr. Aviad Toub, Economist www.chamber.org.il 34
IMD World Talent Report 2014 
Italy 
CONFINDUSTRIA, Economic Research Department, Rome Dr. Luca Paolazzi, Director Research Centre Dr. Pasquale Capretta, Senior Economist 
Japan 
Mitsubishi Research Institute, Inc., Tokyo Research Center for Policy and Economy Mr. Hirotsugu Sakai, Research Director www.mri.co.jp 
Jordan 
Ministry of Planning and International Cooperation Jordan National Competitiveness Team Dr. Mukhallad Al-Omari, Director of Policies and Strategies Department Kawthar Al-Zubi, Team Leader Basma Arabiyat, Researcher www.jnco.gov.jo 
Kazakhstan 
Economic Research Institute JSC of the Ministry of Economy and Budget Planning of the Republic of Kazakhstan, Astana Mr. Maksat Mukhanov, Chairman of the Board of the Economic Research Institute JSC Dr. Shakharbanu Zhakupova, Director of the Center for Strategic Development and Economic Research Ms. Sholpan Ibraimova, Head of the Department for Competitiveness Research Ms. Ardak Beisenova, Senior Expert of the Department for Competitiveness Research Ms. Rufinat Bissekenova, Senior Expert of the Department for Competitiveness Research www.economy.kz 
Korea 
Korea Institute for International Economic Policy (KIEP) Dr. Heungchong Kim, Director, Department of Planning and Research Coordination Ms. Nayoun Park, Researcher www.kiep.go.kr/eng/about/abo01.jsp 
Lithuania 
Enterprise Lithuania, Vilnius Mrs. Jurgita Butkeviciene, Export Department Manger Ms. Rasa Narusaityte, Senior Project Manager www.enterpriselithuania.com 
Luxembourg 
Chamber of Commerce of the Grand Duchy of Luxembourg Mr. Marc Wagener, Member of the Managing Board Ms. Annabelle Dullin, Economist www.cc.lu 
Malaysia 
Malaysia Productivity Corporation (MPC), Petaling Jaya Dato’ Mohd Razali Hussain, Director General Ms. Lee Saw Hoon, Senior Director www.mpc.gov.my 35
IMD World Talent Report 2014 
Mexico 
Strategic Studies Center for Competitiveness, Saltillo Ing. Carlos Maroto Cabrera, General Director Lic. Carlos Maroto Espinosa, Project & Relationship Manager Lic. Natalia Maroto Espinosa, Administration Manager www.competitividad.info 
Netherlands 
Confederation of Netherlands Industry and Employers (VNO-NCW), The Hague. Mr. Paul van Kempen, Advisor Economic policy www.vno-ncw.nl 
New Zealand 
New Zealand Institute of Management Inc, Wellington Mr. Garry Sturgess, Chief Executive Ms. Fiona Zhou, Administration & Registry Manager www.nzim.co.nz 
Norway 
Confederation of Norwegian Enterprise, Oslo Mr. Aslak Larsen Molvar, Senior Economist Mr. Morten Trasti, Advisor www.nho.no 
Peru 
CENTRUM Católica Graduate Business School, Lima Mr. Fernando D’Alessio, Director General Mr. Luis Del Carpio, Director Center of Competitiveness http://centrum.pucp.edu.pe 
Philippines 
Asian Institute of Management Policy Center, Makati City Ronald U. Mendoza, Executive Director Tristan A. Canare, Economist Mari Chrys R. Pablo, Economist Jean Rebecca D. Labios, Program Associate Charles Irvin S. Siriban, Research Associate http://policy.aim.edu/ 
Poland 
Warsaw School of Economics, Warsaw Dr. Bogdan A. Radomski, Associate Professor of Finance Dr. Marcin Nowakowski, Professor of International Business and Prorector 
Portugal 
FORMEDIA European Institute of Entrepreneurs and Managers, Lisbon Manuel Valle Manuel Costa Reis Duarte Harris Cruz www.formedia.pt 36
IMD World Talent Report 2014 
Qatar 
Ministry of Development Planning and Statistics, Department of Economic Development, Doha Dr. Frank Harrigan, Director, Department of Economic Development Dr. Issa Ibrahim, Economic Expert (Project Manager), Department of Economic Development Mr. Hassan Al-Sokary, Researcher, Ministry of Development Planning and Statistics / Statistics Sector Miss Shaikha Salem Al Hmoud, Statistical Researcher, Ministry of Development Planning / Statistics Sector 
Romania 
IRECSON – Romanian Institute for Economic-Social Research and Polls, Bucharest Prof. Dumitru Porojan PhD, President Mr. Bogdan Ciocanel, Executive Director www.irecson.ro 
Russia 
Moscow Business School Ms. Elina Pechonova http://mbschool.ru/ 
Singapore 
Economics Division, Ministry of Trade and Industry, Singapore Ms Yong Yik Wei, Director Mr Tan Kok Kong, Lead Economist Mr Kenny Goh, Senior Economist Mr Kuhan Harichandra, Senior Economist Dr Andy Feng, Senior Economist www.mti.gov. 
Singapore Business Federation Ms. Cheryl Kong, Assistant Executive Director www.sbf.org.sg/ 
Slovak Republic 
The F. A. Hayek Foundation, Bratislava Mr. Martin Kapko, Project Manager www.hayek.sk 
Slovenia 
Institute for Economic Research, Ljubljana Prof. Peter Stanovnik Ms. Sonja Uršic, M.A. www.ier.si 
University of Ljubljana, Faculty of Economics, Ljubljana Prof. Mateja Drnovšek Prof. Aleš Vahcic 37
IMD World Talent Report 2014 
South Africa 
Productivity SA, Midrand Mr. Bongani Coka, CEO Mr. Sello Mosai, Executive Manager, Knowledge Management, Value Chain Competitiveness Department Ms. Keneuoe Mosoang, Chief Economist, Value Chain Competitiveness Department www.productivitysa.co.za 
Spain 
Spanish Confederation of Employers, Madrid Ms. Edita Pereira, Head of Economic Research Unit Ms. Paloma Blanco, Economic Research Unit www.ceoe.es 
Taiwan 
National Development Council, Taipei Dr. Chen, Chien-Liang, Deputy Minister Mr. Chen, Pao-Jui, Director of Economic Development Department Ms. Lee, Cho-Jin, Senior Economist www.ndc.gov.tw 
Thailand 
Thailand Management Association, Bangkok Ms. Wanweera Rachdawong, Chief Executive Officer Ms. Pornkanok Wipusanawan, Director, TMA Center for Competitiveness www.tma.or.th 
Turkey 
Turkish Industrialists’ and Businessmen’s Association (TUSIAD), Istanbul Economic Research Department Mr. Cem Dogan, Economist www.tusiad.us 
Ukraine 
International Management Institute (MIM-Kyiv) Dr. Iryna Tykhomyrova, President Dr. Volodymyr Danko, Professor Ms. Oksana Kukuruza, External Relations Director www.mim.kiev.ua 
United Arab Emirates 
Emirates Competitiveness Council H.E Abdulla Nasser Lootah, Secretary General 
Venezuela 
National Council to Investment Promotion (CONAPRI) Mr. Eduardo Porcarelli, Executive Director Ms. Litsay Guerrero A, Economic Affairs & Investor Services Manager www.conapri.org 
38
IMD World 
Competitiveness 
Center 
PIONEERS IN 
COMPETITIVENESS 
SINCE 1989
ARTURO BRIS 
Director 
IMD World Competitiveness Center 
Professor of Finance 
We are dedicated to the advancement of knowledge on world competitiveness by offering benchmarking services for countries and companies using the latest and most relevant data on the subject. 
“There is no single nation in the world that has succeeded in a sustainable way without preserving the prosperity of its people. Competitiveness refers to such objective: it determines how countries, regions and companies manage their competencies to achieve long-term growth, generate jobs and increase welfare. Competitiveness is therefore a way towards progress that does not result in winners and losers: when two countries compete, both are better off.”
The IMD World Competitiveness Center is dedicated to the advancement of knowledge on world competitiveness by gathering the latest and most relevant data on the subject and by analyzing the policy consequences. 
The Center conducts its mission in cooperation with a network of 55 partner institutes worldwide to provide the government, business and academic community with the following services: 
»» 
Competitiveness Assessment & Education 
»» 
Programs/Workshops/Conferences on Competitiveness 
»» 
Special country/regional competitiveness reports 
»» 
World Competitiveness Online 
In our efforts to match the dynamism of competitiveness, we are committed to further our cutting-edge research and to broadening our activities portfolio. 
IMD WORLD COMPETITIVENESS CENTER 
FOR OVER 25 YEARS IMD WORLD COMPETITIVENESS CENTER HAS PIONEERED RESEARCH ON HOW NATIONS AND ENTERPRISES COMPETE TO LAY THE FOUNDATIONS FOR FUTURE PROSPERITY. 
THE COMPETITIVENESS OF NATIONS IS PROBABLY ONE OF THE MOST SIGNIFICANT DEVELOPMENTS IN MODERN MANAGEMENT AND IMD INTENDS TO REMAIN A LEADER IN THIS FIELD.
The yearbook benchmarks the performance of 60 countries based on 338 criteria (2/3 statistical data and 1/3 survey data). 
It measures the different facets of competitiveness, grouped into four factors (economic performance, government efficiency, business efficiency and infrastructure). 
The main sections in the IMD World Competitiveness Yearbook: Rankings, 
Country Profiles and Statistical Tables. 
The IMD World Competitiveness Yearbook is considered an invaluable research tool for benchmarking competitiveness performance and is used by: 
Business: To determine investment plans and location assessment. 
Government: Leaders use our essential information to benchmark policies. 
Academics: Professors and students use our exceptional wealth of data to analyze the complex mechanism of world competitiveness. 
IMD WORLD COMPETITIVENESS YEARBOOK 2014 
THE REFERENCE ON THE MARKET 
The IMD World Competitiveness Yearbook is the leading annual report on the competitiveness of nations and has been published by IMD since 1989.
COUNTRY PROFILES 
View a country’s overall performance, learn about its evolution, its strengths and weaknesses and access all criteria used to assess its competitiveness. 
SELECT DATA 
Based on the World Competitiveness Yearbook’s methodology you can view any selection of countries, rankings and data, over 19-year time series for most criteria. 
Data can be viewed in tables or charts and downloaded in Excel and CSV. 
IMD WORLD COMPETITIVENESS ONLINE 
Online access to the latest competitiveness data – find, compare and customize! 
World Competitiveness Online (WCO) is an interactive and regularly updated website that provides access to the world’s largest competitiveness database, news, videos and our monthly newsletter. 
IMD WORLD COMPETITIVENESS PACKAGE 
Immediate access to the IMD World Competitiveness Online, the largest database on world competitiveness for customized research, regularly updated. 
The IMD World Competitiveness Yearbook + CD (available in June), the reference report on the competitiveness of nations since 1989. 
Key Figures 
»» 
60 countries assessed 
»» 
338 criteria measuring different facets of competitiveness 
»» 
2/3 hard statistical data (international/ national sources) 
»» 
1/3 survey data (Executive Opinion Survey) 
»» 
Earliest data on the market every year 
»» 
Online database (World Competitiveness Online) regularly updated
CUSTOMIZED SOLUTIONS 
COMPANY COMPETITIVENESS SOLUTIONS 
The IMD World Competitiveness Center supports businesses in their efforts to strengthen their competitiveness by providing them with analytical tools including company specific competitiveness analyses and by developing customized programs for enterprises. 
Competitiveness Programs: 
Our Competitiveness programs focus on assessing and enhancing your company’s competitiveness by focusing on the factors that drive market leadership. The programs facilitate the executives to understand their role in improving the competitiveness of the company by: 
»» 
Discussing the main trends that are shaping the world economy today. 
»» 
Thinking from the outside-in in terms of the implications for your company, customers and business partners. 
»» 
Identifying strategies to win the market and create value for your company and your customers. 
»» 
Highlighting the success factors found in the most competitive environments. 
»» 
Discussing best practices to enhance competitiveness. 
»» 
Examining results and priorities for your company. 
In our efforts to match the dynamism of competitiveness, we are committed to further our cutting-edge research and to broadening our activities portfolio.
Special Competitiveness Reports 
Special reports are produced for governments that wish to assess their international competitiveness and benchmark their performance. These reports: 
»» 
Analyze competitiveness on the basis of over 300 criteria, using the Center methodology. 
»» 
Allow cross-country comparisons on a regional and global scale. 
»» 
Provide insights that can inform decision- making. 
»» 
Help to establish priorities and policies. 
»» 
Are used to promote investment in a country, state or region. 
Special reports are developed in cooperation with a local Partner Institute. 
COUNTRY AND REGIONAL COMPETITIVENESS ASSESSMENT 
Benchmark your economy against the World Competitiveness Yearbook countries! The IMD World Competitiveness Center supports governments highlight competitive advantages and uncover opportunities. 
In addition to its flagship publication, the IMD World Competitiveness Yearbook, the IMD World Competitiveness Center also aids governments to meet their needs through various customized solutions, including workshops and conferences. 
The report helps you to better assess the competitiveness of your country or region and to pursue insightful decision making. 
Special projects, reports and workshops have been completed for these governments: 
United Arab Emirates 
Oman 
Kuala Lumpur 
Kazakhstan 
Abu Dhabi (Emirate) 
Saudi Arabia 
Qatar 
Dubai (Emirate) 
Sabah (State of Malaysia) 
Selangor (State of Malaysia) 
Ile-de-France (Region in France) 
Klang Valley (Region in Malaysia) 
Galicia (Region in Spain) 
Terengganu (State of Malaysia) 
Mongolia
FOLLOW US ON 
CONTACT US: 
IMD World Competitiveness Center 
Chemin de Bellerive 23, P.O. Box 915, 
CH-1001 Lausanne - Switzerland 
Central tel: +41 21 618 02 51 
wccinfo@imd.org www.imd.org/wcc 
GET IN CONTACT WITH THE IMD WORLD COMPETITIVENESS CENTER: 
»» 
If you are a corporate executive interested in the market position of your company. With a long-term focus and want to understand the driving forces of competitiveness in the business world. 
»» 
If you are a government official or a member of an international agency and need access to the most comprehensive study of world competitiveness; if you need to assess the competitiveness of a particular country or region; if you want to learn from other countries´ success stories. 
»» 
If you are a researcher and want to access the largest database of competitiveness factors worldwide, spanning 60 economies in the last 25 years. 
THE IMD DIFFERENCE 
IMD is a top-ranked business school. 
We are the experts in developing global leaders 
through high‑impact executive education. 
Why IMD? 
»» 
We are 100% focused on real-world executive development 
»» 
We offer Swiss excellence with a global perspective 
»» 
We have a flexible, customized and effective approach 
www.imd.org 
Chemin de Bellerive 23 
P.O. Box 915 
CH-1001 Lausanne 
Switzerland 
Central tel: +41 21 618 01 11 
Central fax: +41 21 618 07 07 
info@imd.org 
IMD, IMD INTERNATIONAL and IMD INTERNATIONAL REAL WORLD. REAL LEARNING are trademarks of IMD – International Institute for Management Development. 
Photography: Régis Colombo, Nate Henderson, Richard Juilliart, Oliver O’Hanlon, Thierry Porchet, Yves Ryncki, Jean Scheim (Black and White) ©IMD 2014

2014 World Talent Report

  • 1.
    2014 IMD World Talent Report By the IMD World Competitiveness Center
  • 2.
    IMD World TalentReport 2014 November 2014 IMD World Talent Report 2014 Copyright © 2014 by IMD: Institute for Management Development, Lausanne, Switzerland For further information, please contact the IMD World Competitiveness Center at: IMD 23, Ch. de Bellerive P.O. Box 915 CH-1001 Lausanne Switzerland Tel : +41 21 618 02 51 Fax : +41 21 618 02 04 e-mail : wccinfo@imd.org Internet: www.imd.org/wcc eShop: www.wcceshop.org The IMD World Competitiveness Center team: At IMD Professor Arturo Bris Director of IMD World Competitiveness Center José Caballero Research Fellow Anne-France Borgeaud Pierazzi Senior Economist & Head of WCC Operations Madeleine Hediger Data Research and Online Services Specialist Carin Grydbeck Projects, Marketing and Press Coordinator William Milner Information Researcher Catherine Jobin Order and Sales administrator Luchia Mallet Programs and Client Relationship Associate Manager With the collaboration of IMD’s Information Center and Information Systems Department At KAESCO Jean-François Kaeser Consulting We also have the privilege of collaborating with a unique network of Partner Institutes, and other organizations, which guarantees the relevance of the data gathered.
  • 3.
    IMD World TalentReport 2014 Table of Contents IMD World Talent Ranking 2014 ............................................................................................................. 2 Analysis ................................................................................................................................................... 3 IMD World Talent Ranking 2005-2014 ................................................................................................. 12 Factor Rankings 2014 ............................................................................................................................ 13 2014 Criteria ......................................................................................................................................... 16 Notes and Sources ................................................................................................................................ 29 Partner Institutes .................................................................................................................................. 32 1
  • 4.
    IMD World TalentReport 2014 IMD World Talent Ranking 2014 The IMD World Talent Ranking 2014 shows the overall ranking for 60 economies. The economies are ranked from the most to the least competitive and the change from the previous year’s ranking (2013) are shown in brackets. The scores shown on the left are actually indices (0 to 100) generated for the unique purpose of constructing the graphs. 2
  • 5.
    IMD World TalentReport 2014 Analysis 1. Introduction The IMD World Competitiveness Center is delighted to present its IMD World Talent Report 2014, which includes a talent ranking for all countries that are part of the IMD World Competitiveness Yearbook (60 countries as of 2014). The data are gathered from the Center’s extensive database, which encompasses 19 years of competitiveness-related data. Access to such a comprehensive repository of data allows us to trace the evolution of the ranking over the last decade. The objective of the IMD World Talent Ranking is to assess the ability of countries to develop, attract and retain talent to sustain the talent pool available for enterprises operating in those economies. To this aim, it is important to assess how countries evolve within the talent ranking. Relevant data have thus been compiled from 2005 to 2014 and the ranking is based on both hard data and survey data. While the hard data have been gathered from various sources (see Appendix1), the survey data were obtained from the Center’s executive opinion survey, designed for the World Competitiveness Yearbook. We first present the 2014 World Talent Ranking to set the stage for the discussion and assessment of the evolution of the ranking. Although in the discussion that follows, we make reference to details of the performance of selected countries at the overall ranking and criterion level, we do not include all data in this report. Rather, for the evolution of the ranking we present only the overall ranking for all the years included in the report. We present data at all levels (i.e., criterion, factor and overall ranking) for the 2014 ranking. Interested readers can access data for all criteria employed in the development of this report through the World Competitiveness Online website. We have identified a list of talent competitive countries based on their 2005 to 2014 performance in the World Talent Ranking. These are the countries that have achieved a top 10 spot in the ranking for five or more years during the period of study. Such a performance is the result of an approach to talent competitiveness based on a balanced commitment to the development of home-grown talent and the attraction of overseas talent through policies that strive to meet the talent demands of the country. 2. The structure of the IMD World Talent Ranking The ranking is structured according to three factors: 1) investment and development, 2) appeal and 3) readiness: The investment and development factor takes into account the investment in and development of the home- grown talent. It traces the size of public investment on education by incorporating an indicator of public expenditure. It also looks at the quality of education through indicators related to pupil-teacher ratios. The development of talent is covered by variables related to the implementation of apprenticeship and the priority of employee training for companies. It also looks at the development of the female labor force. The appeal factor goes beyond the focus on the local labor force to incorporate into the analysis the ability of the country to tap into the overseas talent pool. It does so by including indicators such as the cost of living and quality of life in a particular economy. Specifically, it examines the ability of a country to attract highly-skilled foreign labor. In addition, it assesses the way enterprises prioritize the attraction and retention of talent. Another component of this factor evaluates the impact of brain drain on the competitiveness of countries. It also takes into account the level of worker motivation. The success of the investment in and development of talent and the ability to attract and retain talent is reflected in the availability of skills and competencies to sustain an economy’s talent pool. The readiness factor looks at the context of the talent pool. It considers the growth of the labor force and the quality of the skills available. It also takes into consideration the experience and competencies of the existing senior managers’ pool. The readiness factor focuses, in addition, on the ability of the educational system to meet the talent needs of enterprises. It examines the way in which the educational system fulfils the talent demands of the economy, the ability of higher education to meet that demand and the languages skills available. 3
  • 6.
    IMD World TalentReport 2014 4 Figure 1: Structure of the IMD World Talent Ranking Such a comprehensive set of criteria enables us to observe how countries perform in terms of sustaining their talent pool. In developing the talent ranking, we have omitted measures of the regulation of labor and productivity. The reason for this is because our objective is to assess the development and retention of talent, and the regulation of labor and its focus on conflict resolution could be perceived as peripheral to that objective. Similarly, productivity is an outcome of what we want to assess. Table 1: Components of the talent factors The IMD World Talent Ranking Investment and development factor Appeal factor Readiness factor Investment and development factor •Total public expenditure on education •Total public expenditure on education (per pupil) •Pupil-teacher ratio (primary) •Pupil-teacher ratio (secondary) •Apprenticeship •Employee training •Female labor force Appeal factor •Cost of living •Attracting and retaining •Worker motivation •Brain drain •Quality of life •Foreign skilled people Readiness factor •Labor force growth •Skilled labor •Finance skills •International experience •Competent senior managers •Educational system •Science in schools •University education •Management education •Language skills
  • 7.
    IMD World TalentReport 2014 3. Constructing the IMD World Talent Ranking In order to calculate the IMD World Talent Ranking, we:  Normalize data to the 0 to 1 values in order to bring all indicators into the same value range  Calculate the average of the normalized criteria  Use averaged criteria to generate the three talent competitiveness factors  Aggregate factors to build the overall talent ranking  Normalize the overall ranking to the 0 to 100 range to facilitate the interpretation of results However, there are some caveats. For certain years, our sample varies according to the evolution of the IMD World Competitiveness Yearbook. That is to say, some countries appear in the talent ranking only for the years in which they are part of the Yearbook. For example, Latvia only appears in the 2013 and 2014 talent rankings because it became part of the Yearbook in 2013. Similarly, rankings for Iceland are only available from 2010. Table 2: Sample size (2005-2014) Year# Countries200550200652200754200855200957201058201159201259201360201460 The survey data follow the evolution of the Yearbook. The executive opinion survey employed in the Yearbook is constantly updated and a relevant question for the talent ranking may only have been incorporated in recent years. Therefore the availability of data for that particular indicator could be restricted to only a segment of the decade considered in this report. Specifically, the apprenticeship indicator is available for 2013 and 2014. The attracting and retaining talent and management education indicators are available from 2007 and 2008 (respectively) to the present. Additionally, hard data may not be available for specific countries in specific years. Whenever possible, we use the most recent data available. In Table 3 we present all the definitions and relevant survey question. Note that the value range for all survey based criteria is of 0 to 10. 5
  • 8.
    6 Table 3:Criteria definitions and survey questions Criterion Definition/question Total public expenditure on education Total public expenditure on education as percentage of GDP Total public expenditure on education (per pupil) Total public expenditure on education per pupil as percentage of GDP per capita Pupil-teacher ratio (primary) Ratio of students to teaching staff, primary school Pupil-teacher ratio (secondary) Ratio of students to teaching staff, secondary school Apprenticeship Apprenticeship is sufficiently implemented Employee training Employee training is a high priority in companies Female labor force Percentage of total labor force Cost of living Index of a basket of goods & services in major cities, including housing (New York City = 100) Attracting and retaining Attracting and retaining talents is a priority in companies Worker motivation Worker motivation in companies is high Brain drain Brain drain (well-educated and skilled people) does not hinder competitiveness in your economy Quality of life Quality of life is high Foreign skilled people Foreign high-skilled people are attracted to your country's business environment Labor force growth Percentage change in labor force Skilled labor Skilled labor is readily available Finance skills Finance skills are readily available International experience International experience of senior managers is generally significant Competent senior managers Competent senior managers are readily available Educational system The educational system meets the needs of a competitive economy Science in schools Science in schools is sufficiently emphasized University education University education meets the needs of a competitive economy Management education Management education meets the needs of the business community Language skills Language skills are meeting the needs of enterprises Panel A: Investment and development factor Panel B: Appeal factor Panel C: Readiness factor 4. The IMD World Talent Ranking 2014 – Results The 2014 IMD World Talent Ranking is led by Switzerland, Denmark, Germany, Finland and Malaysia (1st to 5th respectively). In Table 4 we present the 2014 top 10 countries and in the sub-sections that follow, we discuss in detail the performance of several countries in the three talent competitiveness factors. Table 4: Top 10 talent raking, 2014 2014 Ranking Country 1 Switzerland 2 Denmark 3 Germany 4 Finland 5 Malaysia 6 Ireland 7 Netherlands 8 Canada 9 Sweden 10 Norway Top 10 countries
  • 9.
    IMD World TalentReport 2014 4.1 Investment and development factor Denmark leads the investment and development factor while Switzerland reaches the 2nd spot in the same factor. Austria follows in third place with Germany and Sweden ranking 4th and 5th place respectively. Within this factor, Iceland achieves the highest score in total expenditure on education (as a percentage of GDP) and Denmark leads in the total public expenditure on education per pupil indicator. The pupil-teacher ratios are headed by Sweden (primary school) and Portugal (secondary school). Portugal reaches the 20th position in the factor. Germany obtains the highest mark in the apprenticeship indicator followed closely by Switzerland (8.52) and Austria (7.63). For the same criterion, Malaysia (7.12), Japan (6.91), Indonesia (6.11) and Lithuania (5.97) make the top 10 (fourth, fifth, seventh and eighth, respectively). Ukraine comes 11th with a score of 5.47 and Turkey 12th with 5.46. Switzerland leads the way in employee training. Germany (7.79) and Japan (7.78) reach 2nd and 3rd respectively. In the same indicator, Romania achieves 7th place with 7.43, Estonia 14th with 6.63 and Lithuania 15th with 6.59. In terms of female labor force (as a percentage of the total labor force), Latvia (14th spot in the investment and development factor) obtains the highest score. While Lithuania (50.06%), Kazakhstan (49.13%) and Estonia (49.09%) reach the 2nd to 4th spots, Finland (48.34%) comes 6th and France 7th (47.84%). In this indicator, USA (46.80%) reaches 17th position, Switzerland (46.16) 24th and Germany (45.94%) 27th. 4.2 Appeal factor Switzerland heads the talent appeal factor with Germany, USA, Ireland and Malaysia (2nd to 5th respectively) completing the top 5. Luxembourg makes it to the 10th position in this factor. Within the appeal factor, in terms of the cost of living, USA is the least expensive (75.08) among the top 10 countries in the factor. Malaysia (78.60) and Germany (78.61) follow closely. The most expensive countries among the top 10 are Denmark (103.30), Norway (109.10) and Switzerland (115.90). In the quality of life criterion, Switzerland (9.73), Norway (9.47) and Germany (9.38) head the top 10 ranking while UAE (8.58), USA (8.33) and Malaysia (7.48) close it. Luxembourg obtains the lowest mark (6.93) in terms of attracting and retaining talents among the top10 countries in the factor. Other countries at the top of this indicator are Switzerland (8.38), Germany (8.00), Ireland (8.00), Denmark (7.87) and Norway (7.78). In the criterion of the level of worker motivation in companies, Malaysia ranks third with 7.68, only surpassed by Denmark (7.87) and Switzerland (7.94). In the same criterion, Austria (14th in the appeal factor) and Japan (24th) make it to the top 10 with 7.59 and 7.56 respectively. Finland (11th) and Sweden (13th) close ranks in the top 10 of the criterion obtaining 7.49 and 7.24 respectively. Norway (8.09) heads the brain drain (as hindrance for competitiveness in the economy) criterion. Switzerland (7.78) and Finland (7.76) follow. While Ukraine reaches 11th place with 6.34, the United Kingdom comes 12th with 6.27 and Hong Kong 14th with 5.95. The ability to attract foreign highly skilled people is led by Switzerland (8.87). Singapore obtains 8.17 (third place) while the United Kingdom (7.78) reaches eighth place, Hong Kong (7.47) ninth and Chile (7.43) 10th. 4.3 Readiness factor Switzerland heads the readiness factor followed by Finland (2nd), Netherlands (3rd), Denmark (4th) and UAE (5th). Within this factor, in the labor growth (percentage change) criterion Qatar achieves top score (14.55%) followed by UAE (9.31%), Venezuela (6.10%), Mexico (4.06%) and Peru (3.52%). Switzerland (1.41%) reaches 19th place, Germany (0.37%) 38th and Denmark (-0.12%) 48th position. In terms of skilled labor (readily available), Ireland (8.09) heads the top with Finland (7.76), Denmark (7.57), the Netherlands (7.48) and the Philippines (7.37) rounding up the top of the table. Malaysia (6.95) reaches 6th spot, Sweden (6.89) 8th, Switzerland (6.68) 10th and Germany (5.45) a distant 37th spot. Switzerland (8.33) leads in the availability of finance skills. Ireland (8.29) and Canada (8.19) complete the top 3. While Hong Kong (7.92) makes it to the 8th place, Israel (7.74) comes 10th, the United Kingdom (7.66) 11th and France (7.60) 12th. Switzerland (7.92) reaches the top in the international experience of senior managers (generally significant), the Netherlands (7.45) and Luxembourg (7.26) follow. Malaysia (7.23) reaches 4th spot, Ireland (7.17) 6th and Germany (6.84) 8th rank. Singapore (6.69) closes the top 10 with Denmark (5.50) in a distant 26th. In terms of competent senior managers (readily available), Malaysia (7.44), the Netherlands (7.34) and Ireland (7.33) lead the table. Hong Kong (6.92), Canada (6.89), Switzerland (6.87), Finland (6.80) and Sweden (6.80) reach the 6th to 10th positions. 7
  • 10.
    IMD World TalentReport 2014 Switzerland (8.65), Finland (8.45), Singapore (8.17), Canada (7.85) and Ireland (7.62) lead the way in the fit between the educational system and the needs of a competitive economy. New Zealand (7.32) and Australia (7.23) close the top 10 in this criterion. Singapore (8.36) tops the table in science in schools (sufficiently emphasized). Malaysia (6.98), UAE (6.77), Hong Kong (6.53) and Taiwan (6.47) reach the 5th to 8th spot (respectively). While Japan (6.26) closes the top 10, Germany (5.75) comes 18th. The top 5 for the University education (fulfil the needs of a competitive economy) criterion is Switzerland (8.68), Canada (8.19), Finland (8.16), Singapore (8.10) and Denmark (7.73). Malaysia (6.90), Sweden (6.54) and Norway (6.41) rank 14th, 19th and 21st respectively. Switzerland (8.38), USA (7.93) and Singapore (7.86) top the management education (meets the needs of the businesses) indicator. Malaysia (7.28) closes the top 10 while Sweden (6.71) ranks 16th and the United Kingdom (6.16) 28th. Luxembourg (8.63) leads the way in the availability of language skills followed by Denmark (8.60), the Netherlands (8.49), Switzerland (8.42) and Finland (8.20). While Singapore (7.93) and Sweden (7.89) round up the top 10, Norway (7.78) ranks 12th, Malaysia (7.52) 15th and Germany (6.93) 19th. 5. The IMD World Talent Ranking in retrospective (2005-2014) In this section we discuss the evolution of the IMD World Talent Ranking for a selected group of countries during the period 2005-2014. 5.1 Talent competitive countries Developing the 2005-2014 talent rankings enables us to identify countries that through the years consistently accomplish high scores; that is to say, the countries that rank in the top 10 for five or more years during the period assessed. We call these countries talent competitive. Talent competitive countries show a balanced approach between their commitment to education, investment in the development of local talent and their ability to attract overseas talent. The talent competitiveness strategies that these countries adopt strive to fulfil the demands of their economies. In this sense, talent competitive countries exhibit a high level of “agility” in the development of policies that impact their talent pipeline. In the following table we present the most talent competitive countries in the 2005-2014 period, Table 5. The most talent competitive countries (2005-2014) Country2005200620072008200920102011201220132014Austria6134649141311Canada5101067107588Denmark3323233222Finland241713485444Ireland1456101318168116Netherlands71587578757Norway151313181013106710Singapore10742891791716Sweden121255322339Switzerland1211111111 The fluctuation in the overall ranking experienced by some of these countries throughout the period may be the result of cyclical economic and socio-political issues that impact, for example, immigration policies and/or investment in education. In some cases, such policies could result in the diminishing ability of countries to attract overseas talent despite strong commitment to local talent development. In the next section we assess the proposition that talent competitive countries strike a balance between the development of local talent and the attraction of overseas talent through the adoption of policies that meet the talent requirements of their economies. We select countries based on their evolution in the talent ranking for 2005-2014. These short case studies include examples of countries that steadily remain in the top 10 of the rankings and others that fluctuate in and out the top 10 ranks. In addition, we include countries that consistently decline in their ranks and others that steadily rise. 8
  • 11.
    IMD World TalentReport 2014 5.2 Case studies 5.2.1 Brazil In the overall talent ranking, Brazil peaks at 28th in 2005 and experiences a decline to 52nd position in 2014. When comparing Brazil’s scores for 2005 and 2014 we observe that it has experienced a decline in most of the indicators and a particularly sharp drop in some of the criteria encompassed by the readiness factor. Among these we find several indicators. Brazil sees the labor force growth indicator steeply decline from 4.57% in 2005 to 0.75% in 2014. Similarly, the availability of skilled labor scores drop from 5.34 and 3.16 in the same period. The availability of finance skills falls sharply from 6.17 (2005) to 4.93 (2014) while the access to competent senior managers dwindles from 6.20 to 3.45. The ability of the country’s educational institutions to fulfil the talent demands of the market suffers a similar decrease. The educational system criterion steeply falls from 3.34 in 2005 to 1.80 in 2014 while the emphasis on science in schools drops from a value of 3.68 to 2.06. Such a considerable decline in the readiness factor occurs despite a somewhat stable investment and development factor. Brazil sees an increase in its total public expenditure on education from 4.60% in 2005 to 4.97% in 2014. The pupil-teacher ratio in primary education improves from 24.05 to 21.29. Similarly the pupil- teacher ratio secondary school is enhanced from 19.12 in 2005 to 16.35 in 2014. The prioritization of employee training slightly improves from 5.86 to 5.90 while the percentage of female labor force increases from 43.11% to 43.30%. Brazil ranks inconsistently in the appeal factor. It experiences a sharp increase in the cost of living index from 59.80 in 2005 to 95.30 in 2014. The level of worker motivation in the country also takes a dive from 6.66 to 5.43 while the brain drain indicator drops from 5.63 to 4.61. At the same time, the quality of life improves from 4.34 to 4.40 and the attracting and retaining talents indicator also increases from 6.59 in 2007 to 7.25 in 2014. The ability of the country to attract foreign highly skilled people slightly increases from 5.06 in 2005 to 5.17 in 2014. 5.2.2 India In the period 2005 to 2014 India rises from 29th place in 2005 to 26th in 2007, dropping to 34th in 2010. It returns to the 29th spot in 2011 to drop to 48th place in 2014. In the investment and development factor, results show that India increases the total public expenditure on education from 3.14% in 2005 to 3.80% in 2014. We observe a similar trend in pupil-teacher ratio in primary schools, which improves from 40.66 to 35.00. Likewise, the pupil-teacher ratio for secondary school improves from 32.32 to 30.00. Conversely, India’s total public expenditure on education per pupil decreases from 12.64% in 2012 to 11.78% in 2014. The country’s implementation of apprenticeship programs declines from 4.74 in 2013 to 4.51 in 2014. The prioritization of employee training in companies dwindles from 5.36 in 2005 to 5.08 in 2014. India’s percentage of female labor force also decreases from 31.65% in 2005 to 25.30% in 2014. In the appeal factor, India also sees a decline in the level of worker motivation criterion from 5.80 in 2005 to 5.11 in 2014. Brain drain as a hindrance to competitiveness also observes the same pattern, declining from 6.25 (2005) to 5.54 (2014). The ability of India to attract foreign highly skilled people similarly decreases from 4.96 in 2005 to 4.41 in 2014. India’s quality of life indicator decreases slightly from 4.64 in 2005 to 4.46 in 2014, while the attracting and retaining talents indicator also falls from 7.93 in 2007 to 6.86 in 2014. The country fares similarly in the readiness factor. The access to skilled labor sharply drops from 7.58 in 2005 to 5.75 in 2014. The availability of finance skills falls from 7.78 to 7.00 and likewise the international experience criterion somewhat increases from 5.11 to 5.29 during the same period. At the management level, the availability of competent senior managers indicator drops from 6.50 in 2005 to 5.63 in 2014. The management education fit to the needs of the business community also falls from 6.85 in 2008 to 6.16 in 2014. The readiness of India’s educational institutions to meet the demands of the economy likewise sees a decline in the period of study. The criterion of educational system obtains a score of 6.20 in 2005 but drops to 4.89 in 9
  • 12.
    IMD World TalentReport 2014 2014. In addition, the indicator for the emphasis assigned to science in schools decreases from 7.06 in 2005 to 5.97 in 2014. Similarly the university education criterion drops from 6.62 to 5.17 during the same years while the language skills indicator declines from 7.53 in 2005 to 6.25 in 2014. 5.2.3 Malaysia Malaysia experiences an opposite pattern to that of Brazil and India, steadily improving its position on the overall World Talent Ranking from 20th place in 2005 to the 6th spot in 2010 and up to the 5th rank in 2014. Within the readiness factor, Malaysia sees an increase in the score of the employee training criterion from 6.17 in 2005 to 7.71 in 2014. The availability of skilled labor improves from 5.77 to 6.95 while access to finance skills is enhanced from 6.15 to 7.40. At the senior management level, Malaysia improves in international experience from 5.83 in 2005 to 7.23 in 2014. Likewise, access to competent senior managers increases from 5.89 to 7.44. The ability of the country’s educational institutions to meet the talent requirement of the market is also enhanced in the 2005-2014 period. The educational system indicator rises from 5.54 to 6.86. Likewise, the university education criterion increases from 5.49 to 6.90, while that of language skills improves from 5.60 to 7.52. In addition, the emphasis that schools assign to science increases from 6.04 to 6.98 in the period under consideration. Malaysia’s appeal factor also improves. The level of worker motivation in companies increases from 6.08 in 2005 to 7.68 in 2014. At the same time, the criterion covering the brain drain as a hindrance to the competitiveness of the country improves from 4.84 and 6.51. Similarly, the ability of the country to attract foreign highly skilled people increases from 6.42 in 2005 to 7.24 in 2014, while the quality of life improves from 6.76 in 2005 to 7.48 in 2014. Similar improvements occur under the investment and development factor in the period 2005-2014. Malaysia’s pupil-teacher ratio for both primary and secondary education improves from 18.08 to 12.60 and from 16.50 to 13.10, respectively. The percentage of the country’s female labor force slightly increases from 36.06% in 2005 to 37.03% in 2014. The country’s implementation of apprenticeship programs increases from 6.49 in 2013 to 7.12 in 2014. Although Malaysia’s total public expenditure on education decreases from 6.98% in 2005 to 5.80% in 2014, the country’s total public expenditure on education per pupil improves from 20.54% in 2007 to 23.15% in 2014. 5.2.4 Singapore In the overall ranking, Singapore experiences an increase from the 10th spot in 2005, peaking at 2nd place in 2008 then descending to 9th in 2009 and 16th in 2014. The country’s scores in the investment and development factor seem low and cost of living is high – suggesting that Singapore currently has a large pool of talent that it has nurtured and attracted, but that this pool may shrink slightly in the future. While the total public expenditure on education peaks at 3.72% in 2005, it reaches its lowest (2.80%) in 2009. The primary school pupil-teacher ratio peaks at 25.00 in 2006 and steadily improves to 18.60 in 2014. The female percentage of the labor force criterion experiences a similar pattern, improving from 41.30% in 2005 to 44.68% in 2014. In the implementation of apprenticeship programs, Singapore’s scores of 5.26 in 2013 and 5.25 in 2014 are somewhat low when compared with those of countries that have moved up the overall ranking. For example, Denmark obtains 6.50 in 2013 and 6.26 in 2014. In terms of the prioritization of employee training, Singapore’s scores fluctuate from a high of 7.32 (2008) to a low of 6.27 in 2013 while Denmark remains above 7.32 throughout the decade with a highest of 8.24 in 2009. In the cost of living indicator, Singapore receives 83.60 in 2005; living costs increase to 125.11 in 2013 and 122.40 in 2014 (the most expensive in the sample). Scores for the quality of life are consistently high (above 8.00) with a lowest value of 8.00 in 2005 and a highest of 8.96 in 2007. In the attracting and retaining indicator Singapore achieves the highest mark of the sample in 2008 with a value of 8.33. Scores for the brain drain criterion are relatively high throughout. At the same time, Singapore’s ability to attract foreign highly skilled people receives extremely high marks, albeit with a lowest score of 7.95 in 2013 from a high of 8.74 in 2008. Within the readiness factor, Singapore scores are consistently high for the educational system, science in schools, university education and management education criteria. Moreover, in all the years under study 10
  • 13.
    IMD World TalentReport 2014 Singapore achieves the highest scores for science in schools. In the 2006-2008 period, Singapore dominates the educational system and university education indicators. 5.2.5 Switzerland In the years considered in this report, Switzerland ranks 1st except in the 2006 ranking for which it reaches the 2nd spot. Through the period, Switzerland excels in all factors particularly in the attraction/retention and readiness factors. It is worth mentioning that under the investment and development factor, in the female percentage of the labor force Switzerland experiences some fluctuation but sees an increase from 44.69% in 2005 to 46.16 in 2014. Similarly, in the prioritization of employee training for companies, the country scores higher than 7.35 throughout, reaching top marks in 2012 (7.86) and 2014 (7.94). Switzerland achieves the top spot in the quality of life for five of the years in the decade under study, in worker motivation (three years) and in attracting foreign highly skilled people (seven years). It also important to mention, its scores in the brain drain as hindrance for the competitiveness of the economy are consistently high (above 7.00 from 2007 to 2014) reaching its lowest in 2009 at 7.10. In other specific indicators, Switzerland dominates (in the majority of years analyzed) the rankings in the availability of finance skills, the significance of the international experience of senior managers, in the ability of university education to fulfil the demands of the labor market, and in the ability of the management education to meet the needs of the business community. In language skills it achieves top marks in 4 of the 10 years under consideration. Switzerland’s lowest scores show in the labor force growth and cost of living indicators. 6. Observations The data suggest that countries that achieve a positive balance between investing and developing local talent and the ability to attract and retain overseas talent perform consistently well in the period 2005-2014, for example Switzerland. The country’s results indicate that it is able to develop its home-grown talent while efficiently tapping into the overseas talent pipeline. In addition, the Malaysian example shows that a strategy aiming at improving both the home-grown and overseas talents has a positive impact on the country’s performance in the overall talent ranking. Countries that experience imbalances in that strategy tend to experience a drop in their overall rankings. The overall ranking pattern exhibited by Singapore seems to be the outcome of the investment and development factor results in combination with other indicators such as the cost of living. In other words, Singapore’s results show a fair degree of imbalance between the criteria covering the home-grown talent pipeline and the ability of the country to attract overseas talent. The county thus fluctuates in and out of the top 10 talent ranking during the period under study. The performances of Brazil and India show that imbalances across all talent competitiveness criteria are detrimental for the sustainability of an effective and dynamic talent pipeline. 11
  • 14.
    IMD World TalentReport 2014 12 IMD World Talent Ranking 2005-2014 Investment and development factorAppeal factorReadiness factorOverall Country Year200520062007200820092010201120122013Argentina47424148494445445348525355Australia99911111712202025161719Austria613464914133142411Belgium11141589116181013182017Brazil28313731344047454835415952Bulgaria405151455859596051596060Canada51010671075817798Chile22252727333126294456274644China Mainland48444050504643504545405043Colombia36303442555139565155455454Croatia515346535557575732575858Czech Republic24192428242625302846373837Denmark3323233221942Estonia27272925322830323715323930Finland2417134854471124France21202319212028262623312624Germany1718161612161110642113Greece31322836403644463339543142Hong Kong1381817182120131933251021Hungary16242026303338394926565251Iceland5412188211414India29282633313429344260292748Indonesia49505040413732423247261925Ireland14561013181681119486Israel8111215161415171521221318Italy41454344464252374338514447Japan32292530232931413518244528Jordan40393323445353365050443339Kazakhstan353237283830393232Korea35414439383533333943503740Latvia3114363023Lithuania323426253531229354229Luxembourg1916714171218151612102213Malaysia201714121561411911575Mexico44464952525450494057334850Netherlands7158757875161237New Zealand23221921202222252534232926Norway15131318101310671081610Peru45545756535558425757Philippines38474741424546352959342141Poland43484543373040383022532836Portugal34343032293927243420493533Qatar222723222453171822Romania45495255564141555841473638Russia42373953474855545642584053Singapore1074289179173119616Slovak Republic30363638364951515237484746Slovenia37353529285048434728554149South Africa46434849515254525454465556Spain33333837484736484640434945Sweden12125532233513129Switzerland1211111112111Taiwan18212120271919192327302527Thailand25263124252424272744204334Turkey39384635394342403649283435UAE342314526515Ukraine424743384947416385131United Kingdom26232222192321212129152320USA4611914151316122431512Venezuela50525454575658585936605659no. countries50525455575859596060Overall Ranking2014
  • 15.
    IMD World TalentReport 2014 Factor 1: Investment and Development 2014 13
  • 16.
    IMD World TalentReport 2014 Factor 2: Appeal 2014 14
  • 17.
    IMD World TalentReport 2014 Factor 3: Readiness 2014 15
  • 18.
    IMD World TalentReport 2014 2014 Criteria Factor 1: Investment and Development Total public expenditure on education (%) 2012 Total public expenditure on education per pupil 2011 Pupil-teacher ratio (primary education) 2011 Pupil-teacher ratio (secondary education) 2011 Apprenticeship (Survey 2014) Employee training (Survey 2014) Female labor force (%) 2013 Factor 2: Appeal Cost-of-living index 2013 Attracting and retaining talents (Survey 2014) Worker motivation (Survey 2014) Brain drain (Survey 2014) Quality of life (Survey 2014) Foreign high-skilled people (Survey 2014) Factor 3: Readiness Labor force growth 2013 Skilled labor (Survey 2014) Finance skills (Survey 2014) International experience (Survey 2014) Competent senior managers (Survey 2014) Educational system (Survey 2014) Science in schools (Survey 2014) University education (Survey 2014) Management education (Survey 2014) Language skills (Survey 2014) 16
  • 19.
    IMD World TalentReport 2014 1ICELAND8.02ISRAEL8.013DENMARK7.94SOUTH AFRICA7.35UKRAINE7.26SWEDEN6.87USA6.538FINLAND6.39BELGIUM6.310FRANCE6.111SWITZERLAND6.112UNITED KINGDOM6.113NETHERLANDS5.814MALAYSIA5.815SLOVENIA5.7116PORTUGAL5.717LITHUANIA5.618AUSTRIA5.619NEW ZEALAND5.520LATVIA5.521NORWAY5.522POLAND5.523LUXEMBOURG5.424AUSTRALIA5.325IRELAND5.226CROATIA5.027BRAZIL5.0228CZECH REPUBLIC4.829ESTONIA4.830HUNGARY4.831COLOMBIA4.632SPAIN4.533KOREA4.5234TAIWAN4.435KAZAKHSTAN4.336GERMANY4.337ITALY4.238GREECE4.139CHINA MAINLAND4.140CHILE4.141RUSSIA4.042THAILAND3.943SLOVAK REPUBLIC3.844VENEZUELA3.8345INDIA3.846JORDAN3.847HONG KONG3.848TURKEY3.7149JAPAN3.550BULGARIA3.551INDONESIA3.552MEXICO3.553PERU3.154QATAR3.155ROMANIA3.056SINGAPORE3.057PHILIPPINES2.758UAE1.1-ARGENTINA- -CANADA- Ranking2012% Percentage of GDPTOTAL PUBLIC EXPENDITURE ON EDUCATION (%) 1DENMARK3522UKRAINE333SWEDEN3014FINLAND3015BELGIUM2916AUSTRIA2917SLOVENIA2818UNITED KINGDOM2819PORTUGAL28110SWITZERLAND27111NORWAY26112ESTONIA26113FRANCE26114LATVIA25115ICELAND25116IRELAND25117ITALY24118NEW ZEALAND2419POLAND24120NETHERLANDS2421SPAIN24122HUNGARY24123BULGARIA24124CROATIA24125LITHUANIA23126MALAYSIA2327JAPAN2328KOREA222 29TAIWAN2230CZECH REPUBLIC22131VENEZUELA21232USA21133AUSTRALIA21134ARGENTINA2035ROMANIA20236SLOVAK REPUBLIC20137RUSSIA20338HONG KONG1939ISRAEL19140MEXICO18141THAILAND18242COLOMBIA1643QATAR16344CHILE1545KAZAKHSTAN1246INDIA1247INDONESIA1148PHILIPPINES10349PERU91-BRAZIL- -CANADA- -CHINA MAINLAND- -GERMANY- -GREECE- -JORDAN- -LUXEMBOURG- -SINGAPORE- -SOUTH AFRICA- -TURKEY- -UAE- Ranking2011% Percentage of GDP per capitaTOTAL PUBLIC EXPENDITURE ON EDUCATION PER PUPIL 17
  • 20.
    IMD World TalentReport 2014 1SWEDEN9.272LUXEMBOURG9.903ICELAND10.204NORWAY10.405HUNGARY10.546AUSTRIA10.897POLAND11.008PORTUGAL11.209QATAR11.2810LATVIA11.41 11ITALY11.7012DENMARK11.8013SPAIN12.4014BELGIUM12.4015LITHUANIA12.4116MALAYSIA12.6017GREECE12.68118ESTONIA13.2019FINLAND13.6720CANADA13.8021CROATIA14.26122HONG KONG14.4023VENEZUELA14.51224TAIWAN14.8025SWITZERLAND14.90126SLOVAK REPUBLIC15.0827USA15.3028IRELAND15.5729AUSTRALIA15.6030NETHERLANDS15.8031UKRAINE15.8332ISRAEL15.9033INDONESIA15.9434THAILAND15.99335SLOVENIA16.0036ROMANIA16.11137GERMANY16.3037NEW ZEALAND16.3039ARGENTINA16.33340KAZAKHSTAN16.3641UAE17.0342BULGARIA17.49143FRANCE17.5244JORDAN17.6045CHINA MAINLAND17.7146JAPAN18.1047SINGAPORE18.6048CZECH REPUBLIC18.8249PERU19.5650KOREA19.6051UNITED KINGDOM19.9052RUSSIA20.0053TURKEY21.2854BRAZIL21.2955CHILE21.9756COLOMBIA27.5857MEXICO28.1158SOUTH AFRICA30.71259PHILIPPINES31.44260INDIA35.00Ranking2011ratioRatio of students to teaching staffPUPIL-TEACHER RATIO (PRIMARY EDUCATION) 1PORTUGAL7.702GREECE8.0043CROATIA8.1514LATVIA8.335VENEZUELA8.4126LITHUANIA8.567RUSSIA8.708KAZAKHSTAN8.879BELGIUM9.4010SWEDEN9.5111LUXEMBOURG9.6012AUSTRIA9.6813NORWAY9.8014HUNGARY10.0315QATAR10.1316JORDAN10.2017POLAND10.6018ARGENTINA10.90319SLOVENIA11.0020SPAIN11.0521ICELAND11.1022CZECH REPUBLIC11.4022SWITZERLAND11.40124DENMARK11.50125SLOVAK REPUBLIC11.6726ESTONIA11.9027UKRAINE11.99228AUSTRALIA12.0029BULGARIA12.08130ISRAEL12.2030ITALY12.2032UAE12.42133ROMANIA12.48134FRANCE12.6935FINLAND13.1035JAPAN13.1035MALAYSIA13.1038GERMANY14.0039IRELAND14.4040HONG KONG14.5041INDONESIA14.7742SINGAPORE14.8043NEW ZEALAND15.1044CHINA MAINLAND15.1545USA15.2046CANADA15.3047TAIWAN16.1048UNITED KINGDOM16.3049BRAZIL16.3550PERU16.5051NETHERLANDS16.7052KOREA17.2053MEXICO17.6854THAILAND19.9155TURKEY20.1756CHILE21.0657SOUTH AFRICA24.40158COLOMBIA25.5859INDIA30.0060PHILIPPINES34.812Ranking2011ratioRatio of students to teaching staffPUPIL-TEACHER RATIO (SECONDARY EDUCATION) 18
  • 21.
    IMD World TalentReport 2014 1GERMANY8.532SWITZERLAND8.523AUSTRIA7.634MALAYSIA7.125JAPAN6.916DENMARK6.267INDONESIA6.118LITHUANIA5.979UAE5.9610NETHERLANDS5.9311UKRAINE5.4712TURKEY5.4613LUXEMBOURG5.3614IRELAND5.3315SINGAPORE5.2516TAIWAN5.1717CANADA5.1518NORWAY5.1419KAZAKHSTAN5.1320COLOMBIA5.1221QATAR4.8722FINLAND4.7823HONG KONG4.7524JORDAN4.6725CHINA MAINLAND4.6426ICELAND4.6427THAILAND4.6328LATVIA4.6229PHILIPPINES4.5530PORTUGAL4.5231AUSTRALIA4.5232INDIA4.5133ESTONIA4.5034BRAZIL4.4635RUSSIA4.4336MEXICO4.3937POLAND4.3138ISRAEL4.3039CHILE4.2340KOREA4.1741SWEDEN4.0342USA3.9843UNITED KINGDOM3.9844VENEZUELA3.9545PERU3.8646BELGIUM3.8547HUNGARY3.7748FRANCE3.7449NEW ZEALAND3.6250GREECE3.5851ITALY3.5652ARGENTINA3.3753CROATIA3.2454SPAIN3.1155SLOVAK REPUBLIC3.0856CZECH REPUBLIC2.9157SLOVENIA2.6958SOUTH AFRICA2.4359BULGARIA1.9360ROMANIA1.49Ranking2014APPRENTICESHIPis not sufficiently implementedis sufficiently implementedApprenticeship1SWITZERLAND7.942GERMANY7.793JAPAN7.784MALAYSIA7.715AUSTRIA7.536DENMARK7.517ROMANIA7.438FINLAND7.029IRELAND6.9210UAE6.8511NORWAY6.8212SWEDEN6.7713NETHERLANDS6.7714ESTONIA6.6315LITHUANIA6.5916LUXEMBOURG6.4917SINGAPORE6.3018TAIWAN6.2119CHINA MAINLAND6.1020THAILAND6.1021BELGIUM6.0422KOREA6.0023COLOMBIA5.9724ICELAND5.9625KAZAKHSTAN5.9026BRAZIL5.9027SLOVAK REPUBLIC5.8828CANADA5.8529ISRAEL5.8330UKRAINE5.8231PHILIPPINES5.7832USA5.7633QATAR5.7434TURKEY5.6935AUSTRALIA5.6536INDONESIA5.6437HONG KONG5.5838JORDAN5.3839LATVIA5.3740FRANCE5.3241MEXICO5.2842UNITED KINGDOM5.2343SOUTH AFRICA5.1944VENEZUELA5.1445CZECH REPUBLIC5.0946INDIA5.0847CHILE5.0548POLAND4.8849RUSSIA4.8750SLOVENIA4.8351NEW ZEALAND4.7552HUNGARY4.6453ITALY4.4254PERU4.3855ARGENTINA4.3656CROATIA4.2157PORTUGAL4.0958GREECE3.8959SPAIN3.8660BULGARIA3.64Ranking2014EMPLOYEE TRAININGis not a high priority in companiesis a high priority in companiesEmployee training 19
  • 22.
    IMD World TalentReport 2014 1LATVIA50.292LITHUANIA50.063KAZAKHSTAN49.134ESTONIA49.095HONG KONG48.366FINLAND48.347FRANCE47.848UKRAINE47.779ICELAND47.7310DENMARK47.7011CANADA47.6812PORTUGAL47.6013SWEDEN47.4814NEW ZEALAND47.1815NORWAY47.1216ISRAEL46.8317USA46.8018BULGARIA46.7119AUSTRIA46.44120RUSSIA46.2221NETHERLANDS46.2222UNITED KINGDOM46.2223CROATIA46.1924SWITZERLAND46.1625HUNGARY46.0226SPAIN45.9927GERMANY45.94128BELGIUM45.9029SLOVENIA45.8330AUSTRALIA45.7831THAILAND45.75132SOUTH AFRICA45.1633POLAND44.7534SINGAPORE44.6835SLOVAK REPUBLIC44.6836IRELAND44.6637ROMANIA44.2838PERU44.21139TAIWAN44.0640BRAZIL43.30141COLOMBIA42.9742GREECE42.6543JAPAN42.6344ITALY42.0745KOREA41.7546CHILE41.2047CZECH REPUBLIC40.3948VENEZUELA39.9149PHILIPPINES39.1550MEXICO38.3851LUXEMBOURG38.1652INDONESIA37.92153MALAYSIA37.0354TURKEY30.6855INDIA25.30156JORDAN17.5457QATAR12.7358UAE12.37-ARGENTINA- -CHINA MAINLAND- Ranking2013% Percentage of total labor forceFEMALE LABOR FORCE (%) 1SOUTH AFRICA62.652BULGARIA65.303INDIA67.944ROMANIA68.105QATAR68.906MEXICO70.157POLAND72.008SLOVENIA72.709LITHUANIA73.3010CROATIA74.60 11HUNGARY74.8012ESTONIA75.0013USA75.0814UNITED KINGDOM78.1015PERU78.5016MALAYSIA78.6017GERMANY78.6118PORTUGAL79.5019PHILIPPINES79.9019UKRAINE79.9021KAZAKHSTAN80.9022SLOVAK REPUBLIC81.2023GREECE81.9024JORDAN82.2025CANADA82.2226LATVIA82.3027TURKEY82.5027UAE82.5029SPAIN82.8030LUXEMBOURG83.8031CZECH REPUBLIC84.2032INDONESIA85.0033BELGIUM85.1034THAILAND85.8035NEW ZEALAND86.1036CHILE86.6037TAIWAN86.7038IRELAND86.9039COLOMBIA87.3040FRANCE87.5541ARGENTINA87.6042FINLAND88.0043NETHERLANDS88.40 44AUSTRIA90.1045CHINA MAINLAND91.9346ITALY92.6547SWEDEN93.0048BRAZIL95.3049ISRAEL97.6050AUSTRALIA102.5050VENEZUELA102.5052DENMARK103.3053KOREA108.0054NORWAY109.1055JAPAN110.7756RUSSIA113.6557SWITZERLAND115.9058HONG KONG121.8059SINGAPORE122.40-ICELAND- Ranking2013indexIndex of a basket of goods & services in major cities, including housing (New York City = 100) COST-OF-LIVING INDEX 20
  • 23.
    IMD World TalentReport 2014 1SWITZERLAND8.382ROMANIA8.223GERMANY8.003IRELAND8.005DENMARK7.876NORWAY7.787JAPAN7.678USA7.559BELGIUM7.5510UAE7.5311AUSTRIA7.48 12KOREA7.4813MALAYSIA7.4614SINGAPORE7.4415SWEDEN7.4016ISRAEL7.3517AUSTRALIA7.3118CANADA7.2819BRAZIL7.2520THAILAND7.2021NETHERLANDS7.1622HONG KONG7.1523ESTONIA7.1424FINLAND7.1425UKRAINE6.9826LITHUANIA6.9727ICELAND6.9628LUXEMBOURG6.9329INDIA6.8630UNITED KINGDOM6.7031CHINA MAINLAND6.6731TAIWAN6.6733TURKEY6.6334QATAR6.6235INDONESIA6.5135PHILIPPINES6.5137FRANCE6.4838NEW ZEALAND6.4539SOUTH AFRICA6.2140SLOVAK REPUBLIC6.1541VENEZUELA6.0942KAZAKHSTAN5.9243CHILE5.8744JORDAN5.8545LATVIA5.8446CZECH REPUBLIC5.8247MEXICO5.8248ITALY5.7949COLOMBIA5.6950ARGENTINA5.6351PERU5.4152PORTUGAL5.2453SPAIN5.1154GREECE5.0855HUNGARY4.9456RUSSIA4.8657BULGARIA4.7058CROATIA4.6259POLAND4.3860SLOVENIA4.22Ranking2014ATTRACTING AND RETAINING TALENTSis not a priority in companiesis a priority in companiesAttracting and retaining talents1SWITZERLAND7.942DENMARK7.873MALAYSIA7.684IRELAND7.665AUSTRIA7.596JAPAN7.567NORWAY7.568FINLAND7.499GERMANY7.4910SWEDEN7.2411TAIWAN6.8912CANADA6.7013LUXEMBOURG6.6714SINGAPORE6.6315HONG KONG6.6316ICELAND6.6317NETHERLANDS6.6218USA6.5619UAE6.5420ISRAEL6.4321INDONESIA6.4222LATVIA6.3323NEW ZEALAND6.3023PHILIPPINES6.3025UNITED KINGDOM6.3026AUSTRALIA6.2527THAILAND6.1728TURKEY6.1529BELGIUM5.9630MEXICO5.8231CHINA MAINLAND5.7832COLOMBIA5.6733LITHUANIA5.6034CHILE5.5235QATAR5.5036KAZAKHSTAN5.5037ESTONIA5.4838BRAZIL5.4339CZECH REPUBLIC5.4240PERU5.2941UKRAINE5.2642SLOVAK REPUBLIC5.2543JORDAN5.1144INDIA5.1145ITALY4.9246FRANCE4.7747SPAIN4.7748PORTUGAL4.6649KOREA4.5750ARGENTINA4.5651POLAND4.3552HUNGARY4.3453SLOVENIA4.2054RUSSIA4.1455GREECE3.8956SOUTH AFRICA3.7557ROMANIA3.7558CROATIA3.7259VENEZUELA3.6760BULGARIA3.57Ranking2014WORKER MOTIVATIONlowhighWorker motivation in companies is 21
  • 24.
    IMD World TalentReport 2014 1NORWAY8.092SWITZERLAND7.783FINLAND7.764USA7.285DENMARK7.286GERMANY6.877SWEDEN6.788UAE6.659NETHERLANDS6.5410MALAYSIA6.5111UKRAINE6.3412UNITED KINGDOM6.2713IRELAND5.9614HONG KONG5.9515CANADA5.8916LUXEMBOURG5.8117ISRAEL5.7418AUSTRALIA5.7319SINGAPORE5.7020BELGIUM5.6721CHILE5.5822INDIA5.5423TURKEY5.4124QATAR5.2925INDONESIA5.2626THAILAND5.2327FRANCE5.2028ICELAND5.1529AUSTRIA4.9830ARGENTINA4.9731CZECH REPUBLIC4.8532JAPAN4.7633BRAZIL4.6134JORDAN4.5835LATVIA4.5536PERU4.5337POLAND4.3938GREECE4.3439MEXICO4.2940COLOMBIA4.2441SPAIN4.1142KAZAKHSTAN4.0043ITALY3.9044PHILIPPINES3.8245CHINA MAINLAND3.7946KOREA3.7447NEW ZEALAND3.7048ESTONIA3.6849PORTUGAL3.4750TAIWAN3.4151SOUTH AFRICA3.3952SLOVENIA3.1753SLOVAK REPUBLIC3.0954LITHUANIA2.9855RUSSIA2.8256ROMANIA2.7657CROATIA2.2858VENEZUELA2.1959HUNGARY2.0860BULGARIA1.35Ranking2014BRAIN DRAINhinders competitiveness in your economydoes not hinder competitiveness in your economyBrain drain (well-educated and skilled people) 1SWITZERLAND9.732AUSTRIA9.553NORWAY9.474SWEDEN9.445GERMANY9.386NETHERLANDS9.217DENMARK9.138NEW ZEALAND9.139AUSTRALIA9.1110CANADA9.0411FINLAND9.0212IRELAND9.0012LUXEMBOURG9.0014ICELAND8.7915BELGIUM8.6316UAE8.5817FRANCE8.4818SINGAPORE8.3719USA8.3320JAPAN8.2221SPAIN7.9522UNITED KINGDOM7.7323ISRAEL7.6524CZECH REPUBLIC7.5625MALAYSIA7.4826QATAR7.4627HONG KONG7.0028TAIWAN6.6829CHILE6.4830ITALY6.4631PORTUGAL6.0932THAILAND5.9833INDONESIA5.8134LATVIA5.7735LITHUANIA5.6736SLOVENIA5.6437SLOVAK REPUBLIC5.4038ESTONIA5.3639SOUTH AFRICA5.2640GREECE5.2541KOREA5.2342TURKEY5.1543CROATIA5.1044MEXICO5.0345PHILIPPINES4.9546KAZAKHSTAN4.9447PERU4.9348ARGENTINA4.8449JORDAN4.7950CHINA MAINLAND4.6151INDIA4.4652BRAZIL4.4053RUSSIA4.3754HUNGARY4.0055COLOMBIA3.9756POLAND3.6957ROMANIA3.3758UKRAINE2.8059BULGARIA2.5760VENEZUELA1.32Ranking2014QUALITY OF LIFElowhighQuality of life is 22
  • 25.
    IMD World TalentReport 2014 1SWITZERLAND8.872USA8.503SINGAPORE8.174UAE8.045CANADA7.926IRELAND7.927LUXEMBOURG7.818UNITED KINGDOM7.789HONG KONG7.4710CHILE7.4311AUSTRALIA7.3312MALAYSIA7.2413QATAR7.2314NETHERLANDS6.9615GERMANY6.6516KAZAKHSTAN6.3417PERU6.2018CHINA MAINLAND6.0819THAILAND6.0020NORWAY5.9621AUSTRIA5.8522NEW ZEALAND5.8123INDONESIA5.6024COLOMBIA5.5225SWEDEN5.3026MEXICO5.2327DENMARK5.1828BRAZIL5.1729BELGIUM5.1530TURKEY5.1031PHILIPPINES4.8732JORDAN4.7733SPAIN4.6634RUSSIA4.6535FRANCE4.5636LITHUANIA4.4737LATVIA4.4338ISRAEL4.4339INDIA4.4140PORTUGAL4.4041ESTONIA4.3942SOUTH AFRICA4.3543KOREA4.3444CZECH REPUBLIC4.3045TAIWAN4.2746FINLAND4.2047UKRAINE4.1748JAPAN3.9349SLOVAK REPUBLIC3.5850HUNGARY3.5451POLAND3.2752ROMANIA3.1953ARGENTINA3.0053ICELAND3.0055ITALY2.9356GREECE2.6257SLOVENIA2.1858BULGARIA2.0759CROATIA1.7660VENEZUELA1.02Ranking2014FOREIGN HIGH-SKILLED PEOPLEare not attracted to your country's business environmentare attracted to your country's business environmentForeign high-skilled people1QATAR14.552UAE9.313VENEZUELA6.104MEXICO4.065PERU3.526TURKEY3.417ARGENTINA2.948SOUTH AFRICA2.889ICELAND2.7210SINGAPORE2.4411MALAYSIA2.3712ROMANIA1.9913ISRAEL1.9714HONG KONG1.9515CHILE1.7616LUXEMBOURG1.6917AUSTRALIA1.5018KOREA1.4619SWITZERLAND1.4120NEW ZEALAND1.3021AUSTRIA1.2022BELGIUM1.1023SWEDEN1.0924NORWAY1.0125UNITED KINGDOM0.9426CZECH REPUBLIC0.9327TAIWAN0.9228IRELAND0.9129PHILIPPINES0.8830COLOMBIA0.8731BULGARIA0.8132NETHERLANDS0.7733BRAZIL0.75134KAZAKHSTAN0.6635INDIA0.5136POLAND0.4237CHINA MAINLAND0.40138GERMANY0.37139HUNGARY0.3440JAPAN0.3441SLOVAK REPUBLIC0.2742USA0.2743INDONESIA0.1244JORDAN0.0745GREECE0.0046THAILAND-0.0247RUSSIA-0.0948DENMARK-0.1249UKRAINE-0.1450ITALY-0.4351ESTONIA-0.5052FRANCE-0.5153FINLAND-0.5654SLOVENIA-0.5955LITHUANIA-0.6056SPAIN-1.3357LATVIA-1.6058CROATIA-1.7059PORTUGAL-1.9260CANADA-2.44Ranking2013% Percentage changeLABOR FORCE GROWTH 23
  • 26.
    IMD World TalentReport 2014 1IRELAND8.092FINLAND7.763DENMARK7.574NETHERLANDS7.485PHILIPPINES7.376MALAYSIA6.957ICELAND6.898SWEDEN6.899UAE6.7310SWITZERLAND6.6811GREECE6.6812CANADA6.6713ISRAEL6.6514INDONESIA6.4415USA6.3816SPAIN6.3817RUSSIA6.3818NORWAY6.3619FRANCE6.2620AUSTRALIA6.2221UNITED KINGDOM6.0222TURKEY5.9623TAIWAN5.9524ROMANIA5.9425ITALY5.9026KAZAKHSTAN5.8827HONG KONG5.8128CZECH REPUBLIC5.7829JAPAN5.7830SLOVENIA5.7631INDIA5.7532KOREA5.7433PORTUGAL5.7034LATVIA5.5935JORDAN5.5536SINGAPORE5.4637GERMANY5.4538POLAND5.4239BELGIUM5.3740THAILAND5.3141SLOVAK REPUBLIC5.2842MEXICO5.1943AUSTRIA5.1544CROATIA5.1445CHINA MAINLAND5.0246COLOMBIA4.8047LUXEMBOURG4.7548HUNGARY4.7249NEW ZEALAND4.6850QATAR4.4451ARGENTINA4.3652LITHUANIA4.3353UKRAINE4.3154VENEZUELA4.0555CHILE4.0056PERU3.1957ESTONIA3.1658BRAZIL3.1659BULGARIA3.0960SOUTH AFRICA2.96Ranking2014SKILLED LABORis not readily availableis readily availableSkilled labor1SWITZERLAND8.332IRELAND8.293CANADA8.194DENMARK8.145FINLAND8.126SWEDEN8.037USA7.948HONG KONG7.929NETHERLANDS7.8810ISRAEL7.7411UNITED KINGDOM7.6612FRANCE7.6013NORWAY7.5114AUSTRALIA7.4615MALAYSIA7.4016ICELAND7.2917GERMANY7.2718SINGAPORE7.1719UAE7.0420INDIA7.0020TURKEY7.0022NEW ZEALAND6.9623LUXEMBOURG6.9124LATVIA6.8925AUSTRIA6.8526CHILE6.8427KAZAKHSTAN6.6928PHILIPPINES6.6929TAIWAN6.6130GREECE6.5731JAPAN6.5332BELGIUM6.5233POLAND6.5034INDONESIA6.4835RUSSIA6.3736THAILAND6.2437SPAIN6.2238KOREA6.1739JORDAN6.0340SLOVAK REPUBLIC5.9241ARGENTINA5.8942ITALY5.8443MEXICO5.7944QATAR5.7745ROMANIA5.7146SLOVENIA5.6047VENEZUELA5.4548CHINA MAINLAND5.4249HUNGARY5.4050PORTUGAL5.3851COLOMBIA5.3452CZECH REPUBLIC5.1953SOUTH AFRICA5.0554BRAZIL4.9355LITHUANIA4.9256ESTONIA4.8357CROATIA4.6658PERU4.3859UKRAINE4.2760BULGARIA3.56Ranking2014FINANCE SKILLSare not readily availableare readily availableFinance skills 24
  • 27.
    IMD World TalentReport 2014 1SWITZERLAND7.922NETHERLANDS7.453LUXEMBOURG7.264MALAYSIA7.235HONG KONG7.226IRELAND7.177UAE6.968GERMANY6.849SWEDEN6.7010SINGAPORE6.6911QATAR6.5912JORDAN6.2913INDONESIA6.2614FINLAND6.1215AUSTRIA5.9316ISRAEL5.9117UNITED KINGDOM5.8918BELGIUM5.8119CANADA5.7820POLAND5.7621SLOVAK REPUBLIC5.7422CHILE5.7123PHILIPPINES5.6424KAZAKHSTAN5.6325PERU5.6226DENMARK5.5027USA5.4928TURKEY5.3829LATVIA5.3630AUSTRALIA5.33 31THAILAND5.3132CZECH REPUBLIC5.3133INDIA5.2934HUNGARY5.2835UKRAINE5.2636LITHUANIA5.1837ARGENTINA5.1838GREECE5.1339TAIWAN5.1340MEXICO5.0641ROMANIA5.0042COLOMBIA4.9843VENEZUELA4.9344ICELAND4.8845ESTONIA4.8746NORWAY4.8647ITALY4.7848KOREA4.6949SOUTH AFRICA4.6750BRAZIL4.5551FRANCE4.4352NEW ZEALAND4.3453SPAIN4.2754PORTUGAL4.0355SLOVENIA3.9256BULGARIA3.6157CHINA MAINLAND3.5958RUSSIA3.5859JAPAN3.2460CROATIA2.86Ranking2014INTERNATIONAL EXPERIENCElowsignificantInternational experience of senior managers is generally1MALAYSIA7.442NETHERLANDS7.343IRELAND7.334DENMARK7.155USA6.926HONG KONG6.927CANADA6.898SWITZERLAND6.879FINLAND6.809SWEDEN6.8011NORWAY6.7612UNITED KINGDOM6.6913UAE6.5814PHILIPPINES6.4015INDONESIA6.3516AUSTRALIA6.2717SINGAPORE6.2318ICELAND6.2119ISRAEL6.1720JORDAN6.1021GERMANY6.0021TURKEY6.0023FRANCE5.9324KAZAKHSTAN5.8825BELGIUM5.8126AUSTRIA5.7027INDIA5.6328TAIWAN5.5529CHILE5.5230GREECE5.5131THAILAND5.5032LUXEMBOURG5.4133NEW ZEALAND5.3234QATAR5.2435CZECH REPUBLIC5.2036ROMANIA5.1737POLAND5.1538ITALY5.1539RUSSIA5.0740KOREA5.0641LATVIA5.0542SPAIN4.8943PORTUGAL4.8544CHINA MAINLAND4.8345ARGENTINA4.8246LITHUANIA4.7547MEXICO4.7448SLOVAK REPUBLIC4.5449SLOVENIA4.4450SOUTH AFRICA4.3951COLOMBIA4.3852VENEZUELA4.1453HUNGARY4.1254PERU3.8655ESTONIA3.7556JAPAN3.7457UKRAINE3.7158BRAZIL3.4559CROATIA2.8360BULGARIA2.73Ranking2014COMPETENT SENIOR MANAGERSare not readily availableare readily availableCompetent senior managers 25
  • 28.
    IMD World TalentReport 2014 1SWITZERLAND8.652FINLAND8.453SINGAPORE8.174CANADA7.855IRELAND7.626GERMANY7.597DENMARK7.448NETHERLANDS7.369NEW ZEALAND7.3210AUSTRALIA7.2311MALAYSIA6.8612ICELAND6.8313UAE6.8114BELGIUM6.7215NORWAY6.3616HONG KONG6.1917FRANCE6.1618QATAR5.9719AUSTRIA5.9620INDONESIA5.8921USA5.8922LUXEMBOURG5.8423UNITED KINGDOM5.8424ISRAEL5.8325TAIWAN5.8126ESTONIA5.7227JAPAN5.7228POLAND5.5729KOREA5.4830SWEDEN5.3631PHILIPPINES5.3132PORTUGAL5.1433JORDAN5.1034CZECH REPUBLIC5.0235INDIA4.8936KAZAKHSTAN4.8337LATVIA4.7538LITHUANIA4.6639SPAIN4.5740SLOVENIA4.4441ITALY4.3842RUSSIA4.2543HUNGARY4.19 44ROMANIA4.1645UKRAINE4.0946TURKEY3.9647GREECE3.9248CHINA MAINLAND3.6749THAILAND3.6250COLOMBIA3.4951CHILE3.3652SLOVAK REPUBLIC3.2853CROATIA3.2154MEXICO3.2155ARGENTINA2.7256PERU2.6857VENEZUELA2.0958BULGARIA1.9359BRAZIL1.8060SOUTH AFRICA1.71Ranking2014EDUCATIONAL SYSTEMdoes not meet the needs of a competitive economymeets the needs of a competitive economyThe educational system1SINGAPORE8.362SWITZERLAND7.583FINLAND7.334CANADA7.005MALAYSIA6.986UAE6.777HONG KONG6.538TAIWAN6.479DENMARK6.3010JAPAN6.2611FRANCE6.2612NETHERLANDS6.1213IRELAND6.0914INDIA5.9715INDONESIA5.9616QATAR5.9417POLAND5.7618GERMANY5.7519ESTONIA5.6820BELGIUM5.5221AUSTRALIA5.3522CHINA MAINLAND5.3323KAZAKHSTAN5.3324ISRAEL5.2825LUXEMBOURG5.2726ICELAND5.2527NEW ZEALAND5.2328USA5.1629RUSSIA5.1330JORDAN4.9931UNITED KINGDOM4.9132PHILIPPINES4.7033KOREA4.6734NORWAY4.6235PORTUGAL4.5236HUNGARY4.5037ROMANIA4.4838SLOVENIA4.4639CZECH REPUBLIC4.4240SWEDEN4.4041GREECE4.3442ITALY4.1243LATVIA4.1044THAILAND4.0545LITHUANIA4.0346SPAIN4.0047AUSTRIA3.9348UKRAINE3.8849SLOVAK REPUBLIC3.6650TURKEY3.4651CHILE3.3952MEXICO3.3853COLOMBIA2.9754CROATIA2.8655BULGARIA2.5156PERU2.4957VENEZUELA2.4558ARGENTINA2.3659BRAZIL2.0660SOUTH AFRICA1.85Ranking2014SCIENCE IN SCHOOLSis not sufficiently emphasizedis sufficiently emphasizedScience in schools 26
  • 29.
    IMD World TalentReport 2014 1SWITZERLAND8.682CANADA8.193FINLAND8.164SINGAPORE8.105DENMARK7.736GERMANY7.727USA7.648IRELAND7.619ISRAEL7.5310NETHERLANDS7.4811BELGIUM7.2212UAE7.0013HONG KONG6.9914MALAYSIA6.9015AUSTRIA6.8516AUSTRALIA6.8417ICELAND6.6018NEW ZEALAND6.5719SWEDEN6.5420INDONESIA6.4221NORWAY6.4122UNITED KINGDOM6.2823QATAR6.2624FRANCE6.1025LUXEMBOURG6.0025PORTUGAL6.0027ESTONIA5.9628PHILIPPINES5.8529LATVIA5.7030POLAND5.5731TAIWAN5.4532CHILE5.1732INDIA5.1734LITHUANIA5.0835RUSSIA5.0436CZECH REPUBLIC4.9837JORDAN4.9637SOUTH AFRICA4.9639ITALY4.8740ROMANIA4.7641JAPAN4.7442UKRAINE4.7443HUNGARY4.7244KAZAKHSTAN4.6345VENEZUELA4.5946SPAIN4.5847MEXICO4.5548THAILAND4.5349ARGENTINA4.5150TURKEY4.5051GREECE4.4252COLOMBIA4.4153KOREA4.3454SLOVENIA4.3055CHINA MAINLAND4.2656SLOVAK REPUBLIC3.6257PERU3.5358BRAZIL3.2759CROATIA3.0260BULGARIA2.25Ranking2014UNIVERSITY EDUCATIONdoes not meet the needs of a competitive economymeets the needs of a competitive economyUniversity education1SWITZERLAND8.382USA7.933SINGAPORE7.864DENMARK7.805FINLAND7.566CANADA7.477GERMANY7.398NORWAY7.389NETHERLANDS7.3310MALAYSIA7.2811ICELAND7.2311IRELAND7.2313HONG KONG7.0114UAE6.9615ISRAEL6.8116SWEDEN6.7117AUSTRALIA6.6718PORTUGAL6.6519AUSTRIA6.4920UKRAINE6.4721NEW ZEALAND6.4222BELGIUM6.3823LATVIA6.3424TAIWAN6.2625PHILIPPINES6.2626INDONESIA6.2227INDIA6.1628UNITED KINGDOM6.1629ESTONIA6.1530FRANCE6.0031QATAR5.9732CZECH REPUBLIC5.8233POLAND5.7634SOUTH AFRICA5.5735TURKEY5.2736LUXEMBOURG5.1937GREECE5.1338HUNGARY5.1239SLOVENIA5.0540KAZAKHSTAN5.0141LITHUANIA4.9542THAILAND4.8943ITALY4.8844RUSSIA4.8745CHINA MAINLAND4.8246JORDAN4.8147KOREA4.8148ROMANIA4.7349JAPAN4.5950SLOVAK REPUBLIC4.5851CHILE4.4852MEXICO4.3953SPAIN4.2554COLOMBIA3.8055BRAZIL3.6656CROATIA3.5457VENEZUELA3.4558ARGENTINA3.1659PERU3.0460BULGARIA2.36Ranking2014MANAGEMENT EDUCATIONdoes not meet the needs of the business communitymeets the needs of the business communityManagement education 27
  • 30.
    IMD World TalentReport 2014 1LUXEMBOURG8.632DENMARK8.603NETHERLANDS8.494SWITZERLAND8.425FINLAND8.206UAE8.207ICELAND8.178CANADA8.009SINGAPORE7.9310SWEDEN7.8911GREECE7.8912NORWAY7.7813LATVIA7.7114ISRAEL7.7015MALAYSIA7.5216BELGIUM7.3717PORTUGAL7.1718PHILIPPINES7.0519GERMANY6.9320SLOVENIA6.8621POLAND6.8222ROMANIA6.7323INDONESIA6.6524AUSTRIA6.6425LITHUANIA6.5626ESTONIA6.4927QATAR6.4628INDIA6.2529HONG KONG5.9530KOREA5.9431CROATIA5.6732SLOVAK REPUBLIC5.5133UKRAINE5.4334CZECH REPUBLIC5.3135TAIWAN5.2536AUSTRALIA5.2537KAZAKHSTAN5.1538JORDAN5.1439SOUTH AFRICA5.0940USA5.0541IRELAND5.0442NEW ZEALAND5.0042TURKEY5.0044CHINA MAINLAND4.9545ARGENTINA4.8246MEXICO4.4647BULGARIA4.4048FRANCE3.9449RUSSIA3.8950UNITED KINGDOM3.6651THAILAND3.6452ITALY3.5553PERU3.3354JAPAN3.1155HUNGARY3.0856SPAIN3.0557COLOMBIA3.0258VENEZUELA3.0059CHILE2.9560BRAZIL2.46Ranking2014LANGUAGE SKILLSare not meeting the needs of enterprisesare meeting the needs of enterprisesLanguage skills 28
  • 31.
    IMD World TalentReport 2014 Notes and Sources Collaboration with 55 Partner Institutes worldwide helps us gather complete, up-to-date and reliable statistics. The date shown in the criteria table is the reference year of the data. When statistical data is not available the name appears at the bottom of the statistical table and a dash is shown. When the data is one-year old, a “1” is shown next to the criterion value, a “2” represents data from two previous years, etc. Total public expenditure on education (%) Government Finance Statistics Yearbook 2013 Eurostat April 2014 National sources Jordan, Chile and Luxembourg: Budgetary central government. Total public expenditure on education per pupil Government Finance Statistics Yearbook 2013 National sources Croatia: Sum of expenditure from central government and local governments. Jordan, Chile and Luxembourg: Budgetary central government. Pupil-teacher ratio (primary education) UNESCO http://stats.uis.unesco.org OECD Education at a Glance 2013 National sources For public and private institutions, based on full-time equivalent. Primary education (ISCED level 1): level of which the main function is to provide the basic elements of education at such establishments as elementary schools, primary schools. The ratio of students to teaching staff is calculated as the total number of full-time equivalent students divided by the total number of full-time equivalent educational personal. Teaching staff refers to professional personnel directly involved in teaching students. The classification includes classroom teachers; special education teacher; and other teachers who work with students as a whole class in a classroom, in small groups in a resource room, or in one-to-one teaching inside a regular classroom. Teaching staff also includes chairpersons of departments whose duties include some amount of teaching, but it does not include non-professional personnel who support teachers in providing instructions to students, such as teacher’s aides and other paraprofessional personnel. Data are UNESCO or OECD estimates and from national statistics. Australia, Israel, Italy, Norway, and Russia: public institutions only. Hong Kong: figures refer to the position as at mid-September of the respective years (i.e. the beginning of an academic year spanning two calendar years). Teaching staff includes teachers as well as principles; figures cover local schools, special and international schools. Pupil-teacher ratio (secondary education) UNESCO http://stats.uis.unesco.org OECD Education at a Glance 2013 National sources For public and private institutions, based on full-time equivalent. Secondary education (ISCED levels 2 and 3): level providing general and/or specialized instruction at middle schools, secondary schools, high schools, teacher training schools and schools of a vocational or technical nature. The ratio of students to teaching staff is calculated as the total number of full-time equivalent students divided by the total number of full-time equivalent educational personal. Teaching staff refers to professional personnel directly involved in teaching students. The classification includes classroom teachers; special education teacher; and other teachers who work with students as a whole class in a classroom, in small groups in a resource room, or in one-to-one 29
  • 32.
    IMD World TalentReport 2014 teaching inside a regular classroom. Teaching staff also includes chairpersons of departments whose duties include some amount of teaching, but it does not include non-professional personnel who support teachers in providing instructions to students, such as teacher’s aides and other paraprofessional personnel. Data are UNESCO or OECD estimates and from national statistics. Australia, Canada, Ireland, Israel, Italy, Jordan, Norway and Russia: public institutions only. Australia: includes only programs in upper secondary education. Belgium: excludes independent private institutions. Hong Kong: figures refer to the position as at mid- September of the respective years (i.e. the beginning of an academic year spanning two calendar years). Teaching staff includes teachers as well as principles; figures cover local schools, special and international schools. Female labor force (%) OECD (2014), Main Economic Indicators - complete database National sources Estimate for 2013. Austria: break in series in 2008. Denmark: break in series in 2009. Indonesia: as of August for 2010. Malaysia: break in series in 2010. Portugal: methodological change in 2011. Romania: break in series in 2002, third quarter for 2013. Spain: break in series in 2005. Labor force growth OECD (2013), “Main Economic Indicators - complete database National sources Estimates for 2013. Austria: break in series in 2008. Denmark: break in series in 2009. Lithuania: break in series 2011 - census revised labor force figure downwards by 10% (emigration to EU over past decade). Latvia: break in series in 2012. Malaysia: break in series in 2010. Romania: break in series in 2002, third quarter for 2013. Portugal: methodological change in 2011. Spain: break in series in 2005. Lithuania: break in series 2011 - census revised labor force figure downwards by 10% (emigration to EU over past decade). Cost-of-living index MERCER Cost of Living survey, March 2013 www.mercer.com The Mercer survey covers 214 cities across five continents and measures the comparative cost of over 200 items in each location, including housing, transport, food, clothing, household goods and entertainment. It is the world’s most comprehensive cost of living survey and is used to help multinational companies and governments determine compensation allowance for their expatriate employees. New York is used as the base city (=100) for the index and all cities are compared against New York. Currency movements are measured against the US dollar. The cost of housing – often the biggest expense for expats - plays an important part in determining where cities are ranked. Mercer data is shown for cities (sometimes several data per country). Therefore, the WCC team made an average for each WCY country. Data is not always comparable over years (money fluctuations in 2010 and 2011). Executive Opinion Survey Every year, for our flagship publication, The IMD World Competitiveness Yearbook, we conduct an Executive Opinion Survey in order to complement the statistics that we use from international, national and regional sources. Whereas the Hard Data shows how competitiveness is measured over a specific period of time, the Survey Data measures competitiveness as it is perceived. The survey was designed to quantify issues that are not easily measured, for example: management practices, labor relations, corruption, environmental concerns or quality of life. The survey responses reflect present and future perceptions of competitiveness by business executives who are dealing with international business situations. Their responses are more recent and closer to reality since there is no time lag, which is often a problem with Hard Data that shows a “picture of the past”. The Executive Opinion Survey is sent to executives in top- and middle management in all of the economies covered by the WCY. In order to be statistically representative, we select a sample size which is proportional 30
  • 33.
    IMD World TalentReport 2014 to the GDP of each economy. The sample of respondents are representative of the entire economy, covering a cross-section of the business community in each economic sector: primary, manufacturing and services, based on their contribution to the GDP of the economy. The survey respondents are nationals or expatriates, located in local and foreign enterprises in the economy and which, in general, have an international dimension. They are asked to evaluate the present and expected competitiveness conditions of the economy in which they work and have resided during the past year, drawing from the wealth of their international experience, thereby ensuring that the evaluations portray an in-depth knowledge of their particular environment. We try to contact most IMD alumni and all responses returned to IMD are treated as confidential. The surveys are sent in January and are returned in April; in 2014, we received 4,300 responses from the 60 economies worldwide. The respondents assess the competitiveness issues by answering the questions on a scale of 1 to 6. The average value for each economy is then calculated and converted into a 0 to 10 scale. 31
  • 34.
    IMD World TalentReport 2014 Partner Institutes Argentina Economic Development and Institutions Research Program Faculty of Economic Science Catholic University of Argentina, Buenos Aires Dr. Carlos G. Garaventa, Dean Dr. Marcelo F. Resico, Senior Economist Dr. Ernesto A. O’Connor, Senior Economist Ms. Sofía Ahualli, Research Assistant www.uca.edu.ar/index.php/site/index/es/uca/facultad-ciencias-economicas/ Australia CEDA - Committee for Economic Development of Australia, Melbourne Professor the Hon. Stephen Martin, Chief Executive Officer Ms. Roxanne Punton, National Communications and Marketing Manager Ms. Sarah-Jane Derby, Senior Research Analyst www.ceda.com.au Austria Federation of Austrian Industries, Vienna Austrian Institute of Economic Research, Vienna Dr. Christian Helmenstein, Chief Economist Ms. Helena Zwickl Mr. Michael Oliver http://www.iv-net.at Belgium FEB - Federation of Enterprises in Belgium, Brussels Ms. Morgane Haid, Economist www.vbo-feb.be Brazil Fundação Dom Cabral, Minas Gerais, Innovation Center Professor Carlos Arruda, Associate Dean of Business Partnership and Professor of Innovation and Competitiveness at FDC Ms. Herica Righi, Assistant Professor at FDC Ms. Ludmila Pimenta, Economics Student and Intern at FDC Innovation Center www.fdc.org.br Bulgaria Center for the Study of Democracy, Sofia Mr. Ruslan Stefanov, Director, Economic Program Ms. Daniela Mineva, Research Fellow, Economic Program Mr. Martin Tsanov, Analyst, Economic Program www.csd.bg Canada Institute for Competitiveness & Prosperity, Toronto Mr. Jamison Steeve, Executive Director Ms. Dorinda So, Policy Analyst http://www.competeprosper.ca/ Intifin Group, Toronto Mr. Brett Berman, Managing Director www.intifin.com/ 32
  • 35.
    IMD World TalentReport 2014 Chile Universidad de Chile, School of Economics and Business Dr. Enrique Manzur, Vice Dean Dr. Sergio Olavarrieta, Graduate Dean Mr. Pedro Hidalgo, Department Head www.fen.uchile.cl China Hong Kong Hong Kong Trade Development Council Mr. Daniel Poon, Principal Economist Ms. Wenda Ma, Economist www.hktdc.com China Mainland China Institute for Development Planning, Tsinghua University Prof. Youqiang Wang, Executive Director Dr. Yongheng Yang, Associate Professor, Assistant Director Dr. Yizhi Xiong, Associate Professor Mr. Pu Gong, PhD Student Mr. Haoyuan Li, MPhil Student Ms. Liang Li, MPhil Student Colombia National Planning Department, Bogota Mrs. Tatyana Orozco de la Cruz, General Director Mr. Rodrigo Moreira, Enterprise Development Director Mr. John Rodríguez, Project Manager Mrs. Sara Patricia Rivera, Research Analyst www.dnp.gov.co Croatia National Competitiveness Council, Zagreb Ms. Jadranka Gable, Advisor Mr. Kresimir Jurlin, PhD, Researcher Czech Republic CERGE-EI, Prague Mr. Daniel Münich Dr. Vilem Semerak www.cerge-ei.cz Denmark Confederation of Danish Industry (DI) Mr. Allan Sorensen http://di.dk/English/Pages/English.aspx Estonia Estonian Institute of Economic Research, Tallinn Ms. Marje Josing Ms. Ingrid Niklus Mr. Koit Nilson, Researcher www.ki.ee Enterprise Estonia, Tallinn Mr. Ülari Alamets, Head of the Board 33
  • 36.
    IMD World TalentReport 2014 Finland ETLA, The Research Institute of the Finnish Economy, Helsinki Mr. Petri Rouvinen, Research Director Mr. Markku Kotilainen, Head of the Forecasting Group Mr. Vesa Vihriälä, Managing Director www.etla.fi France Invest in France Agency, Paris Ms. Sylvie Montout, Economist www.invest-in-france.org Germany Federation of German Industries (BDI), Berlin Ms. Soveigh Jaeger, Department of Economic and Industrial Policy www.bdi-online.de Greece Federation of Industries of Northern Greece, Thessaloniki Dr. Christos Georgiou, Director, Research and Documentation Department Mr. Constantinos Styliaras, MBA, Economist, Research and Documentation Department Foundation for Economic and Industrial Research (FEIR/IOBE), Athens Dr. Aggelos Tsakanikas, Research Director Hungary ICEG European Center, Budapest Ms. Renata Anna Jaksa, Director Mr. Oliver Kovacs, Research Fellow www.icegec.org Iceland Icelandic Chamber of Commerce, Reykjavik Mr. Leifur Porbergsson www.chamber.is India National Productivity Council, New Delhi Dr. K.P.Sunny, Group Head (Economic Services & Administration), Project Director Mr. Deepak Gupta, Assistant Director (Economic Services), Project Associate www.npcindia.gov.in Indonesia Center for Strategic and International Studies, Jakarta Dr. Yose Rizal Damuri, Head of Department of Economics Ms. Pratiwi Kartika Mr. Dandy Rafitrandi, Research Assistant www.csis.or.id Ireland IDA Ireland, Investment and Development Agency, Dublin www.idaireland.com Israel The Federation of Israeli Chambers of Commerce, Tel-Aviv Ms. Israela Many, Deputy Managing Director of Economy and Tax Mr. Aviad Toub, Economist www.chamber.org.il 34
  • 37.
    IMD World TalentReport 2014 Italy CONFINDUSTRIA, Economic Research Department, Rome Dr. Luca Paolazzi, Director Research Centre Dr. Pasquale Capretta, Senior Economist Japan Mitsubishi Research Institute, Inc., Tokyo Research Center for Policy and Economy Mr. Hirotsugu Sakai, Research Director www.mri.co.jp Jordan Ministry of Planning and International Cooperation Jordan National Competitiveness Team Dr. Mukhallad Al-Omari, Director of Policies and Strategies Department Kawthar Al-Zubi, Team Leader Basma Arabiyat, Researcher www.jnco.gov.jo Kazakhstan Economic Research Institute JSC of the Ministry of Economy and Budget Planning of the Republic of Kazakhstan, Astana Mr. Maksat Mukhanov, Chairman of the Board of the Economic Research Institute JSC Dr. Shakharbanu Zhakupova, Director of the Center for Strategic Development and Economic Research Ms. Sholpan Ibraimova, Head of the Department for Competitiveness Research Ms. Ardak Beisenova, Senior Expert of the Department for Competitiveness Research Ms. Rufinat Bissekenova, Senior Expert of the Department for Competitiveness Research www.economy.kz Korea Korea Institute for International Economic Policy (KIEP) Dr. Heungchong Kim, Director, Department of Planning and Research Coordination Ms. Nayoun Park, Researcher www.kiep.go.kr/eng/about/abo01.jsp Lithuania Enterprise Lithuania, Vilnius Mrs. Jurgita Butkeviciene, Export Department Manger Ms. Rasa Narusaityte, Senior Project Manager www.enterpriselithuania.com Luxembourg Chamber of Commerce of the Grand Duchy of Luxembourg Mr. Marc Wagener, Member of the Managing Board Ms. Annabelle Dullin, Economist www.cc.lu Malaysia Malaysia Productivity Corporation (MPC), Petaling Jaya Dato’ Mohd Razali Hussain, Director General Ms. Lee Saw Hoon, Senior Director www.mpc.gov.my 35
  • 38.
    IMD World TalentReport 2014 Mexico Strategic Studies Center for Competitiveness, Saltillo Ing. Carlos Maroto Cabrera, General Director Lic. Carlos Maroto Espinosa, Project & Relationship Manager Lic. Natalia Maroto Espinosa, Administration Manager www.competitividad.info Netherlands Confederation of Netherlands Industry and Employers (VNO-NCW), The Hague. Mr. Paul van Kempen, Advisor Economic policy www.vno-ncw.nl New Zealand New Zealand Institute of Management Inc, Wellington Mr. Garry Sturgess, Chief Executive Ms. Fiona Zhou, Administration & Registry Manager www.nzim.co.nz Norway Confederation of Norwegian Enterprise, Oslo Mr. Aslak Larsen Molvar, Senior Economist Mr. Morten Trasti, Advisor www.nho.no Peru CENTRUM Católica Graduate Business School, Lima Mr. Fernando D’Alessio, Director General Mr. Luis Del Carpio, Director Center of Competitiveness http://centrum.pucp.edu.pe Philippines Asian Institute of Management Policy Center, Makati City Ronald U. Mendoza, Executive Director Tristan A. Canare, Economist Mari Chrys R. Pablo, Economist Jean Rebecca D. Labios, Program Associate Charles Irvin S. Siriban, Research Associate http://policy.aim.edu/ Poland Warsaw School of Economics, Warsaw Dr. Bogdan A. Radomski, Associate Professor of Finance Dr. Marcin Nowakowski, Professor of International Business and Prorector Portugal FORMEDIA European Institute of Entrepreneurs and Managers, Lisbon Manuel Valle Manuel Costa Reis Duarte Harris Cruz www.formedia.pt 36
  • 39.
    IMD World TalentReport 2014 Qatar Ministry of Development Planning and Statistics, Department of Economic Development, Doha Dr. Frank Harrigan, Director, Department of Economic Development Dr. Issa Ibrahim, Economic Expert (Project Manager), Department of Economic Development Mr. Hassan Al-Sokary, Researcher, Ministry of Development Planning and Statistics / Statistics Sector Miss Shaikha Salem Al Hmoud, Statistical Researcher, Ministry of Development Planning / Statistics Sector Romania IRECSON – Romanian Institute for Economic-Social Research and Polls, Bucharest Prof. Dumitru Porojan PhD, President Mr. Bogdan Ciocanel, Executive Director www.irecson.ro Russia Moscow Business School Ms. Elina Pechonova http://mbschool.ru/ Singapore Economics Division, Ministry of Trade and Industry, Singapore Ms Yong Yik Wei, Director Mr Tan Kok Kong, Lead Economist Mr Kenny Goh, Senior Economist Mr Kuhan Harichandra, Senior Economist Dr Andy Feng, Senior Economist www.mti.gov. Singapore Business Federation Ms. Cheryl Kong, Assistant Executive Director www.sbf.org.sg/ Slovak Republic The F. A. Hayek Foundation, Bratislava Mr. Martin Kapko, Project Manager www.hayek.sk Slovenia Institute for Economic Research, Ljubljana Prof. Peter Stanovnik Ms. Sonja Uršic, M.A. www.ier.si University of Ljubljana, Faculty of Economics, Ljubljana Prof. Mateja Drnovšek Prof. Aleš Vahcic 37
  • 40.
    IMD World TalentReport 2014 South Africa Productivity SA, Midrand Mr. Bongani Coka, CEO Mr. Sello Mosai, Executive Manager, Knowledge Management, Value Chain Competitiveness Department Ms. Keneuoe Mosoang, Chief Economist, Value Chain Competitiveness Department www.productivitysa.co.za Spain Spanish Confederation of Employers, Madrid Ms. Edita Pereira, Head of Economic Research Unit Ms. Paloma Blanco, Economic Research Unit www.ceoe.es Taiwan National Development Council, Taipei Dr. Chen, Chien-Liang, Deputy Minister Mr. Chen, Pao-Jui, Director of Economic Development Department Ms. Lee, Cho-Jin, Senior Economist www.ndc.gov.tw Thailand Thailand Management Association, Bangkok Ms. Wanweera Rachdawong, Chief Executive Officer Ms. Pornkanok Wipusanawan, Director, TMA Center for Competitiveness www.tma.or.th Turkey Turkish Industrialists’ and Businessmen’s Association (TUSIAD), Istanbul Economic Research Department Mr. Cem Dogan, Economist www.tusiad.us Ukraine International Management Institute (MIM-Kyiv) Dr. Iryna Tykhomyrova, President Dr. Volodymyr Danko, Professor Ms. Oksana Kukuruza, External Relations Director www.mim.kiev.ua United Arab Emirates Emirates Competitiveness Council H.E Abdulla Nasser Lootah, Secretary General Venezuela National Council to Investment Promotion (CONAPRI) Mr. Eduardo Porcarelli, Executive Director Ms. Litsay Guerrero A, Economic Affairs & Investor Services Manager www.conapri.org 38
  • 41.
    IMD World Competitiveness Center PIONEERS IN COMPETITIVENESS SINCE 1989
  • 42.
    ARTURO BRIS Director IMD World Competitiveness Center Professor of Finance We are dedicated to the advancement of knowledge on world competitiveness by offering benchmarking services for countries and companies using the latest and most relevant data on the subject. “There is no single nation in the world that has succeeded in a sustainable way without preserving the prosperity of its people. Competitiveness refers to such objective: it determines how countries, regions and companies manage their competencies to achieve long-term growth, generate jobs and increase welfare. Competitiveness is therefore a way towards progress that does not result in winners and losers: when two countries compete, both are better off.”
  • 43.
    The IMD WorldCompetitiveness Center is dedicated to the advancement of knowledge on world competitiveness by gathering the latest and most relevant data on the subject and by analyzing the policy consequences. The Center conducts its mission in cooperation with a network of 55 partner institutes worldwide to provide the government, business and academic community with the following services: »» Competitiveness Assessment & Education »» Programs/Workshops/Conferences on Competitiveness »» Special country/regional competitiveness reports »» World Competitiveness Online In our efforts to match the dynamism of competitiveness, we are committed to further our cutting-edge research and to broadening our activities portfolio. IMD WORLD COMPETITIVENESS CENTER FOR OVER 25 YEARS IMD WORLD COMPETITIVENESS CENTER HAS PIONEERED RESEARCH ON HOW NATIONS AND ENTERPRISES COMPETE TO LAY THE FOUNDATIONS FOR FUTURE PROSPERITY. THE COMPETITIVENESS OF NATIONS IS PROBABLY ONE OF THE MOST SIGNIFICANT DEVELOPMENTS IN MODERN MANAGEMENT AND IMD INTENDS TO REMAIN A LEADER IN THIS FIELD.
  • 44.
    The yearbook benchmarksthe performance of 60 countries based on 338 criteria (2/3 statistical data and 1/3 survey data). It measures the different facets of competitiveness, grouped into four factors (economic performance, government efficiency, business efficiency and infrastructure). The main sections in the IMD World Competitiveness Yearbook: Rankings, Country Profiles and Statistical Tables. The IMD World Competitiveness Yearbook is considered an invaluable research tool for benchmarking competitiveness performance and is used by: Business: To determine investment plans and location assessment. Government: Leaders use our essential information to benchmark policies. Academics: Professors and students use our exceptional wealth of data to analyze the complex mechanism of world competitiveness. IMD WORLD COMPETITIVENESS YEARBOOK 2014 THE REFERENCE ON THE MARKET The IMD World Competitiveness Yearbook is the leading annual report on the competitiveness of nations and has been published by IMD since 1989.
  • 45.
    COUNTRY PROFILES Viewa country’s overall performance, learn about its evolution, its strengths and weaknesses and access all criteria used to assess its competitiveness. SELECT DATA Based on the World Competitiveness Yearbook’s methodology you can view any selection of countries, rankings and data, over 19-year time series for most criteria. Data can be viewed in tables or charts and downloaded in Excel and CSV. IMD WORLD COMPETITIVENESS ONLINE Online access to the latest competitiveness data – find, compare and customize! World Competitiveness Online (WCO) is an interactive and regularly updated website that provides access to the world’s largest competitiveness database, news, videos and our monthly newsletter. IMD WORLD COMPETITIVENESS PACKAGE Immediate access to the IMD World Competitiveness Online, the largest database on world competitiveness for customized research, regularly updated. The IMD World Competitiveness Yearbook + CD (available in June), the reference report on the competitiveness of nations since 1989. Key Figures »» 60 countries assessed »» 338 criteria measuring different facets of competitiveness »» 2/3 hard statistical data (international/ national sources) »» 1/3 survey data (Executive Opinion Survey) »» Earliest data on the market every year »» Online database (World Competitiveness Online) regularly updated
  • 46.
    CUSTOMIZED SOLUTIONS COMPANYCOMPETITIVENESS SOLUTIONS The IMD World Competitiveness Center supports businesses in their efforts to strengthen their competitiveness by providing them with analytical tools including company specific competitiveness analyses and by developing customized programs for enterprises. Competitiveness Programs: Our Competitiveness programs focus on assessing and enhancing your company’s competitiveness by focusing on the factors that drive market leadership. The programs facilitate the executives to understand their role in improving the competitiveness of the company by: »» Discussing the main trends that are shaping the world economy today. »» Thinking from the outside-in in terms of the implications for your company, customers and business partners. »» Identifying strategies to win the market and create value for your company and your customers. »» Highlighting the success factors found in the most competitive environments. »» Discussing best practices to enhance competitiveness. »» Examining results and priorities for your company. In our efforts to match the dynamism of competitiveness, we are committed to further our cutting-edge research and to broadening our activities portfolio.
  • 47.
    Special Competitiveness Reports Special reports are produced for governments that wish to assess their international competitiveness and benchmark their performance. These reports: »» Analyze competitiveness on the basis of over 300 criteria, using the Center methodology. »» Allow cross-country comparisons on a regional and global scale. »» Provide insights that can inform decision- making. »» Help to establish priorities and policies. »» Are used to promote investment in a country, state or region. Special reports are developed in cooperation with a local Partner Institute. COUNTRY AND REGIONAL COMPETITIVENESS ASSESSMENT Benchmark your economy against the World Competitiveness Yearbook countries! The IMD World Competitiveness Center supports governments highlight competitive advantages and uncover opportunities. In addition to its flagship publication, the IMD World Competitiveness Yearbook, the IMD World Competitiveness Center also aids governments to meet their needs through various customized solutions, including workshops and conferences. The report helps you to better assess the competitiveness of your country or region and to pursue insightful decision making. Special projects, reports and workshops have been completed for these governments: United Arab Emirates Oman Kuala Lumpur Kazakhstan Abu Dhabi (Emirate) Saudi Arabia Qatar Dubai (Emirate) Sabah (State of Malaysia) Selangor (State of Malaysia) Ile-de-France (Region in France) Klang Valley (Region in Malaysia) Galicia (Region in Spain) Terengganu (State of Malaysia) Mongolia
  • 48.
    FOLLOW US ON CONTACT US: IMD World Competitiveness Center Chemin de Bellerive 23, P.O. Box 915, CH-1001 Lausanne - Switzerland Central tel: +41 21 618 02 51 wccinfo@imd.org www.imd.org/wcc GET IN CONTACT WITH THE IMD WORLD COMPETITIVENESS CENTER: »» If you are a corporate executive interested in the market position of your company. With a long-term focus and want to understand the driving forces of competitiveness in the business world. »» If you are a government official or a member of an international agency and need access to the most comprehensive study of world competitiveness; if you need to assess the competitiveness of a particular country or region; if you want to learn from other countries´ success stories. »» If you are a researcher and want to access the largest database of competitiveness factors worldwide, spanning 60 economies in the last 25 years. THE IMD DIFFERENCE IMD is a top-ranked business school. We are the experts in developing global leaders through high‑impact executive education. Why IMD? »» We are 100% focused on real-world executive development »» We offer Swiss excellence with a global perspective »» We have a flexible, customized and effective approach www.imd.org Chemin de Bellerive 23 P.O. Box 915 CH-1001 Lausanne Switzerland Central tel: +41 21 618 01 11 Central fax: +41 21 618 07 07 info@imd.org IMD, IMD INTERNATIONAL and IMD INTERNATIONAL REAL WORLD. REAL LEARNING are trademarks of IMD – International Institute for Management Development. Photography: Régis Colombo, Nate Henderson, Richard Juilliart, Oliver O’Hanlon, Thierry Porchet, Yves Ryncki, Jean Scheim (Black and White) ©IMD 2014