Download as PDF, PPTX

![Openness is correlated with competitiveness. We argue it is a key driver.
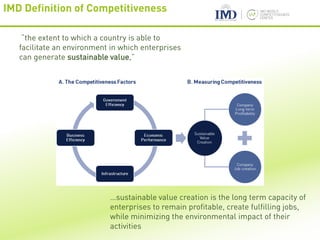
Competitiveness and Trade Openness
Most competitive – rolling averages – Least competitive
Trade as a % GDP Protectionism does not
impair business [Survey]](https://image.slidesharecdn.com/portobusinessschoolcompetitivenessdata2016-160608145913/85/Competitividade-2016-Desafios-para-Portugal-12-320.jpg)
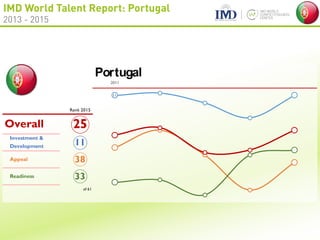
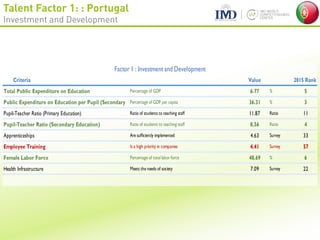
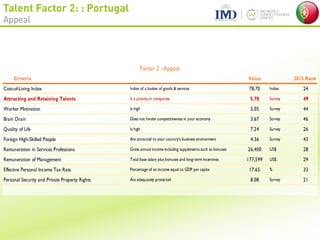
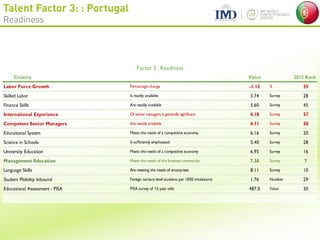


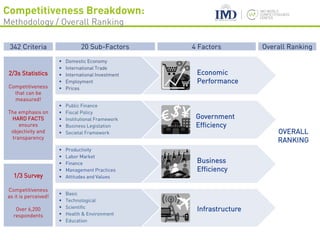
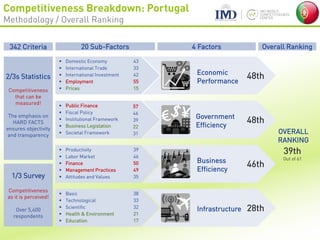
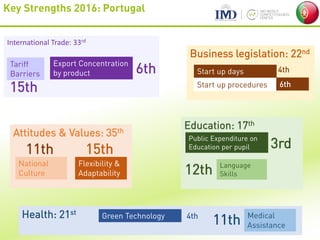
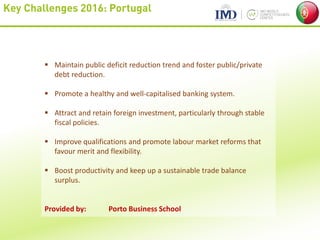
The IMD World Competitiveness Yearbook 2016 provides a comprehensive analysis of Portugal's competitiveness across multiple metrics, ranking the country 39th out of 61. Key strengths include high public expenditure on education and startup facilitation, while challenges involve reducing public debt and attracting foreign investment. The report emphasizes the importance of competitiveness in creating sustainable value through effective governance and economic policies.


![[Paper] Human resource development through vocational education for thailand 4.0](https://cdn.slidesharecdn.com/ss_thumbnails/humanresourcedevelopmentthroughvocationaleducationforthailand4-211221035015-thumbnail.jpg?width=640&height=640&fit=bounds)


