Download to read offline
![Improving Productivity through Greater Scale
Martin, L. H. Mayer and J. Bouma.Benefits and Costs of a Voluntary Wheat Board for the
Province of Alberta.A George Morris Centre and Toma and Bouma publication. 2002.
McKenzie, K.J. and J.M. Mintz.“Tax Effects on the Cost of Capital: A Canada-United States
Comparison” in Canada- US Tax Comparisons, J. Whalley and J. Shoveneds.NBER Research
Volume, University of Chicago.189-216. 1992.
McKenzie, K.J. and A. J. Thompson. “Taxes, the Cost of Capital and Investment: A Comparison
of Canada and the United States”. Technical Committee on Business Taxation.Working Paper
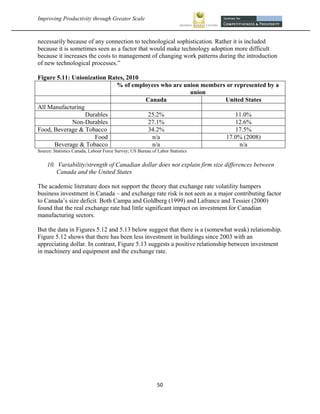
97-3, Department of Finance, Ottawa, Ontario. 1997.
Morrison Paul, C.J. “Cost Economies and Market Power: The Case of the U.S. Meat Packing
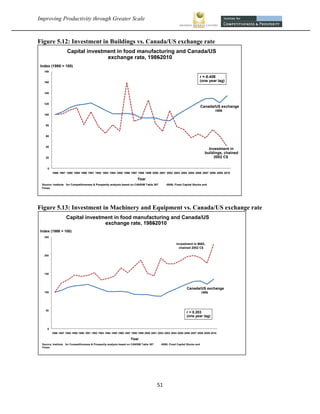
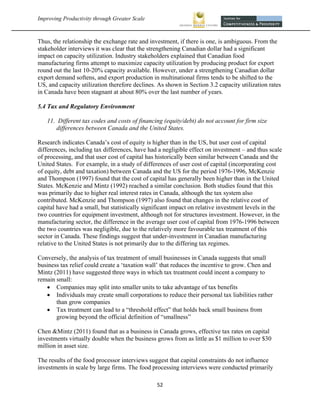
Industry”, The Review of Economics and Statistics 83 (3) 531-540. 2001.
Myers, J. Invest to Grow: Technology, Innovation and Canada’s Productivity Challenge. A
Canadian Manufacturers and Exporters Publication. 2010. http://www.cpia-aci.ca/government-
affairs/docs/invest2grow_e.pdf
OECD. “Defining and Measuring Productivity”. Retrieved on July 20, 2011 from
http://www.oecd.org/dataoecd/4/57/40526851.pdf
Rao, S. T. Tang and W. Wang. “What explains the Canada-US productivity gap?”Canadian
Public Policy.34(2).163-192. 2008.
Sabourin, D. Skill Shortages and Advanced Technology Adoption. Research Paper Series,
Analytical Studies Branch No. 11F0019MPE No. 175. Ottawa: Statistics Canada. 2001
Sosland, M. 1997. The State of the North American Cereal Processing Sector. Speech given at
the Moving Up Market Conference, Calgary, AB. November 4.
Tirole, J..The Theory of Industrial Organization. Cambridge, MA: The MIT Press. 1988.
United States Department of Commerce (International Trade Administration).Employment
Changes in US Food Manufacturing: The Impact of Sugar Prices. 2006.
http://trade.gov/media/Publications/pdf/sugar06.pdf
Western Canadian Wheat Growers’ Association. 2010. Submission to the Rail Freight Service
Review Panel. April 30, 2010.
Williamson, O.E. The Economic Institutions of Capitalism. New York: The Free Press. 1985.
Wijnands, J.H.M, B.M.J. van der Meulen, and K.J. Poppe [eds]. Competitiveness
of the European Food Industry:An economic and legal assessment-2007. Luxembourg: Office
for Official European Union Publications. 2007.
World Economic Forum. The Global Competitiveness Report 2008-2009. 2009.
62](https://image.slidesharecdn.com/productivity-1330222681165-phpapp01-120225202000-phpapp01/85/Productivity-62-320.jpg)

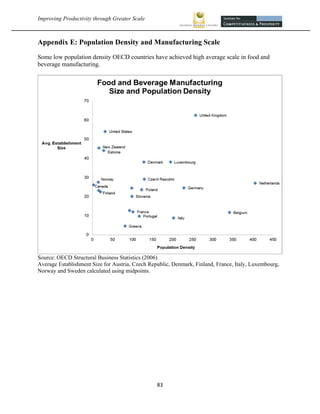

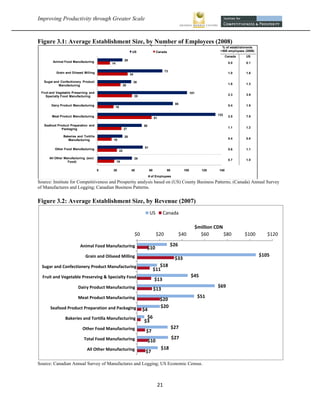
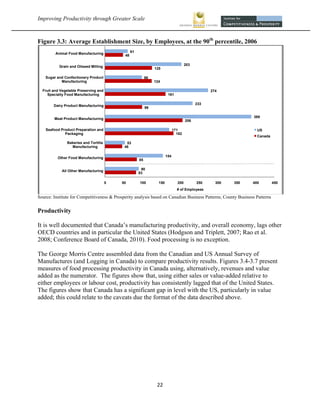
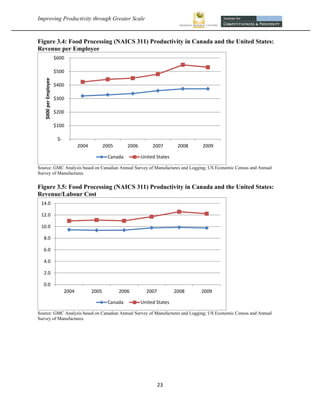
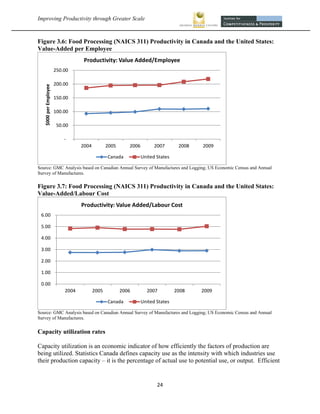
The document analyzes the relationship between scale and productivity in Canada's food processing sector. It finds that: - Canadian food processors are significantly smaller in scale than their US counterparts, with half the employees and sales. - Larger facilities are more productive, with value added per employee twice as high for large vs median facilities. Canada's smaller scale hurts overall productivity. - Investment in machinery and equipment per worker is lower in Canada. - Barriers like marketing regulations, border effects, and allocation of supply limit the scale of Canadian firms. Increasing scale through policy reforms could help narrow Canada's productivity gap with the US in the food processing industry.


