This document introduces image processing with MatLab. It discusses downloading image files, setting the directory in MatLab, and reading images using imread(). It then covers storing an image, creating the negative of an image, viewing RGB components, gamma scaling to adjust intensities, converting to grayscale, brightening images, and creating histograms to analyze pixel intensity distributions. Key steps include using imshow() to view images, imadjust() for gamma scaling, rgb2gray() for conversion, and imhist() to plot histograms.
This document contains the tutorial on the different digital image processing methods.
It gives the details on how images can be processed and how to make a GUI and work with it.
The students can learn about basics of image processing using matlab.
It explains the image operations with the help of examples and Matlab codes.
Students can fine sample images and .m code from the link given in slides.
The Image Panorama is a technique of stitching more images to create a more broader view which our normal eye does in a wider angle rather than that of the view which is restricted by the camera
Comparison of Histogram Equalization Techniques for Image Enhancement of Gray...IJMER
International Journal of Modern Engineering Research (IJMER) is Peer reviewed, online Journal. It serves as an international archival forum of scholarly research related to engineering and science education.
International Journal of Modern Engineering Research (IJMER) covers all the fields of engineering and science: Electrical Engineering, Mechanical Engineering, Civil Engineering, Chemical Engineering, Computer Engineering, Agricultural Engineering, Aerospace Engineering, Thermodynamics, Structural Engineering, Control Engineering, Robotics, Mechatronics, Fluid Mechanics, Nanotechnology, Simulators, Web-based Learning, Remote Laboratories, Engineering Design Methods, Education Research, Students' Satisfaction and Motivation, Global Projects, and Assessment…. And many more.
Can you please separate the code into imagespy sharpenpy.pdfagmbro1
Can you please separate the code into images.py, sharpen.py, & smokey.gif
Instructions 1 #Header file section for image module. The edge-detection function (detectEdges)
described in Chapter 7 and shown below returns a 2 from images import Image black and white
image. Think of a similar way to transform color values so that the new image is 3 #Function
defition of still in its original colors but the outlines within it are merely sharpened. edge_detection:
This function 4 #is used to identifying and def detectEdges(image, amount): marking the outline ""
"Builds and returns a new image in which the edges of 5 # of an image. the argument image are
highlighted and the colors are 6 def edge_detection(image, reduced to black and white."" " degree,
threshold): 7 #Function defition of def average(triple): average is used to (r,g,b)= triple 8 #calculate
the average of return(r+g+b)//3 given pixel blackPixel =(0,0,0) whitePixel =(255,255,255) new =
image.clone () for y in range(image.getHeight () - 1): for x in range( 1 , image.getWidth ()) :
oldPixel = image. getPixel(x,y) leftPixel = image.getPixel (x1,y) bottomPixel = image. getPixel(x,y+
1) oldLum = average ( oldPixel ) leftLum = average ( left tixel ) bottomLum = average (bottomPixel
) if abs(oldLum - leftLum) > amount or 1 abs(oldLum - bottomLum) > amount: new. setPixel ( x,y,
blackPixel) else:Instructions CENGAGE | MINDTAP Q Search this course Programming Exercise
7.10.
This slidecast takes an informal approach to image processing using Matlab environment.
Very little math is involved to keep things simple. But the full essence is only felt with the math involved.
Epistemic Interaction - tuning interfaces to provide information for AI supportAlan Dix
Paper presented at SYNERGY workshop at AVI 2024, Genoa, Italy. 3rd June 2024
https://alandix.com/academic/papers/synergy2024-epistemic/
As machine learning integrates deeper into human-computer interactions, the concept of epistemic interaction emerges, aiming to refine these interactions to enhance system adaptability. This approach encourages minor, intentional adjustments in user behaviour to enrich the data available for system learning. This paper introduces epistemic interaction within the context of human-system communication, illustrating how deliberate interaction design can improve system understanding and adaptation. Through concrete examples, we demonstrate the potential of epistemic interaction to significantly advance human-computer interaction by leveraging intuitive human communication strategies to inform system design and functionality, offering a novel pathway for enriching user-system engagements.
Builder.ai Founder Sachin Dev Duggal's Strategic Approach to Create an Innova...Ramesh Iyer
In today's fast-changing business world, Companies that adapt and embrace new ideas often need help to keep up with the competition. However, fostering a culture of innovation takes much work. It takes vision, leadership and willingness to take risks in the right proportion. Sachin Dev Duggal, co-founder of Builder.ai, has perfected the art of this balance, creating a company culture where creativity and growth are nurtured at each stage.
GDG Cloud Southlake #33: Boule & Rebala: Effective AppSec in SDLC using Deplo...James Anderson
Effective Application Security in Software Delivery lifecycle using Deployment Firewall and DBOM
The modern software delivery process (or the CI/CD process) includes many tools, distributed teams, open-source code, and cloud platforms. Constant focus on speed to release software to market, along with the traditional slow and manual security checks has caused gaps in continuous security as an important piece in the software supply chain. Today organizations feel more susceptible to external and internal cyber threats due to the vast attack surface in their applications supply chain and the lack of end-to-end governance and risk management.
The software team must secure its software delivery process to avoid vulnerability and security breaches. This needs to be achieved with existing tool chains and without extensive rework of the delivery processes. This talk will present strategies and techniques for providing visibility into the true risk of the existing vulnerabilities, preventing the introduction of security issues in the software, resolving vulnerabilities in production environments quickly, and capturing the deployment bill of materials (DBOM).
Speakers:
Bob Boule
Robert Boule is a technology enthusiast with PASSION for technology and making things work along with a knack for helping others understand how things work. He comes with around 20 years of solution engineering experience in application security, software continuous delivery, and SaaS platforms. He is known for his dynamic presentations in CI/CD and application security integrated in software delivery lifecycle.
Gopinath Rebala
Gopinath Rebala is the CTO of OpsMx, where he has overall responsibility for the machine learning and data processing architectures for Secure Software Delivery. Gopi also has a strong connection with our customers, leading design and architecture for strategic implementations. Gopi is a frequent speaker and well-known leader in continuous delivery and integrating security into software delivery.
Connector Corner: Automate dynamic content and events by pushing a buttonDianaGray10
Here is something new! In our next Connector Corner webinar, we will demonstrate how you can use a single workflow to:
Create a campaign using Mailchimp with merge tags/fields
Send an interactive Slack channel message (using buttons)
Have the message received by managers and peers along with a test email for review
But there’s more:
In a second workflow supporting the same use case, you’ll see:
Your campaign sent to target colleagues for approval
If the “Approve” button is clicked, a Jira/Zendesk ticket is created for the marketing design team
But—if the “Reject” button is pushed, colleagues will be alerted via Slack message
Join us to learn more about this new, human-in-the-loop capability, brought to you by Integration Service connectors.
And...
Speakers:
Akshay Agnihotri, Product Manager
Charlie Greenberg, Host
Essentials of Automations: Optimizing FME Workflows with ParametersSafe Software
Are you looking to streamline your workflows and boost your projects’ efficiency? Do you find yourself searching for ways to add flexibility and control over your FME workflows? If so, you’re in the right place.
Join us for an insightful dive into the world of FME parameters, a critical element in optimizing workflow efficiency. This webinar marks the beginning of our three-part “Essentials of Automation” series. This first webinar is designed to equip you with the knowledge and skills to utilize parameters effectively: enhancing the flexibility, maintainability, and user control of your FME projects.
Here’s what you’ll gain:
- Essentials of FME Parameters: Understand the pivotal role of parameters, including Reader/Writer, Transformer, User, and FME Flow categories. Discover how they are the key to unlocking automation and optimization within your workflows.
- Practical Applications in FME Form: Delve into key user parameter types including choice, connections, and file URLs. Allow users to control how a workflow runs, making your workflows more reusable. Learn to import values and deliver the best user experience for your workflows while enhancing accuracy.
- Optimization Strategies in FME Flow: Explore the creation and strategic deployment of parameters in FME Flow, including the use of deployment and geometry parameters, to maximize workflow efficiency.
- Pro Tips for Success: Gain insights on parameterizing connections and leveraging new features like Conditional Visibility for clarity and simplicity.
We’ll wrap up with a glimpse into future webinars, followed by a Q&A session to address your specific questions surrounding this topic.
Don’t miss this opportunity to elevate your FME expertise and drive your projects to new heights of efficiency.
Software Delivery At the Speed of AI: Inflectra Invests In AI-Powered QualityInflectra
In this insightful webinar, Inflectra explores how artificial intelligence (AI) is transforming software development and testing. Discover how AI-powered tools are revolutionizing every stage of the software development lifecycle (SDLC), from design and prototyping to testing, deployment, and monitoring.
Learn about:
• The Future of Testing: How AI is shifting testing towards verification, analysis, and higher-level skills, while reducing repetitive tasks.
• Test Automation: How AI-powered test case generation, optimization, and self-healing tests are making testing more efficient and effective.
• Visual Testing: Explore the emerging capabilities of AI in visual testing and how it's set to revolutionize UI verification.
• Inflectra's AI Solutions: See demonstrations of Inflectra's cutting-edge AI tools like the ChatGPT plugin and Azure Open AI platform, designed to streamline your testing process.
Whether you're a developer, tester, or QA professional, this webinar will give you valuable insights into how AI is shaping the future of software delivery.
GraphRAG is All You need? LLM & Knowledge GraphGuy Korland
Guy Korland, CEO and Co-founder of FalkorDB, will review two articles on the integration of language models with knowledge graphs.
1. Unifying Large Language Models and Knowledge Graphs: A Roadmap.
https://arxiv.org/abs/2306.08302
2. Microsoft Research's GraphRAG paper and a review paper on various uses of knowledge graphs:
https://www.microsoft.com/en-us/research/blog/graphrag-unlocking-llm-discovery-on-narrative-private-data/
UiPath Test Automation using UiPath Test Suite series, part 4DianaGray10
Welcome to UiPath Test Automation using UiPath Test Suite series part 4. In this session, we will cover Test Manager overview along with SAP heatmap.
The UiPath Test Manager overview with SAP heatmap webinar offers a concise yet comprehensive exploration of the role of a Test Manager within SAP environments, coupled with the utilization of heatmaps for effective testing strategies.
Participants will gain insights into the responsibilities, challenges, and best practices associated with test management in SAP projects. Additionally, the webinar delves into the significance of heatmaps as a visual aid for identifying testing priorities, areas of risk, and resource allocation within SAP landscapes. Through this session, attendees can expect to enhance their understanding of test management principles while learning practical approaches to optimize testing processes in SAP environments using heatmap visualization techniques
What will you get from this session?
1. Insights into SAP testing best practices
2. Heatmap utilization for testing
3. Optimization of testing processes
4. Demo
Topics covered:
Execution from the test manager
Orchestrator execution result
Defect reporting
SAP heatmap example with demo
Speaker:
Deepak Rai, Automation Practice Lead, Boundaryless Group and UiPath MVP
LF Energy Webinar: Electrical Grid Modelling and Simulation Through PowSyBl -...DanBrown980551
Do you want to learn how to model and simulate an electrical network from scratch in under an hour?
Then welcome to this PowSyBl workshop, hosted by Rte, the French Transmission System Operator (TSO)!
During the webinar, you will discover the PowSyBl ecosystem as well as handle and study an electrical network through an interactive Python notebook.
PowSyBl is an open source project hosted by LF Energy, which offers a comprehensive set of features for electrical grid modelling and simulation. Among other advanced features, PowSyBl provides:
- A fully editable and extendable library for grid component modelling;
- Visualization tools to display your network;
- Grid simulation tools, such as power flows, security analyses (with or without remedial actions) and sensitivity analyses;
The framework is mostly written in Java, with a Python binding so that Python developers can access PowSyBl functionalities as well.
What you will learn during the webinar:
- For beginners: discover PowSyBl's functionalities through a quick general presentation and the notebook, without needing any expert coding skills;
- For advanced developers: master the skills to efficiently apply PowSyBl functionalities to your real-world scenarios.
Transcript: Selling digital books in 2024: Insights from industry leaders - T...BookNet Canada
The publishing industry has been selling digital audiobooks and ebooks for over a decade and has found its groove. What’s changed? What has stayed the same? Where do we go from here? Join a group of leading sales peers from across the industry for a conversation about the lessons learned since the popularization of digital books, best practices, digital book supply chain management, and more.
Link to video recording: https://bnctechforum.ca/sessions/selling-digital-books-in-2024-insights-from-industry-leaders/
Presented by BookNet Canada on May 28, 2024, with support from the Department of Canadian Heritage.
GenAISummit 2024 May 28 Sri Ambati Keynote: AGI Belongs to The Community in O...
Image processing with matlab
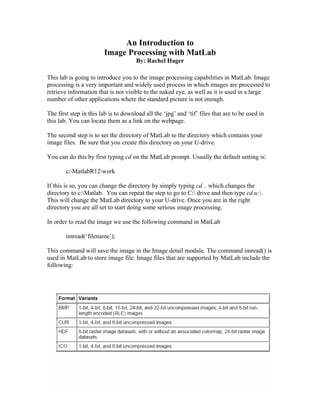
1. An Introduction to
Image Processing with MatLab
By: Rachel Hager
This lab is going to introduce you to the image processing capabilities in MatLab. Image
processing is a very important and widely used process in which images are processed to
retrieve information that is not visible to the naked eye, as well as it is used in a large
number of other applications where the standard picture is not enough.
The first step in this lab is to download all the ‘jpg’ and ‘tif’ files that are to be used in
this lab. You can locate them as a link on the webpage.
The second step is to set the directory of MatLab to the directory which contains your
image files. Be sure that you create this directory on your U-drive.
You can do this by first typing cd on the MatLab prompt. Usually the default setting is:
c:MatlabR12work
If this is so, you can change the directory by simply typing cd .. which changes the
directory to c:Matlab. You can repeat the step to go to C: drive and then type cd u:.
This will change the MatLab directory to your U-drive. Once you are in the right
directory you are all set to start doing some serious image processing.
In order to read the image we use the following command in MatLab
imread(‘filename’);
This command will save the image in the Image detail module. The command imread() is
used in MatLab to store image file. Image files that are supported by MatLab include the
following:
2. Since bitmap images are fairly large, they take a long time to convert into matrices.
Hence we stick to jpeg and tiff image formats in this lab.
This lab consists of 8 parts to help familiarize you with the basics of image processing:
1. Storing an Image
2. Creating the Negative of an Image
3. RGB Components of an Image
4. Gamma Scaling of an Image
5. Converting an Image to Grayscale
6. Creating a Histogram of an Image
7. Brightening an Image
8. Dithering an Image
1 Storing an Image
An image is stored in MatLab in the form of an image matrix. This matrix contains the
values of all the pixels in the image. In the case of a grayscale image, the image matrix is
a 2x2 matrix. In the case of a color image we have a 3x3 matrix.
Type the following command
Myimage = imread(‘filename’);
The filename should be complete. For example:
‘U:EE186LabsImageProcessingflowers.tiff’
3. If there were no errors, you stored the image correctly. If you see the error “Cannot find
file…” that means you either do not have the image saved in your directory, you have the
image name wrong, or you might be in the wrong directory.
After storing this image, you can view it using the command
imshow(Myimage);
The image will open in a new window.
2. Creating the Negative of an Image
In order to see the negative of the image, you will need to change the values in the image
matrix to double precision. This is done to invert the color matrix. The code below
negates the image:
negImage = double(Myimage); % Convert the image matrix to double
negImageScale = 1.0/max(negImage(:)); % Find the max value in this
% new array and take its
% inverse
negImage = 1 - negImage*negImageScale; % Multiply the double image
% matrix by the factor of
% negImageScale and subtract
% the total from 1
figure; % Draw the figure
imshow(negImage); % Show the new image
The above manipulations will result in a negative image that is exactly opposite in color
to the original image.
3. RGB Components of an Image
MatLab has the ability to find out exactly how much Red, Green, Blue content there is in
an image. You can find this out by selecting only one color at a time and viewing the
image in that color. The following code allows you to view the Red content of an image:
redimage = Myimage; % Create a new matrix equal to the matrix
% of your original image.
redimage (:, :, 2:3) = 0; % This selectively nullifies the second
% and third columns of the colormap
% matrix which are part of the original matrix. Since the colors
% are mapped using RGB, or columns with values of Red, Green and
% Blue, so we can selectively nullify the green and blue columns to
% obtain only the red part of the image.
imshow(redimage); % show the redimage that you just created.
Similarly, we can do the same with the green and blue components of the image. Just
keep in mind the format of the array
Red : Green : Blue
1 2 3
4. Try checking the blue component of the image. The only thing you will need to change is
the column numbers at the end of the statement.
blueimage = Myimage; % Create a new matrix equal to the matrix
% of your original image.
blueimage(:, :, 1:2) = 0; % Note the difference in column
% numbers.
imshow(blueimage); % Display the blueimage you just created.
Now try the green component yourself. There is a little trick to this.
After trying the green component of the image, try to see two components at a time. You
can do this by nullifying only one column at a time instead of two. (Hint: You only need
to put one number instead of 1:2 or 1:2:3 etc. Just write 1 or 2 or 3 to see the
combinations and note them.)
4. Gamma Scaling of an Image
Gamma scaling is an important concept in graphics and games. It relates to the pixel
intensities of the image. The format is simple:
J = imadjust(I, [low high], [bottom top], gamma);
This transforms the values in the intensity image I to values in J by mapping values
between low and high to values between bottom and top. Values below low and above
high are clipped. That is, values below low map to bottom, and those above high map to
top. You can use an empty matrix ([]) for [low high] or for [bottom top] to specify the
default of [0 1]. The variable gamma specifies the shape of the curve describing the
relationship between the values in I and J. If gamma is less than 1, the mapping is
weighted toward higher (brighter) output values. If gamma is greater than 1, the mapping
is weighted toward lower (darker) output values. If you omit the argument, gamma
defaults to 1 (linear mapping). Now try the following gamma variations and note down
the changes in intensities of the image.
NewImage = imadjust(Myimage, [.2, .7], []);
figure;
imshow(NewImage);
Note that the original image has gamma at default since there is no value of gamma
added. Now try this:
NewImage = imadjust(Myimage, [.2, .7], [], .2);
figure;
imshow(NewImage);
Note the difference? The gamma has been changed, so we see a change in the image
intensity. The intensity of each pixel in the image has increased. This clarifies the
5. explanation of gamma above. Now try a new value of gamma. This time use a value of 2
instead of .2.
Newimage = imadjust(x, [.2, .7], [], 2);
figure;
imshow(Newimage);
What happened? How did this change affect the gamma? Comment on your findings.
5. Converting an Image to Grayscale
MatLab allows us to change a color image into a grayscale image with ease. One way to
do this is to make all the values of the RGB components equal. MatLab provides a
function to do this.
Simply type the following:
grayimage = rgb2gray(Myimage);
figure;
imshow(grayimage);
The new image formed is in gray scale. The rgb2gray() function does exactly what it
says, changes the RGB image into gray; it basically forces all the RGB components to be
equal.
6. Brightening an Image
Another very useful and easy function that MatLab provides us is the function to brighten
an image. However, keep in mind that this function can be used only with the grayscale
images.
Simply type the following command after reading in the image, scaling it to gray, and
viewing it.
brighten(beta); % Set beta to any value between -1.0 and 1.0
We will see how to brighten a colored image in a later lab.
7. Creating a Histogram of an Image
An image histogram is a chart that shows the distribution of the different intensities in an
image. Each color level is represented, as a point on x-axis and on y-axis is the number of
instances of color level repetitions in the image. A histogram may be viewed with the
imhist() command. Sometimes all the important information in an image lies only in a
small region of colors, hence it is usually difficult to extract information from the image.
To balance the brightness level of an image, we carryout an image processing operation
termed histogram equalization.
6. In order to see the histogram of your favorite image use the following steps:
Myimage = imread('image'); % Read in your favorite image
figure; % Create figure to place image on
imshow(Myimage); % View the image
figure; % Create another figure for the histogram
imhist(Myimage); % Draw the histogram chart
[eqImage, T]=histeq(Myimage); % Equalize the image, that is
% equalize the intensity of the pixels
% of the image
figure; % Create another figure to place the image
imshow(eqImage); % Draw the equalized image
figure; % Create a figure for the histogram
imhist(eqImage); % Draw the equalized histogram
figure; % Create another figure to place a plot
plot((0:255)/255, T); % Plot the graph of the vector T
The vector T should contain integer counts for equally spaced bins with intensity values
in the appropriate range: [0, 1] for images of class double, [0, 255] for images of class
uint8, and [0, 65535] for images of class uint16.
8. Dither an Image
Dithering is a color reproduction technique in which dots or pixels are arranged in such a
way that allows us to perceive more colors than are actually used. This method of
"creating" a large color palette with a limited set of colors is often used in computer
images, television, and the printing industry. Images in MatLab can be dithered by using
the predefined functions. One easy way to do this is as follows:
figure('Name', 'Myimage - indexed, no dither');
[Myimagenodither, Myimagenodithermap]=rgb2ind(Myimage, 16, 'nodither');
imshow(Myimagenodither, Myimagenodithermap);
figure('Name', 'Myimage - indexed, dithered');
[Myimagedither, Myimagedithermap] = rgb2ind(Myimage, 16, 'dither');
imshow(Myimagedither, Myimagedithermap);
Type the above commands in the MatLab command prompt and check the images.
How do they differ? Do you feel one is better than the other? Which one seems a bit more
detailed? Comment on all your findings.
When finished, feel free to experiment, discover, learn and have fun….it is all about how
much you like to play and learning starts to happen as you have fun. Challenge yourself
and learn. Report and comment all of your finding.