Download as PDF, PPTX
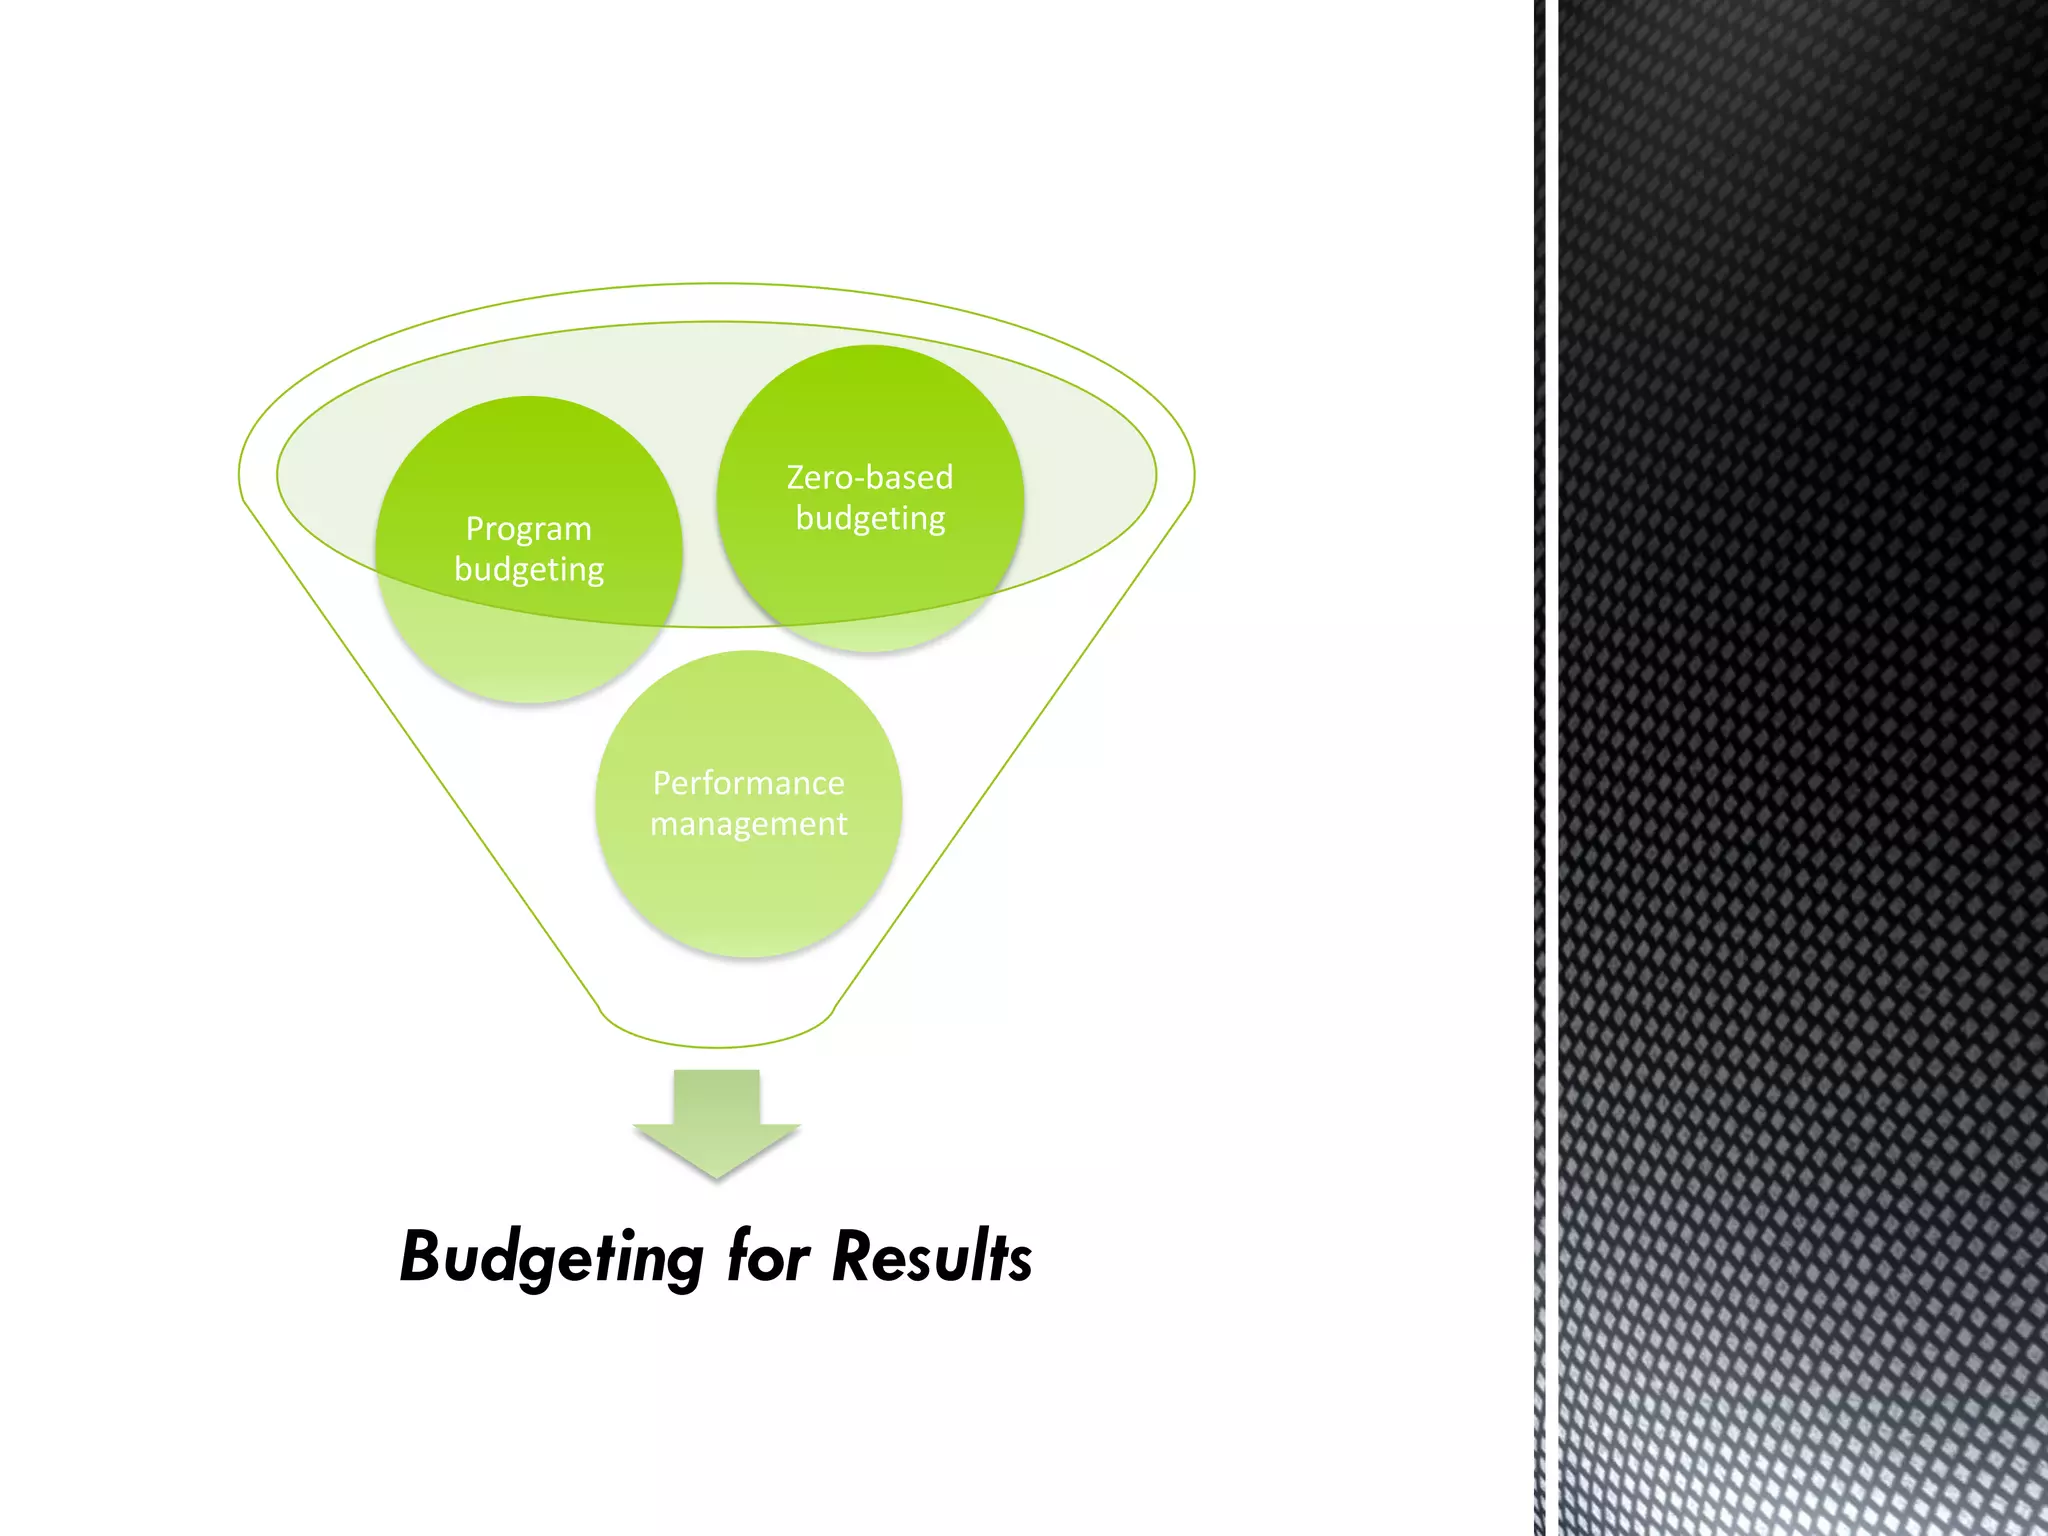
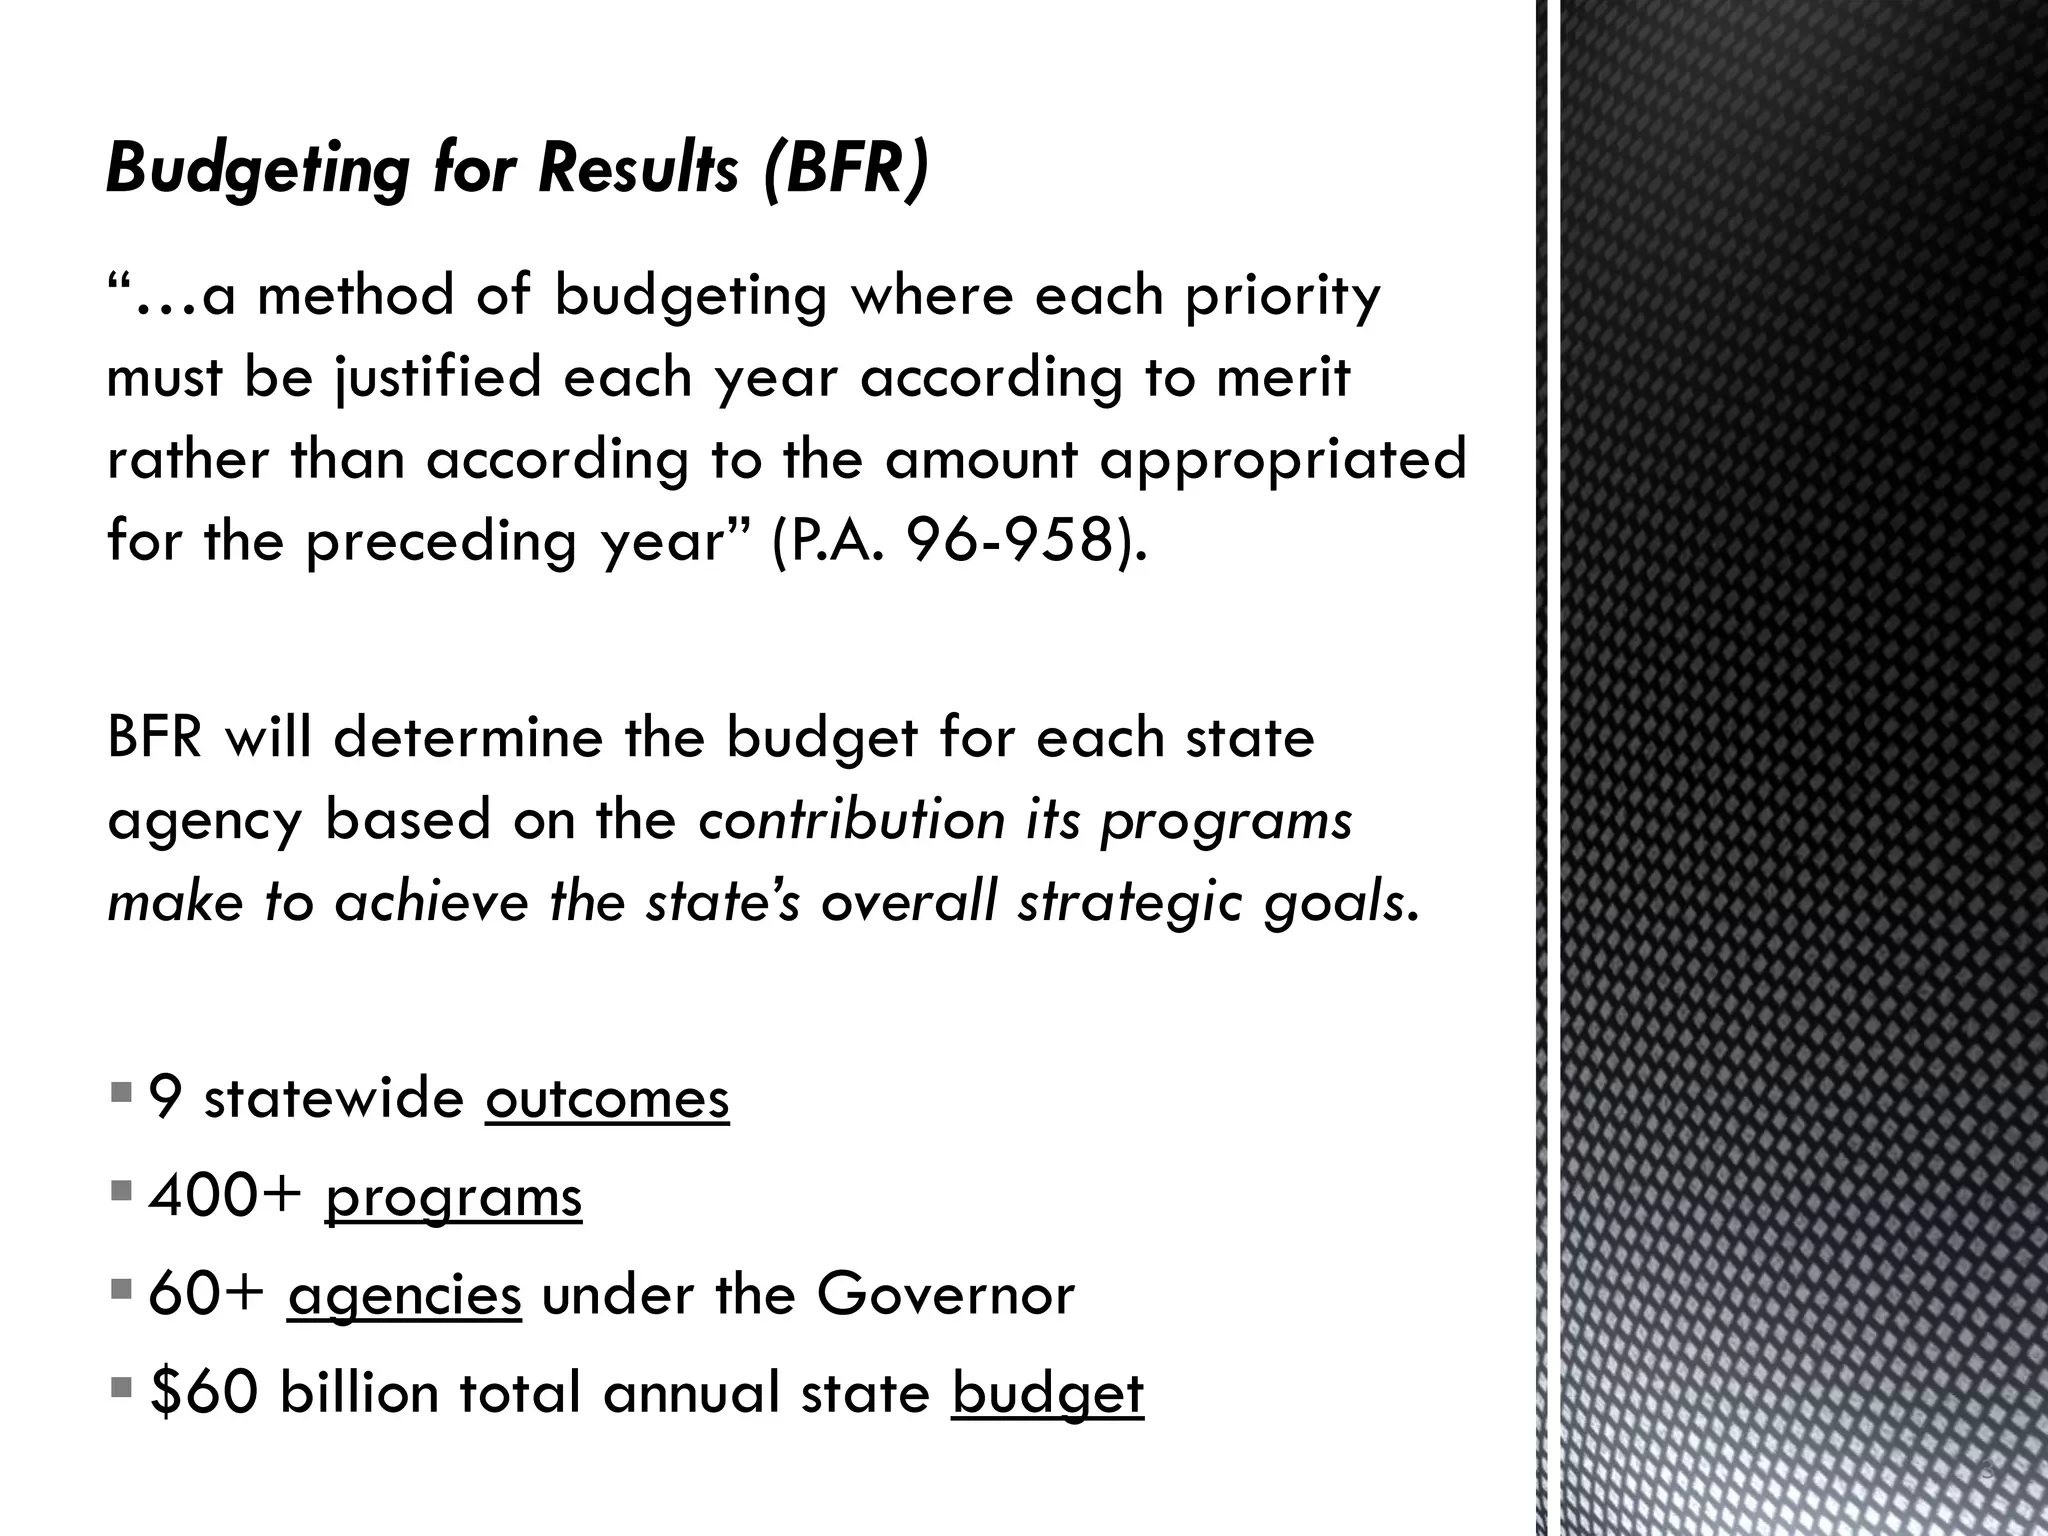
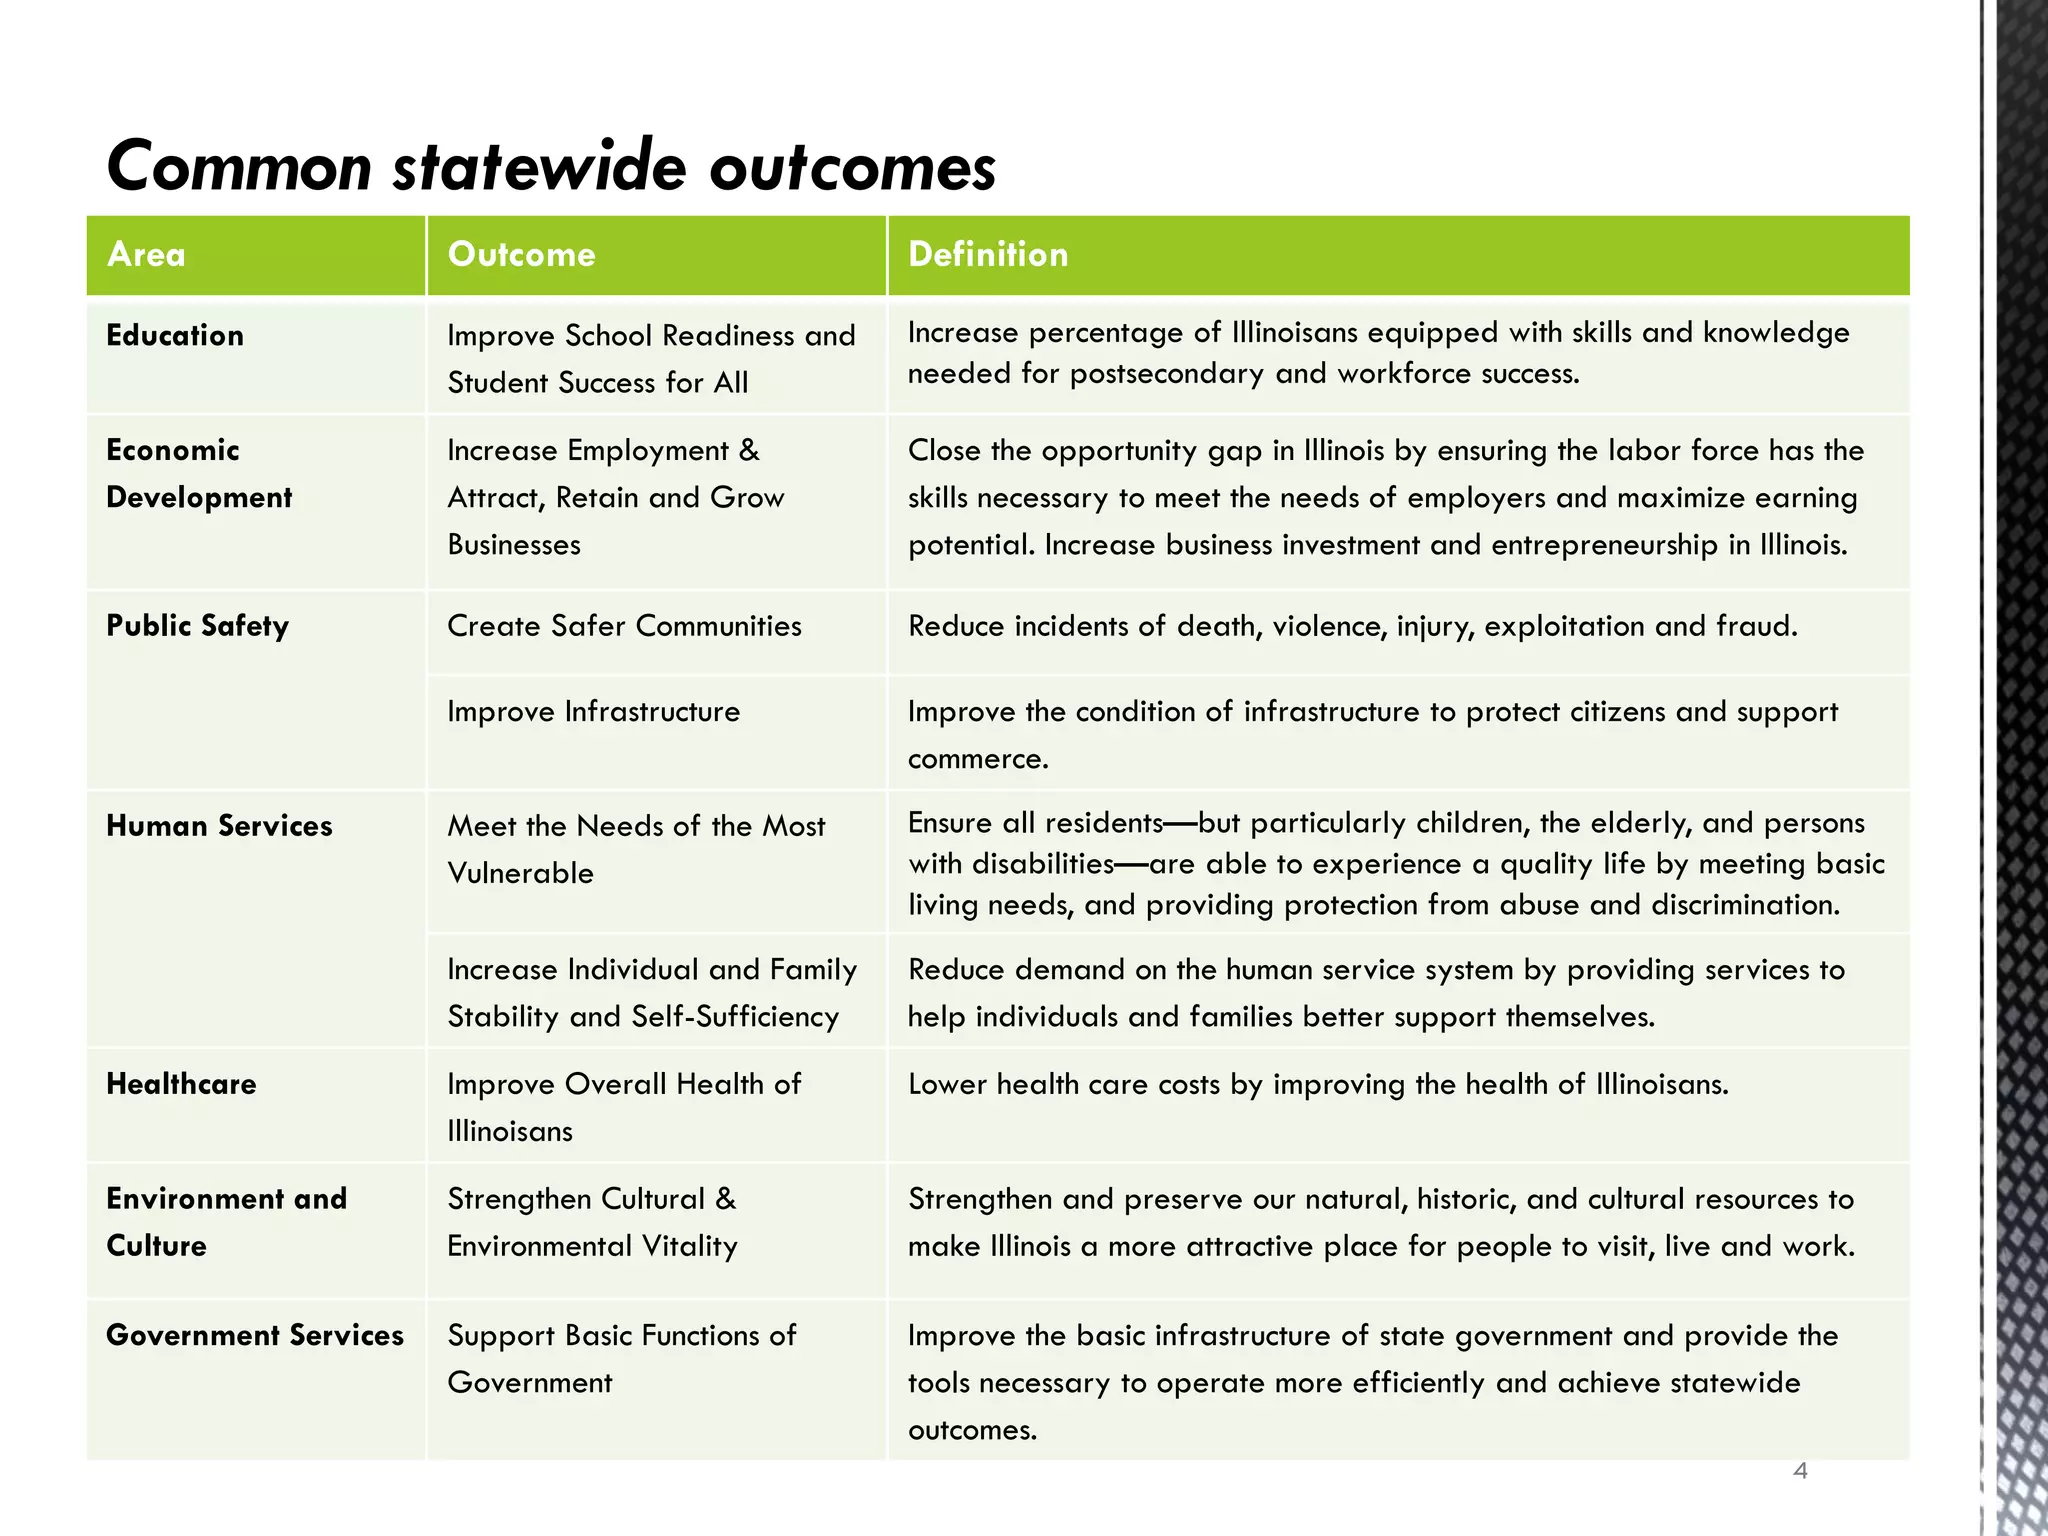


The document details the Budgeting for Results (BFR) initiative in Illinois, which emphasizes zero-based budgeting where each program must justify its funding annually based on its contribution to state goals. It outlines nine statewide outcomes covering education, economic development, public safety, human services, healthcare, environment, culture, and government services, along with various programs within these categories. The BFR program aims to improve state performance management by establishing indicators to measure progress and efficiency in achieving these outcomes.


