SlideShare a Scribd company logo
International Journal of Engineering and Technical Research (IJETR)
ISSN: 2321-0869, Volume-1, Issue-9, November 2013
90 www.erpublication.org

Abstract— A simple system dynamics model of a traditional
supply chain system is investigated. Particularly, the effect of
lead time, information quality and information sharing also
remanufacturing lead-time and the return rate on the inventory
variance and the generation of bullwhip effect were studied. Our
results clearly showed that the bullwhip in the closed loop
supply chain is bigger than one in traditional supply chain and
foreign to the collection rate and the inventory variance in every
stage decrease when the quality of information and the
information sharing is introduced into the traditional supply
chain. Furthermore, we found that the bullwhip effect in the
closed loop supply chain will increase when the short term lead
time of remanufacture cycle time increase.
Index Terms— BWE (Bullwhip Effect),Supply Chain.
I. INTRODUCTION
The operating phenomenon known as the ―Bullwhip Effect‖
(BWE) is affected by the flow of information upstream
through the supply chain. The Bullwhip Effect is the
amplification of the demand or order variance up the supply
chain, from customer to factory, as demand information
passes back through the supply chain. The phenomenon is
shown in Figure 1, which is generated by plotting 100 orders
placed by each node of a simulated supply chain. The
analogous amplification is due to effects of deteriorating
process quality and overtime as a result of a ―meltdown‖
incident The BWE has a number of consequences on the
operation of a supply chain. Because of the higher variance,
more safety stocks have to be carried with consequently more
investment, extra production capacity, and increased storage
space. Periods of intense resource utilization are followed by
periods of underutilization.
This oscillation shows that the supply chain harness enough
resources to meet the inflated peak periods.
Manuscript received November 20, 2013.
Sanjay Yadav, Student M.E. (I.M.) Department of Mechanical
Engineering, JIT Borawan, Khargone, M.P. India (e-mail:
sanjayyadav180380@gamil.com).
Abhishek Yadav,Assi. Pro. Department of Mechanical Engineering, JIT
Borawan, Khargone, M.P. India
Narendra Kushwaha, HOD, Department of Mechanical Engineering,
JIT Borawan, Khargone, M.P. India
Figure 1 Illustration of the Bullwhip Effect from Time
Series Data.
II. GOALS AND CONTRIBUTION TO THE
LITERATURE
The literature indicates that much of the BWE is due to
erratic human behavior, it indicated that the BWE is caused
by ―strategic interactions among rational supply-chain
members,‖ whereas others take a systems dynamics approach
relating a supply chain‘s structure, policies, and interactions
to demand variability implification. The current state of
investigation of the BWE involves restrictive assumptions
about many aspects of the supply chain. The constant
lead-time assumption is especially restrictive in light of the
variable lead times actually present in many supply chains.
Another characteristic of Bullwhip-related studies is the focus
on two-stage supply chains, with customer-retailer being the
first stage, and retailer-manufacturer the second. Other than
Forrester‘s simulation model and the Beer Game, Bullwhip
research has so far generally focused on these two-stage
scenarios. In our research, we create a serial supply chain
simulation model to determine order-up-to levels and order
quantities for each stage. we create a series of experiments
that employ factors related to lead-time variation, information
quality, and information sharing. Our purpose is to gain
insights to help reduce overall variability within a supply
chain. We model serial supply chains and wish to answer the
following questions:
1. What is the effect of lead times in supply chains?
2. What is the extent to which information sharing helps?
3. What impact does the quality of information on the BWE ?
III. LITERATURE REVIEW
Approaches to Analyzing the Bullwhip Effect
The Bullwhip Effect—Impact of Lead Time,
Information Quality, and Information Sharing
Sanjay Yadav, Abhishak Yadav, Narendra Kushwaha
The Bullwhip Effect—Impact of Lead Time, Information Quality, and Information Sharing
91 www.erpublication.org
The original characterization of the BWE is due to Forrester
(1958, 1961), who employed a continuous simulation system
called ‗DYNAMO’ to simulate a four-node
production-inventory-distribution system.
Forrester described the behavior of the system under
various internal conditions and its response to external
changes and shocks. His underlying theme was that the
structure, policies, and interactions within a supply chain
cause variability amplification. This approach is also
employed in the simulation-driven works of Towill (1991),
Wickner, Towill, and Naim (1991), and Towill, Naim, and
Wickner (1992) and, to a lesser extent, of Bhaskaran (1998).
Bhaskaran analyzed a manufacturing supply chain using
simulation and showed how the various components
interacted with each other, concluding that the lack of
coordination in supply chains led to inventory fluctuations
and to a high average inventory level. This involves
representing the relationships within a supply chain, such as
replenishment policies, as a set of transfer functions. These
transfer functions can then be used to relate the output of the
system (orders) to the input (demands) by utilizing the
z-transform of the output and input variables (Dejonckheere et
al. 2004).
IV. INVESTIGATION AND METHODOLOGY
Factors Investigated
Lead-Time Variation.
The first factor deals with the modeling of supply
chain lead times, which previous investigations of the BWE
have restricted to constant values. We investigate various
levels of leadtime variation, using the distribution to represent
stochastic lead times. We create four scenarios based on
different levels of the coefficient of variation for the
lead-time.
Information Quality Level.
The second factor is the ―quality‖ of information
available or chosen. This information is used directly in
lead-time demand forecasting and inventory parameter
updating. It may also affect the order streams, inventory
levels, stockouts, and other aspects of a supply chain. We
distinguish between four information quality levels (IQL) that
may be used for updating the order-up-to point: levels 0, 1, 2,
and 3.
Level 0. IQL0
Means no new information is used. This is the case
where there is no new information collected to aid in
updating, or possibly the case where the demand and
lead-time distributions are known and thus the ―best‖ order-
up-to value can be chosen in advance, with no need for any
updating.
Level 1. IQL1
Assumes that the histories of incoming demands and
of lead times are available. Information on lead-time variance
is not used in updating the inventory policy parameters, which
could be due to a mistaken assumption of constant lead times
or the belief that lead-time variation is not important.
Level 2. IQL2
Assumes that the histories of incoming demands and
of lead times are available, but in this case an estimate of
lead-time variance is generated and used for up-dating the
inventory policy parameters.
Level 3. IQL3
Assumes that the inventory manager tracks and
stores the final lead-time demand realizations for each order.
Forecasts should be more accurate and exhibit less
―nervousness‖ when employing IQL3, since the final
realizations of lead-time demand are used instead of the
intermediate surrogate data of lead time and demand.
Information Sharing.
The first two factors were lead-time variation and
information quality level. The third factor is information
sharing. With no information sharing, each node generates its
own forecast, based on local information, and the forecast is
then used to generate a new order-up-to value, and
consequently, the order size for the current period. The idea of
information sharing is that if the nodes were aware of the
current customer demands, they would make
forecasts with that information and fine-tune their inventory
system parameters accordingly. Since the customer‘s demand
order stream will have a variance less than or equal to the
variance of the orders coming from the downstream partner,
the assumption is that a node using customer information will
smooth the fluctuations in the order-up-to level and the
resulting order stream will have a lower variance.
V. SUPPLY CHAIN MODEL
We employ single-stage lead times with the entire delay
occurring during transportation. We assume that any
information delay, or the delay necessary for the order to ―get
into the right hands,‖ is zero. We also assume that the time to
fill an order once it is received (order processing delay) is also
zero. The mean lead times at the customer, retailer,
wholesaler, distributor, and factory are 0, 4, 4, 4, and 4 time
units, respectively, not including the review period, R=1. We
assume that these delays are gamma-distributed.
Lead-Time Demand
Let X be the demand during the protection period L+
R. Then X has mean µX that we estimate by X, and
variance that we estimate by . Hence, X for an order
placed at time t, is the convolution
(1)
VI. SCOPE OF INFORMATION
With no information sharing, supply chain nodes possess
only local information and are ―blind‖ to what is going on
outside their level. Each node‘s supply chain knowledge-base
is derived from the incoming demand flow coming from the
downstream partner and the outgoing flow of orders being
placed with the upstream partner. With information sharing,
each node in the supply chain receives information on
customer demand, in addition to orders from its downstream
supply chain partner. The nodes make no assumptions
International Journal of Engineering and Technical Research (IJETR)
ISSN: 2321-0869, Volume-1, Issue-9, November 2013
92 www.erpublication.org
regarding the demand or lead-time distribution, except that
the lead time is stationary. Each node makes all assessments
based only on the available data and attempts to adjust its
actions to adapt to the ―current‖ conditions. So, for example,
even though customer demand is iid, and thus the mean and
variance do not change over time, the retailer does not
―know‖ this and will update the inventory policy parameters
using forecasts based upon the most recent demand
information.
Inventory Policy.
The order-up-to point, S, is determined using typical
inventory management methods, which include the normal
approximation in setting the safety stocks. Thus, S is the base
stock that allows the system to meet the demand during the
time period L+R. We use a safety factor of z=2.0 (service
level of 97.72%) in calculating
S = X + zsX (2)
Forecasting and Estimation.
When updating, we use forecasts of the lead-time
demand mean (X) and its standard deviation (sx) to set an
order-up-to level that would yield a desired service level.
How we forecast X and sX depends on the information
available, i.e., which IQL is used.
VII. ANALYSIS
The Impact on the BWE of Not Updating Inventory
Parameters
We determine that with no updating, i.e., when we employ
IQL0, then no variance amplification occurs. Each of the
eight scenarios that utilize IQL0 show no BWE at all. But
since IQL0 has a known impact, we now exclude it from our
experimental analysis. Thus, for the remaining factors and
factor levels, we analyze 24 scenarios (3 information quality
levels x 4 lead time variance levels x 2 information sharing
levels) instead of the initial 32.
The Impact on the BWE of Information Sharing
Our results with regard to information sharing confirm
much of what has been found when analyzing simpler
systems. We will find information sharing does not eliminate
the BWE. We find information sharing to be the most
significant factor at all stages of the supply chain except the
retailer‘s. The exception of the retailer is expected, since the
advantage of information sharing is that all stages receive
customer demand information, which the retailer has whether
information is shared or not. When observing the
experimental means, we see that the use of information
sharing decreases the total variance amplification at the
wholesaler
The Impact on the BWE of Information Quality
We start by noting again that all scenarios utilizing IQL0 no
updating of order up to level showed no Bullwhip Effect
whatsoever, and were excluded from further analysis. We
analyze the remaining three information quality levels (IQL1,
IQL2, and IQL3). When observing total variance
amplification, we find information quality to be significant at
all of the supply chain. In general, we find IQL2 to be the
biggest aggravator of the Bullwhip Effect. We recognize that
IQL2, which uses demand rate (D) and lead time (L) data to
forecast the lead-time demand, will result in forecasts with
greater variability than IQL1 or IQL3. Forecast variability
leads to ―nervousness‖ of the order-up-to level, which results
in the BWE.
VIII. RESULT
Given our supply chain structure, regular updates of the
order-up-to level are a necessary condition for the Bullwhip
Effect (BWE). We see this by its absence with no updating.
We conclude that the initiation of the BWE is due the to
manager‘s attempts to adjust the inventory policy to
correspond to the latest data. These adjustments cause system
―nervousness,‖ which is a precursor to the BWE. We do not
believe adjustments to inventory policies are always
detrimental. It may have a positive influence on cost and
service aspects of the system, but they do lay the groundwork
for the variance amplification of demand.
Information sharing reduces total variance amplification and
stage variance amplification. We find that information
sharing decelerates the BWE as we go up the supply chain,
which could be the result of planning ahead, since the upper
supply chain would be responding to customer demand
information before the demands actually show up in the form
of an order from the downstream partner. Information sharing
protects a supply chain against failures. When observing
BWE differences between the models when not using
information sharing. We attribute this to the cascading effect
that failures (stockouts) at the upper may have on multiple
downstream nodes. When information is shared, the
cascading phenomenon disappears. information quality is an
important factor in BWE formation and we see that better
information quality reduces it. We believe that information
quality drives the BWE by affecting the stability and accuracy
of the lead-time demand forecasting process. Less stable or
accurate forecasting processes will result in less accurate and
more variable order-up-to levels, which result in greater order
variability. At the outset, we posed three research questions:
what is the effect of stochastic lead times in supply chains; to
what extent does information sharing help in attenuating the
Bullwhip Effect; and what is the effect of the quality of
information available. We hope that we have answered these
questions satisfactorily in this experiment.
REFERENCES
[1] G Bhaskaran, S. 1998. ―Simulation analysis of a manufacturing
supply chain‖. Decision Sciences 29(3) 633–657.
[2] Cachon, G. P., M. Fisher. 2000. ―Supply chain inventory
management and the value of shared information. Management
Science” 1032–1048.
[3] Chatfield, D. 2001. SISCO and SCML—Software tools for supply
chain simulation modeling and information sharing.
Unpublished Ph.D. dissertation, Department of Management
Science and Information Systems, Penn State University,
Pennsylvania.
[4] Croson, R., K. Donohue. 2003a. ‗Behavioral causes of the
Bullwhip Effect and the observed value of inventory
information‘. Working paper, Department of OPIM, The
Wharton School, University of Pennsylvania, Pennsylvania.
[5] Kim, J., D. Chatfield, T. Harrison, J. Hayya. 2004. ‗Quantifying the
Bullwhip Effect in a supply chain with stochastic lead time.‘
The Bullwhip Effect—Impact of Lead Time, Information Quality, and Information Sharing
93 www.erpublication.org
[6] Working Paper, ―Center of Supply Chain Research‖, Smeal
College of Business, Penn State University,Pennsylvania.
[7] Lee, H., P. Padmanabhan, S. Whang. 1997a. ―The Bullwhip Effect
in supply chains. Sloan Management” Review 38(3) 93–102.
[8] Lee, H., P. Padmanabhan, S. Whang. 1997b. ―Information
distortion in a supply chain: The Bullwhip Effect‖. Management
Science 43(4) 546–558.
[9] Warburton, R. D. H. 2004. ―An analytical investigation of the
Bullwhip Effect‖. Production and Operations Management (2)
150– 160.

More Related Content

Viewers also liked

Ijetr011847
Ijetr011847Ijetr011847
Ijetr011847
ER Publication.org
 
Ijetr012001
Ijetr012001Ijetr012001
Ijetr012001
ER Publication.org
 
Ijetr011834
Ijetr011834Ijetr011834
Ijetr011834
ER Publication.org
 
Ijetr011922
Ijetr011922Ijetr011922
Ijetr011922
ER Publication.org
 
Ijetr011821
Ijetr011821Ijetr011821
Ijetr011821
ER Publication.org
 
Ijetr011923
Ijetr011923Ijetr011923
Ijetr011923
ER Publication.org
 
Ijetr011816
Ijetr011816Ijetr011816
Ijetr011816
ER Publication.org
 
Ijetr011844
Ijetr011844Ijetr011844
Ijetr011844
ER Publication.org
 
Ijetr011932
Ijetr011932Ijetr011932
Ijetr011932
ER Publication.org
 
Ijetr011961
Ijetr011961Ijetr011961
Ijetr011961
ER Publication.org
 
Ijetr011742
Ijetr011742Ijetr011742
Ijetr011742
ER Publication.org
 
Ijetr011836
Ijetr011836 Ijetr011836
Ijetr011836
ER Publication.org
 
Ijetr011958
Ijetr011958Ijetr011958
Ijetr011958
ER Publication.org
 
Ijetr011917
Ijetr011917Ijetr011917
Ijetr011917
ER Publication.org
 
Ijetr011848
Ijetr011848Ijetr011848
Ijetr011848
ER Publication.org
 
Ijetr011933
Ijetr011933Ijetr011933
Ijetr011933
ER Publication.org
 
Ijetr011945
Ijetr011945Ijetr011945
Ijetr011945
ER Publication.org
 
Ijetr012005
Ijetr012005Ijetr012005
Ijetr012005
ER Publication.org
 
Ijetr011837
Ijetr011837Ijetr011837
Ijetr011837
ER Publication.org
 
Ijetr011950
Ijetr011950Ijetr011950
Ijetr011950
ER Publication.org
 

Viewers also liked (20)

Ijetr011847
Ijetr011847Ijetr011847
Ijetr011847
 
Ijetr012001
Ijetr012001Ijetr012001
Ijetr012001
 
Ijetr011834
Ijetr011834Ijetr011834
Ijetr011834
 
Ijetr011922
Ijetr011922Ijetr011922
Ijetr011922
 
Ijetr011821
Ijetr011821Ijetr011821
Ijetr011821
 
Ijetr011923
Ijetr011923Ijetr011923
Ijetr011923
 
Ijetr011816
Ijetr011816Ijetr011816
Ijetr011816
 
Ijetr011844
Ijetr011844Ijetr011844
Ijetr011844
 
Ijetr011932
Ijetr011932Ijetr011932
Ijetr011932
 
Ijetr011961
Ijetr011961Ijetr011961
Ijetr011961
 
Ijetr011742
Ijetr011742Ijetr011742
Ijetr011742
 
Ijetr011836
Ijetr011836 Ijetr011836
Ijetr011836
 
Ijetr011958
Ijetr011958Ijetr011958
Ijetr011958
 
Ijetr011917
Ijetr011917Ijetr011917
Ijetr011917
 
Ijetr011848
Ijetr011848Ijetr011848
Ijetr011848
 
Ijetr011933
Ijetr011933Ijetr011933
Ijetr011933
 
Ijetr011945
Ijetr011945Ijetr011945
Ijetr011945
 
Ijetr012005
Ijetr012005Ijetr012005
Ijetr012005
 
Ijetr011837
Ijetr011837Ijetr011837
Ijetr011837
 
Ijetr011950
Ijetr011950Ijetr011950
Ijetr011950
 

Similar to Ijetr011960

SUPPLY CHAIN MODELING WITH UNCERTAINTY IN DEMAND AND SUPPLY USING FUZZY LOGIC
SUPPLY CHAIN MODELING WITH UNCERTAINTY IN DEMAND AND SUPPLY USING FUZZY LOGICSUPPLY CHAIN MODELING WITH UNCERTAINTY IN DEMAND AND SUPPLY USING FUZZY LOGIC
SUPPLY CHAIN MODELING WITH UNCERTAINTY IN DEMAND AND SUPPLY USING FUZZY LOGIC
IAEME Publication
 
Information sharing in supply chains
Information sharing in supply chainsInformation sharing in supply chains
Information sharing in supply chains
Miguel Andres
 
ANew Framework for Secure M-Commerce
ANew Framework for Secure M-CommerceANew Framework for Secure M-Commerce
ANew Framework for Secure M-Commerce
IJERA Editor
 
A Literature Survey: Fuzzy Logic and Qualitative Performance Evaluation of Su...
A Literature Survey: Fuzzy Logic and Qualitative Performance Evaluation of Su...A Literature Survey: Fuzzy Logic and Qualitative Performance Evaluation of Su...
A Literature Survey: Fuzzy Logic and Qualitative Performance Evaluation of Su...
theijes
 
11.factors causing reversed bullwhip effect on the supply chains of kenyan firms
11.factors causing reversed bullwhip effect on the supply chains of kenyan firms11.factors causing reversed bullwhip effect on the supply chains of kenyan firms
11.factors causing reversed bullwhip effect on the supply chains of kenyan firms
Alexander Decker
 
study about the supply chain, flexibility and bullwhip effect on scm in small...
study about the supply chain, flexibility and bullwhip effect on scm in small...study about the supply chain, flexibility and bullwhip effect on scm in small...
study about the supply chain, flexibility and bullwhip effect on scm in small...
sushil Choudhary
 
Modeling Supply Chain
Modeling Supply ChainModeling Supply Chain
Modeling Supply Chain
Jimmy Gilberto Davila Velez
 
Introduction to Vendor Management Inventory
Introduction to Vendor Management Inventory Introduction to Vendor Management Inventory
Introduction to Vendor Management Inventory
Abu Talha
 
Supply Chain Resemblance.pptx
Supply Chain Resemblance.pptxSupply Chain Resemblance.pptx
Supply Chain Resemblance.pptx
RajJar12
 
What Drives Inventory Effectiveness in a Market-Driven World?
What Drives Inventory Effectiveness in a Market-Driven World?  What Drives Inventory Effectiveness in a Market-Driven World?
What Drives Inventory Effectiveness in a Market-Driven World?
Lora Cecere
 
Supply chain management
Supply chain managementSupply chain management
Supply chain managementsafiinam
 
supply chain design and analysis in pakistan 2023
supply chain design and analysis in pakistan 2023supply chain design and analysis in pakistan 2023
supply chain design and analysis in pakistan 2023
f2020331009
 
Module-1.pptx
Module-1.pptxModule-1.pptx
Module-1.pptx
SandipanMaji3
 
Powerpoint presentation
Powerpoint presentationPowerpoint presentation
Powerpoint presentationHilda Kaaria
 
Reading Assignment Report-IIPlease thoroughly go through the R.docx
Reading Assignment Report-IIPlease thoroughly go through the R.docxReading Assignment Report-IIPlease thoroughly go through the R.docx
Reading Assignment Report-IIPlease thoroughly go through the R.docx
catheryncouper
 
Supply chain management_1
Supply chain management_1Supply chain management_1
Supply chain management_1pixier
 
Information Flow Parametersfor Managing ^Organizational .docx
Information Flow Parametersfor Managing ^Organizational .docxInformation Flow Parametersfor Managing ^Organizational .docx
Information Flow Parametersfor Managing ^Organizational .docx
carliotwaycave
 
IJERD (www.ijerd.com) International Journal of Engineering Research and Devel...
IJERD (www.ijerd.com) International Journal of Engineering Research and Devel...IJERD (www.ijerd.com) International Journal of Engineering Research and Devel...
IJERD (www.ijerd.com) International Journal of Engineering Research and Devel...IJERD Editor
 

Similar to Ijetr011960 (20)

SUPPLY CHAIN MODELING WITH UNCERTAINTY IN DEMAND AND SUPPLY USING FUZZY LOGIC
SUPPLY CHAIN MODELING WITH UNCERTAINTY IN DEMAND AND SUPPLY USING FUZZY LOGICSUPPLY CHAIN MODELING WITH UNCERTAINTY IN DEMAND AND SUPPLY USING FUZZY LOGIC
SUPPLY CHAIN MODELING WITH UNCERTAINTY IN DEMAND AND SUPPLY USING FUZZY LOGIC
 
Information sharing in supply chains
Information sharing in supply chainsInformation sharing in supply chains
Information sharing in supply chains
 
ANew Framework for Secure M-Commerce
ANew Framework for Secure M-CommerceANew Framework for Secure M-Commerce
ANew Framework for Secure M-Commerce
 
A Literature Survey: Fuzzy Logic and Qualitative Performance Evaluation of Su...
A Literature Survey: Fuzzy Logic and Qualitative Performance Evaluation of Su...A Literature Survey: Fuzzy Logic and Qualitative Performance Evaluation of Su...
A Literature Survey: Fuzzy Logic and Qualitative Performance Evaluation of Su...
 
11.factors causing reversed bullwhip effect on the supply chains of kenyan firms
11.factors causing reversed bullwhip effect on the supply chains of kenyan firms11.factors causing reversed bullwhip effect on the supply chains of kenyan firms
11.factors causing reversed bullwhip effect on the supply chains of kenyan firms
 
study about the supply chain, flexibility and bullwhip effect on scm in small...
study about the supply chain, flexibility and bullwhip effect on scm in small...study about the supply chain, flexibility and bullwhip effect on scm in small...
study about the supply chain, flexibility and bullwhip effect on scm in small...
 
Modeling Supply Chain
Modeling Supply ChainModeling Supply Chain
Modeling Supply Chain
 
Introduction to Vendor Management Inventory
Introduction to Vendor Management Inventory Introduction to Vendor Management Inventory
Introduction to Vendor Management Inventory
 
Supply Chain Resemblance.pptx
Supply Chain Resemblance.pptxSupply Chain Resemblance.pptx
Supply Chain Resemblance.pptx
 
I0210048052
I0210048052I0210048052
I0210048052
 
Leadtime
LeadtimeLeadtime
Leadtime
 
What Drives Inventory Effectiveness in a Market-Driven World?
What Drives Inventory Effectiveness in a Market-Driven World?  What Drives Inventory Effectiveness in a Market-Driven World?
What Drives Inventory Effectiveness in a Market-Driven World?
 
Supply chain management
Supply chain managementSupply chain management
Supply chain management
 
supply chain design and analysis in pakistan 2023
supply chain design and analysis in pakistan 2023supply chain design and analysis in pakistan 2023
supply chain design and analysis in pakistan 2023
 
Module-1.pptx
Module-1.pptxModule-1.pptx
Module-1.pptx
 
Powerpoint presentation
Powerpoint presentationPowerpoint presentation
Powerpoint presentation
 
Reading Assignment Report-IIPlease thoroughly go through the R.docx
Reading Assignment Report-IIPlease thoroughly go through the R.docxReading Assignment Report-IIPlease thoroughly go through the R.docx
Reading Assignment Report-IIPlease thoroughly go through the R.docx
 
Supply chain management_1
Supply chain management_1Supply chain management_1
Supply chain management_1
 
Information Flow Parametersfor Managing ^Organizational .docx
Information Flow Parametersfor Managing ^Organizational .docxInformation Flow Parametersfor Managing ^Organizational .docx
Information Flow Parametersfor Managing ^Organizational .docx
 
IJERD (www.ijerd.com) International Journal of Engineering Research and Devel...
IJERD (www.ijerd.com) International Journal of Engineering Research and Devel...IJERD (www.ijerd.com) International Journal of Engineering Research and Devel...
IJERD (www.ijerd.com) International Journal of Engineering Research and Devel...
 

More from ER Publication.org

Ijetr011101
Ijetr011101Ijetr011101
Ijetr011101
ER Publication.org
 
Ijetr021232
Ijetr021232Ijetr021232
Ijetr021232
ER Publication.org
 
Ijetr021229
Ijetr021229Ijetr021229
Ijetr021229
ER Publication.org
 
Ijetr021228
Ijetr021228Ijetr021228
Ijetr021228
ER Publication.org
 
Ijetr021226
Ijetr021226Ijetr021226
Ijetr021226
ER Publication.org
 
Ijetr021224
Ijetr021224Ijetr021224
Ijetr021224
ER Publication.org
 
Ijetr021221
Ijetr021221Ijetr021221
Ijetr021221
ER Publication.org
 
Ijetr021220
Ijetr021220Ijetr021220
Ijetr021220
ER Publication.org
 
Ijetr021215
Ijetr021215Ijetr021215
Ijetr021215
ER Publication.org
 
Ijetr021211
Ijetr021211Ijetr021211
Ijetr021211
ER Publication.org
 
Ijetr021210
Ijetr021210Ijetr021210
Ijetr021210
ER Publication.org
 
Ijetr021207
Ijetr021207Ijetr021207
Ijetr021207
ER Publication.org
 
Ijetr021146
Ijetr021146Ijetr021146
Ijetr021146
ER Publication.org
 
Ijetr021145
Ijetr021145Ijetr021145
Ijetr021145
ER Publication.org
 
Ijetr021144
Ijetr021144Ijetr021144
Ijetr021144
ER Publication.org
 
Ijetr021143
Ijetr021143Ijetr021143
Ijetr021143
ER Publication.org
 
Ijetr021140
Ijetr021140Ijetr021140
Ijetr021140
ER Publication.org
 
Ijetr021139
Ijetr021139Ijetr021139
Ijetr021139
ER Publication.org
 
Ijetr021138
Ijetr021138Ijetr021138
Ijetr021138
ER Publication.org
 
Ijetr021135
Ijetr021135Ijetr021135
Ijetr021135
ER Publication.org
 

More from ER Publication.org (20)

Ijetr011101
Ijetr011101Ijetr011101
Ijetr011101
 
Ijetr021232
Ijetr021232Ijetr021232
Ijetr021232
 
Ijetr021229
Ijetr021229Ijetr021229
Ijetr021229
 
Ijetr021228
Ijetr021228Ijetr021228
Ijetr021228
 
Ijetr021226
Ijetr021226Ijetr021226
Ijetr021226
 
Ijetr021224
Ijetr021224Ijetr021224
Ijetr021224
 
Ijetr021221
Ijetr021221Ijetr021221
Ijetr021221
 
Ijetr021220
Ijetr021220Ijetr021220
Ijetr021220
 
Ijetr021215
Ijetr021215Ijetr021215
Ijetr021215
 
Ijetr021211
Ijetr021211Ijetr021211
Ijetr021211
 
Ijetr021210
Ijetr021210Ijetr021210
Ijetr021210
 
Ijetr021207
Ijetr021207Ijetr021207
Ijetr021207
 
Ijetr021146
Ijetr021146Ijetr021146
Ijetr021146
 
Ijetr021145
Ijetr021145Ijetr021145
Ijetr021145
 
Ijetr021144
Ijetr021144Ijetr021144
Ijetr021144
 
Ijetr021143
Ijetr021143Ijetr021143
Ijetr021143
 
Ijetr021140
Ijetr021140Ijetr021140
Ijetr021140
 
Ijetr021139
Ijetr021139Ijetr021139
Ijetr021139
 
Ijetr021138
Ijetr021138Ijetr021138
Ijetr021138
 
Ijetr021135
Ijetr021135Ijetr021135
Ijetr021135
 

Recently uploaded

Polish students' mobility in the Czech Republic
Polish students' mobility in the Czech RepublicPolish students' mobility in the Czech Republic
Polish students' mobility in the Czech Republic
Anna Sz.
 
Sha'Carri Richardson Presentation 202345
Sha'Carri Richardson Presentation 202345Sha'Carri Richardson Presentation 202345
Sha'Carri Richardson Presentation 202345
beazzy04
 
Sectors of the Indian Economy - Class 10 Study Notes pdf
Sectors of the Indian Economy - Class 10 Study Notes pdfSectors of the Indian Economy - Class 10 Study Notes pdf
Sectors of the Indian Economy - Class 10 Study Notes pdf
Vivekanand Anglo Vedic Academy
 
Overview on Edible Vaccine: Pros & Cons with Mechanism
Overview on Edible Vaccine: Pros & Cons with MechanismOverview on Edible Vaccine: Pros & Cons with Mechanism
Overview on Edible Vaccine: Pros & Cons with Mechanism
DeeptiGupta154
 
Home assignment II on Spectroscopy 2024 Answers.pdf
Home assignment II on Spectroscopy 2024 Answers.pdfHome assignment II on Spectroscopy 2024 Answers.pdf
Home assignment II on Spectroscopy 2024 Answers.pdf
Tamralipta Mahavidyalaya
 
How to Split Bills in the Odoo 17 POS Module
How to Split Bills in the Odoo 17 POS ModuleHow to Split Bills in the Odoo 17 POS Module
How to Split Bills in the Odoo 17 POS Module
Celine George
 
Operation Blue Star - Saka Neela Tara
Operation Blue Star   -  Saka Neela TaraOperation Blue Star   -  Saka Neela Tara
Operation Blue Star - Saka Neela Tara
Balvir Singh
 
Language Across the Curriculm LAC B.Ed.
Language Across the  Curriculm LAC B.Ed.Language Across the  Curriculm LAC B.Ed.
Language Across the Curriculm LAC B.Ed.
Atul Kumar Singh
 
2024.06.01 Introducing a competency framework for languag learning materials ...
2024.06.01 Introducing a competency framework for languag learning materials ...2024.06.01 Introducing a competency framework for languag learning materials ...
2024.06.01 Introducing a competency framework for languag learning materials ...
Sandy Millin
 
Instructions for Submissions thorugh G- Classroom.pptx
Instructions for Submissions thorugh G- Classroom.pptxInstructions for Submissions thorugh G- Classroom.pptx
Instructions for Submissions thorugh G- Classroom.pptx
Jheel Barad
 
Additional Benefits for Employee Website.pdf
Additional Benefits for Employee Website.pdfAdditional Benefits for Employee Website.pdf
Additional Benefits for Employee Website.pdf
joachimlavalley1
 
Unit 2- Research Aptitude (UGC NET Paper I).pdf
Unit 2- Research Aptitude (UGC NET Paper I).pdfUnit 2- Research Aptitude (UGC NET Paper I).pdf
Unit 2- Research Aptitude (UGC NET Paper I).pdf
Thiyagu K
 
Welcome to TechSoup New Member Orientation and Q&A (May 2024).pdf
Welcome to TechSoup   New Member Orientation and Q&A (May 2024).pdfWelcome to TechSoup   New Member Orientation and Q&A (May 2024).pdf
Welcome to TechSoup New Member Orientation and Q&A (May 2024).pdf
TechSoup
 
Cambridge International AS A Level Biology Coursebook - EBook (MaryFosbery J...
Cambridge International AS  A Level Biology Coursebook - EBook (MaryFosbery J...Cambridge International AS  A Level Biology Coursebook - EBook (MaryFosbery J...
Cambridge International AS A Level Biology Coursebook - EBook (MaryFosbery J...
AzmatAli747758
 
Students, digital devices and success - Andreas Schleicher - 27 May 2024..pptx
Students, digital devices and success - Andreas Schleicher - 27 May 2024..pptxStudents, digital devices and success - Andreas Schleicher - 27 May 2024..pptx
Students, digital devices and success - Andreas Schleicher - 27 May 2024..pptx
EduSkills OECD
 
The Challenger.pdf DNHS Official Publication
The Challenger.pdf DNHS Official PublicationThe Challenger.pdf DNHS Official Publication
The Challenger.pdf DNHS Official Publication
Delapenabediema
 
Digital Tools and AI for Teaching Learning and Research
Digital Tools and AI for Teaching Learning and ResearchDigital Tools and AI for Teaching Learning and Research
Digital Tools and AI for Teaching Learning and Research
Vikramjit Singh
 
ESC Beyond Borders _From EU to You_ InfoPack general.pdf
ESC Beyond Borders _From EU to You_ InfoPack general.pdfESC Beyond Borders _From EU to You_ InfoPack general.pdf
ESC Beyond Borders _From EU to You_ InfoPack general.pdf
Fundacja Rozwoju Społeczeństwa Przedsiębiorczego
 
How libraries can support authors with open access requirements for UKRI fund...
How libraries can support authors with open access requirements for UKRI fund...How libraries can support authors with open access requirements for UKRI fund...
How libraries can support authors with open access requirements for UKRI fund...
Jisc
 
Chapter 3 - Islamic Banking Products and Services.pptx
Chapter 3 - Islamic Banking Products and Services.pptxChapter 3 - Islamic Banking Products and Services.pptx
Chapter 3 - Islamic Banking Products and Services.pptx
Mohd Adib Abd Muin, Senior Lecturer at Universiti Utara Malaysia
 

Recently uploaded (20)

Polish students' mobility in the Czech Republic
Polish students' mobility in the Czech RepublicPolish students' mobility in the Czech Republic
Polish students' mobility in the Czech Republic
 
Sha'Carri Richardson Presentation 202345
Sha'Carri Richardson Presentation 202345Sha'Carri Richardson Presentation 202345
Sha'Carri Richardson Presentation 202345
 
Sectors of the Indian Economy - Class 10 Study Notes pdf
Sectors of the Indian Economy - Class 10 Study Notes pdfSectors of the Indian Economy - Class 10 Study Notes pdf
Sectors of the Indian Economy - Class 10 Study Notes pdf
 
Overview on Edible Vaccine: Pros & Cons with Mechanism
Overview on Edible Vaccine: Pros & Cons with MechanismOverview on Edible Vaccine: Pros & Cons with Mechanism
Overview on Edible Vaccine: Pros & Cons with Mechanism
 
Home assignment II on Spectroscopy 2024 Answers.pdf
Home assignment II on Spectroscopy 2024 Answers.pdfHome assignment II on Spectroscopy 2024 Answers.pdf
Home assignment II on Spectroscopy 2024 Answers.pdf
 
How to Split Bills in the Odoo 17 POS Module
How to Split Bills in the Odoo 17 POS ModuleHow to Split Bills in the Odoo 17 POS Module
How to Split Bills in the Odoo 17 POS Module
 
Operation Blue Star - Saka Neela Tara
Operation Blue Star   -  Saka Neela TaraOperation Blue Star   -  Saka Neela Tara
Operation Blue Star - Saka Neela Tara
 
Language Across the Curriculm LAC B.Ed.
Language Across the  Curriculm LAC B.Ed.Language Across the  Curriculm LAC B.Ed.
Language Across the Curriculm LAC B.Ed.
 
2024.06.01 Introducing a competency framework for languag learning materials ...
2024.06.01 Introducing a competency framework for languag learning materials ...2024.06.01 Introducing a competency framework for languag learning materials ...
2024.06.01 Introducing a competency framework for languag learning materials ...
 
Instructions for Submissions thorugh G- Classroom.pptx
Instructions for Submissions thorugh G- Classroom.pptxInstructions for Submissions thorugh G- Classroom.pptx
Instructions for Submissions thorugh G- Classroom.pptx
 
Additional Benefits for Employee Website.pdf
Additional Benefits for Employee Website.pdfAdditional Benefits for Employee Website.pdf
Additional Benefits for Employee Website.pdf
 
Unit 2- Research Aptitude (UGC NET Paper I).pdf
Unit 2- Research Aptitude (UGC NET Paper I).pdfUnit 2- Research Aptitude (UGC NET Paper I).pdf
Unit 2- Research Aptitude (UGC NET Paper I).pdf
 
Welcome to TechSoup New Member Orientation and Q&A (May 2024).pdf
Welcome to TechSoup   New Member Orientation and Q&A (May 2024).pdfWelcome to TechSoup   New Member Orientation and Q&A (May 2024).pdf
Welcome to TechSoup New Member Orientation and Q&A (May 2024).pdf
 
Cambridge International AS A Level Biology Coursebook - EBook (MaryFosbery J...
Cambridge International AS  A Level Biology Coursebook - EBook (MaryFosbery J...Cambridge International AS  A Level Biology Coursebook - EBook (MaryFosbery J...
Cambridge International AS A Level Biology Coursebook - EBook (MaryFosbery J...
 
Students, digital devices and success - Andreas Schleicher - 27 May 2024..pptx
Students, digital devices and success - Andreas Schleicher - 27 May 2024..pptxStudents, digital devices and success - Andreas Schleicher - 27 May 2024..pptx
Students, digital devices and success - Andreas Schleicher - 27 May 2024..pptx
 
The Challenger.pdf DNHS Official Publication
The Challenger.pdf DNHS Official PublicationThe Challenger.pdf DNHS Official Publication
The Challenger.pdf DNHS Official Publication
 
Digital Tools and AI for Teaching Learning and Research
Digital Tools and AI for Teaching Learning and ResearchDigital Tools and AI for Teaching Learning and Research
Digital Tools and AI for Teaching Learning and Research
 
ESC Beyond Borders _From EU to You_ InfoPack general.pdf
ESC Beyond Borders _From EU to You_ InfoPack general.pdfESC Beyond Borders _From EU to You_ InfoPack general.pdf
ESC Beyond Borders _From EU to You_ InfoPack general.pdf
 
How libraries can support authors with open access requirements for UKRI fund...
How libraries can support authors with open access requirements for UKRI fund...How libraries can support authors with open access requirements for UKRI fund...
How libraries can support authors with open access requirements for UKRI fund...
 
Chapter 3 - Islamic Banking Products and Services.pptx
Chapter 3 - Islamic Banking Products and Services.pptxChapter 3 - Islamic Banking Products and Services.pptx
Chapter 3 - Islamic Banking Products and Services.pptx
 

Ijetr011960

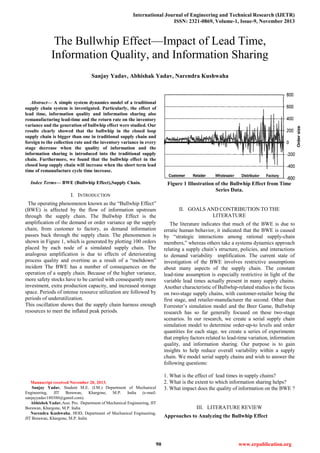
  • 1. International Journal of Engineering and Technical Research (IJETR) ISSN: 2321-0869, Volume-1, Issue-9, November 2013 90 www.erpublication.org  Abstract— A simple system dynamics model of a traditional supply chain system is investigated. Particularly, the effect of lead time, information quality and information sharing also remanufacturing lead-time and the return rate on the inventory variance and the generation of bullwhip effect were studied. Our results clearly showed that the bullwhip in the closed loop supply chain is bigger than one in traditional supply chain and foreign to the collection rate and the inventory variance in every stage decrease when the quality of information and the information sharing is introduced into the traditional supply chain. Furthermore, we found that the bullwhip effect in the closed loop supply chain will increase when the short term lead time of remanufacture cycle time increase. Index Terms— BWE (Bullwhip Effect),Supply Chain. I. INTRODUCTION The operating phenomenon known as the ―Bullwhip Effect‖ (BWE) is affected by the flow of information upstream through the supply chain. The Bullwhip Effect is the amplification of the demand or order variance up the supply chain, from customer to factory, as demand information passes back through the supply chain. The phenomenon is shown in Figure 1, which is generated by plotting 100 orders placed by each node of a simulated supply chain. The analogous amplification is due to effects of deteriorating process quality and overtime as a result of a ―meltdown‖ incident The BWE has a number of consequences on the operation of a supply chain. Because of the higher variance, more safety stocks have to be carried with consequently more investment, extra production capacity, and increased storage space. Periods of intense resource utilization are followed by periods of underutilization. This oscillation shows that the supply chain harness enough resources to meet the inflated peak periods. Manuscript received November 20, 2013. Sanjay Yadav, Student M.E. (I.M.) Department of Mechanical Engineering, JIT Borawan, Khargone, M.P. India (e-mail: sanjayyadav180380@gamil.com). Abhishek Yadav,Assi. Pro. Department of Mechanical Engineering, JIT Borawan, Khargone, M.P. India Narendra Kushwaha, HOD, Department of Mechanical Engineering, JIT Borawan, Khargone, M.P. India Figure 1 Illustration of the Bullwhip Effect from Time Series Data. II. GOALS AND CONTRIBUTION TO THE LITERATURE The literature indicates that much of the BWE is due to erratic human behavior, it indicated that the BWE is caused by ―strategic interactions among rational supply-chain members,‖ whereas others take a systems dynamics approach relating a supply chain‘s structure, policies, and interactions to demand variability implification. The current state of investigation of the BWE involves restrictive assumptions about many aspects of the supply chain. The constant lead-time assumption is especially restrictive in light of the variable lead times actually present in many supply chains. Another characteristic of Bullwhip-related studies is the focus on two-stage supply chains, with customer-retailer being the first stage, and retailer-manufacturer the second. Other than Forrester‘s simulation model and the Beer Game, Bullwhip research has so far generally focused on these two-stage scenarios. In our research, we create a serial supply chain simulation model to determine order-up-to levels and order quantities for each stage. we create a series of experiments that employ factors related to lead-time variation, information quality, and information sharing. Our purpose is to gain insights to help reduce overall variability within a supply chain. We model serial supply chains and wish to answer the following questions: 1. What is the effect of lead times in supply chains? 2. What is the extent to which information sharing helps? 3. What impact does the quality of information on the BWE ? III. LITERATURE REVIEW Approaches to Analyzing the Bullwhip Effect The Bullwhip Effect—Impact of Lead Time, Information Quality, and Information Sharing Sanjay Yadav, Abhishak Yadav, Narendra Kushwaha
  • 2. The Bullwhip Effect—Impact of Lead Time, Information Quality, and Information Sharing 91 www.erpublication.org The original characterization of the BWE is due to Forrester (1958, 1961), who employed a continuous simulation system called ‗DYNAMO’ to simulate a four-node production-inventory-distribution system. Forrester described the behavior of the system under various internal conditions and its response to external changes and shocks. His underlying theme was that the structure, policies, and interactions within a supply chain cause variability amplification. This approach is also employed in the simulation-driven works of Towill (1991), Wickner, Towill, and Naim (1991), and Towill, Naim, and Wickner (1992) and, to a lesser extent, of Bhaskaran (1998). Bhaskaran analyzed a manufacturing supply chain using simulation and showed how the various components interacted with each other, concluding that the lack of coordination in supply chains led to inventory fluctuations and to a high average inventory level. This involves representing the relationships within a supply chain, such as replenishment policies, as a set of transfer functions. These transfer functions can then be used to relate the output of the system (orders) to the input (demands) by utilizing the z-transform of the output and input variables (Dejonckheere et al. 2004). IV. INVESTIGATION AND METHODOLOGY Factors Investigated Lead-Time Variation. The first factor deals with the modeling of supply chain lead times, which previous investigations of the BWE have restricted to constant values. We investigate various levels of leadtime variation, using the distribution to represent stochastic lead times. We create four scenarios based on different levels of the coefficient of variation for the lead-time. Information Quality Level. The second factor is the ―quality‖ of information available or chosen. This information is used directly in lead-time demand forecasting and inventory parameter updating. It may also affect the order streams, inventory levels, stockouts, and other aspects of a supply chain. We distinguish between four information quality levels (IQL) that may be used for updating the order-up-to point: levels 0, 1, 2, and 3. Level 0. IQL0 Means no new information is used. This is the case where there is no new information collected to aid in updating, or possibly the case where the demand and lead-time distributions are known and thus the ―best‖ order- up-to value can be chosen in advance, with no need for any updating. Level 1. IQL1 Assumes that the histories of incoming demands and of lead times are available. Information on lead-time variance is not used in updating the inventory policy parameters, which could be due to a mistaken assumption of constant lead times or the belief that lead-time variation is not important. Level 2. IQL2 Assumes that the histories of incoming demands and of lead times are available, but in this case an estimate of lead-time variance is generated and used for up-dating the inventory policy parameters. Level 3. IQL3 Assumes that the inventory manager tracks and stores the final lead-time demand realizations for each order. Forecasts should be more accurate and exhibit less ―nervousness‖ when employing IQL3, since the final realizations of lead-time demand are used instead of the intermediate surrogate data of lead time and demand. Information Sharing. The first two factors were lead-time variation and information quality level. The third factor is information sharing. With no information sharing, each node generates its own forecast, based on local information, and the forecast is then used to generate a new order-up-to value, and consequently, the order size for the current period. The idea of information sharing is that if the nodes were aware of the current customer demands, they would make forecasts with that information and fine-tune their inventory system parameters accordingly. Since the customer‘s demand order stream will have a variance less than or equal to the variance of the orders coming from the downstream partner, the assumption is that a node using customer information will smooth the fluctuations in the order-up-to level and the resulting order stream will have a lower variance. V. SUPPLY CHAIN MODEL We employ single-stage lead times with the entire delay occurring during transportation. We assume that any information delay, or the delay necessary for the order to ―get into the right hands,‖ is zero. We also assume that the time to fill an order once it is received (order processing delay) is also zero. The mean lead times at the customer, retailer, wholesaler, distributor, and factory are 0, 4, 4, 4, and 4 time units, respectively, not including the review period, R=1. We assume that these delays are gamma-distributed. Lead-Time Demand Let X be the demand during the protection period L+ R. Then X has mean µX that we estimate by X, and variance that we estimate by . Hence, X for an order placed at time t, is the convolution (1) VI. SCOPE OF INFORMATION With no information sharing, supply chain nodes possess only local information and are ―blind‖ to what is going on outside their level. Each node‘s supply chain knowledge-base is derived from the incoming demand flow coming from the downstream partner and the outgoing flow of orders being placed with the upstream partner. With information sharing, each node in the supply chain receives information on customer demand, in addition to orders from its downstream supply chain partner. The nodes make no assumptions
  • 3. International Journal of Engineering and Technical Research (IJETR) ISSN: 2321-0869, Volume-1, Issue-9, November 2013 92 www.erpublication.org regarding the demand or lead-time distribution, except that the lead time is stationary. Each node makes all assessments based only on the available data and attempts to adjust its actions to adapt to the ―current‖ conditions. So, for example, even though customer demand is iid, and thus the mean and variance do not change over time, the retailer does not ―know‖ this and will update the inventory policy parameters using forecasts based upon the most recent demand information. Inventory Policy. The order-up-to point, S, is determined using typical inventory management methods, which include the normal approximation in setting the safety stocks. Thus, S is the base stock that allows the system to meet the demand during the time period L+R. We use a safety factor of z=2.0 (service level of 97.72%) in calculating S = X + zsX (2) Forecasting and Estimation. When updating, we use forecasts of the lead-time demand mean (X) and its standard deviation (sx) to set an order-up-to level that would yield a desired service level. How we forecast X and sX depends on the information available, i.e., which IQL is used. VII. ANALYSIS The Impact on the BWE of Not Updating Inventory Parameters We determine that with no updating, i.e., when we employ IQL0, then no variance amplification occurs. Each of the eight scenarios that utilize IQL0 show no BWE at all. But since IQL0 has a known impact, we now exclude it from our experimental analysis. Thus, for the remaining factors and factor levels, we analyze 24 scenarios (3 information quality levels x 4 lead time variance levels x 2 information sharing levels) instead of the initial 32. The Impact on the BWE of Information Sharing Our results with regard to information sharing confirm much of what has been found when analyzing simpler systems. We will find information sharing does not eliminate the BWE. We find information sharing to be the most significant factor at all stages of the supply chain except the retailer‘s. The exception of the retailer is expected, since the advantage of information sharing is that all stages receive customer demand information, which the retailer has whether information is shared or not. When observing the experimental means, we see that the use of information sharing decreases the total variance amplification at the wholesaler The Impact on the BWE of Information Quality We start by noting again that all scenarios utilizing IQL0 no updating of order up to level showed no Bullwhip Effect whatsoever, and were excluded from further analysis. We analyze the remaining three information quality levels (IQL1, IQL2, and IQL3). When observing total variance amplification, we find information quality to be significant at all of the supply chain. In general, we find IQL2 to be the biggest aggravator of the Bullwhip Effect. We recognize that IQL2, which uses demand rate (D) and lead time (L) data to forecast the lead-time demand, will result in forecasts with greater variability than IQL1 or IQL3. Forecast variability leads to ―nervousness‖ of the order-up-to level, which results in the BWE. VIII. RESULT Given our supply chain structure, regular updates of the order-up-to level are a necessary condition for the Bullwhip Effect (BWE). We see this by its absence with no updating. We conclude that the initiation of the BWE is due the to manager‘s attempts to adjust the inventory policy to correspond to the latest data. These adjustments cause system ―nervousness,‖ which is a precursor to the BWE. We do not believe adjustments to inventory policies are always detrimental. It may have a positive influence on cost and service aspects of the system, but they do lay the groundwork for the variance amplification of demand. Information sharing reduces total variance amplification and stage variance amplification. We find that information sharing decelerates the BWE as we go up the supply chain, which could be the result of planning ahead, since the upper supply chain would be responding to customer demand information before the demands actually show up in the form of an order from the downstream partner. Information sharing protects a supply chain against failures. When observing BWE differences between the models when not using information sharing. We attribute this to the cascading effect that failures (stockouts) at the upper may have on multiple downstream nodes. When information is shared, the cascading phenomenon disappears. information quality is an important factor in BWE formation and we see that better information quality reduces it. We believe that information quality drives the BWE by affecting the stability and accuracy of the lead-time demand forecasting process. Less stable or accurate forecasting processes will result in less accurate and more variable order-up-to levels, which result in greater order variability. At the outset, we posed three research questions: what is the effect of stochastic lead times in supply chains; to what extent does information sharing help in attenuating the Bullwhip Effect; and what is the effect of the quality of information available. We hope that we have answered these questions satisfactorily in this experiment. REFERENCES [1] G Bhaskaran, S. 1998. ―Simulation analysis of a manufacturing supply chain‖. Decision Sciences 29(3) 633–657. [2] Cachon, G. P., M. Fisher. 2000. ―Supply chain inventory management and the value of shared information. Management Science” 1032–1048. [3] Chatfield, D. 2001. SISCO and SCML—Software tools for supply chain simulation modeling and information sharing. Unpublished Ph.D. dissertation, Department of Management Science and Information Systems, Penn State University, Pennsylvania. [4] Croson, R., K. Donohue. 2003a. ‗Behavioral causes of the Bullwhip Effect and the observed value of inventory information‘. Working paper, Department of OPIM, The Wharton School, University of Pennsylvania, Pennsylvania. [5] Kim, J., D. Chatfield, T. Harrison, J. Hayya. 2004. ‗Quantifying the Bullwhip Effect in a supply chain with stochastic lead time.‘
  • 4. The Bullwhip Effect—Impact of Lead Time, Information Quality, and Information Sharing 93 www.erpublication.org [6] Working Paper, ―Center of Supply Chain Research‖, Smeal College of Business, Penn State University,Pennsylvania. [7] Lee, H., P. Padmanabhan, S. Whang. 1997a. ―The Bullwhip Effect in supply chains. Sloan Management” Review 38(3) 93–102. [8] Lee, H., P. Padmanabhan, S. Whang. 1997b. ―Information distortion in a supply chain: The Bullwhip Effect‖. Management Science 43(4) 546–558. [9] Warburton, R. D. H. 2004. ―An analytical investigation of the Bullwhip Effect‖. Production and Operations Management (2) 150– 160.