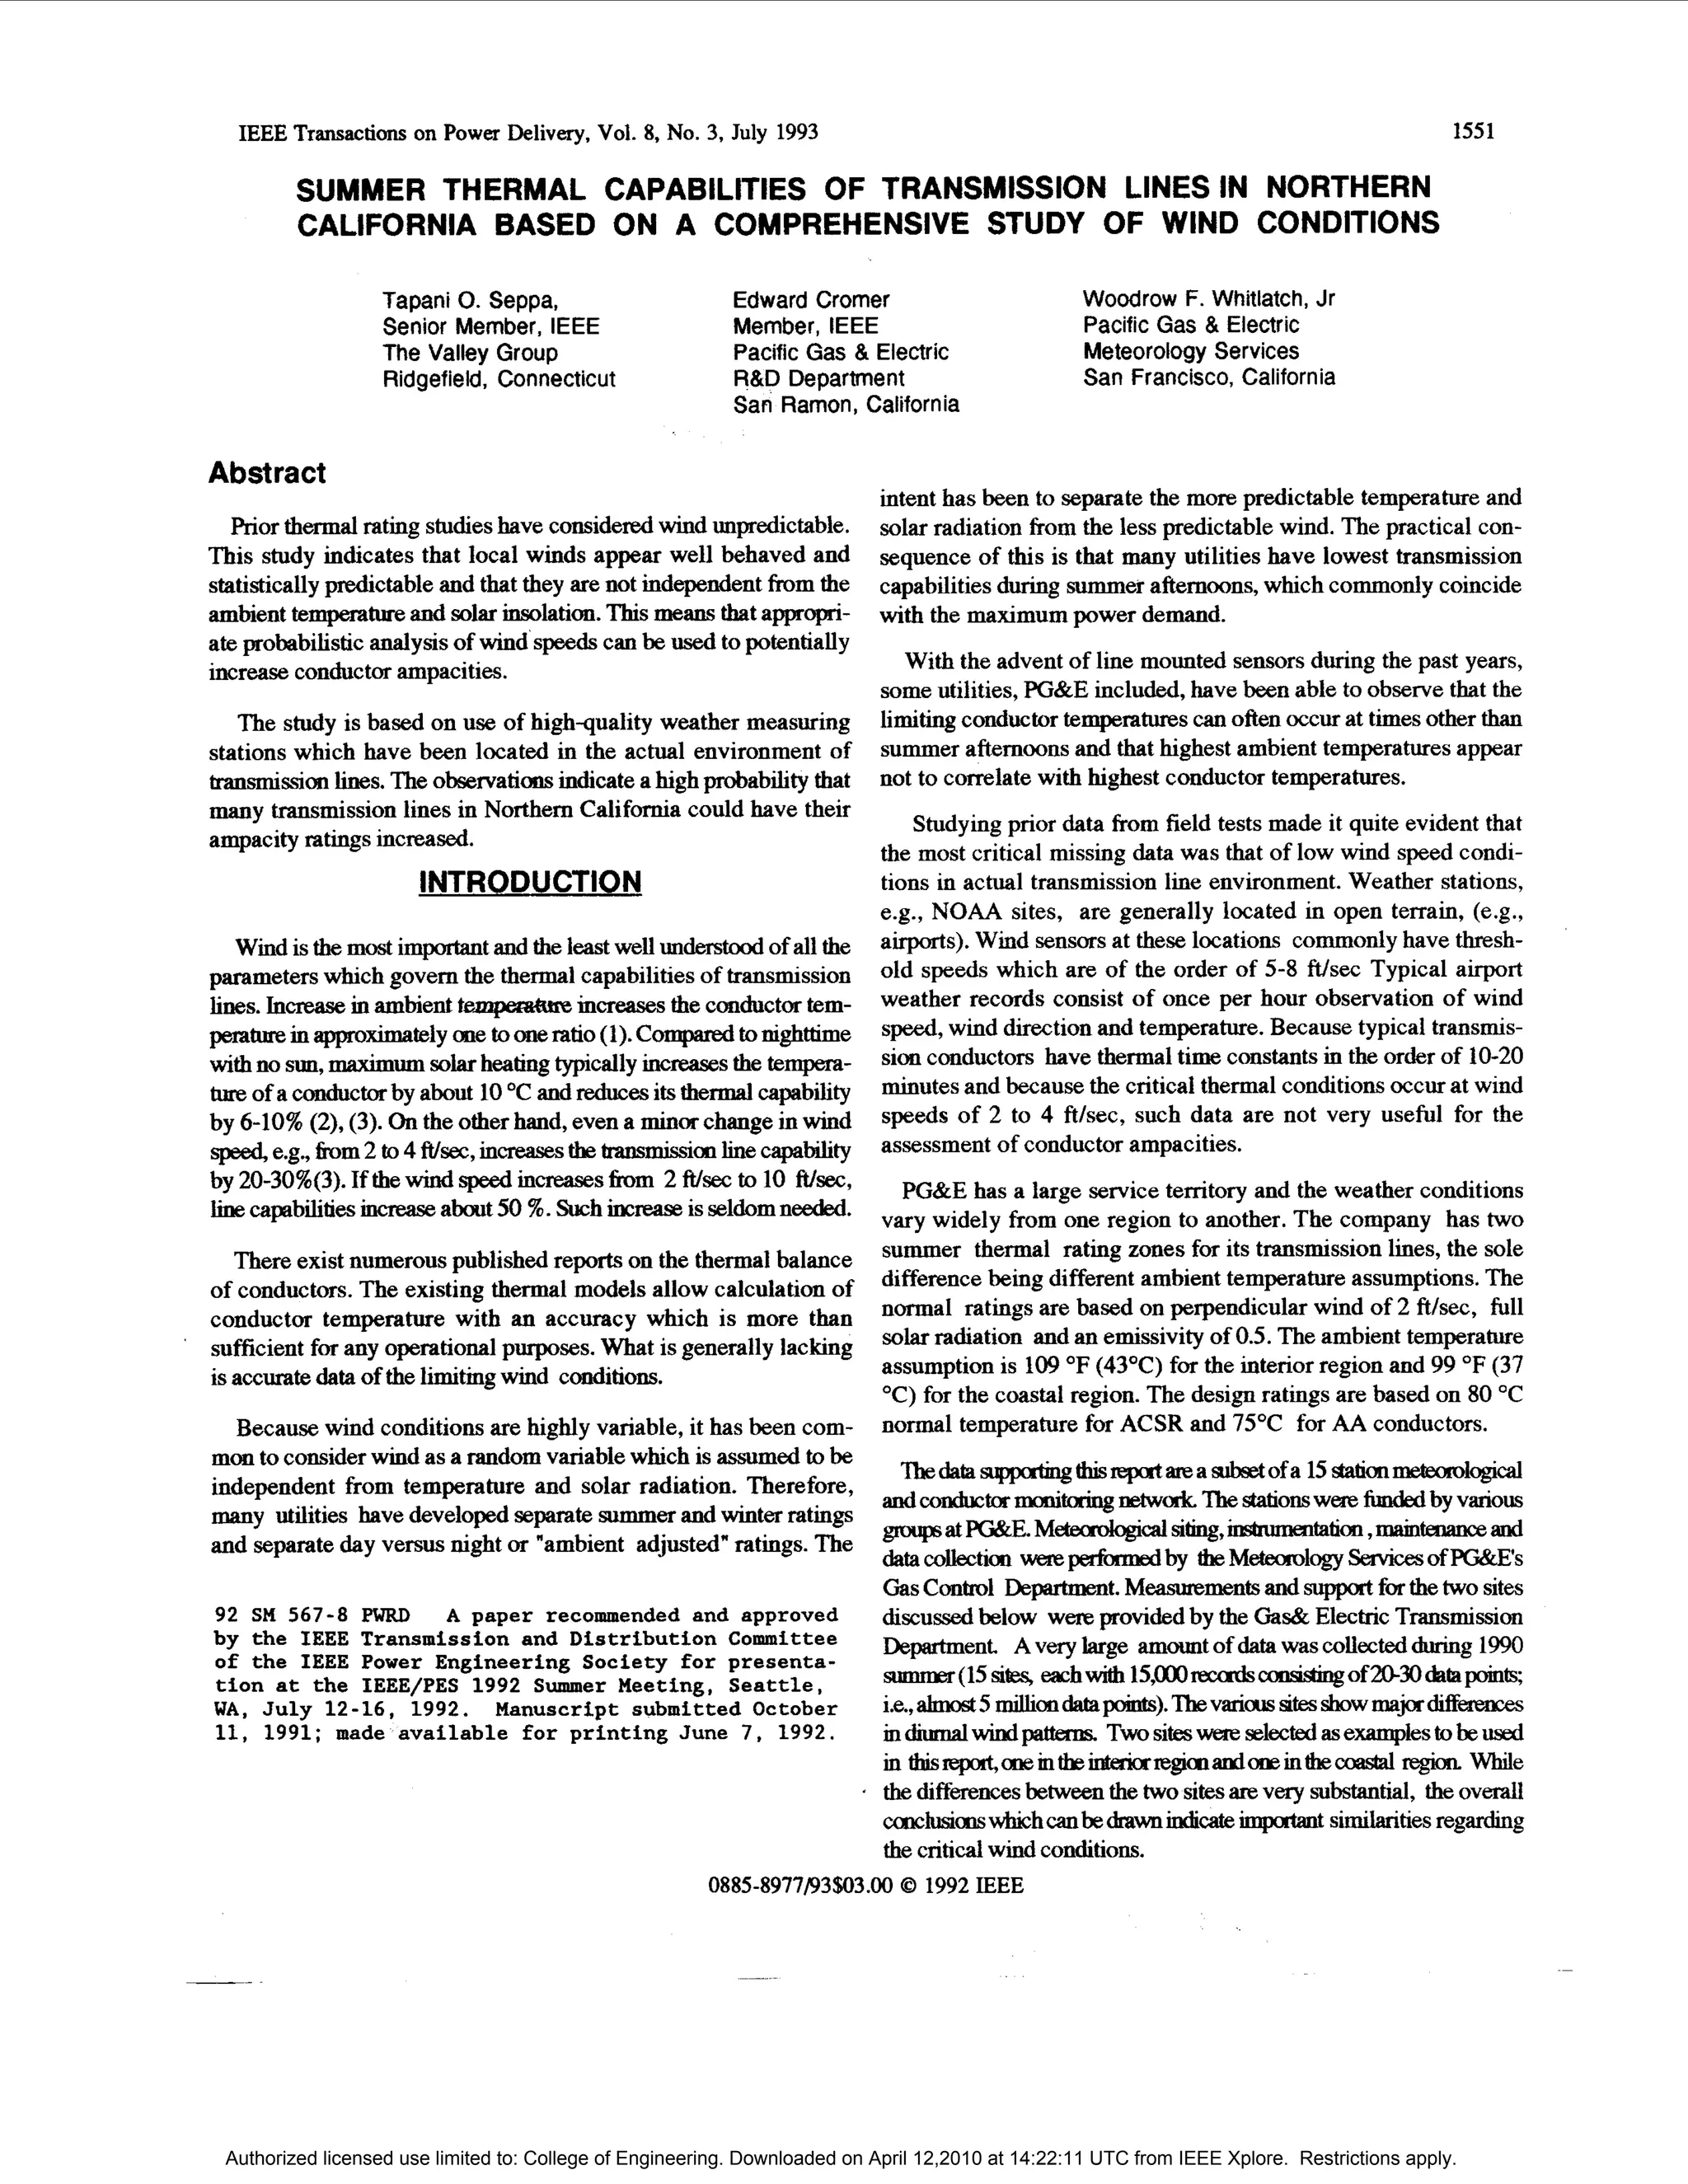
This document summarizes a study of wind conditions and their impact on transmission line ratings in Northern California. The study found that local winds are statistically predictable and not independent of temperature and solar radiation. This means transmission line ratings could potentially be increased through probabilistic wind analysis. The study was based on high-quality weather data collected from sensors placed near transmission lines, which found a high probability that many line ratings in Northern California could be raised.
The document discusses how ocean surface features can impact wind retrieval from synthetic aperture radar (SAR) data. SAR wind retrieval relies on geophysical model functions (GMFs) that relate normalized radar cross-section (NRCS) to wind speed, but factors like sea surface temperature (SST) patterns, sea ice, ships and platforms, and internal waves can influence NRCS and introduce errors. The authors evaluate methods to account for SST effects, finding their proposed NRCS-SST correction model can reduce wind speed root mean square error to less than 2 m/s when validated against buoy data. In general, calibrating SAR data, developing multi-polarization GMFs, and implementing preprocessing to compensate for environmental
The Havsnäs Pilot Project had three main goals: 1) to help remove barriers to large scale onshore wind development in northern Sweden by studying nature impacts, project finance, and foundation design; 2) to research technical areas like high hub heights and cold climate effects; and 3) to improve knowledge of wind resource assessment, power performance, and icing impacts. Key findings included that mast spacing affected flow modelling uncertainty, multi-point shear methods best characterized profiles, and remote sensing validated shear above measurement heights. Icing reduced annual yield by an estimated 4.1%.
The document discusses a project called "Spinner-Farm" that aims to optimize yaw alignment of wind turbines using spinner anemometry. A spinner anemometer has been installed on an onshore turbine in Denmark to calibrate sensors and optimize installation procedures for future deployment on offshore turbines. Installations on 10 offshore turbines will take place in summer 2010. Measurements will be taken through summer 2011 to investigate performance increases from improved yaw alignment using spinner anemometry. The project aims to increase annual energy production by 1-5% through more accurate yaw control.
The document summarizes results from the High Altitude MMIC Sounding Radiometer (HAMSR) during the 2010 GRIP Hurricane Field Campaign. HAMSR is a microwave radiometer flown on the Global Hawk unmanned aerial vehicle to observe the 3D temperature and water vapor structure of hurricanes. Key findings include detailed observations of the inner-core thermodynamic structure and intensity evolution of Hurricanes Earl and Karl, which helped improve intensity forecasting. HAMSR data is publicly available and was also used to time dropsonde releases during atmospheric river flights in the 2011 WISPAR campaign.
The document proposes several extreme engineering solutions to address climate change, including a global electricity grid, harvesting wind energy from southeast Greenland, and direct air carbon capture with the captured CO2 used to produce synthetic green fuels. It summarizes a project called Katabata that installed three weather stations in southeast Greenland to measure wind speeds, finding that a regional model accurately simulated observed winds. It outlines a proposal for remote renewable energy hubs that use solar and direct air capture to produce green methane for shipping to consumption centers.
S4 oman wind energy potential anemometers 2016CETN
The document provides an overview of wind energy and wind measurement techniques. It discusses how wind forms due to solar heating of the atmosphere and typical global wind patterns. It then covers various anemometer types used to measure wind speed and direction for assessing wind resources and designing wind farms. The document also reviews specifications for cup anemometers and wind vanes commonly used in wind measurements. Finally, it outlines the process of installing a meteorological tower for collecting wind data, including mast types, instrument placement heights, and erection steps.
Nwtc turb sim workshop september 22 24, 2008- site specific modelsndkelley
1) The document describes several inflow turbulence models available in the TurbSim code developed by NREL, including models based on standard IEC conditions, smooth homogeneous terrain, specific wind farm sites, complex mountainous terrain, and a North American high plains site.
2) Comparisons of simulation results using the IEC, Great Plains, and NWTC models show differences in predicted blade loads, rotor torque, bending moments and tip deflections when applied to the NREL 5 MW reference turbine.
3) In particular, the Great Plains model including a low-level jet produced significantly higher loads and deflections compared to the standard IEC model, demonstrating the importance of using site-specific models.
The document discusses spaceborne microwave observations of rain from 1972 to 1997, beginning with the launch of the Electrically Scanned Microwave Radiometer (ESMR) on Nimbus 5 and concluding with the launch of the Tropical Rainfall Measuring Mission (TRMM). Early instruments provided the first observations of rain over the ocean but quantitative retrievals were limited. The Special Sensor Microwave/Imager (SSM/I) improved rainfall estimates with additional channels and calibration. Profiling algorithms were developed to retrieve rain rates from passive microwave measurements over ocean. TRMM introduced the first spaceborne precipitation radar to further advance quantitative rainfall measurements from space.
Remote Sensing Application in Wind EnergySiraj Ahmed
The document summarizes a training course on remote sensing for wind energy held from June 10-14, 2013 at the Danish Technical University. The training covered various remote sensing techniques used in wind energy applications including SODAR, LIDAR, SAR, and scatterometers. Specific topics included atmospheric boundary layers, signal processing, mixing layer height detection, wind profiling, turbulence measurement, power curve verification, and offshore applications. Hands-on demonstrations of LIDAR, SODAR and other instruments were provided. The use of remote sensing for resource assessment, wind turbine operation and control, and other applications in both onshore and offshore wind energy was discussed.
Evidence for the charge-excess contribution in air shower radio emission obse...Ahmed Ammar Rebai PhD
The following paper I co-authored is now online on slideshare! I participated in the Codalema Experiment operations and data analysis since July 2009 until February 2014.
Context. Observation of the charge-excess mechanism in the emission of the electric field from cosmic ray air showers.
Aims. It is shown that the signature of the charge-excess mechanism is present in the CODALEMA data
Methods. The data exhibits a shift in the ground position in the shower cores seen from the radio data and the particle
data. This shift is explained when using a simulation code taking into account or not the charge-excess mechanism.
Results. Evidence for the charge-excess in the atmospheric shower has been found via the electric field emitted by the
secondary particle and detected by the CODALEMA experiment.
Conclusions. The systematic shift between the shower core estimation using separately the particle array data and
the radio array data of the CODALEMA experiment is discussed. Using the simulation code SELFAS2 we show that
the consideration of the charge-excess contribution in the total radio emission of air showers generates a shift of the
apparent ground radio core along the east-west axis in good agreement with the observations. This radio core shift is
then characterized for the CODALEMA setup and compared with the data. The observation of this systematic shift
can be considered as an experimental signature of the charge excess contribution.
The document is Karl Nilsson's doctoral thesis which uses numerical modeling to study wind turbine wakes and wake interactions. It summarizes the key findings of the research which included: 1) validating numerical simulations of the Lillgrund wind farm against power production data, 2) analyzing uncertainties in the rotor modeling approach, and 3) evaluating the impact of including a power controller in the simulations. The research provides insights into modeling wind farm flows and optimizing wind farm layouts.
The document discusses estimating air and snow surface temperature evolution in East Antarctica using passive microwave remote sensing. Key points:
- Passive microwave sensors have been monitoring Antarctica since the 1980s, providing multiple images per day, but the continent remains undersampled.
- Correlation analysis between brightness temperature (Tb) measurements from sensors and in situ snow/air temperature data show Tb is closely related to snow temperature at different depths.
- Linear regressions were used to retrieve snow temperatures at depths from 0-10 meters using Tb, achieving good correlation (R2 > 0.9) and standard errors around 2°C.
- Air temperature was also retrieved but with lower accuracy (RMSE 4-
Extinction of Millimeter wave on Two Dimensional Slices of Foam-Covered Sea-s...IJSRED
This document discusses millimeter wave (mmW) extinction due to its interaction with layers of air bubbles (sea foam) on the ocean surface. It presents the following key points:
1) A numerical model using the split-step Fourier method was used to evaluate mmW attenuation through layers of sea foam of varying thickness, frequency, polarization, and incidence angle.
2) Estimates of the effective dielectric constant of sea foam layers were calculated for different foam configurations and WindSat frequencies based on a two-dimensional model of randomly packed air bubbles coated with thin seawater layers.
3) The parabolic wave equation method, which approximates solutions to Maxwell's equations, was discussed as an efficient way to
The document describes upgrades made to the High-Altitude Monolithic Microwave Integrated Circuit (HAMSR) Sounding Radiometer instrument. Key upgrades include:
1) Addition of new low-noise amplifiers to reduce noise in the 183 GHz channel, enabling observation of smaller-scale water vapor features.
2) An enhanced data system providing onboard processing and real-time data access for long-duration flights on the Global Hawk unmanned aerial vehicle.
3) Extensive calibration and characterization of the instrument following the upgrades. The instrument will profile temperature, water vapor and clouds to study tropical cyclones.
The document describes the first overflights of tropical cyclones using the Hurricane Imaging Radiometer (HIRAD) instrument. HIRAD is an airborne microwave radiometer designed to provide wide swath imaging of surface winds and rain rates under hurricanes. Initial results are reported from overflights of Hurricanes Earl and Karl in 2010, including comparisons to coincident measurements from the Stepped Frequency Microwave Radiometer (SFMR). HIRAD produced temperature brightness images across its wide swath and initial calibration was done using SFMR measurements. Future work will focus on developing retrieval algorithms for off-nadir wind speeds and rain rates from HIRAD's wide-field observations.
The document describes MARRS (Mars Atmosphere Resource Recovery System), a proposed system to recover oxygen, water, and other resources from the Martian atmosphere. It would involve compressing the atmosphere, condensing the carbon dioxide, and separating out the oxygen, water, nitrogen, argon, and carbon monoxide. This would produce useful resources like oxygen for life support and fuel production. The system would use a 5 megawatt nuclear reactor to power compression and separation processes. Initial estimates suggest MARRS could produce tens of kilograms of oxygen and other resources per day with a total system mass of only a few metric tons.
Antenna Calibration for Electromagnetic Compatibility (EMC) TestingDoug Kramer
The document discusses standards for antenna calibrations used in electromagnetic compatibility (EMC) testing, including ANSI C63.5-2017, CISPR 16-1-6:2017, and SAE ARP 958D. It summarizes the key calibration methods specified in each standard, including the Equivalent Capacitance Substitution Method for rod antennas, the Three Antenna Method and Two Identical Antenna Method in SAE ARP 958D, and the Standard Site Method in ANSI C63.5 and CISPR 16-1-6. It emphasizes that the calibration standard used needs to be specified depending on the intended application of the antenna and EMC test.
- The document summarizes a study that analyzed wind speed data from 8 meteorological stations in and around Nairobi County, Kenya to determine basic mean hourly wind speeds for structural design.
- Hourly wind speed data was obtained from the stations and corrected for terrain and altitude factors to standardize the data. Extreme value analysis using the Gumbel method was then performed to determine the 50-year return period wind speeds.
- Graphs of the extreme value analysis for 3 of the stations are shown, with the 50-year return period wind speed values able to be determined from the line of best fit on each graph.
The document discusses experiments on controlling hurricanes and weather through small perturbations based on the sensitivity of the atmosphere. It describes using numerical weather prediction models, data assimilation systems, and satellite sensing to determine optimal temperature perturbations to control the path and intensity of simulated Hurricane Andrew. While initial experiments showed potential for steering the hurricane, significant challenges remain regarding power requirements, modeling capabilities, and addressing legal and ethical concerns before operational weather control could be feasible.
Nrsi can wea2010_cut_in_speeds(stephenson)nm2allen
This document discusses modifying cut-in wind speeds for wind turbines to reduce bat mortality. It summarizes research showing substantial bat mortality reductions from increased cut-in speeds. It describes challenges in understanding wind speeds at bat flight heights and variations in bat activity patterns. It recommends matching cut-in speed modifications to specific bat activity patterns and considering cost effectiveness of curtailment versus turbine modifications.
Generating and Using Meteorological Data in AERMOD BREEZE Software
AERMOD, the preferred model of the U.S. EPA for near-field air dispersion modeling, requires the use of two meteorological files: the surface (.SFC) and profile (.PFL) files.
CEPSI 2014 Full paper JKT Alstom WIND TURBINE OPERATION IN TYPHOON CONDITIONSJosef Tadich
- Typhoons are a challenging design condition for wind turbines in the Asia-Pacific region. They can produce extreme 10-minute wind speeds over 45 m/s.
- Typhoons are characterized as tropical cyclones that develop over warm water and rotate counter-clockwise in the northern hemisphere. The most destructive winds occur at the eyewall.
- Extreme wind speeds for turbine design are estimated using statistical analysis of long-term wind data and exceedance rates, with a typical standard being the 50-year return period wind speed.
Air conditioning systems
2. Properties of moist air
3. Moist air processes
4. Space air conditioning
5. Indoor air quality--comfort and health
6. Heat transfer from human body
7. Heat transfer in building envelopes
8. Infiltration heat load and weatherizing
9. Computation of the heating load
10. Heat gain by solar radiation
11. Computation of the cooling load
12. Energy requirements for HVAC systems; building energy audit
13. Fans--performance, selection, and installation
14. Air flow in ducts and fittings
15. Design of duct systems
16. Codes & standards for building energy systems
17. Annual energy consumption
"Using Scilab in the Radiation Thermometry Laboratory of Inmetro"
By Ricardo Sohn, Instituto Nacional de Metrologia, Qualidade e Tecnologia - Inmetro for ScilabTEC 2015
The document provides an overview of basic parliamentary procedure. It defines parliamentary procedure as the body of rules used to conduct effective and organized meetings for self-governing organizations to make decisions. Key terms related to parliamentary procedure like agenda, motion, amendment, bylaws, and quorum are explained. The different types of motions, ways to amend motions, and methods of voting are outlined. Finally, the document notes that minutes are the written record of a meeting's proceedings, not details of debates, and that parliamentary procedure is used by legislative and governing bodies.
This document lists the names of 10 community members who established an online community on April 15, 2010. The community was created by merpatisepi and can be found at the URL http://www.myspace.com/aenhumble.
Boy Scouts of America Merit Badge for Foundry Practice 1930Hobby Foundry
The document outlines the requirements to obtain a Merit Badge for Foundry Practice. It lists 8 requirements including making drawings of foundry tools, constructing molds and patterns, describing how a cupola operates, cleaning and finishing castings, describing properties of sand for foundry use, and safety precautions in a foundry. Constructing molds and patterns requires first making the pattern, using a flask to support the mold material, and inserting cores to form hollow spaces. Molds can be made of various materials like green sand, dry sand, or loam in bench or floor work. Tools used include shovels, rammers, sieves, bellows, and various trowels and slicks.
This document provides an overview and table of contents for a book about casting brass. It discusses casting various types of brass alloys like red brass, leaded yellow brass, and tin bronzes. It also covers topics like gates and risers, revelations from experience casting brass, and how to run a small brass foundry business. The book is intended to teach both the technical aspects of producing quality brass castings and the business side of successfully operating a brass foundry.
Conducted wind resource assessment study in western himalayan region and undertook geographical study of site. Work involved data analysis, validation for establishing and predicting of wind power generation potential at given site.
The document summarizes a wind resource assessment conducted in Tonga Islands, South Pacific. It analyzes wind speed and direction data collected from two towers located on the main island of Tongatapu over one year. The mean wind speed was 4.5-4.54 m/s at 34m above ground level and 3.63-3.45 m/s at 20m AGL. The prevailing wind direction was southeast, corresponding to southeast trade winds. Analysis indicated a low wind speed regime and potential for wind energy development.
This chapter discusses wind resource and site assessment for wind farm projects. It explains that accurate wind speed measurements are crucial for assessing the wind resource and financial viability of a project. On-site wind measurements should be taken for at least one full year using high-quality instruments like cup anemometers. Careful instrument selection, installation, calibration and data analysis are important to obtain reliable wind speed data that can then be used to model the spatial variation of wind across the site.
This document analyzes wind power density in Azmar Mountain located in Sulaimani region of northern Iraq. Hourly wind speed data was collected over one year at a height of 5 meters above ground. The mean wind speed ranged from 4.65 to 11.86 m/s at 5 meters and 6.41 to 16.36 m/s at 50 meters after extrapolation. The Weibull distribution parameters c and k varied between months with c ranging from 5.21 to 13.46 m/s and k ranging from 1.60 to 3.47. The mean wind power density ranged from 70.89 to 1559.16 W/m2 at 5 meters and 186.71 to 4096.20 W/
IJERA (International journal of Engineering Research and Applications) is International online, ... peer reviewed journal. For more detail or submit your article, please visit www.ijera.com
Atmospheric Dispersion in Nuclear Power Plant SitingHussain Majid
This document discusses atmospheric dispersion modeling for nuclear power plant siting. Meteorological data collection is important for modeling radioactive releases from plants during normal operation and accidents. Stability classes are determined from factors like temperature lapse rate, wind fluctuations, insolation, and cloud cover to characterize turbulence levels affecting dispersion. Both simple and complex terrain features must be considered when collecting and interpreting meteorological data used in dispersion calculations.
Wind energy forecasting using radial basis function neural networkseSAT Journals
This document summarizes a study that used radial basis function neural networks to forecast wind energy. The study collected wind resource data from 76 monitoring stations in India, including parameters like wind speed, direction, air density, and more. It divided the data into a 80% training set and 20% testing set. A radial basis function neural network with an input layer of 14 neurons, hidden layer of 142 neurons, and output layer of 1 neuron was developed. This network was trained for 10,000 cycles to model the nonlinear relationship between input wind parameters and output wind power density. The predicted wind power densities for new locations based on the trained network agreed well with actual measured values, with a mean absolute percentage error of less than 10%. The
This report summarizes wind data collected from two meteorological towers over a 32 month period from 2006-2009. The data was used to assess the wind resource and estimate potential energy production from a horizontal axis and vertical axis wind turbine. Key findings include:
- Average monthly wind capacity at the tower location was 31% for a horizontal axis turbine and 17% for a vertical axis turbine during the initial 12 month study period.
- Wind capacity averaged 27% for the horizontal axis turbine and 15% for the vertical axis turbine during the 2008-2009 study period.
- June, July and August typically had the lowest wind velocities of the year according to the historical data collected.
The Colorado Space Grant Consortium's RocketSat-10 team is conducting a microgravity experiment on the solidification of aluminum-indium compounds. The experiment will fly on a Terrier Improved Malemute rocket to 150km altitude as part of the RockSat-X program. The payload will use induction heating to create a sample in microgravity and collect sensor data to study the material's microstructure compared to ground samples. Results could contribute to space-based material science and verify induction heating systems for space.
This document summarizes a study on connecting a wind farm to an AC load through a rectifier-inverter system and using batteries for energy storage. It discusses how batteries can be charged during periods of high wind by storing surplus power generated, and can discharge to supply the AC load during periods of low wind. MATLAB simulation results are presented showing voltage waveforms with and without batteries connected in parallel to the wind farm. The study highlights the importance of energy storage devices like batteries for ensuring continuous power supply to loads, even during low wind conditions, by charging batteries when wind is high and discharging them when wind is low.
This document discusses wind resource assessment for wind farm development. It covers how wind is generated, accessing wind resources through measurement and modeling, and estimating energy production with uncertainties. Key steps include measuring wind speeds on site, correlating to long-term reference stations to predict long-term distributions, modeling wind flows, planning turbine layouts, and estimating annual energy yields while accounting for production losses and uncertainties. Accurate wind assessment is critical for maximizing energy production estimates and ensuring project viability.
This document summarizes a study on the impact of field roughness, power losses, and turbulence intensity on electricity production for an onshore wind farm in Kitka, Kosovo. The study analyzed wind data collected from an onsite met mast from August to December 2017. It estimated annual energy production for the wind farm using wake and loss models. Turbulence intensity was estimated to be 9-12% at hub height based on wind speed data. The roughness of the terrain was found to be less than the added roughness of wind turbines. Despite differences in elevation between turbines, the site roughness index was found to be mostly consistent, allowing similar turbines to be installed without affecting energy production quality.
IRJET- Development of X-Wire Probe for Hot Wire AnemometryIRJET Journal
1) Researchers developed a bi-directional hot wire probe called an "X-wire" to be used for atmospheric studies.
2) Testing showed that a 10mm filament spacing provided better sensitivity than a 5mm spacing. Resistance values of the probe filaments were measured at varying currents.
3) The effects of atmospheric pressure, temperature, and humidity on the probe's voltage signal were evaluated individually. Pressure was varied using a vacuum pump, temperature using a thermal blower, and humidity by adding a wet cloth. This was to determine the relationship between external variables and the probe's response.
This paper proposes a Wavelet based Adaptive Neuro-Fuzzy Inference System (WANFIS) applied to forecast the wind power and enhance the accuracy of one step ahead with a 10 minutes resolution of real time data collected from a wind farm in North India. The proposed method consists two cases. In the first case all the inputs of wind series and output of wind power decomposition coefficients are carried out to predict the wind power. In the second case all the inputs of wind series decomposition coefficients are carried out to get wind power prediction. The performance of proposed WANFIS is compared to Wavelet Neural Network (WNN) and the results of the proposed model are shown superior to compared methods.
Validation of wind resource assessment process based on CFD Jean-Claude Meteodyn
Wind resource assessment requires nowadays more efficient tools to provide an accurate evaluation of production in order to reduce costs.As onshore wind farms are built in more complex terrains, it is necessary to find a new method to provide a fine evaluation of energy which reduces the error during the data extrapolation process. This explains why CFD models have become a standard for WRA in specific conditions.This presentation is focused on the wind speed and energy yield prediction carried out for a 29MW wind farm project. The accuracy of the wind modeling is investigated by the cross validation between the different met masts around the site. The net energy prediction P50 is compared against real wind farm performance data during a blind test organized by EWEA in 2013. More than 50 companies have been involved in order to compare methods results.
The document summarizes a study that measured photovoltaic (PV) performance, ambient dust levels, and weather conditions in Doha, Qatar from June to December 2014. Three PV arrays were monitored - one cleaned every week, one every two months, and one every six months. A "cleanness index" showed the arrays cleaned every six months lost on average 0.0042 of performance per day, while the two-month cleaned arrays lost 0.0045 per day. Daily changes in cleanness index were negatively correlated with dust levels and humidity but positively correlated with wind speed. A regression model related cleanness index changes to dust, wind, and humidity and showed dust deposition significantly reduced PV power generation
ASES WREF 2012 Critical Timeframe of importance for PV from a utility perspec...pramodkrishnani
This document discusses critical timeframes for solar PV from a utility perspective, including peak demand periods, minimum load periods with high PV output, and periods of significant ramps in PV generation. It analyzes 9 years of solar resource and load data to evaluate PV impacts. The results show PV can provide 35-60% of its rated capacity during peak hours depending on orientation. Periods of high PV output and low loads occur 15% of hours primarily in spring. Significant ramps in morning and evening PV output may challenge grid balancing at higher penetrations. Sub-hourly data shows PV changes exceeding 50% of capacity can occur a few dozen days per year.
IRJET- Heat Transfer Enhancement of a Solar Flat Plate Collector by using...IRJET Journal
This document discusses heat transfer enhancement of a solar flat plate collector using nanofluids. It summarizes the basic principles of solar radiation and heat transfer, different types of active and passive solar water heating systems, and prior research on combined heat transfer of convection and radiation. The paper then describes modeling and CFD analysis conducted to investigate simultaneous heat transfer by convection and radiation between parallel plates of a solar collector. Results show that efficiency is highest for a 5mm thick collector plate using TiO2 nanofluid, as it allows for maximum absorption of radiation. Thinner plates resulted in higher temperatures, heat fluxes, and overall heat transfer rates.
IRJET- Heat Transfer Enhancement of a Solar Flat Plate Collector by using...
Wireless wetherstation
1. IEEE T a s c i n on Power Delivery, Vol. 8. No. 3, July 1993
rnatos 155 1
SUMMER THERMAL CAPABILITIES OF TRANSMISSION LINES IN NORTHERN
CALIFORNIA BASED ON A COMPREHENSIVE STUDY OF WIND CONDITIONS
Tapani 0. Seppa, Edward Cromer Woodrow F. Whitlatch, Jr
Senior Member, IEEE Member, IEEE Pacific Gas & Electric
The Valley Group Pacific Gas & Electric Meteorology Services
Ridgefield, Connecticut R&D Department San Francisco, California
San Ramon, California
Abstract
intent has been to separate the more predictable temperature and
Prior thermal rating studies have considered wind unpredictable. solar radiation from the less predictable wind. The practical con-
This study indicates that local winds appear well behaved and sequence of this is that many utilities have lowest transmission
statistically prdctable and that they are not independent from the capabilities dunng summer aftemoons, which commonly coincide
ambient temperature and solar insolation. This means that appropri- with the maximum power demand.
ate probabilistic analysis of wind speeds can be used to potentially
increase conductor ampacities. With the advent of line mounted sensors during the past years,
some utilities, PG&E included, have been able to observe that the
The study is based on use of highquality weather measuring limiting conductor temperatures canoften occur at times other than
stations which have been located in the actual environment of summer aftemoons and that highest ambient temperatures appear
transmission lines. The observationsindicate a high probabihty that not to correlate with highest conductor temperatures.
many transmission lines in Northem California could have their
Studying prior data from field tests made it quite evident that
ampacity ratings increased.
the most critical missing data was that of low wind speed condi-
INTR0DUCTI0 N tions in actual transmission line environment. Weather stations,
e.g., NOAA sites, are generally located in open terrain, (e.g.,
Wind is the most important and the least well understood of all the airports). Wind sensors at these locations commonly have thresh-
parameters which govem the thermal capabilities of transmission old speeds which are of the order of 5-8 Wsec Typical airport
lines. I
n- in ambient tempeaht increases the conductor tem- weather records consist of once per hour observation of wind
pemture in approximately m e to one ratio (1). Compared to nighttime speed, wind dwxtion and temperature. Because typical transmis-
with no sun, maximumsolar heating typically increases the tempera- sion conductors have thermal time constants in the order of 10-20
ture of a conductor by about 10 O and reduces its thermal capability
C minutes and because the critical thermal conditions occur at wind
by 6-10% (2), (3). On the other hand, even a minor change in wind speeds of 2 to 4 ft/sec, such data are not very useful for the
speed,e.g., f"2 to 4 Wsec, increases the transmissonline capbdity assessment of conductor ampacities.
by 20-30%(3). If the wind speed increases h m 2 Wsec to 10 Wsec, PG&E has a large service temtory and the weather conditions
ln capabilities increaseabout 50 7%.Such increase is seldom needed.
ie vary widely from one region to another. The company has two
There exist numerous published reports on the thermal balance summer thermal rating zones for its transmission lines, the sole
of conductors. The existing thermal models allow calculation of difference being different ambient temperature assumptions. The
conductor temperature with an accuracy which is more than normal ratings are based on perpendicular wind of 2 ft/sec, full
sufficient for any operational purposes. What is generally lacking solar radiation and an emissivity of 0.5. The ambient temperature
is accurate data of the limiting wind conditions. assumption is 109 O F (43OC) for the interior region and 99 O F (37
"C) for the coastal region. The design ratings are based on 80 "C
Because wind conditions are highly variable, it has been com- normal temperature for ACSR and 75°C for AA conductors.
mon to consider wind as a random variable which is assumed to be
Thedata SupPcaQlgthis repcatare a subset of a 15 s i a k " 1 o g i c a l
independent from temperature and solar radiation. Therefore,
and conductormonitoriDg network The slationswere h d e d by various
many utilities have developed separate summer and winter ratings
grwpsatpG&E.M e k O d o g d siting,-tatim ,maintenamand
and separate day versus night or "ambient adjusted" ratings. The
data collection were performed by the Meteorology services of F " s
Gas C o n h l Department. Measurementsand support f r the two sites o
92 SM 567-8 PWRD A paper recommended and approved discussed below we^. provided by the Gas& Electric Transmission
by the IEEE Transmission and Distribution Committee Department. A very large amount of data was collected during 1990
of the IEEE Power Engineering Society for presenta-
tion at the IEEE/PES 1992 Summer Meeting, Seattle, sumnrx(15si@ eachwith 15,cloOI.ec(xds~ofB30dab@b;
WA, July 12-16, 1992. Manuscript submitted October i.e.,ahnost5 milliondatapoiilk). The various sites show m j r - aoM
11, 1991; made available for printing June 7, 1992. in diurnal windpattens Two sites were selected asexamples to be used
i n t h i s r e p o l t a n e m t h e i n h i o r ~ ~ d a ~ i n t h e d r e g i While
on.
the differences between the two sites are very substantial, the overall
ccnclusim&hcanbebwnindicateimpcxtant similantiesregardmg
the critical wind conditions.
0885-8977fl3W3.00 0 1992 IEEE
Authorized licensed use limited to: College of Engineering. Downloaded on April 12,2010 at 14:22:11 UTC from IEEE Xplore. Restrictions apply.
2. 1552
What makes the thermal rating decisions even more complex,
is that each region has transmission lines of differing daily load
characteristics. Typical feeder load cycles are shown in Figure 1.
Curve 1 is a load in a feeder supplying combination of residential
and commercial loads in the Bay Area. Curve 2 is a similar load
combination in the Central Valley, while curve 3 is a commercial
load in the Bay area. The residential loads have a sharp peak at 6-
7 p.m. local time (5-6 p.m. standard time). The commercial loads
peak earlier and decline before the sunset. Load patterns of major
network transmission lines are naturally much more variable.
-
INSTRUMENTATION 0 2 4 e e m P Y 1 1 2 0 P a 4
HOUR OF M Y (P8V
The instrumentation for PG&Es field weather stations was
specially selected to be both accurate and responsive for low wind Fig. 7. Typical load cycles in PG&E's service area.
speeds. Propeller-type anemometers were used for measurement
of both horizontal and vertical wind speeds. The anemometers had
a threshold wind speed of 1 Msec. Wind direction was measured
using a wind vane with a threshold wind speed of 1 ftlsec. All sites
were equipped with an ambient temperature sensor. Conductor
temperature sensors were also used at 10 sites. The instruments
were mounted at the height of 10-15 meters above ground,i.e., close
to the height of the tranSmissionconductors.Weather i " e n t s were
routinely maintained and calibrated for maximumaccuracy.
The data were collected with on-site data loggers, which re-
corded average weather conditions at 10 minute intervals. Addi-
tionally, lowest one and five minute wind speeds during the 10minute
period were recorded, as well as the standard deviation of the wind
direction fluctuations. The logged data were processed with a statisti- Fig. 2. Wind and temperature observations at Mi- Wuk substation.
cal data sorting program which allowed a broad range of analysis
options.AU~~omareinpaCificstandardtime( o u r d e r t h a n
lh
-- NUMBER OP OBSERVATIONS
local summer time). s2
28
FIELD OBSERVATIONS
24
Mi-Wuk substation test site 20
10-MXN OBSERWTIOtiS
m-Wuk test site is in a fmsted region on the western slopesof the 16
Sierra Nevada mountains located near Mariposa,CA, (elevation @ 12
4OOO fi) .Thetraasmissonline at the site is a 115kvlmeof 3975 kcmil
8
ACSR conductor. According to pG&E's present ratings, the conduc-
tor has an ampacity of 49 1A for 80 O maximumtempemture.
C 4
0 " " "
There are several reasons which make this site interesting for 1 2 3 4 I 6 7 6 ~10111213141J161716192~21222324
thermal r m studies. Because the h e comes f o a hydm plant, it
a rm HOUR (PST)
isgenemllyopaatedateither380-440A oratlessthan1oOA; 50% Fig. 3. Diurnal distribution of condudor temperafures over 60"Cat
of the time dunng 1990 summer the line was operated at 360-450 A. MJ-Wuk substation.
The site has very low summer winds, the median wind speed being is generally longer in the morning, causing a more pronounced
only 2.4 Wsec. This is caused by the location of the site in a valley tempera- maximum in the conductor in the moming than in the
with the anemometers at the level of forest canopy. Furthermore, evening.
because of the h g h altitude, the combination of reduced convec-
tive cooling and increased solar radiation would indicate that t h s In spite of the very low wind speed conditions, conchactor tempem-
site should be one of the thermally critical locations. tures only occasionally ex& 60 "C at Mi-Wuk Figure 3 shows
that the high temperature events occurred during morning and evening
The averages of all 1990 summer observations of ambient and hours when lower wind speeds prevail. There were a total of 19 such
conductor temperatures as well as horizontal and vertical winds events, the longest of whch was 130 minutes and the shortest 20
are shown in Figure 2. Note that the horizontal wind dies down minutes. The total number of such 10 minute observations was 114.
every moming and every evening during periods of wind flow The conductor temperature never reached 60 *C dunng the aftemoon.
reversal. Although the ambient temperature in the moming is
generally lower than the evening temperature, the quiescent period The reason for these observations can be found in the wind
Authorized licensed use limited to: College of Engineering. Downloaded on April 12,2010 at 14:22:11 UTC from IEEE Xplore. Restrictions apply.
3. 1553
statistics.Figure 4 shows the dislribution of measuledwind speed for
all days dunng the summer. It indicates that daytime winds exceed
2 ftJsec 95 % of the time. On the other hand the nighttime winds
only average about 2 Wsec. There is a 5%probability (lowest 5%of
observations) that the wind is m i n t h e "n and in the evening.
i g
N t that the average vertical speed, as shownon Figure 2, is typically
oe
of t e order of 2 Wsec during daytime but does n t exist at night.
h o
Another impatant observation at Mi-Wuk site was the variation of
conductor temperatme which is caused by local wind variations. The
two line temperature sensors at Mi-Wukare approximately 1500 ft.
from each other. Statistically the two se~lsors seem equivalent as 1 2 a 4 6 a 7 I) o 1 0 n o ~ ~ m 1 ~ w m 1 0 2 o a ~ z s ~ 4
HOUR OF M Y (PST)
indicated by the quantile distribution shown in Table I1 below, but
instantaneous tempera-s can be significantly different. Fig- 4. Diurnal distribution of wind at Mi-Wuk substation. WOwind
means the lowest 5% of observations.
Table I. Temperature quantiles recorded at Mi-Wuk
Quantile Sensor 1 Sensor 2
50 % 38°C 37°C
90 % 52°C 51°C
95% 5°
4C 55°C
99 % 59°C 59°C
We sorted out all events during which either one of the conductor
temperature sensors indicated a temperature of over 60 OC, and
compared the two values. The total number of such 10 minute
recordings was 140. An example of this series of readings is shown i z 1 4 I c i 8 9 io ii ia 13 14 IS 16 ii S
I
in Figure 5. OBSERVATION NUMBER
Fig. 5. Series of observations at Mi- Wuk , 8-7-90 evening.
The hstogram in Figure 6 shows the temperature difference
N U E R OF oB(KRmTI00
UEE
between the two sensors during the highest conductor tempera- 46, I I I I I I
tures. This indicates that local variation of wind causes significant 40
temperature differences. Because the average temperature rise
S6
over the ambient for the 140 measurements was only 3OoC,the
a0
observed 3.5 O mean difference between the two sensors is quite
C
significant (over 10 % of temperature rise over ambient). More- 26
over, as shown by Figure 6, there were six instances when the 20
temperahwe difference was over 10 O (i.e., of the order of 30%of
C
16
the temperature r s )
ie.
10
Conductor temperature depends on wind speed and wind direction. 6
Short term variations of wind speed and wind directionare cawed by 0
0 - 1 2 - 8 4 - 6 6 - 7 0 - 0 10-11
the turbulence of t e wind and therefore Iwnuledge of turbulencewith
h TEMP WFERENCES W DE0 C
a time scale of 1-10 minutes is very important. Figure 7 shows the
Fig. 6. Conductor temperature difference of two sensors at Mi-Wuk
standard deviation of wind direction during high and low ambient substation, when at least one sensor indicated over 60'C.
temperatures at Mi-Wuk. Note that the direction of low speed winds
WINO ST0 DEV I OEQREES
N
is highly variable,when ambient temperatwe is hgh.
The observations depict facts which are commonly acknowl-
edged by micrometeorologists:
*Relativeturbulence depends on Wind speed and temperature. Low
speedwmds dunnghighdaythetemhaes ammorevariablethan
higher wind speeds.
*Whenthe ambient temperature is high, i.e., typically during after-
noons, winds have high directional variability.Rolonged low speed
daytime winds parallel to the conductor are extremely improbable,
1 2 3 4 6 a
especially as daytime verticai winds are also sipficant. WIND SPEED FllSEC
B Comparing the lifr~-dimension
Y Ofthe t c to the average
" e Fig.7. Standard deviation of wind direction fluctuations at Mi- Wuk
substation.
_- - -~ .
Authorized licensed use limited to: College of Engineering. Downloaded on April 12,2010 at 14:22:11 UTC from IEEE Xplore. Restrictions apply.
4. 1554
wind speed,the average distance dimension of the turbulence can be
i n f e d . Typical turbulence envelope of wind gusts at Mi-Wuk is of
the order of several hundred feet and is larger during h t pen& than
o
during cold periods. This important conclusion will be discussed
1
later in detail under the “General Observations“ section.
‘ 1 2 1 e o n l y r a t i n g ~ c uforthe M-wuklinemdesignsagsand
s
cleamwx ‘Ihe sagsdependon theaverage tempatme of the conductor.
m1
.
Figure8 ~ t f r z p r o b a h l l t t y
ofthe~reoordedavadgesofthetwo
measured conductor tempemtures at Mi-Wuk. These are the lughest I I I I I I
tempemtmsobeetvedwhentheumductor currentwasbetween370and I I I I
450k (l%r5704oftheob~m&aB thelinecunentwas4COklO A). Nde
’ 0.01 .
60 61 62 63 64 65 66 67
T
68 69
tbat the probability fr the extreme teqxmtureohmvations a t i site
o t hs DEG C
appearsapppximatelylogan~c,dextzphan~lndicatethat
Fig. 8. Probability of highest observed average temperatures at Mi-
tbpdabhtyoftheavemgetemp”exceechng 8ooc was O.ooOOl% Wuk substation, summer 7990. AN currents over 370 A.
for the e 1 0 A current level.
FTIOEC AUPBXlDOR DEPC
The cooductaratMi-Wukhasanomoalratingof491A f o r a m a x i “
temperature of 8OoC.From the collected data we can d e r that if the
conductor current were 491 A, the Mi-Wuk site would exceed this
temperaturelest€xm 0.001%oftimedunngthesurmner.’Ihtsdd~
a probability of one occmnce of a l@miuutepenod of 80°C conductor
temperatmeduring tensummas, ifthelineloadwereaccmtant491A
There is an interesting theoretical explanation for the approxi-
mate logarithmic shape of the peak temperature distributions
found at Mi-Wuk. Peak temperatures are clearly related to the
length of near calm wind periods in the morning and evening. i s 6 7 m n m m n o n 2 a
When wind speed lowers, the conductor warms in a manner HOUR Of M Y (BT)
dictated by the well known exponential time constant relationship. Fig. 9. Average daily conditions at Kifer substation, summer 7990.
Thus, if the length of near calm periods is randomly distributed,
probability distribution of peak temperatures would assume a NUUEER of OBSERUTIONS
1
10 -,
logarithmic shape shown in Figure 8. 0- IamWucrorrTEUP
Kifer-Trimble substation test sites I)--
7 -.
These test sites consists of two weather monifofing locations which
areonly 2rmlesapa1t,aboutl5rmlesfiromthePacificOcean, nearSan
Jose. The sites are equippedwith similar instrumentation as Mi-Wuk.
The h e between the substationsis 115 kV, 715 kcmil AA. There are
two conductor sensorsat each end of the l n .Summer season wind
ie
flow is typically a sea breeze that develops in response to mesoscale
surface pressure gradients. The gradients strengthen when the tem- I))! , ! , : , ; , :
01 09 os 07 om n I m n m m 2s
perature differentialbetween the cool Pacific Oceanwaters and hot HOUR Of M Y (P8T)
interior valleys is at maximum dunng the afternoon. Fig. 70. Diumd distribution of highest conductor temperatures at Kifer
substation.
ThelaadvariatonatKiferissi~fi~ydi~6omMi-Wukand FTISEC
theloadpeakstpcally chnmgtheday. Because of s & l & ” Variations
~ t h e ~ c ~ c t e ~ v ~ ~ ~ a ~
1 i ~ d a y o f
obsematim i s n x n e c a n p h d t b m a t t h e M i - W u k s h e . Aon
~ 1
of all observationsat Kifex is shownin Figure 9. 1
The daily wind speed variation at Kifer is significantly different
from Mi-Wuk. Even during the night, the average summer wind
speed exceeds 5 ft/sec. The wind speed increases rapidly during
the day and peaks m late afternoon. The load at %fer h e typically
peaks in the early afternoon, when the wind speed is already quite
high. Statistically, this means that at %fer the likellhood of a I s I 7 m n U 16 n a P( 9s
combination of h g h load and low wind conditions is unlikely. As HOUR Of M Y ( 1
-)
shown by figure 9, the load has typically declined significantly before Fig. 7 7 . Average and the lowest 5% quantile of wind speed
the onset of the quiescent wind period at night. The most likely observations at Kifer substation.
Authorized licensed use limited to: College of Engineering. Downloaded on April 12,2010 at 14:22:11 UTC from IEEE Xplore. Restrictions apply.
5. ~
1555
STD DEV IN DEBREES
thermally critical time period is late morning. This is indicated by
the highest recorded conductor temperatures shown in Figure 10.
The record of wind conditions shows clearly the prevalence of
high summer wind speeds at this site. As shown by Figure 11, even
the 5 % wind speed quantile exceeds 4 ffe during the aftemoon
tsc
and evening, until approximately 8 p.m. local time.
The standard deviation of the wind direction fluctuations show a
pattem of turbulence which decreaseswith wind speed and increases
with temperatwe. This is shown in Figure 12, in which the observa-
tions are dlvided into groups based on ambient temperature. 1 3 6 7 0 11 ls M n
WIND SPEED FTlSEC
The highest C o n d u c ~
tempaatureS quite law, which makas the Fig. 72. Standard deviation of mean wind direction at Kifer
c o m ~ s o less meaningfulthan that at m-w& %
n fe8sonis substation for high and low ambient temperatures.
obv&ly the high wind speeds at the Kifer site. " were only 37
e
NUMBER OP OISERWTIONS
instanceswhenthelinetemperahm:exceeded5o"c,and~only
18-25 "C temperam rise O V the ambient. The Current chning t h m
~
~was~s00and570ATheAAcoraductoris1atedat 699
A for a 75°C conductor temgerature. It is obvious that at this site the
conductaropemtesmuchcoolerthanassumedbycoastaltatings,and its
ampacity couldmost likebe increased substantiallY.
c o " s m & b t h e m ~ m a t m H -
Trimble. A s w t e d e a r h ~ , t k ~ ~ ~ o v e x l h e ~ m t k q u i t e l u w
atKikr. ~ 1 3 s t K l w s t f i e t e m p a d t u r e d i f f i x e n c e ~ s a w x s 1 a n d
~wfien~~~bysersor1wasatleast5oOc. Agammcan
- 0 1 2 3 4
notice that in spite of significantlydlfferent overall wind conditions SENSOR TEHPEPKWRE DIPPEPENCES (DE43 C)
c"!dtoMi-w*themediante~vmon~them
~ a m o u n t to 2-3 "c,when tbe temperature k O the orderof 20-
S f Fig. 73. Observed tem rature variation between sensors at Kifer
3 "C. The 10 %
0 is consistentwith the Mi-Wulc obmvatiom. substation when c o n g t o r temperature was over 50 "C.
WIND OPEEO FTISEC TEMP m DEQ c
Trimble site is 2 miles distant from Kifer. As shown by Figure
14, the two sites are statistically equivalent. The wind speeds and
conductor temperatures are statistically equivalent, within obser-
vation errors. Standard deviation of the wind direction fluctuations
at Trimble is also similar to that of m e r , shown in Figure 12. Thus
we can make the i -
mt observation that the two sites, separated
by a distance equal to that of two deadends of a tsansmission line,
show statisticallv equivalent cooling conditions.
Thu does not m a that the simultanm c o
en o@ conditions are the
same. While the ambienttempenlturesarethe same within the margin
i a 6 7 s n l s i s n r o n z s
of observation error, the instantaneouswmd conditions are not equal. HOUR OF DAY ( 1
- )
By sorting out the differencebetween simultaneously observed wind Fig. 74. Diurnal variation of wind speed and conductor temperature
speeds at the two sites, we can derive Figure 15. rise over ambient at Kifer and lrimble substations.
DIFFERENCE IN FTISEC
0.8 I
Note that the observations of Figure 15 indicate that: I
I
KIFER - TRIYBLE
If the wind speed at one of the sites is low (0-4 Wsec),the wind I
at the other site is likely to be about 0.5 ftfsec higher. 0.2
If the wind speed at one site is high, it is likely to be 0.5 ftfsec 0
lower at the other site. -0.2
Thus, the comparison of the wind observations at the two sites -0.4
indicates that low wind speeds are improbable to occur simulta-
neously at two sites two miles apart. As stated before, the same.
observations could be made for shorter distances based on the -0.8
4 7 s 8 -,I2
N E WIND SPEED IN FTlSEC
observed temperature variation between two temperature sensors
Fig. 75. Difference in wind speed at lrimble compared to Kifer, and
in adjacent spans. at Kifer compared to lrimble.
Authorized licensed use limited to: College of Engineering. Downloaded on April 12,2010 at 14:22:11 UTC from IEEE Xplore. Restrictions apply.
6. 1556
GENERAL OBSERVATIONS the bounds of safe operations described by the static rating guide-
lines. Wind studies can only indicate probability limits. This
Within PG&E’s service area knowledge can be used by a utility to gain ampacity increases
where feasible, keeping in mind the limitations imposed by utility
’Ihefocusof thisreportis theexamination of plumnary data analyses rating standards, practices and applicable codes and indicating
fmm two of the fifteen- sites. Furthastudies&waywill where instrumentation-intensive rating approaches (4) could be
detail spatial and temporal horizontal wind profiles at all sites. The used profitably.
me~l~calprogramwasspecifidy~gnedto~conditions
5. There are many interesting qualitative observations which cast
representative of the monitored conductors. Data presented here and
some of the prior practices in doubt. For example, it has been
~ ~ y ~ o f ~ ~ ~ ~ o w u s ~ ~ t h e ~ ~ ~ g ~ a -
generally considered that old, weathered conductors with h g h
tm reg-
i .
the Summertrmeconditions:
emissivity/absorptivityare more prone to h g h temperatures. But
1 . C h a h o t s u ” e r d a y d P e e d i f f e r e n t t ~ ~ e x i sattyplcal sts this assumption is valid only if the combined cooling conditions
t ie
inthePG&Eservicetefri~. are worst during daytime. On the other hand, high emissivity will
increase radiative cooling, which is of significance for nighttime
*Windsincreaseduring daytime as t e surface tempemturerises and conditions. The combined cooling conditions are, in the observed
h
decreaseduring the evening hours after t e ambient temperature has cases, worse during night than day. Thus new, shiny conductors
h
peakedIumanysectiolsof€G&Esservicearea,thaeisahighpmbab&y could have a hgher thermal risk than old, weathered conductors.
thataftemoonwimlswill sipficantly exceed the 2 ft/secused in FG&E‘s
normal ratings. Indaytimehouqwinddirectioavariance ishighdunng 6. The observations show that, because of the generally conserva-
periods of low wind speeds, indicating that prolonsed low speed winds tive rating assumptions of PG& E, there is a very high probability
parallel to t econductorare very unlikely.
h that the studied transmission lines could be rated hgher. In case
of Kifer -Trimble line, the probability amounts to certainty. In case
Nighttime winds are generally lower thandaythe winds. Average of Mi-Wuk, there appears to be a possibility of uprating the line 15-
dspeedsvarylittle~hourtohwratmght. winddirectionvariance 20% for 99.9%of time and 3040% higher 99%of time. Note that
is low during nighttime low wind periods,meaning that udavorable the primary reason is that the 2 #sec minimum wind speed used in
parallelwindconditiommayexistatmght. PG&Es ratings has a very low probability of occurring during
daytime (5). Note also that the results are highly sensitive to
-During themominghoursthewind flowregime~itionsbetween relatively minor changes in rating assumptions (6).
mghthraeddaytime~vicevemintbeveninghoursThel-.n;cles2
average wind speeds of the day are measured during these quiescent For conductors which are steadily loaded, the highest conductor
p e r i o d s . ~ t i m e s o f t h e ~ ~ t p e n o d s m a y v a r y w i t h ~ l t~ c a p e ” s appear generally to coincide with these quiescent periods
em l
CondifioIlSin each region. during the morning and the evening. For conductors which are loaded
with the typical dshbution feeder loads of PG&E, it appears unlikely
2. V r i a wind speeds peak during t e daytime. Combined with the that the peak temperatures will occur during the time of peak load.
etcl h
autoccnvectiveflwge”kdbythebot&torthisindicates hatcalm
C a n d i t i o n s a r e p O b a M y b r i e f a n d ~ ~ y ~ ~ ~ c h m n g d a y t i m e .The authors plan to continue the evaluation of the vast amount
of collected information with the intent of a closer study of
3. Typical daytime turbulence pattern have a wind gust dimen- coincidence between load and cooling patterns and to identify
sion along-wind of several hundred feet. Gusts of those dimen- where future wind monitoring sites are needed.
sions will have significant cooling effects on transmission conduc-
tors. Although it is possible to find a location where low wind Applicability to other regions
speed persists for long enough to cause a h g h temperature at one
point of the conductor, simultaneous calm conditions at a location The observations described above apply to two sets of weather
only a short distance away m highly unlikely. a s means that the conditions in the PG&E service area. Because the observed wind
average temperature of any span is likely to vary much less than behaviorexhibits gemally recoglllzedmicrometeorological facts, the
that of any single point of conductor. general nature of the observations is applicable to other locations.
3. Thermal line monitors used at PG&Es lines have proven Observed diurnal wind speed pattems have a statistical similar-
reasonably reliable and accurate. The main problem in their appli- ity regardless of environmental regime differences. For example,
cation is the wide statistical variation of temperature along even a diurnal wind patterns measured in other countries (7),(8) are
short section of transmission line. The sags of the line, which are s M a r to the two discussed in this paper. The similar observations
the main concerns, depend on the average conditions of a ruling are true regardmg the statistical dependence of turbulence of wmd
span section (between two deadends). As shown by the statisticsat as a function of temperature,variation of wind speed as function of
Mi-Wuk site, use of a single sensor set at 60 O warning level
C
height and observations of tempemture variation along the conductor.
would have been substantially in error- both low and high- in a high
percentage of cases. CONCLUSIONS
4. The significance of the wlnd studies is that they can be used
to identify regions where weather and load conditions are substan- 1.Wind measurements whch are made with highly sensitive instru-
tially non-coincident, indicating times when there is a high prob- ments in actual t ” i s i o n line environment indicate that the studied
ability that lines are under-utilized o when the line loads approach
r transmissionlines are m e consetvatively. They also i d c t that wind
td niae
Authorized licensed use limited to: College of Engineering. Downloaded on April 12,2010 at 14:22:11 UTC from IEEE Xplore. Restrictions apply.
7. 1557
speed has a correlation w t ambient temperature and time of day. The
ih (9) J.F. Hall, A.K. Deb, J. Savoullis, "Wind Tunnel Sudies of Trans-
Illeasurementsindicatethatdaytimesummer a f l e m o o n c o o b d t i m mission Line Conductor Temperatures", IEEE-PES T&D Confer-
in PG&Es servicea m were generally better thannighttime or early ence,Anaheim 1986 (86 T&D 500-3)
momingconditim.
(10) WJ. Steeley,A.K. Deb, T.P. Mauldin, "Dynarmc Thermal Rating
of TianmissiOnLines Independent of Critical S a p Analysis"JASTED
Conference, Phoenix 1988.
3.The c r i t i c a l ~ d t i o n s w h i c h r e s v l t i nthehgh&cm&b
temperaturesappear to be related to the pmbability of prolonged calm AUTHORS
periods. l%isis of significant importance for the assessmentof benefits of
probabilistic line rating. We conclude that it seems likely that the
ppobabtlity d l s t r l ~ o n o f h i ~ c o n d u c t te"islogarithmic,
or Tapani 0. Seppa (M '72-SM75) was born in Lapua, Finland on
based on t eg e n d observationthat the t m length and physical extent
h ie December 29,1938. He received his Diploma Engineering (MSEE)
of the calm periods is m s likely to be xandomly distributed.
ot degree from Helsinki Technical University in 1962.
4.Vertical wind @adds a significantamount to the coohng of t e h From 1960to 1969he was a research engineer at I a Voima in
mm
conducbdurlngsu"erdaytime.omithingulisfibctormaybeoneofthe Fdand. He held research and engineering management positions at
mmns why conductor ampacity m d l based on weather obmations Reynolds Metals in 1969-1970 and at Bumdy Corporation in 1971-
oes
~ n ~ y o v e r e s t i m a t e t h e c o n d u c t o r t e ~ ~ ~ d a y t r m e .1975. In 1975-1981 he held several development and marketing
management positions at Lapp Insulator. He was VP-Strategic Man-
5. F d y , the ds t u b s d a t e that the wind cooling conditions of agement at Clevepak Corp. in 1982-1985 and VP-Marketing of
the conductor are not likely to be deterministicallyWctable, but appear Nitech, Inc. in 1985-1990. In 1990he formed The Valley Group, a
to be statistically well predictable. consultingcompany specialivng in advanced technologiesfor utility
T&D systems. He has been active m a many IEEE task fixes and has
REFERENCES authored a large number of papers for IEEE, CIGRE and other
OrgaIliZatiOnS.
(1) Glenn A. Davidson, "Considerations in the Application of
Advanced Conductor Rating Concepts, " Proceedings o f Edward G. Cromer (M '89) has 28 years of utility experience in
Seminars on Real Time Ratings o Overhead Conductors,
f engineeringand operating positions with Montana Power and Pacific
Atlanta, GA., May 21,1986. Gas & Electric. He is presently Director,Transmission and Distribu-
tion Construction and Maintenance of Nevada Power. He received his
(2) W.Z. Black, R.A. Bush, "Dynamp- a Real-Time Ampacity
BSEE from Montana State University in 1963. He is currently a
Program for Overhead Conductors, "Proceedings of Seminars
Program Manager in PG&Es Research and Development Depart-
on Real Time Ratings of Overhead Conductors, Atlanta, GA.,
ment. He is active in IEEE and EEI.
May 21, 1986.
In EEI, he is the chairman of the T&D Committee'sEMF Workmg
(3) W.Z. Black, R.A. Bush, "Conductor Temperature Research,"
Group, a member of EEI's EMF Technical Task Force, and an EEI
EL
EPRI Final Report for Project 2546-1, 5707, May 1983.
repsentative to IEEE SCC28 Non-ionizing rahation. In IEEE, he is
(4)D A. Douglas, "Maximum conductor temperature-Effects a member of the ESMOL Subcommitteeand many of the ESMOL
on cost and thermal rating for new and old lines," Proceedings W o r m Groupsand Task Forces, and ESMOL liaison with EPRI for
of Seminars on Real Time Ratings of Overhead Conductors, M&O electrical testing. He is Vicechamam of ESMO-93.
Atlanta, GA., May 21,1986.
(5) IEEE Standard for Calculation of Bare Overhead Conductor Woodrow F. Whitlatch, Jr. was born in Tarentum, PA on January
Temperature and Ampacity for Steady-State Conditions. IEEE/
8,1949. He received his BA h m Belmont Abbey College in 1970,
PES, New York, 1986. (IEEE/ANSI Standard 738-1986.)
his BS i Meteorology from San Jose State in 1980 and his MS in
n
(6) Tapani 0. Seppa, Woodrow F. Whitlatch, "Wind studies show meteorology from San Jose State in 1990.
a low daytime thermal risk for transmission conductors." Trans-
He has been employed as a meteorologist by Pacific Gas and
mission & Distribution, Vol. 44, No.5, May 1992.
Electric since 1980,where his main duties include o p t i o n a l weather
(7) Seppo Huovila, "On Structure ofWind Speed in Finland,"
the forecasting, field project design and management, climatological
Finnish Meteorological Ofice Contributions,69, Helsinki 1967. analysis and air pollution modelling. He is a member of American
Meteorological Societyand the Air And Waste Management Associa-
(8) G.M.L.M. van Der Wid" "A new probabilistic a p o a c h to thermal tion.
rating overhead line conductors in the Netherlands", IEE con$ on
overhead line design and construction, London Nov. 1988.
Authorized licensed use limited to: College of Engineering. Downloaded on April 12,2010 at 14:22:11 UTC from IEEE Xplore. Restrictions apply.
8. 1558
Discussion V.T. MORGAN (CSIRO Division of Applied Physics,
Sydney, Australia): The authors have presented an
interesting paper describing some of their results
S. D. Foss (Underground Systems, Inc., Armonk, NY): The authors are
to be commended for adding to the database of existing weather and from field measurements of wind characteristics, air
temperature and conductor temperature. Some further
overhead conductor temperature data by adding data from Northern
details about the instrumentation would be
California where the thermal capacity of overhead transmission lines
appreciated. What type of sensor is used for
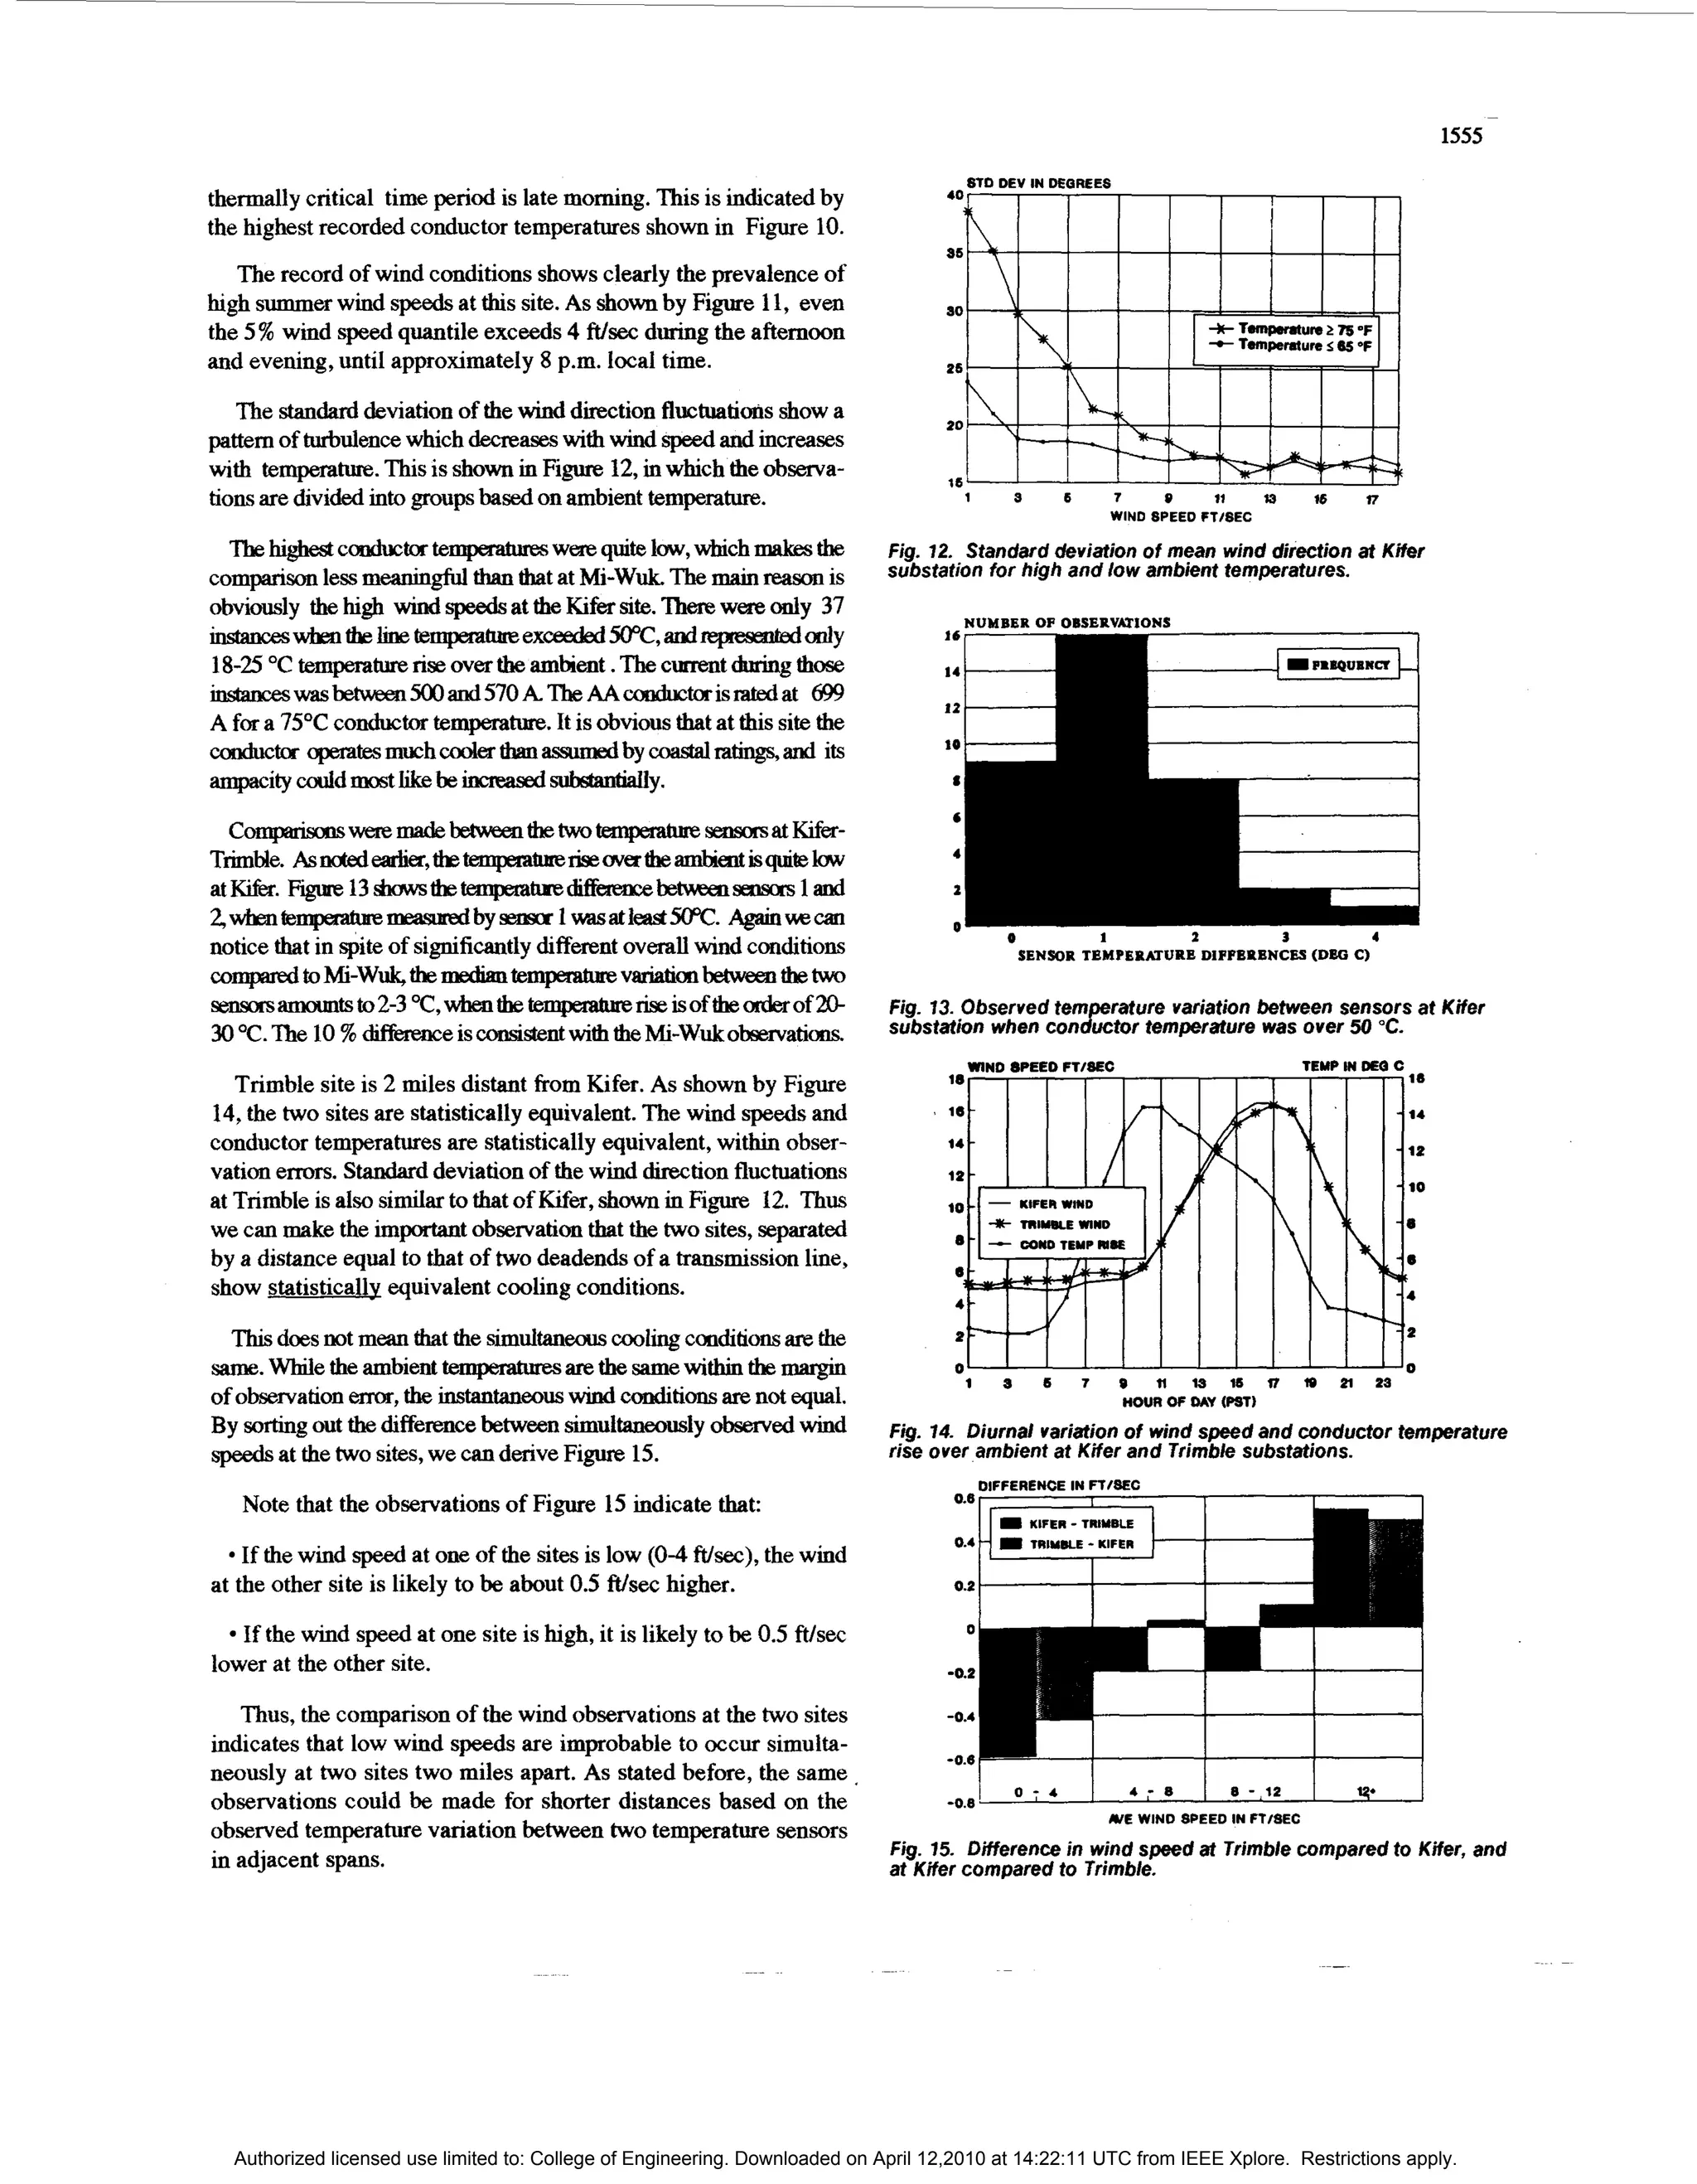
was evaluated. Unfortunately, the author’s fail to cite prior weather
measuring conductor temperature, and is the surface
and dynamic line rating research which also reflects the cyclic time of
temperature measured?. What was the sampling rate for
day dependence of overhead line ratings in other parts of the world. the wind and temperature sensors?
The time of day cyclic nature of dynamic line ratings has been
investigated extensively by the Niagara Mohawk Power Corporation in Variable line current tends to confuse the effects of
recent y e a r s l ~ ~ . ~ . the atmospheric variables on the diurnal and
The author’s over emphasize the significance of vertical wind speeds statistical distributions of conductor temperature.
derived by natural convection forces perpetuating the flow of vertical We studied the heating of a flat triangular
air. Barrett cites that these forces perpetuate vertical wind speeds in
configuration of a 5W3.5 mm alumium plus 713.5 mm
the range of 0.82 ft per second. Natural convection heat transfer steel ACSR conductor carrying a constant 50 Hz current
correlations presently account for vertical wind flow. The author’s of 1500 A over a 32 month period [] l. Some of the
conclusion that vertical wind speed adds a significant amount to the statistical results are given in C2.31. We also found
cooling conditions of conductors during hot summer days is grossly that the wind speed decreases during the night. We
overstated. During hot summer days, by the authors own admission,
did not find calms at about 0 0 and 1900. but found
70
horizontal wind speeds during the mid day average 4.5 f p s as opposed that the highest probability of low wind speed occurs
to an average mid day vertical wind speed of 2 fps. The vectorial sum between 0 0 and 0 0 . The maximum wind speeds
40 70
of the two orthogonal wind directions is an effective wind speed of 4.9 occurred at about 1400. in agreement with the results
fps not surprisingly different from the horizontal wind speed. A factor of other studies [4-61.
contributing to the overstatement of the effect of vertical wind is
horizontal cup anemometer stall under low wind speed conditions. We have not observed an increase of the standard
The authors circumvent the issue of critical span by considering deviation of the wind direction with increasing
average line temperature, Figure 9, rather than average span tempera- ambient temperature at constant wind speed.
tures. The issue of critical span remains a dominant issue to dynamic Turbulence is usually expressed in terms of the
line rating. To date, no scientific data linking average conductor line intensity and the scale. The intensity Tu i s equal to
temperatures with critical span conductor sag has been demonstrated. the standard deviation of the wind speed divided by
The author’s make the general observation that the use of a single the mean wind speed. We have observed that TU
sensor set at a 60°C warning level would have been substantially in increases as the wind speed decreases.
error, both low and high, in a high percentage of cases. We reiterate
our position in our closing statement with regard to single point Our results do not confirm that the probability of the
measurement made earlier ’. highest temperatures follows a logarithmic law. It
“We circumvented the problem of single point measurement in regard would be better to examine the probability of the
to measuring average span temperature by time smoothing the single highest temperature rises, which are almost
point measurements over a time period sufficient to capture the independent of ambient temperature. We have found
variability in weather conditions experienced by a span. _ _ .The that the probability curve of temperature rise
dynamic and forecast rating algorithm further time smooth the temper- flattens out at the highest temperature rises, so that
ature data for a period of one hour. Time smoothing enables one to i t i s inadvisable to extrapolate to even higher
acquire a distributive sample of conductor temperatures resulting from temperature rises (or temperatures).
a variety of local weather conditions exposed to the span. Time
smoothing makes it possible to obtain average span weather and The use of mean curves for the diurnal variation of
conductor temperature conditions from a single point measurement.” wind speed and conductor temperature can be very
misleading. We prefer t plot frequency contours.
o
Single point conductor temperature measurements combined with Could the authors please indicate where i t is
arithmetic time averaging of acquired data has been demonstrated as demonstrated that “vertical wind speeds add a
an effective means of determining average span temperature. If the significant amount t the cooling of the conductor
o
spot location of the conductor temperature monitor is at a critical during summer daytime”?
span site, a powerful real-time monitoring technique develops for
rating a power line. References
References
Foss, S. D., H. S. Lin, R. A. Maraio and H. Schrayshuen, “Effect c11 Morgan, V.T., “Instrumentation and data handling
on a model overhead power transmission line,
of Variability in Weather Conditions on Conductor Temperature Proc. Conf. on Measurement, Instrumentation and
and the Dynamic Rating of Transmission Lines,” IEEE Trans. Digital Technology, Melbourne, Australia, October
PWRD, Vol. 3, No. 4, October 1988, pp. 1832-41. 3 - November 2, 1984 (Institution of Engineers.
1
Foss, S. D. and R. A. Maraio, “Dynamic Line Rating in the Australia), pp 14-18.
Operating Environment,” ZEEE Trans. PWRD, Vol. 5, No. 2, April
1990, pp. 1095-1105.
Foss, S. D. and R. A. Maraio, “Evaluation of an Overhead Line
PI Morgan. V.T., Thermal Behaviour of Electrical
Conductors, Research Studies Press (John Wiley),
Forecast Rating Algorithm,” ZEEE Trans. PWRD, Vol. 7 , No. 3, 1991. pp 5 7 5 1
6-9.
July 1992, pp. 1618-27.
Chisholm, W. A. and J. S. Barrett, “ilrnpacity Studies on 4YC c 1 Morgan, V.T., “Statistical Distribution of the
3
Rated Transmission Line,” ZEEE Tra,i.c. I’WRD. Vol. 4, No. 2, Temperature Rise of an Overhead Line Conductor
April 1989, pp. 1476-85. Carrying Constant Current”, Electric Power
Systems Research (in press).
R. Bush (Georgia Power Company, Forest Park. (3.4): How do you 1 1 Agbaka. A.C., “Experimental Investigation of the
4
incorporate vertical wind speed to obtain a n effective perpendicular Possible Correlation of Wind Speed on
wind. Some account should be made either in the data collection Insolation”. Energy Conversion Management. Vol.
mode or in software in the temperature calculation model to account 27, pp 45-48,1 8 .
97
for vertical wind speed. Also, arc thc effects oi the vertical wind
speeds significant? c51 Chen. A.A., Daniel, A.R.. Daniel, S.T. and Gray.
Authorized licensed use limited to: College of Engineering. Downloaded on April 12,2010 at 14:22:11 UTC from IEEE Xplore. Restrictions apply.
9. 1559
C.R.. “Wind Power in Jamaica”, Solar Energy, Vol. Statistically, the lapse rate is a function of ambient temperature and
44, pp 355-365. 1990. insolation. See, e.g. (1). Because of this, there is a strong correlation
Skidmore, E . L . and Tatarko, J . , “Stochastic between daytime temperature and Tu.
Simulation for Erosion Modelling:, ASAE. Vol. Dr. Morgan’sobservation that the probability curve tends to flatten
33. pp 1893-1899, 1990. out for temperature is not unreasonable, especially in the open
terrain conditions corresponding to Dr. Morgan’s test span. On the
Manuscript received J u l y 31, 1992. other hand, the authors’ observations relate to statistics on absolute
conductor temperatures. Because the observed wind speeds have a
positive correlation with temperatures, the probability curves ofabso-
D. Douglass (Power Technologies, Inc., Schenectady, NY): I would like lute temperatures will not flatten out.
to compliment the authors upon writing a fine paper that is clearly
written and of considerable worth to the power industry. I have the Regarding the effect of the vcrtical wind speed, the authors rercr to
following comments and questions: the conmcnts to Dr. Foss andMr. Bush below. The authorswould like
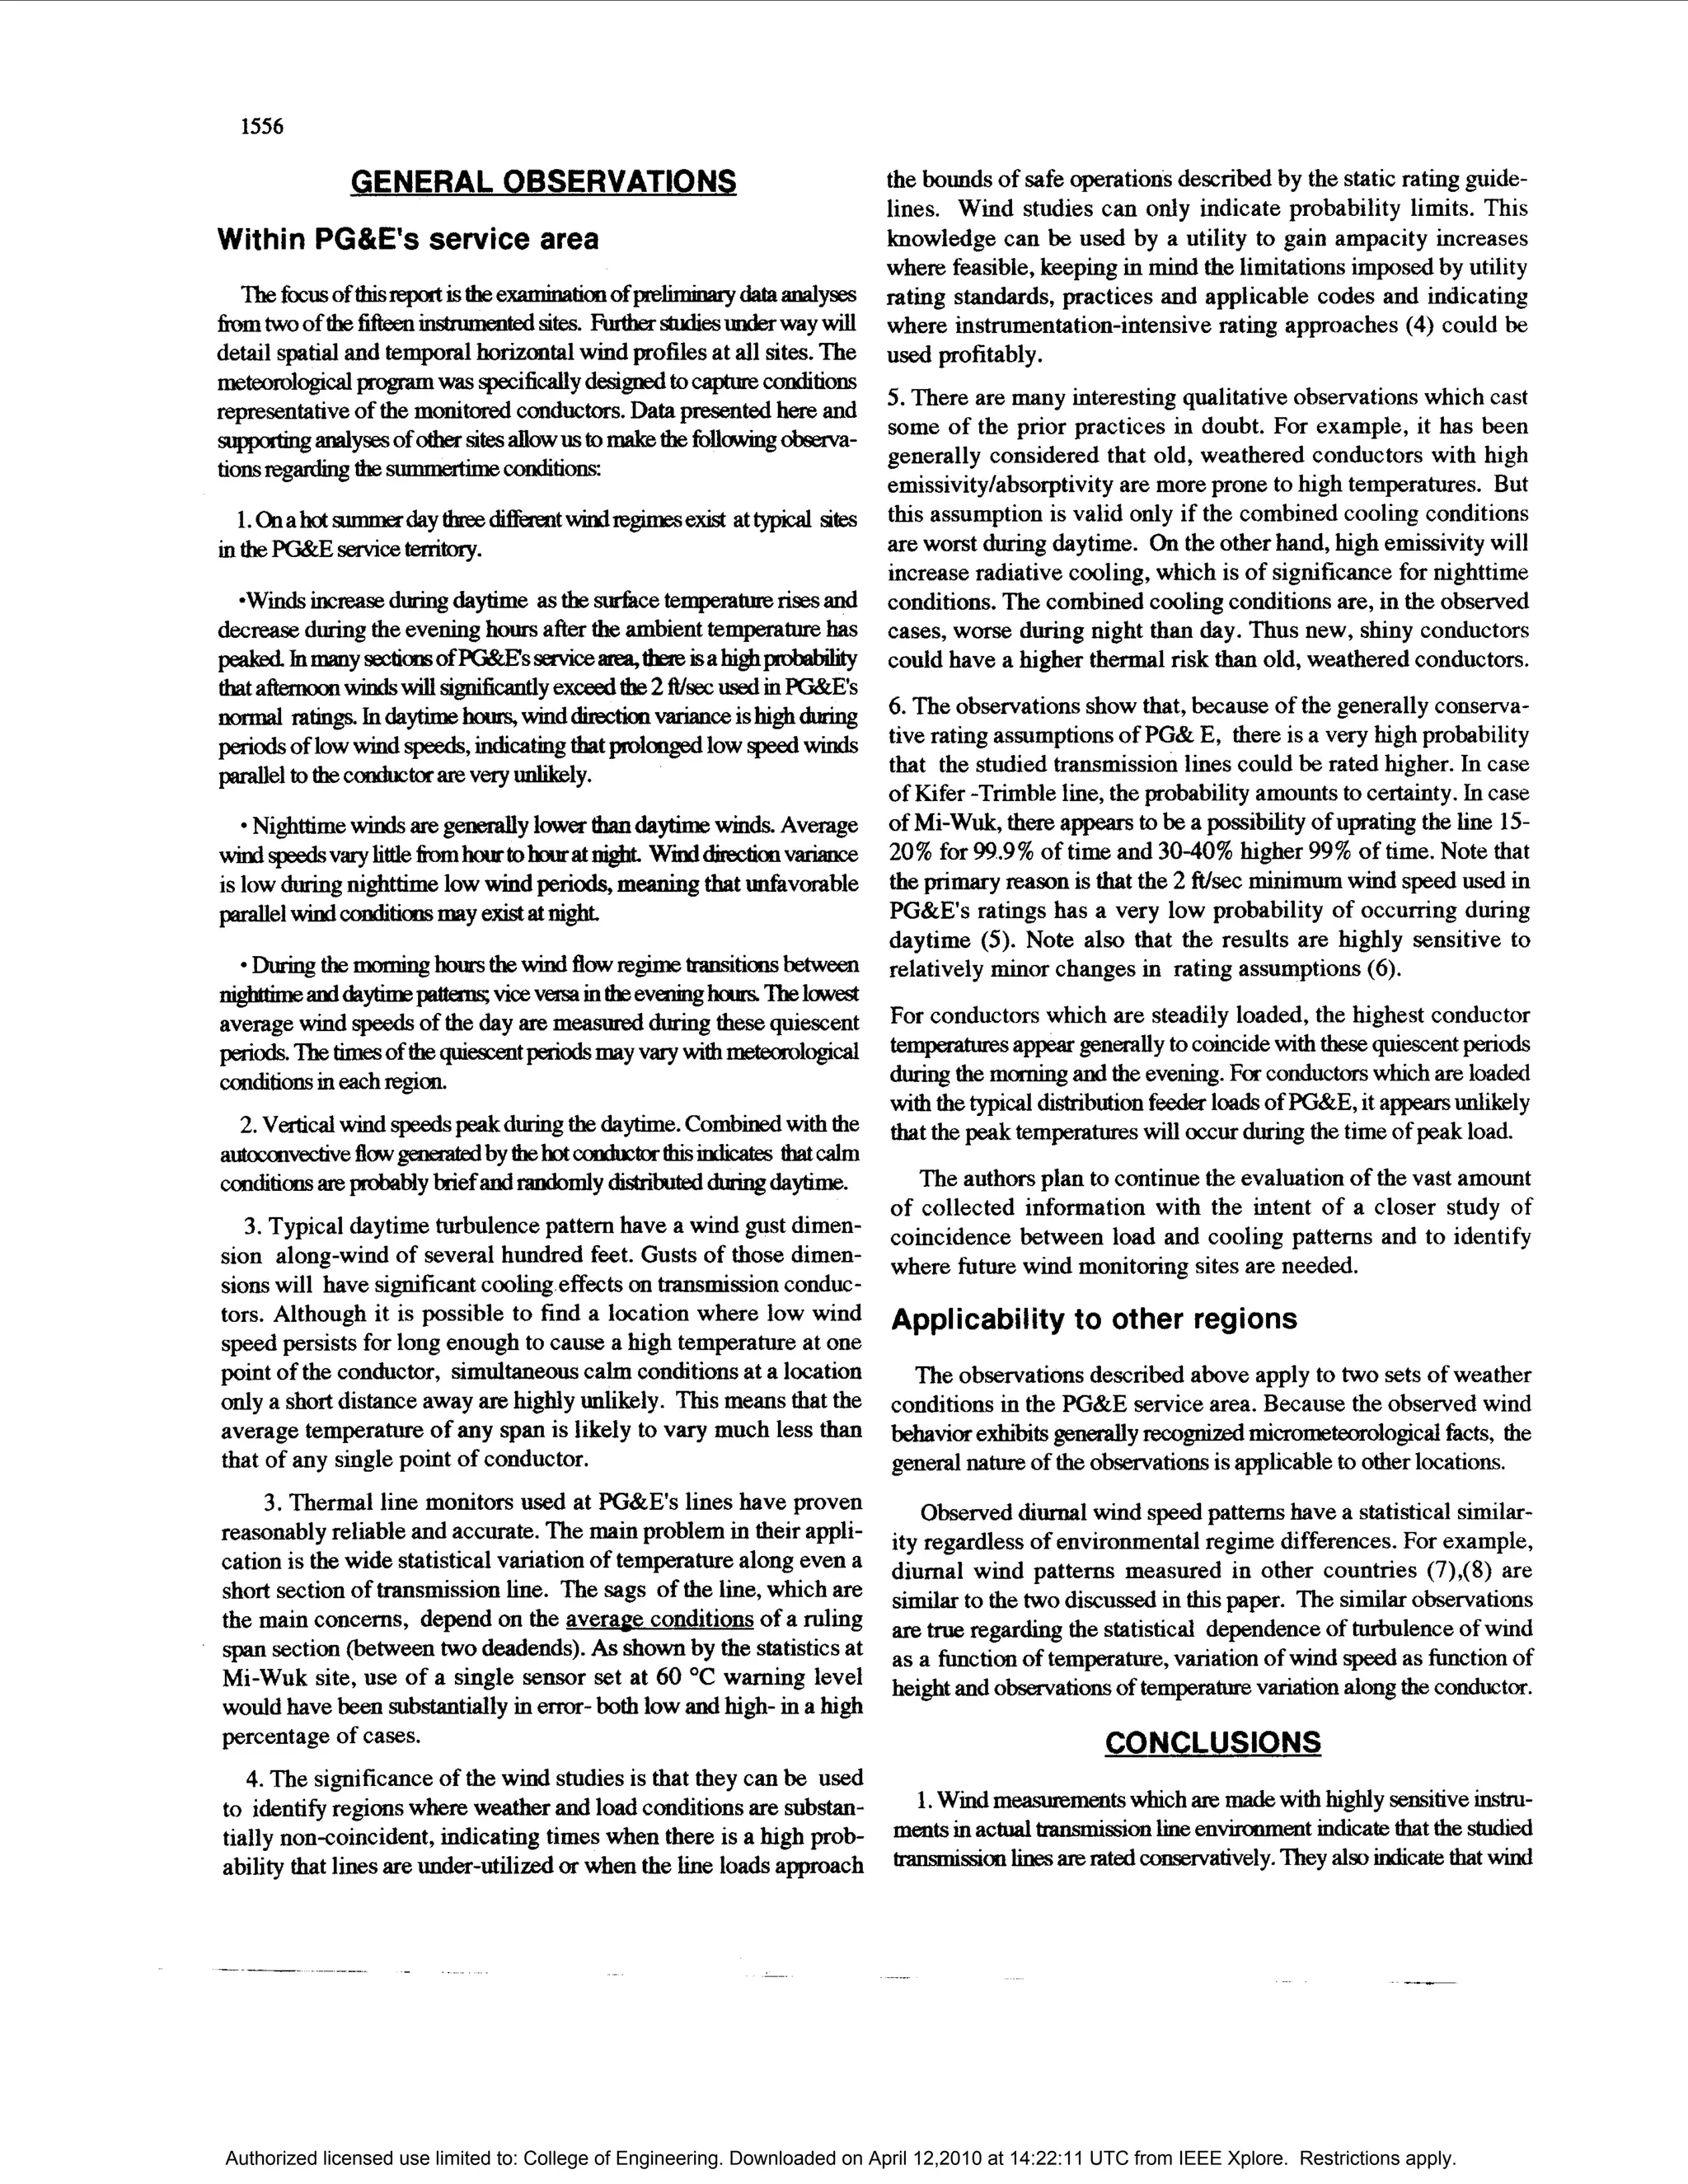
I am puzzled by the relatively small variation in conductor to point out thc correlation between vertical wind specds and daytime
temperature shown in Figure 2. As near as I can read the data in turbulence. An cxaniple is shown in Figure 1 below.
that figure, the conductor temperature varies over the range of
40°C to 48°C during the 24 hour period shown while the tempera- Field measurements, including Dr. Morgan’s( ) have shown that
4,
ture rise above ambient varies between 20°C and 26°C. Yet the 3
plotted magnitude of the combined wind speed changes from
about 2 ft/sec to nearly 5 ft/sec in the aftcrnoon. A change in
ftlscc 1
wind speed of 2.5 to 1.0-all else being equal-should yicld a 2 -
p i
change in conductor temperature rise of nearly 1.6 to 1.0. In
addition, solar heating during the daylight hours should add
between 5°C and 10°C to the conductor temperature rise above
ambient. Therefore, I would expect a considerably larger varia-
tion in measured conductor temperature if the plotted weathcr
data is correct. Would the authors care to clarify what is going on
in Fig. 2?
1 -
0
n 0
15 30 45 60 75
System operators are typically interested in the thermal capacity
of their transmission lines not the temperature of the conductors. Standard deviation of wind direction, degrees
Line thermal capacity may be calculated based on either mea- Figure 1. Correlation between std deviation of horizontal wind directiori
sured line temperature and weather data or on weather data (suninicr daytiriie, 10 m n avg.) a d veriical w i d speed at Mi- Wuk
i.
alone. As suggested by Foss [l], when the line temperature rise
above ambient is small, the thermal capacity is bcst calculated
using weather data alone. 4 1
Given the small line temperature rise above ambient shown in
Figure 9, what is the usefulness of measuring line temperature. Would
it not be better to simply calculate thermal capacity based on wcather
data. Will the authors please comment on the matter of when the
measurement of line temperature is of use operationally?
Many utilities have altered line ratings based on “typical” weather
data for several sites within their operating area. Would the
authors please comment on the degree to which they think such I
typical data is of use in thermal rating calculations? Also would
the authors please dircuss the extent to which the very different
I
wind conditions at the two locations-Kifer and Mi-Wuk-are I I I
due to terrain and foliage, that is to sheltering of the span versus 2 4 6 ft/sec 8
differences in meteorological conditions related to altitude and
the nearness of the ocean? Figure 2. Correlatiori (equiprobabilitylutes)forsuiiiiiierdaytintc (IOAM-
SPM)horizontal (x-an$) and vertical (paxi+) windspeeds ai Mi- Wuk
Reference
Foss, S . D., Line, S. H., Maraio, R. A., and Schrayshuen, H., forced cooling increases with increasing standard deviation of wind
“Effect of Variability in Weather Conditions on Conductor Tem- speedand direction, i.e. increasingturbulence.Basedonvertical wind
perature and the Dynamic Rating of Transmission Lincs,” ZEEE speedmeasurements, such as shown in Figure 1, it appears that the real
Transactions on Power Deliisery, Vol. 3, No. 4, October 1988, pp.
1832-1841. causal relationship is between vertical wind (i.e. the vertical compo-
nent of Tu) and forced cooling. At Mi-Wuk, it appears that the median
Manuscript received August 4, 1992.
daytime vertical component of Tu is about 50% of the horizontal
median value (Fig.2)
Mr. Bush raises thc question rcgarding thc combining ofhorizontal
T.O. Seppa, W.F. Whitlatch & E. Cromer: Regarding DL
Mormn’squestions on wind speed and conductor temperature obser- and vertical wind speeds. The answer is quite complex, because it
vations, we can state the following: the wind speed was sampled once depends on selected rating assumptions, as illustratcd by the cxample
cvery second. Average 10 minute wind speeds wcre calculated from calculated for Mi-Wuk below.
the data, as well as thc fastest and slowest 1 and 5 minute wind speeds. Figure 3 compares actual summcr daytlme wind speed against
The temperature sensors sampled the data every 2-3 seconds.Conduc- horizontal wind speed only. Note that the vertical wind speed effec-
tor temperature was averaged every 10 minutes. tively increases thc wind speed at a given probability level by approxi-
The authors do not imply that high temperature causes a high Tu. It mately 15%, i.e. by 0.5 to 0.8 Wsec.
is well documented that Tu increases with increasing lapse rate. The effect on the wind anglc is much more complex and depends on
Authorized licensed use limited to: College of Engineering. Downloaded on April 12,2010 at 14:22:11 UTC from IEEE Xplore. Restrictions apply.
10. 1560
at 45" and hazy sun, we arrive at an average conductor temperature of
50.5"C, substantially higher value thanthe observed 43°C average. If
ctorial sum of the measured median horizontal and
temperature of 47°C is still significantly higher than the observed
I I I I I I
ossible explanation for this difference is that the median vertical
.2 ft/sec. An alternative explanation is that the heat sink error
rs agree with h4r. Douglass' comment that the line
Effective wind ft/sec temperatureappears to be accurate in thermal rating calculations only
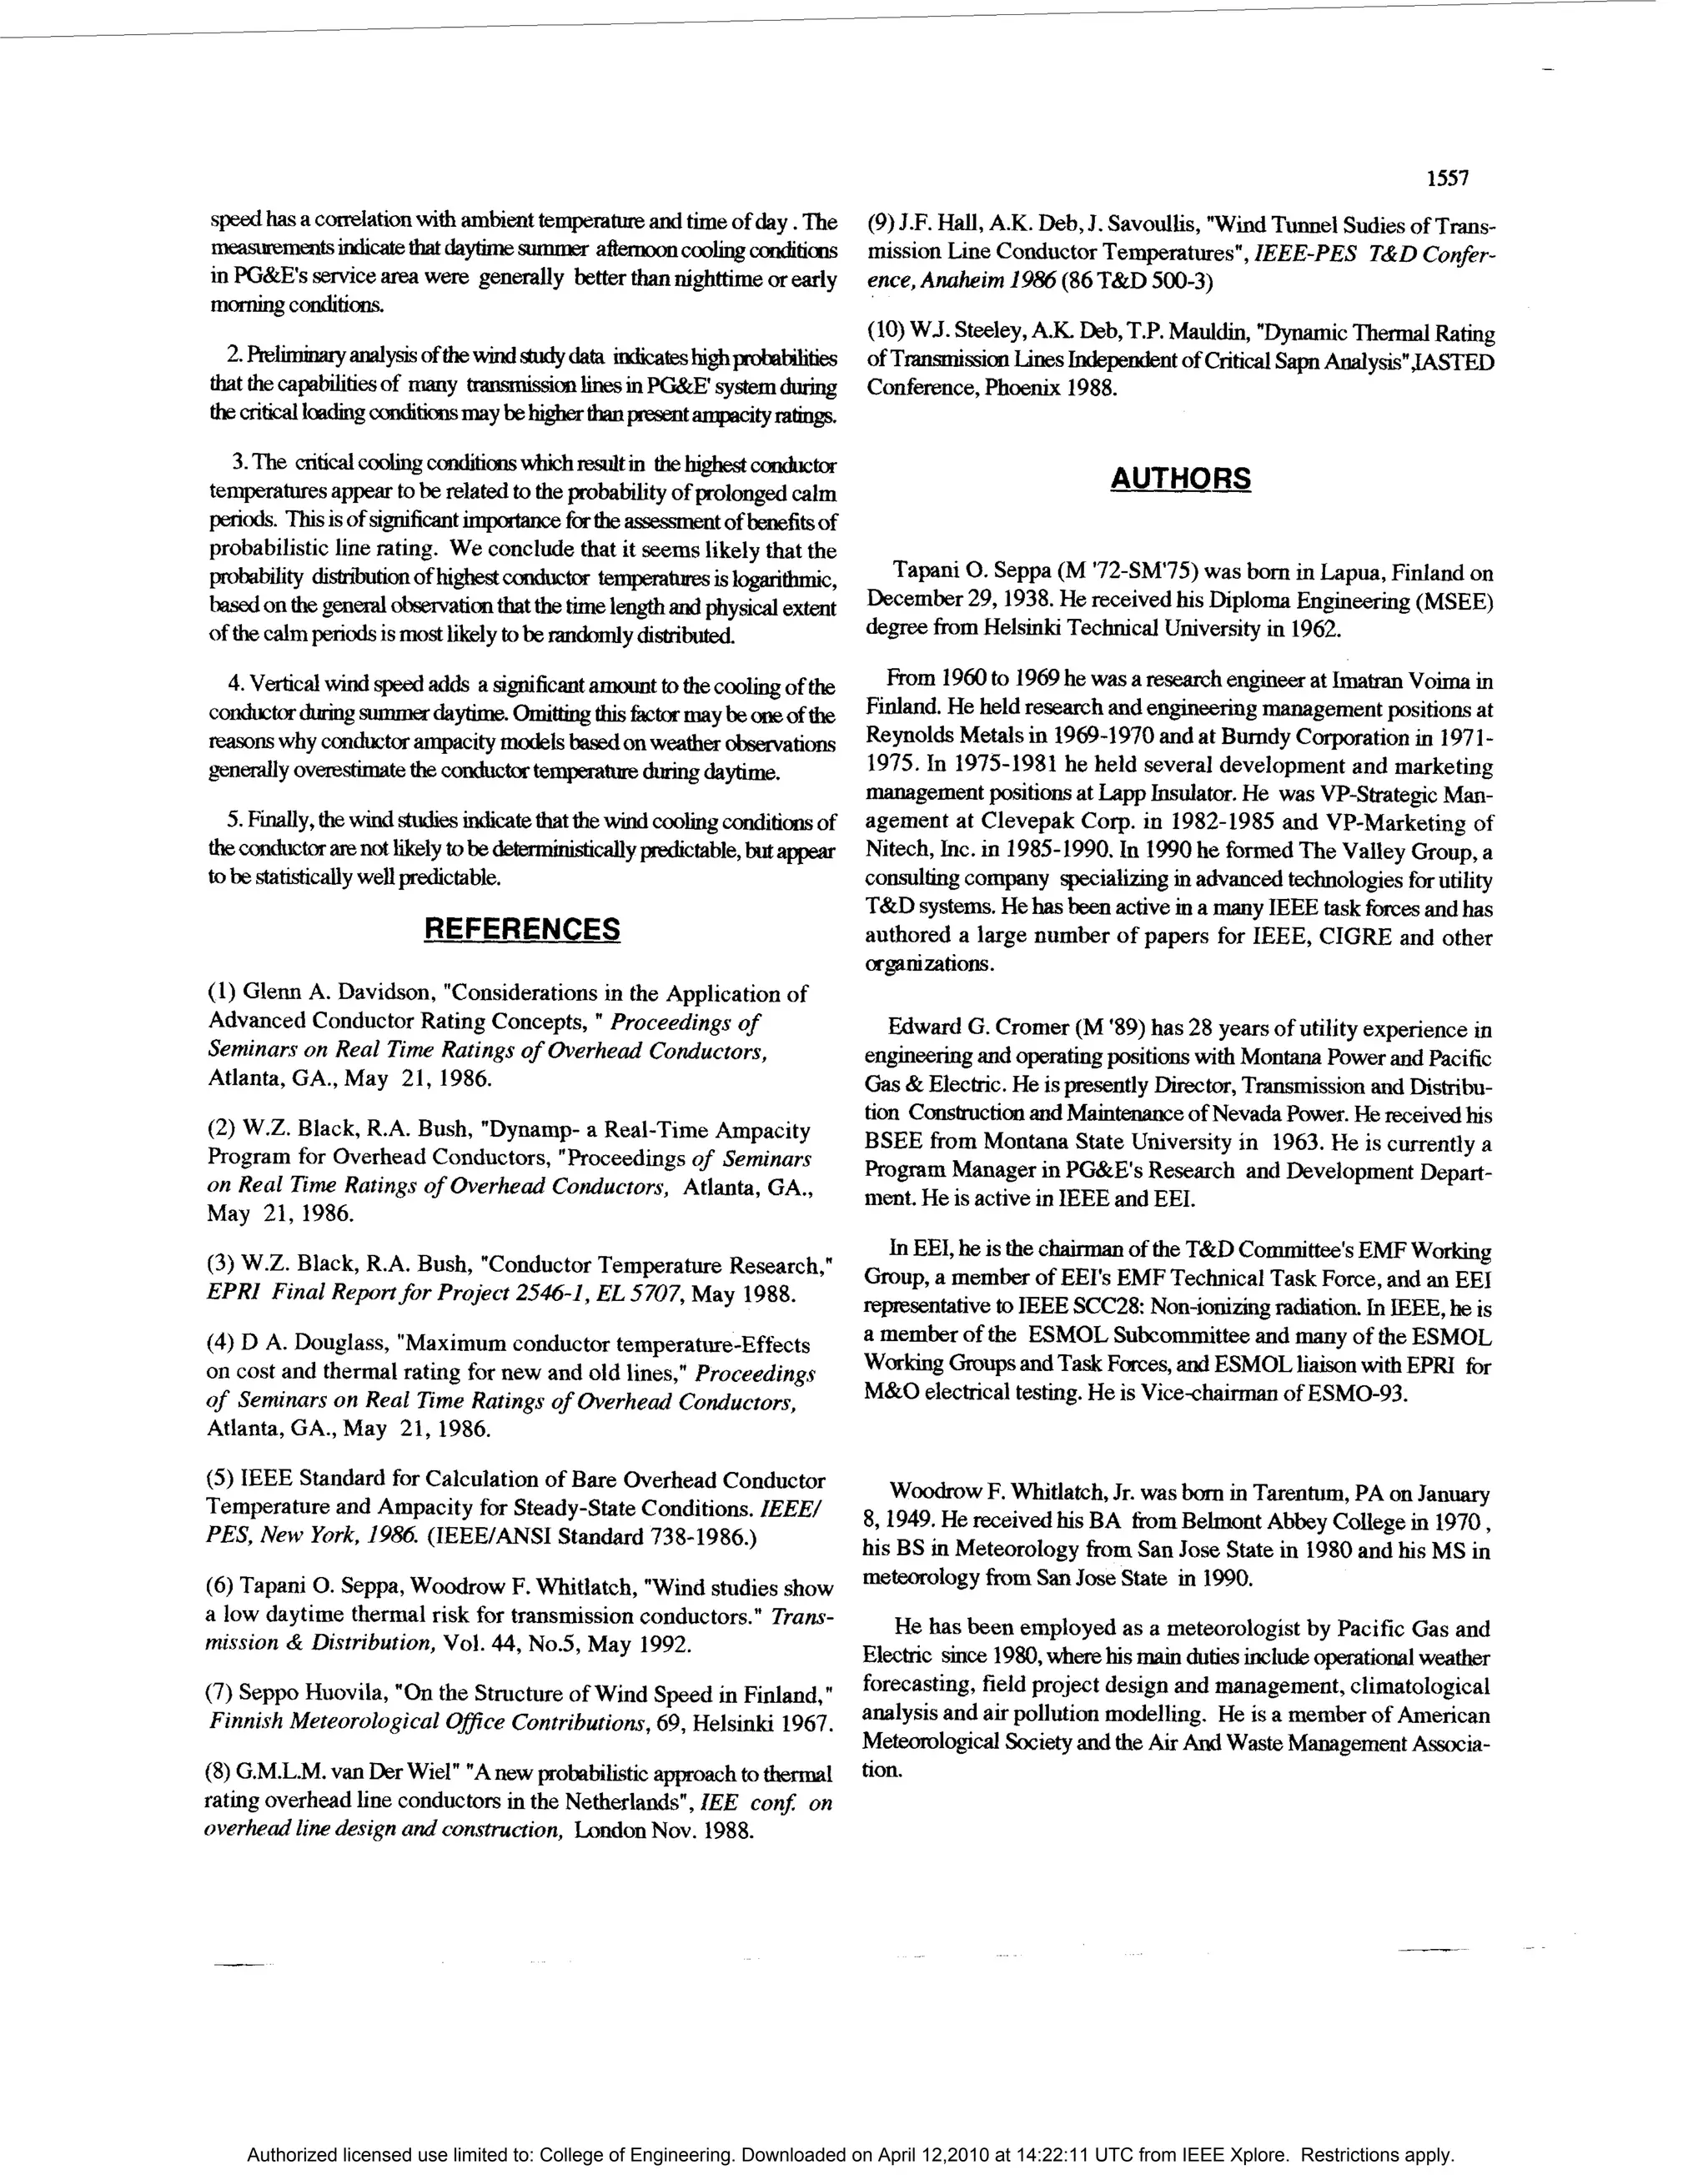
Figure 3. Cornparison bdtvren suninier daytinic (IOAM-6PM)
when the temperatureriseishigh.AsshownbyFigure9ofthereport, such
effective witid speed and korizonlal wind speed at Mi- Wuk acalculationisalsosubjecttothevariationofthetemperaturealongthe line.
As Far as generalization of the observations to other sites is
rating assumptions. For example, at Mi-Wuk, it reasonable to rate the concerned, the data which is used in this report covcrs only two
conductor at 2G"C anibienl for an 80°C conductor tempcrature by locations of fifteen studied in PG&E's serviceterritory. There are some
assuming that the wind speed is 2 Wsec perpendicular, or 3 Wsec at 30 observations which are common to all sites:
degrccs. But if the vertical wind is taken into account, these assump- ( 1) Medianvertical wind speeds during maximum insolation arc on
tions would be modified (based on equal probabilities) to either 2.5 ft/ the order of 2 Wsec or more at all sites.
scc perpendicular wind or to 3.5 Wsec wind at 45 degrees. The effect (2) Median daytime horizontal wind speeds and daytime turbu-
on thc ampacity is shown in Table I below: lcnces (as evidenced in the standard deviation of wind direction) were
Table I highcr than nighttime values.
Without vertical wind With vertical wind (3) At the sites equipped with two conductor temperature sensors,
2.0 fUsec at 90" : 550 A 2.5 ftlsec at !IOo : 580 A the deviation between relativetemperature rises of the sensors was on
3.0 fUsec at 30° : 525 A 3.5 ftlsec at 45O : 580 A the same order of magnitude as shown at the'two sites.
Thus, for Mi-Wuk, the effect of the vertical wind for summer common to Mi-Wukand KiferRrimble is likelyto be true for the other
observation sites in Northern California.
daytime ratings could be approximated by either of the following
SimDlified calculations: Regardmg Dr. Foss' comments, some of the observations of the
effect of the vertical wind speeds have been stated above. The effects
(I) Increase wind 'peed by 0'5 Wsec and keep Other ofvefiica] wind speed on ratillgs Mi-Wd, with low daytime wind
prior assumptions.
spccds, arc vcry substantial. They ccrtainly are muchmore substantial
(2) Keep all prior assumptions but discard solar radiation. than what would be explained by a 0 8Wsec natural convection.
.
The differencebetween the dfectiveand the horizontal wind speed It should also bc noled that thc mcasured mcdian horizontal wind
Statisticsat Mi-Wuk is substantial, because the horizontal wind speeds speed is no1 perpendicular, ne median angle is 450. Instead of the
at Mi-Wuk are low. Lesser changes could be expected at other sites coinparison suggested by Dr. Foss (that the effect would be compa-
where horizontal speeds are higher. rable to 4.5 @svs.4.9 fps perpendicular), the correct comparisonis 4.2
M - & has noted the relatively small variation of the day/ Wscc at 45' vs. 4.7 Wsec at 5 1". The difference in convective cooling
night temperatures at the Mi-Wuk site. The major cause appears to be is significant. At thc median daytimeambient temperature of 26°C and
the vertical wind speeds, as explained above. for a conductor temperature of 80"C,the differencc in convcctivc
T~show the difference, we calculated the temperaturerise the COOlhg iS 10%. Its CffCCt O the ampacity would be about 5%. For t h C
using n
p E E Thermal Rating Model, The average effective current for he more critical low wind horizontal wind speed conditions, the differ-
time the line was "on" is 425 A. Using cmissivity and absorptivity of cncc 's even larger, as shown in Figure 3.
0.5, and the median nighttime wind speed of 2.1 Wsec wt a median
ih Dr. Foss also suggests that the "overstatement"could be duc to thc
wind direction of 45 degrees, we calculated that the nighttime conduc- stalling speedsofcup ancmometers.We arc well aware ofthisproblem
tor temperaturc should be 45.5"C, at an average ambient teniperaturc and avoidcd it by using high sensitivity p r- anemomctcrs.
of 20°C.This is in close agrecment with the observed 46°C average. lilt have not itaverage line temperature" any-
When wc calculate the median daytime conductor temperature where in the report. We have correlated wind and other weather
using an ambient temperature of 26"C, a horizontal wind of 4.2 Wsec obscrvations with observed local conductor temperatures. We have
Authorized licensed use limited to: College of Engineering. Downloaded on April 12,2010 at 14:22:11 UTC from IEEE Xplore. Restrictions apply.
11. 1561
also obscrvcd variationofconductor tcmperaturc along thc conductor. Such cases are exceptionsto the more general turbulenceconditions,
Wc did not sce any nicrit in pursuing thc unproven critical span theory as shownby Figure 5, cited abovc and in referencessuch as ( 2 )and ( 3 ) .
in this text.
Dr. Foss' rcfercricc ( 3 ) USCS 5 nlinutc time averaging. The authors
uscd thc sanic type of sensors, with 10 nlinute averaging. In spite of
this, thc temperature rises mcasured at two locations 1000 ft. apart References:
diffcred by more than 10% for long periods. Also, as shown by (2), [l] H. M o n h & M. Armendariz, "Gust Factor Variations with
icmperaturcsavcraged 1 mile apart can vary by 15°Cand as shown by Height and Atmospheric Stability". ECOM -5320, Fort Monmouth ,
(3), tenipcraturcs in a single span can v r by 1O"C, cven when
ay N J , August 1970.
avcragcd. [ 2 ] J.W. Jerrell, W.Z. Black & T.J. Parker, "Critical Span Analysis
The time averaging will only bc equivalent to spatial averaging of Overhead Conductors", IEEE 87 SM 560-6, 1987.
under special circunistanccs.For cxample,the followingcritcria must [ 3 ] W.Z. Black & R. A. Bush, "Conductor Temperature Research,"
be met: EPRI Final Reportfor Project 2546-1, EL 5707, May 1988.
(1) The averagc wind conditions are uniform. This means that thc [4] V.T. Morgan, "The Real-Time Heat Balance for Overhead Con-
terrain is uniform. ductors," Proc. of Seminars on Real-Time Ratings of Overhead
(2) The turbulencc is circular. This means that thc along-thc-wind Condiictors, Atlanta, GA, May 21, 1986.
and across-the-wind fluctuationsof the wind spccd arc equal.
Authorized licensed use limited to: College of Engineering. Downloaded on April 12,2010 at 14:22:11 UTC from IEEE Xplore. Restrictions apply.