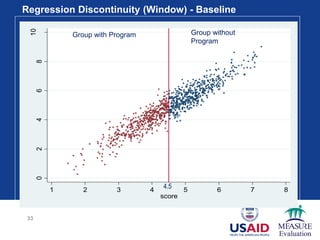
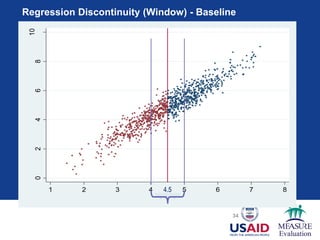
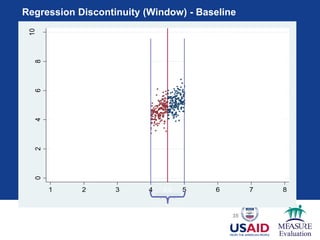
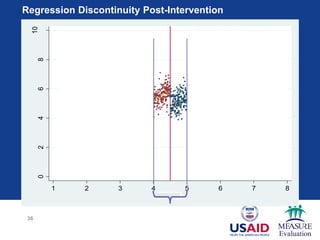
MEET/GEMNet-Health Impact
Evaluation Experience
Exchange
Introductory Webinar
April 9 2014
Evaluation: USAID Policy
“Evaluation is the systematic collection and analysis of
information about the characteristics and outcomes of
programs and projects as a basis for judgments, to
improve effectiveness, and/or inform decisions about
current and future programming.”
USAID Evaluation Policy, Jan 2011
“The two purposes of evaluation are to provide
information for decision making and contextual learning
and to demonstrate accountability for resources.”
Evaluation at USAID, Nov 2013
Evaluation Terminology
Impact evaluations measure the change in a
development outcome that is attributable to a defined
intervention.
Performance evaluations focus on descriptive and
normative questions - what a particular project or
program has achieved.
Performance monitoring reveals whether desired results
are occurring and whether implementation is on track.
Source: USAID Evaluation Policy, Jan 2011
Impact Evaluation
 Objectives
 How much of the observed change in the outcome can be attributed to
the program and not to other factors?
 Characteristics
 Keys issues: causality, quantification of program effect
 Use of evaluation designs to examine the causal relationship between
intervention and changes in the outcome
 Impact evaluation vs. monitoring
 Program monitoring tells you that a change occurred
 Impact evaluation tells you whether it was due to the program
Impact evaluation is not about monitoring final outcomes!
Evaluating Program Impact: Population Level
Program
start
Program
midpoint or end
With
programOutcome
Time
Evaluating Program Impact: Population Level
Program
start
Program
midpoint or end
With
programOutcome
Time
Evaluation
Question:
How much of
this change
is due to the
program?
Evaluating Program Impact: Population Level
Program
start
Program
midpoint or end
With
programOutcome
Time
Program
Impact
Effect of
other factors
Without
program
Evaluating Program Impact: Population Level
Program
start
Program
midpoint or end
With
programOutcome
Time
Program
Impact
Effect of
other factors
Without
program ?
Internal Validity
Internal validity is the extent to which your estimate of
program impact is a good measure of the causal
relationship between the intervention and outcome.
Factors that affect internal validity:
I. Multiple factors that affect outcomes
II. Selection bias
III. Spillovers
IV. Contamination
V. Heterogeneous impacts
Internal Validity: Multiple Factors (I)
Behavioral
changes
Individual /
Household
- Age
- Education
- Household wealth/SES
- Risk aversion
- Biological conditions
Service Supply/ Community
- Facilities: Access, Price, Quality
- Fieldworkers: Number, Quality
- Program
- Sanitation
- Culture
Outcome
Conceptual Model
Observable?
Yes
Yes
Yes
No
No
Observable?
Yes
Yes
Yes
Yes
No
The program is only
one factor among
many that influences
the outcome
Internal Validity: Selection Bias (II)
Typically, there are two selection processes:
- Self-selection of individuals – program participation is
the decision of the individual (i.e. voluntary)
- Selection of intervention areas - programs are
targeted to particular communities (i.e. program
managers decide allocation)
Thus, most likely participants are different from non-
participants.
Internal Validity: Spillovers (III)
2 Study groups: Treatment and Comparison
 Program impact: Treatment versus Comparison
Comparison
group
Treatment
group
If no spillovers
Internal Validity: Spillovers (III)
3 Study groups: Treatment, Comparison, and Spillover
 Program impact: Treatment versus Comparison
 Spillover effects: Spillover group versus Comparison
Comparison
group
Treatment
group
If spillovers possible
Group with
spillovers
Internal Validity: Spillovers (III)
Underestimation of program impact
Comparison
group
Treatment
group
Problems with Spillovers
Internal Validity: Contamination (IV)
Contamination of Comparison Group:
When members of the comparison group
are affected by the intervention or another
intervention which also affects the
outcome.
Monitoring conditions in treatment and
comparison groups, and measuring
external factors help identify
contamination problems.
Internal Validity: Heterogeneous
Impact (V)
When a program has different impacts on different
populations, e.g., by SES, by rural/urban, by food
security status etc.
 Implications for IE
 Estimating the average program impact for the entire
treatment group may mask the high (or low) impact on
particular subgroups. The average program impact may not
be informative for policy decisions.
 Requires large sample size
Key Design Issue: External Validity
External Validity: Program impact estimate is valid for the
whole target population, for other population groups in
the country, or in other countries.
How to address external validity?
- Sample for analysis is representative of population of interest
- Analysis of similarities between the program and analysis
sample and those in other countries
- Conceptual framework or program theory is widely accepted
- Causal chain links are tested
- Use of mixed methods: quantitative and qualitative analysis
Quick Poll
Impact Evaluation Designs
 Evaluation Designs
Set of procedures that guide the selection of an appropriate
comparison group in order to identify a credible counterfactual
and that also guide data collection and the estimation
procedures.
 Different evaluation designs are available:
1. Experimental
2. Quasi-experimental / Non-experimental
 Matching and Propensity Score Matching (PSM)
 Difference-in-Differences (DID)
 Regression Discontinuity
 Instrumental Variable (IV)
Experimental Design
Individuals are randomly assigned into a Treatment group and a Control
group
If well implemented and sample is large enough, random assignment
makes the pre-program treatment and control groups similar on
observed and unobserved characteristics.
To estimate program impact:
Program Impact = Average(“Treatment”) - Average(“Control”)
Experiments control for problem of incomplete information and selection.
In absence of good experiments:
Observational Designs – Quasi-experimental/Non-
experimental
 There is no random assignment of individuals to treatment/control
groups
 Therefore, multiple factors influence participation of individuals in the
program and there is no guarantee that other relevant factors are
equivalent between the “participant” and “non-participant” groups
 Observational designs, often referred as non-experimental designs,
use econometric techniques, matching procedures, or discontinuity
approaches to identify a comparison group and to estimate the
counterfactual.
Matching
Example: 4 participants; 2 matching criteria: Sex (male, female) ; Age
(15-19, 20-24).
Participants
Age
15-19 20-24
Sex
Male ID235 ID64
Female ID36 ID55
Non-participants
Age
15-19 20-24
Sex
Male ID66 ID321
Female ID23 ID41
- Find a group of non-participants
- For each participant, find his/her match
Challenges of “Classic” Matching
 “Curse of Dimensionality”
 The number of cells increases exponentially as the number of
matching variables increases
 Matching by cells of characteristics becomes complicated
 Example: 6 criteria: age, sex, education, region, type of area, SES
Characteristics
Total # of
cells
Age Sex Education Region Area SES
3,500# of
categories 5 2 5 7 2 5
Let’s add marital status (3 categories): 3,500 x 3 = 10,500 cells!
So, key question: How to simplify the matching procedure?
Let’s add marital status (3 categories): 3,500 x 3 = 10,500 cells!
So, key question: How to simplify the matching procedure?
Propensity Score Matching (PSM)
 For each participant find a non-participant with the “same propensity score.”
xxx xxxxxxxxxxxxxxxxxxxxxx xxxxx
xxxx xxxxxxxxxxxxxxxxxxxxxxxxx
0
0
1
1
Participants
Non-
participants
ID203: Propensity Score =
0.41 Outcome=4
ID145: Outcome=3
• Find the outcomes of a matched pair (e.g., 4 and 3 in the
example)
• Impact estimate: 4 – 3 = 1
Difference-in-Differences
• Two groups
– Treatment group (“with program”)
– Comparison group (“without program”)
• Two (or more) points in time
– Baseline survey (Before Program Implemented)
– Follow-up survey (During/After Implementation of Program)
• Need to be able to identify program participants at Baseline and
Follow-up
Difference-in-Differences
Time
Outcome
B
A
Baseline Follow-up
B-A
Difference-in-Differences
Time
Outcome
B
A
Baselin
e
Follow-
up
B-A
C
D-C
D
Difference-in-Differences
Time
Outcome
B
A
Baselin
e
Follow-
up
B-A
C
D-C
D
D-C
Difference-in-Differences
Time
Outcome
B
A
Baselin
e
Follow-
up
B-A
C
D-C
D
D-C
Impact = (B-A)-(D-C)
Difference-in-Differences
Time
Outcome
B
A
Baselin
e
Follow-
up
B-A
Impact = (B-A)-(D-C)
C
D-C
D
True trend;
DID under-estimates impact
Regression Discontinuity - Baseline
31
02468
10
Outcome
1 2 3 4 5 6 7 8
score
Regression Discontinuity - Baseline
32
02468
10
Outcome
1 2 3 4 5 6 7 8
score
Threshold
at 4.5
4.5
Regression Discontinuity (Window) - Baseline
33
02468
10
Outcome
1 2 3 4 5 6 7 8
score
Group with Program Group without
Program
4.5
Regression Discontinuity (Window) - Baseline
34
02468
10
Outcome
1 2 3 4 5 6 7 8
score
Group with Program
Group without
Program
4.5
“Window”
Regression Discontinuity (Window) - Baseline
35
02468
10
Outcome
1 2 3 4 5 6 7 8
score
Group with Program
Group without
Program
4.5
“Window”
We will use only those observations in the Window
36
02468
10
Outcome
1 2 3 4 5 6 7 8
score
Group with
Program
Group without
Program
Regression Discontinuity Post-Intervention
“Window”
37
4567
Outcome
4 4.2 4.4 4.6 4.8 5
score
4.5
RD: Looking at the window only- Post-intervention
Impact
Quick Poll
Forum Focus
 Sharing experiences,
challenges and solutions
 Refining evaluation
questions
 Identifying treatment and
comparison groups;
 Balancing technical, cost,
logistical, and political
factors in evaluation
design
MEASURE Evaluation is funded by the U.S. Agency for
International Development (USAID) and implemented by the
Carolina Population Center at the University of North Carolina at
Chapel Hill in partnership with Futures Group, ICF International,
John Snow, Inc., Management Sciences for Health, and Tulane
University. Views expressed in this presentation do not necessarily
reflect the views of USAID or the U.S. government.
MEASURE Evaluation is the USAID Global Health Bureau's
primary vehicle for supporting improvements in monitoring and
evaluation in population, health and nutrition worldwide.
www.measureevaluation.org

Key Issues in Impact Evaluation: A MEET and GEMNet-Health Virtual Event

  • 1.
  • 2.
    Evaluation: USAID Policy “Evaluationis the systematic collection and analysis of information about the characteristics and outcomes of programs and projects as a basis for judgments, to improve effectiveness, and/or inform decisions about current and future programming.” USAID Evaluation Policy, Jan 2011 “The two purposes of evaluation are to provide information for decision making and contextual learning and to demonstrate accountability for resources.” Evaluation at USAID, Nov 2013
  • 3.
    Evaluation Terminology Impact evaluationsmeasure the change in a development outcome that is attributable to a defined intervention. Performance evaluations focus on descriptive and normative questions - what a particular project or program has achieved. Performance monitoring reveals whether desired results are occurring and whether implementation is on track. Source: USAID Evaluation Policy, Jan 2011
  • 4.
    Impact Evaluation  Objectives How much of the observed change in the outcome can be attributed to the program and not to other factors?  Characteristics  Keys issues: causality, quantification of program effect  Use of evaluation designs to examine the causal relationship between intervention and changes in the outcome  Impact evaluation vs. monitoring  Program monitoring tells you that a change occurred  Impact evaluation tells you whether it was due to the program Impact evaluation is not about monitoring final outcomes!
  • 5.
    Evaluating Program Impact:Population Level Program start Program midpoint or end With programOutcome Time
  • 6.
    Evaluating Program Impact:Population Level Program start Program midpoint or end With programOutcome Time Evaluation Question: How much of this change is due to the program?
  • 7.
    Evaluating Program Impact:Population Level Program start Program midpoint or end With programOutcome Time Program Impact Effect of other factors Without program
  • 8.
    Evaluating Program Impact:Population Level Program start Program midpoint or end With programOutcome Time Program Impact Effect of other factors Without program ?
  • 9.
    Internal Validity Internal validityis the extent to which your estimate of program impact is a good measure of the causal relationship between the intervention and outcome. Factors that affect internal validity: I. Multiple factors that affect outcomes II. Selection bias III. Spillovers IV. Contamination V. Heterogeneous impacts
  • 10.
    Internal Validity: MultipleFactors (I) Behavioral changes Individual / Household - Age - Education - Household wealth/SES - Risk aversion - Biological conditions Service Supply/ Community - Facilities: Access, Price, Quality - Fieldworkers: Number, Quality - Program - Sanitation - Culture Outcome Conceptual Model Observable? Yes Yes Yes No No Observable? Yes Yes Yes Yes No The program is only one factor among many that influences the outcome
  • 11.
    Internal Validity: SelectionBias (II) Typically, there are two selection processes: - Self-selection of individuals – program participation is the decision of the individual (i.e. voluntary) - Selection of intervention areas - programs are targeted to particular communities (i.e. program managers decide allocation) Thus, most likely participants are different from non- participants.
  • 12.
    Internal Validity: Spillovers(III) 2 Study groups: Treatment and Comparison  Program impact: Treatment versus Comparison Comparison group Treatment group If no spillovers
  • 13.
    Internal Validity: Spillovers(III) 3 Study groups: Treatment, Comparison, and Spillover  Program impact: Treatment versus Comparison  Spillover effects: Spillover group versus Comparison Comparison group Treatment group If spillovers possible Group with spillovers
  • 14.
    Internal Validity: Spillovers(III) Underestimation of program impact Comparison group Treatment group Problems with Spillovers
  • 15.
    Internal Validity: Contamination(IV) Contamination of Comparison Group: When members of the comparison group are affected by the intervention or another intervention which also affects the outcome. Monitoring conditions in treatment and comparison groups, and measuring external factors help identify contamination problems.
  • 16.
    Internal Validity: Heterogeneous Impact(V) When a program has different impacts on different populations, e.g., by SES, by rural/urban, by food security status etc.  Implications for IE  Estimating the average program impact for the entire treatment group may mask the high (or low) impact on particular subgroups. The average program impact may not be informative for policy decisions.  Requires large sample size
  • 17.
    Key Design Issue:External Validity External Validity: Program impact estimate is valid for the whole target population, for other population groups in the country, or in other countries. How to address external validity? - Sample for analysis is representative of population of interest - Analysis of similarities between the program and analysis sample and those in other countries - Conceptual framework or program theory is widely accepted - Causal chain links are tested - Use of mixed methods: quantitative and qualitative analysis
  • 18.
  • 19.
    Impact Evaluation Designs Evaluation Designs Set of procedures that guide the selection of an appropriate comparison group in order to identify a credible counterfactual and that also guide data collection and the estimation procedures.  Different evaluation designs are available: 1. Experimental 2. Quasi-experimental / Non-experimental  Matching and Propensity Score Matching (PSM)  Difference-in-Differences (DID)  Regression Discontinuity  Instrumental Variable (IV)
  • 20.
    Experimental Design Individuals arerandomly assigned into a Treatment group and a Control group If well implemented and sample is large enough, random assignment makes the pre-program treatment and control groups similar on observed and unobserved characteristics. To estimate program impact: Program Impact = Average(“Treatment”) - Average(“Control”) Experiments control for problem of incomplete information and selection.
  • 21.
    In absence ofgood experiments: Observational Designs – Quasi-experimental/Non- experimental  There is no random assignment of individuals to treatment/control groups  Therefore, multiple factors influence participation of individuals in the program and there is no guarantee that other relevant factors are equivalent between the “participant” and “non-participant” groups  Observational designs, often referred as non-experimental designs, use econometric techniques, matching procedures, or discontinuity approaches to identify a comparison group and to estimate the counterfactual.
  • 22.
    Matching Example: 4 participants;2 matching criteria: Sex (male, female) ; Age (15-19, 20-24). Participants Age 15-19 20-24 Sex Male ID235 ID64 Female ID36 ID55 Non-participants Age 15-19 20-24 Sex Male ID66 ID321 Female ID23 ID41 - Find a group of non-participants - For each participant, find his/her match
  • 23.
    Challenges of “Classic”Matching  “Curse of Dimensionality”  The number of cells increases exponentially as the number of matching variables increases  Matching by cells of characteristics becomes complicated  Example: 6 criteria: age, sex, education, region, type of area, SES Characteristics Total # of cells Age Sex Education Region Area SES 3,500# of categories 5 2 5 7 2 5 Let’s add marital status (3 categories): 3,500 x 3 = 10,500 cells! So, key question: How to simplify the matching procedure? Let’s add marital status (3 categories): 3,500 x 3 = 10,500 cells! So, key question: How to simplify the matching procedure?
  • 24.
    Propensity Score Matching(PSM)  For each participant find a non-participant with the “same propensity score.” xxx xxxxxxxxxxxxxxxxxxxxxx xxxxx xxxx xxxxxxxxxxxxxxxxxxxxxxxxx 0 0 1 1 Participants Non- participants ID203: Propensity Score = 0.41 Outcome=4 ID145: Outcome=3 • Find the outcomes of a matched pair (e.g., 4 and 3 in the example) • Impact estimate: 4 – 3 = 1
  • 25.
    Difference-in-Differences • Two groups –Treatment group (“with program”) – Comparison group (“without program”) • Two (or more) points in time – Baseline survey (Before Program Implemented) – Follow-up survey (During/After Implementation of Program) • Need to be able to identify program participants at Baseline and Follow-up
  • 26.
  • 27.
  • 28.
  • 29.
  • 30.
  • 31.
    Regression Discontinuity -Baseline 31 02468 10 Outcome 1 2 3 4 5 6 7 8 score
  • 32.
    Regression Discontinuity -Baseline 32 02468 10 Outcome 1 2 3 4 5 6 7 8 score Threshold at 4.5 4.5
  • 33.
    Regression Discontinuity (Window)- Baseline 33 02468 10 Outcome 1 2 3 4 5 6 7 8 score Group with Program Group without Program 4.5
  • 34.
    Regression Discontinuity (Window)- Baseline 34 02468 10 Outcome 1 2 3 4 5 6 7 8 score Group with Program Group without Program 4.5 “Window”
  • 35.
    Regression Discontinuity (Window)- Baseline 35 02468 10 Outcome 1 2 3 4 5 6 7 8 score Group with Program Group without Program 4.5 “Window” We will use only those observations in the Window
  • 36.
    36 02468 10 Outcome 1 2 34 5 6 7 8 score Group with Program Group without Program Regression Discontinuity Post-Intervention “Window”
  • 37.
    37 4567 Outcome 4 4.2 4.44.6 4.8 5 score 4.5 RD: Looking at the window only- Post-intervention Impact
  • 38.
  • 39.
    Forum Focus  Sharingexperiences, challenges and solutions  Refining evaluation questions  Identifying treatment and comparison groups;  Balancing technical, cost, logistical, and political factors in evaluation design
  • 41.
    MEASURE Evaluation isfunded by the U.S. Agency for International Development (USAID) and implemented by the Carolina Population Center at the University of North Carolina at Chapel Hill in partnership with Futures Group, ICF International, John Snow, Inc., Management Sciences for Health, and Tulane University. Views expressed in this presentation do not necessarily reflect the views of USAID or the U.S. government. MEASURE Evaluation is the USAID Global Health Bureau's primary vehicle for supporting improvements in monitoring and evaluation in population, health and nutrition worldwide.
  • 42.