SlideShare a Scribd company logo
Jason Giovannettone
               Michael Wright
Institute for Water Resources
                    ICI-WaRM
•   Objective: Develop a free tool that uses available
    rainfall data to create rainfall frequency maps.
•   Useful in arid & semi-arid regions.
•   Many developing countries are located in dry
    regions.
•   Maps assist in identifying areas vulnerable to climate
    change impacts on precipitation.
•   Overall Result: Assist in long-range planning for arid
    developing countries where changes in rainfall due to
    climate change can be expected.
• Taken from Schafer et al. (2007). “Regional precipitation-frequency analysis and spatial
mapping of 24-hour precipitation for Oregon,” prepared by MGS Engineering Consultants, Inc.
for the Oregon State Department of Transportation, 84 pp.
•   ICIWaRM: International Center for Integrated
    Water Resources Management.
•   Category 2 UNESCO center headquartered at the
    Institute for Water Resources
•   Consortium of universities, U.S. gov’t agencies, &
    NGOs supporting UNESCO’s IHP strategic program.
•   Software supports ICIWaRM mission of aiding
    developing countries in water resources
    management & contributing to developing non-
    proprietary analytical tools.
 L-moments are the
  statistics used to
  determine the exact
  shape of the regional
  frequency.
 L-Mean, L-Coefficient
  of Variation, L-
  Skew, L-Kurtosis
 Developed by John
  Hosking & James
  Wallis
 Regional rainfall
  frequency analysis is
  performed by grouping
  rainfall data from
  multiple sites with
  similar frequency
  distributions.
 Caution must be
  exercised in
  determining regions
  (e.g. Are sites only
  located on rivers?)
 A drought (rainfall
 frequency) atlas is
 a collection of
 maps/statistics
 that reveals the
 spatial distribution
 of storm
 intensities for
 particular
 frequencies.
 Choose a period to
  analyze.
 Beginning month =
  February.
 Period duration =
  February – April.
 Each site requires
  40 good periods of
  data to be used.
 A graph of t4 vs. t3
  gives an initial
  impression of
  which distribution
  may fit the data
  best.
 The probability
  distribution
  function (PDF) for
  the region can be
  fit with up to 13
  frequency
  distributions.
 The Cumulative
 Distribution
 Function (CDF) of
 the PDF is used to
 compute the
 Exceedance Curve.
 This curve gives the
 intensity of rain
 events with
 frequencies
 between 1 year up
 to 1000 years.
For droughts that occur every
20 years, how much total
precipitation can be expected
over 5 years?
 Source: NOAA’s Global
  Histórical Climatology
  Network
 As can be seen here, more
  data sites are needed to
  improve resolution and
  smoothness of contours.
ICI-RAFT (presented at AMS 2012)

More Related Content

What's hot

Midwest Floods of 2008: Wisconsin Response
Midwest Floods of 2008:  Wisconsin ResponseMidwest Floods of 2008:  Wisconsin Response
Midwest Floods of 2008: Wisconsin Response
ewug
 
Using EDINA Datasets in a Hydrology Project - Darius Bazazi
Using EDINA Datasets in a Hydrology Project - Darius BazaziUsing EDINA Datasets in a Hydrology Project - Darius Bazazi
Using EDINA Datasets in a Hydrology Project - Darius Bazazi
EDINA, University of Edinburgh
 
Drought monitoring and early warning in the MENA region: The ICBA contributio...
Drought monitoring and early warning in the MENA region: The ICBA contributio...Drought monitoring and early warning in the MENA region: The ICBA contributio...
Drought monitoring and early warning in the MENA region: The ICBA contributio...
NENAwaterscarcity
 
Geospatial Analysis and Open Data - Forest and Climate
Geospatial Analysis and Open Data - Forest and ClimateGeospatial Analysis and Open Data - Forest and Climate
Geospatial Analysis and Open Data - Forest and Climate
Institute of Contemporary Sciences
 
Application of Remote Sensing and GIS Technology for Pre and Post Flood Analy...
Application of Remote Sensing and GIS Technology for Pre and Post Flood Analy...Application of Remote Sensing and GIS Technology for Pre and Post Flood Analy...
Application of Remote Sensing and GIS Technology for Pre and Post Flood Analy...
Uzma Fatima Ch.
 
Team Lesson Plan4.08
Team Lesson Plan4.08Team Lesson Plan4.08
Team Lesson Plan4.08
li5disc
 
Abstract Shuvra
Abstract ShuvraAbstract Shuvra
Abstract Shuvra065msw418
 
Symphony- a cumulative assessment tool for MSP at the 2nd Baltic Maritime Spa...
Symphony- a cumulative assessment tool for MSP at the 2nd Baltic Maritime Spa...Symphony- a cumulative assessment tool for MSP at the 2nd Baltic Maritime Spa...
Symphony- a cumulative assessment tool for MSP at the 2nd Baltic Maritime Spa...
Pan Baltic Scope / Baltic SCOPE
 
Flood Forecasting - Peter Gibbs
Flood Forecasting - Peter GibbsFlood Forecasting - Peter Gibbs
Flood Forecasting - Peter Gibbs
EDINA, University of Edinburgh
 
USDA/GIS Update - Data, Products & Services
USDA/GIS Update - Data, Products & ServicesUSDA/GIS Update - Data, Products & Services
USDA/GIS Update - Data, Products & Services
DRIscience
 
Estimation of water spread area using rs and gis
Estimation of water spread area using rs and gisEstimation of water spread area using rs and gis
Estimation of water spread area using rs and gis
HARI NUNAVATH
 
Pan_European and pan-African Early Warning on Floods and Droughts: From the E...
Pan_European and pan-African Early Warning on Floods and Droughts: From the E...Pan_European and pan-African Early Warning on Floods and Droughts: From the E...
Pan_European and pan-African Early Warning on Floods and Droughts: From the E...
Global Risk Forum GRFDavos
 
Modeling the water food-energy nexus in the Arab world: The NASA land informa...
Modeling the water food-energy nexus in the Arab world: The NASA land informa...Modeling the water food-energy nexus in the Arab world: The NASA land informa...
Modeling the water food-energy nexus in the Arab world: The NASA land informa...
International Food Policy Research Institute (IFPRI)
 
2006-03-08 Intercontinental Aerosol Transport: Quantitative Tools an Results
2006-03-08 Intercontinental Aerosol Transport: Quantitative Tools an Results2006-03-08 Intercontinental Aerosol Transport: Quantitative Tools an Results
2006-03-08 Intercontinental Aerosol Transport: Quantitative Tools an ResultsRudolf Husar
 
EcoTas13 BradEvans e-MAST
EcoTas13 BradEvans e-MASTEcoTas13 BradEvans e-MAST
EcoTas13 BradEvans e-MAST
TERN Australia
 
SURF_Poster_REU2016Team1
SURF_Poster_REU2016Team1SURF_Poster_REU2016Team1
SURF_Poster_REU2016Team1Mathew Prindle
 

What's hot (20)

Midwest Floods of 2008: Wisconsin Response
Midwest Floods of 2008:  Wisconsin ResponseMidwest Floods of 2008:  Wisconsin Response
Midwest Floods of 2008: Wisconsin Response
 
MUSE
MUSEMUSE
MUSE
 
Using EDINA Datasets in a Hydrology Project - Darius Bazazi
Using EDINA Datasets in a Hydrology Project - Darius BazaziUsing EDINA Datasets in a Hydrology Project - Darius Bazazi
Using EDINA Datasets in a Hydrology Project - Darius Bazazi
 
Cochran_5.2.1
Cochran_5.2.1Cochran_5.2.1
Cochran_5.2.1
 
Drought monitoring and early warning in the MENA region: The ICBA contributio...
Drought monitoring and early warning in the MENA region: The ICBA contributio...Drought monitoring and early warning in the MENA region: The ICBA contributio...
Drought monitoring and early warning in the MENA region: The ICBA contributio...
 
Geospatial Analysis and Open Data - Forest and Climate
Geospatial Analysis and Open Data - Forest and ClimateGeospatial Analysis and Open Data - Forest and Climate
Geospatial Analysis and Open Data - Forest and Climate
 
Application of Remote Sensing and GIS Technology for Pre and Post Flood Analy...
Application of Remote Sensing and GIS Technology for Pre and Post Flood Analy...Application of Remote Sensing and GIS Technology for Pre and Post Flood Analy...
Application of Remote Sensing and GIS Technology for Pre and Post Flood Analy...
 
Team Lesson Plan4.08
Team Lesson Plan4.08Team Lesson Plan4.08
Team Lesson Plan4.08
 
Abstract Shuvra
Abstract ShuvraAbstract Shuvra
Abstract Shuvra
 
vectorrasterQGIS
vectorrasterQGISvectorrasterQGIS
vectorrasterQGIS
 
flooding-fore-mapping
flooding-fore-mappingflooding-fore-mapping
flooding-fore-mapping
 
Symphony- a cumulative assessment tool for MSP at the 2nd Baltic Maritime Spa...
Symphony- a cumulative assessment tool for MSP at the 2nd Baltic Maritime Spa...Symphony- a cumulative assessment tool for MSP at the 2nd Baltic Maritime Spa...
Symphony- a cumulative assessment tool for MSP at the 2nd Baltic Maritime Spa...
 
Flood Forecasting - Peter Gibbs
Flood Forecasting - Peter GibbsFlood Forecasting - Peter Gibbs
Flood Forecasting - Peter Gibbs
 
USDA/GIS Update - Data, Products & Services
USDA/GIS Update - Data, Products & ServicesUSDA/GIS Update - Data, Products & Services
USDA/GIS Update - Data, Products & Services
 
Estimation of water spread area using rs and gis
Estimation of water spread area using rs and gisEstimation of water spread area using rs and gis
Estimation of water spread area using rs and gis
 
Pan_European and pan-African Early Warning on Floods and Droughts: From the E...
Pan_European and pan-African Early Warning on Floods and Droughts: From the E...Pan_European and pan-African Early Warning on Floods and Droughts: From the E...
Pan_European and pan-African Early Warning on Floods and Droughts: From the E...
 
Modeling the water food-energy nexus in the Arab world: The NASA land informa...
Modeling the water food-energy nexus in the Arab world: The NASA land informa...Modeling the water food-energy nexus in the Arab world: The NASA land informa...
Modeling the water food-energy nexus in the Arab world: The NASA land informa...
 
2006-03-08 Intercontinental Aerosol Transport: Quantitative Tools an Results
2006-03-08 Intercontinental Aerosol Transport: Quantitative Tools an Results2006-03-08 Intercontinental Aerosol Transport: Quantitative Tools an Results
2006-03-08 Intercontinental Aerosol Transport: Quantitative Tools an Results
 
EcoTas13 BradEvans e-MAST
EcoTas13 BradEvans e-MASTEcoTas13 BradEvans e-MAST
EcoTas13 BradEvans e-MAST
 
SURF_Poster_REU2016Team1
SURF_Poster_REU2016Team1SURF_Poster_REU2016Team1
SURF_Poster_REU2016Team1
 

Similar to ICI-RAFT (presented at AMS 2012)

What You Need to Know About NOAA Atlas 14, Gregory Waller - National Oceanic ...
What You Need to Know About NOAA Atlas 14, Gregory Waller - National Oceanic ...What You Need to Know About NOAA Atlas 14, Gregory Waller - National Oceanic ...
What You Need to Know About NOAA Atlas 14, Gregory Waller - National Oceanic ...
TWCA
 
Percent Developed Imperviousness within the Fayetteville Arkansas Planning Area
Percent Developed Imperviousness within the Fayetteville Arkansas Planning AreaPercent Developed Imperviousness within the Fayetteville Arkansas Planning Area
Percent Developed Imperviousness within the Fayetteville Arkansas Planning Area
Thomas L Brown
 
DSD-INT 2015 - Hydrological forecasting and decision making in Australia - Ju...
DSD-INT 2015 - Hydrological forecasting and decision making in Australia - Ju...DSD-INT 2015 - Hydrological forecasting and decision making in Australia - Ju...
DSD-INT 2015 - Hydrological forecasting and decision making in Australia - Ju...
Deltares
 
International Journal of Computational Engineering Research(IJCER)
International Journal of Computational Engineering Research(IJCER)International Journal of Computational Engineering Research(IJCER)
International Journal of Computational Engineering Research(IJCER)
ijceronline
 
Application of water evaluation and planning (weap
Application of water evaluation and planning (weapApplication of water evaluation and planning (weap
Application of water evaluation and planning (weapjigme thinley
 
213180005 Seminar presentation.pptx
213180005 Seminar presentation.pptx213180005 Seminar presentation.pptx
213180005 Seminar presentation.pptx
KUNDESHWARPUNDALIK
 
Best Fit and Selection of Probability Distribution Models for Frequency Analy...
Best Fit and Selection of Probability Distribution Models for Frequency Analy...Best Fit and Selection of Probability Distribution Models for Frequency Analy...
Best Fit and Selection of Probability Distribution Models for Frequency Analy...
IJERD Editor
 
International Journal of Engineering Research and Development (IJERD)
International Journal of Engineering Research and Development (IJERD)International Journal of Engineering Research and Development (IJERD)
International Journal of Engineering Research and Development (IJERD)
IJERD Editor
 
Drought monitoring, Precipitation statistics, and water balance with freely a...
Drought monitoring, Precipitation statistics, and water balance with freely a...Drought monitoring, Precipitation statistics, and water balance with freely a...
Drought monitoring, Precipitation statistics, and water balance with freely a...
AngelosAlamanos
 
An Introduction to the Environment Agency extreme offshore wave, water level ...
An Introduction to the Environment Agency extreme offshore wave, water level ...An Introduction to the Environment Agency extreme offshore wave, water level ...
An Introduction to the Environment Agency extreme offshore wave, water level ...
Stephen Flood
 
Sea level rise and storm surge tools and datasets supporting Municipal Resili...
Sea level rise and storm surge tools and datasets supporting Municipal Resili...Sea level rise and storm surge tools and datasets supporting Municipal Resili...
Sea level rise and storm surge tools and datasets supporting Municipal Resili...
GrowSmart Maine
 
Academia: Richard Lawford, Morgan State University, 16th January UN Water Zar...
Academia: Richard Lawford, Morgan State University, 16th January UN Water Zar...Academia: Richard Lawford, Morgan State University, 16th January UN Water Zar...
Academia: Richard Lawford, Morgan State University, 16th January UN Water Zar...water-decade
 
Presentation of Four Centennial-long Global Gridded Datasets of the Standardi...
Presentation of Four Centennial-long Global Gridded Datasets of the Standardi...Presentation of Four Centennial-long Global Gridded Datasets of the Standardi...
Presentation of Four Centennial-long Global Gridded Datasets of the Standardi...
Agriculture Journal IJOEAR
 
Analysis of patterns of encroachment on flood vulnerable areas by settlements...
Analysis of patterns of encroachment on flood vulnerable areas by settlements...Analysis of patterns of encroachment on flood vulnerable areas by settlements...
Analysis of patterns of encroachment on flood vulnerable areas by settlements...
Alexander Decker
 
Inundation and Hazard Mapping on River Asa, using GIS
Inundation and Hazard Mapping on River Asa, using GISInundation and Hazard Mapping on River Asa, using GIS
Inundation and Hazard Mapping on River Asa, using GIS
Oyeniyi Samuel
 
SWaRMA_IRBM_Module2_#5, Role of hydrometeorological monitoring for IRBM in Ne...
SWaRMA_IRBM_Module2_#5, Role of hydrometeorological monitoring for IRBM in Ne...SWaRMA_IRBM_Module2_#5, Role of hydrometeorological monitoring for IRBM in Ne...
SWaRMA_IRBM_Module2_#5, Role of hydrometeorological monitoring for IRBM in Ne...
ICIMOD
 
Hydrological modelling
Hydrological modellingHydrological modelling
Hydrological modelling
Bharath Viswakarma
 
Floodplain Modelling Materials and Methodology
Floodplain Modelling Materials and MethodologyFloodplain Modelling Materials and Methodology
Floodplain Modelling Materials and Methodology
IDES Editor
 

Similar to ICI-RAFT (presented at AMS 2012) (20)

What You Need to Know About NOAA Atlas 14, Gregory Waller - National Oceanic ...
What You Need to Know About NOAA Atlas 14, Gregory Waller - National Oceanic ...What You Need to Know About NOAA Atlas 14, Gregory Waller - National Oceanic ...
What You Need to Know About NOAA Atlas 14, Gregory Waller - National Oceanic ...
 
Percent Developed Imperviousness within the Fayetteville Arkansas Planning Area
Percent Developed Imperviousness within the Fayetteville Arkansas Planning AreaPercent Developed Imperviousness within the Fayetteville Arkansas Planning Area
Percent Developed Imperviousness within the Fayetteville Arkansas Planning Area
 
DSD-INT 2015 - Hydrological forecasting and decision making in Australia - Ju...
DSD-INT 2015 - Hydrological forecasting and decision making in Australia - Ju...DSD-INT 2015 - Hydrological forecasting and decision making in Australia - Ju...
DSD-INT 2015 - Hydrological forecasting and decision making in Australia - Ju...
 
International Journal of Computational Engineering Research(IJCER)
International Journal of Computational Engineering Research(IJCER)International Journal of Computational Engineering Research(IJCER)
International Journal of Computational Engineering Research(IJCER)
 
Application of water evaluation and planning (weap
Application of water evaluation and planning (weapApplication of water evaluation and planning (weap
Application of water evaluation and planning (weap
 
213180005 Seminar presentation.pptx
213180005 Seminar presentation.pptx213180005 Seminar presentation.pptx
213180005 Seminar presentation.pptx
 
Best Fit and Selection of Probability Distribution Models for Frequency Analy...
Best Fit and Selection of Probability Distribution Models for Frequency Analy...Best Fit and Selection of Probability Distribution Models for Frequency Analy...
Best Fit and Selection of Probability Distribution Models for Frequency Analy...
 
International Journal of Engineering Research and Development (IJERD)
International Journal of Engineering Research and Development (IJERD)International Journal of Engineering Research and Development (IJERD)
International Journal of Engineering Research and Development (IJERD)
 
Drought monitoring, Precipitation statistics, and water balance with freely a...
Drought monitoring, Precipitation statistics, and water balance with freely a...Drought monitoring, Precipitation statistics, and water balance with freely a...
Drought monitoring, Precipitation statistics, and water balance with freely a...
 
An Introduction to the Environment Agency extreme offshore wave, water level ...
An Introduction to the Environment Agency extreme offshore wave, water level ...An Introduction to the Environment Agency extreme offshore wave, water level ...
An Introduction to the Environment Agency extreme offshore wave, water level ...
 
AAG Chicago 2015 Hernandez
AAG Chicago 2015 HernandezAAG Chicago 2015 Hernandez
AAG Chicago 2015 Hernandez
 
Sea level rise and storm surge tools and datasets supporting Municipal Resili...
Sea level rise and storm surge tools and datasets supporting Municipal Resili...Sea level rise and storm surge tools and datasets supporting Municipal Resili...
Sea level rise and storm surge tools and datasets supporting Municipal Resili...
 
FloodRiskAnalysis
FloodRiskAnalysisFloodRiskAnalysis
FloodRiskAnalysis
 
Academia: Richard Lawford, Morgan State University, 16th January UN Water Zar...
Academia: Richard Lawford, Morgan State University, 16th January UN Water Zar...Academia: Richard Lawford, Morgan State University, 16th January UN Water Zar...
Academia: Richard Lawford, Morgan State University, 16th January UN Water Zar...
 
Presentation of Four Centennial-long Global Gridded Datasets of the Standardi...
Presentation of Four Centennial-long Global Gridded Datasets of the Standardi...Presentation of Four Centennial-long Global Gridded Datasets of the Standardi...
Presentation of Four Centennial-long Global Gridded Datasets of the Standardi...
 
Analysis of patterns of encroachment on flood vulnerable areas by settlements...
Analysis of patterns of encroachment on flood vulnerable areas by settlements...Analysis of patterns of encroachment on flood vulnerable areas by settlements...
Analysis of patterns of encroachment on flood vulnerable areas by settlements...
 
Inundation and Hazard Mapping on River Asa, using GIS
Inundation and Hazard Mapping on River Asa, using GISInundation and Hazard Mapping on River Asa, using GIS
Inundation and Hazard Mapping on River Asa, using GIS
 
SWaRMA_IRBM_Module2_#5, Role of hydrometeorological monitoring for IRBM in Ne...
SWaRMA_IRBM_Module2_#5, Role of hydrometeorological monitoring for IRBM in Ne...SWaRMA_IRBM_Module2_#5, Role of hydrometeorological monitoring for IRBM in Ne...
SWaRMA_IRBM_Module2_#5, Role of hydrometeorological monitoring for IRBM in Ne...
 
Hydrological modelling
Hydrological modellingHydrological modelling
Hydrological modelling
 
Floodplain Modelling Materials and Methodology
Floodplain Modelling Materials and MethodologyFloodplain Modelling Materials and Methodology
Floodplain Modelling Materials and Methodology
 

ICI-RAFT (presented at AMS 2012)

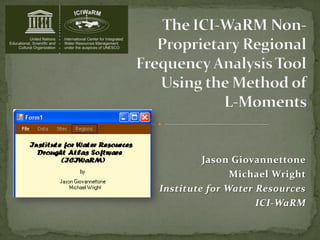
  • 1. Jason Giovannettone Michael Wright Institute for Water Resources ICI-WaRM
  • 2. Objective: Develop a free tool that uses available rainfall data to create rainfall frequency maps. • Useful in arid & semi-arid regions. • Many developing countries are located in dry regions. • Maps assist in identifying areas vulnerable to climate change impacts on precipitation. • Overall Result: Assist in long-range planning for arid developing countries where changes in rainfall due to climate change can be expected.
  • 3. • Taken from Schafer et al. (2007). “Regional precipitation-frequency analysis and spatial mapping of 24-hour precipitation for Oregon,” prepared by MGS Engineering Consultants, Inc. for the Oregon State Department of Transportation, 84 pp.
  • 4. ICIWaRM: International Center for Integrated Water Resources Management. • Category 2 UNESCO center headquartered at the Institute for Water Resources • Consortium of universities, U.S. gov’t agencies, & NGOs supporting UNESCO’s IHP strategic program. • Software supports ICIWaRM mission of aiding developing countries in water resources management & contributing to developing non- proprietary analytical tools.
  • 5.  L-moments are the statistics used to determine the exact shape of the regional frequency.  L-Mean, L-Coefficient of Variation, L- Skew, L-Kurtosis  Developed by John Hosking & James Wallis
  • 6.  Regional rainfall frequency analysis is performed by grouping rainfall data from multiple sites with similar frequency distributions.  Caution must be exercised in determining regions (e.g. Are sites only located on rivers?)
  • 7.  A drought (rainfall frequency) atlas is a collection of maps/statistics that reveals the spatial distribution of storm intensities for particular frequencies.
  • 8.
  • 9.  Choose a period to analyze.  Beginning month = February.  Period duration = February – April.  Each site requires 40 good periods of data to be used.
  • 10.
  • 11.
  • 12.
  • 13.
  • 14.  A graph of t4 vs. t3 gives an initial impression of which distribution may fit the data best.
  • 15.  The probability distribution function (PDF) for the region can be fit with up to 13 frequency distributions.
  • 16.  The Cumulative Distribution Function (CDF) of the PDF is used to compute the Exceedance Curve. This curve gives the intensity of rain events with frequencies between 1 year up to 1000 years.
  • 17. For droughts that occur every 20 years, how much total precipitation can be expected over 5 years?  Source: NOAA’s Global Histórical Climatology Network  As can be seen here, more data sites are needed to improve resolution and smoothness of contours.