This document summarizes a simulation study of miscible CO2 flooding in stratified reservoirs. The study used reservoir simulation software to model CO2 flooding under different conditions. Key findings include:
1) CO2 flooding performance improved with higher injection rates and when layers had higher permeability at shallower depths (fining upward).
2) Limited communication between layers led to better recovery, as gravity effects were reduced.
3) Optimizing water-alternating-gas injection parameters like ratio, cycle length, and slug size improved recovery in stratified reservoirs with limited CO2 sources.
![2 ICCPGE 234
______________________________________________________________________________
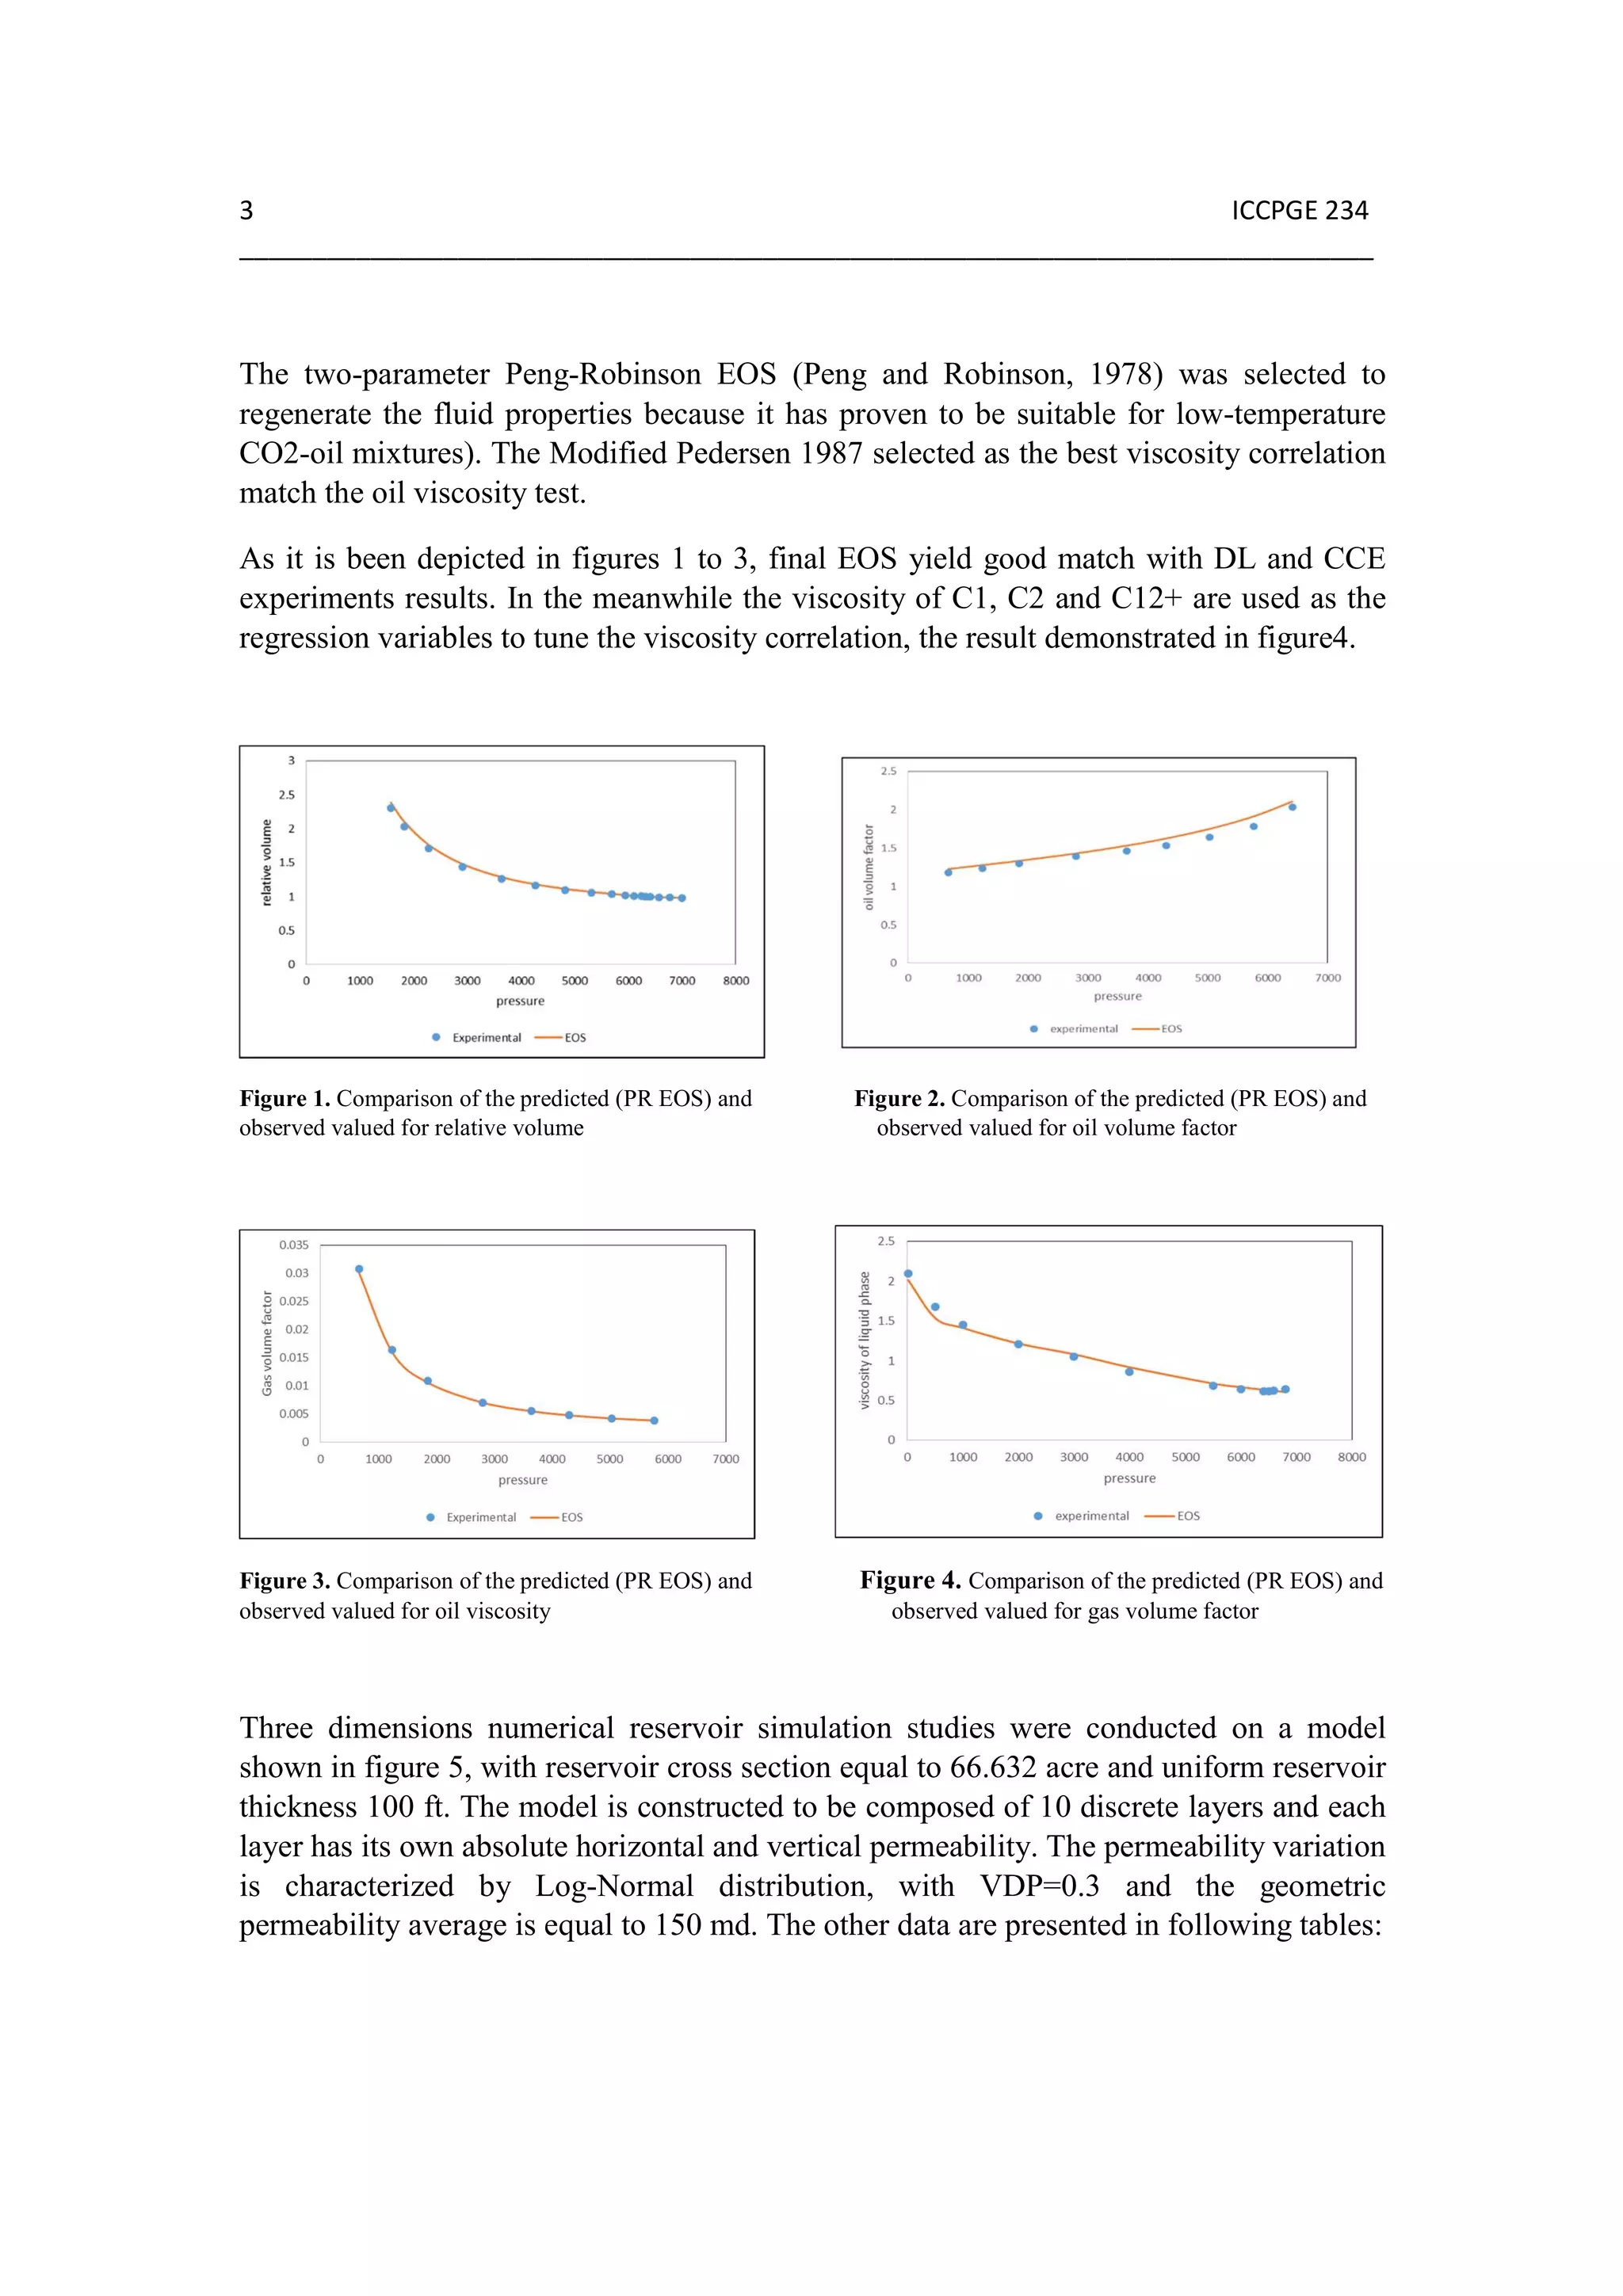
oil swelling, reduce oil viscosity; also wetability modification. The gas flooding can be
classified into miscible and immiscible, the miscible flood means no more interface
between gas and in-situ hydrocarbon, interfacial tension (IFT) = 0, either at the front or
back of the floo [ ]
.
Generally the miscible displacement process maintains reservoir pressure and improves oil
displacement because the interfacial tension lowering. The fluid most commonly used for
miscible displacement is carbon dioxide because it reduces the oil viscosity and is less
expensive than liquefied petroleum gas. Oil displacement by carbon dioxide injection relies
on the phase behavior of the mixtures of that gas and the crude, these behaviors are strongly
dependent on reservoir temperature, pressure and crude oil composition. To get the
miscibility should keep the pressure above minimum miscible pressure (MMP) and it’s the
lowest pressure at which the interfacial tension between a pair of fluids vanishe [ ]
.
WAG water alternative miscible gas injection has proven its applicability to improve oil
recovery compared to pure water injection or pure gas injection. WAG injection can
improves oil recovery by better sweep efficiency on both macroscopic and microscopic
levels compared to gas injection or water flooding alone. In general the water alternative
gas injection process it can be divided into miscible and immiscible displacement
proces [ ]
.
The efficiency is due to the advantages offered by this technique, including:
• Controls mobility (reduces Gas processing)
• Improves operation (less gas cycling)
• Improve residual oil recovery
Methodology:
Basically the research start with constructing a compositional reservoir simulation model
based on EOS derived from PVT report of well (A-78) given by Melletah oil Company,
the PVT laboratory data contain differential liberation (DL), constant composition
expansion (CCE) and pressure saturation tests. Those results were used to tune the EOS to
be capable of characterizing the CO2-hydrocarbon system above the MMP. The reservoir
oil is undersaturated light oil, see table 1, with stock tank gravity of 38.2 API, the CO2
minimum miscibility pressure (MMP) was determined to approximately be 6040psia.
Table 1. Semi-detailed composition of monophasic fluid
Component CO2 N2 C1 C2 C3 I-C4 N-C4 I-C5
Composition 4.83 0.19 60.21 10.83 3.21 0.69 0.99 0.47
Component N-C5 I-C6 C7 C8 C9 C10 C11 C12+
Composition 0.55 1.18 1.54 1.74 1.17 1.01 0.89 10.5](https://image.slidesharecdn.com/42e7f38c-10fd-4939-a9c5-bad8f738e91b-160902101655/75/ICCPGE-2-2048.jpg)
![7 ICCPGE 234
______________________________________________________________________________
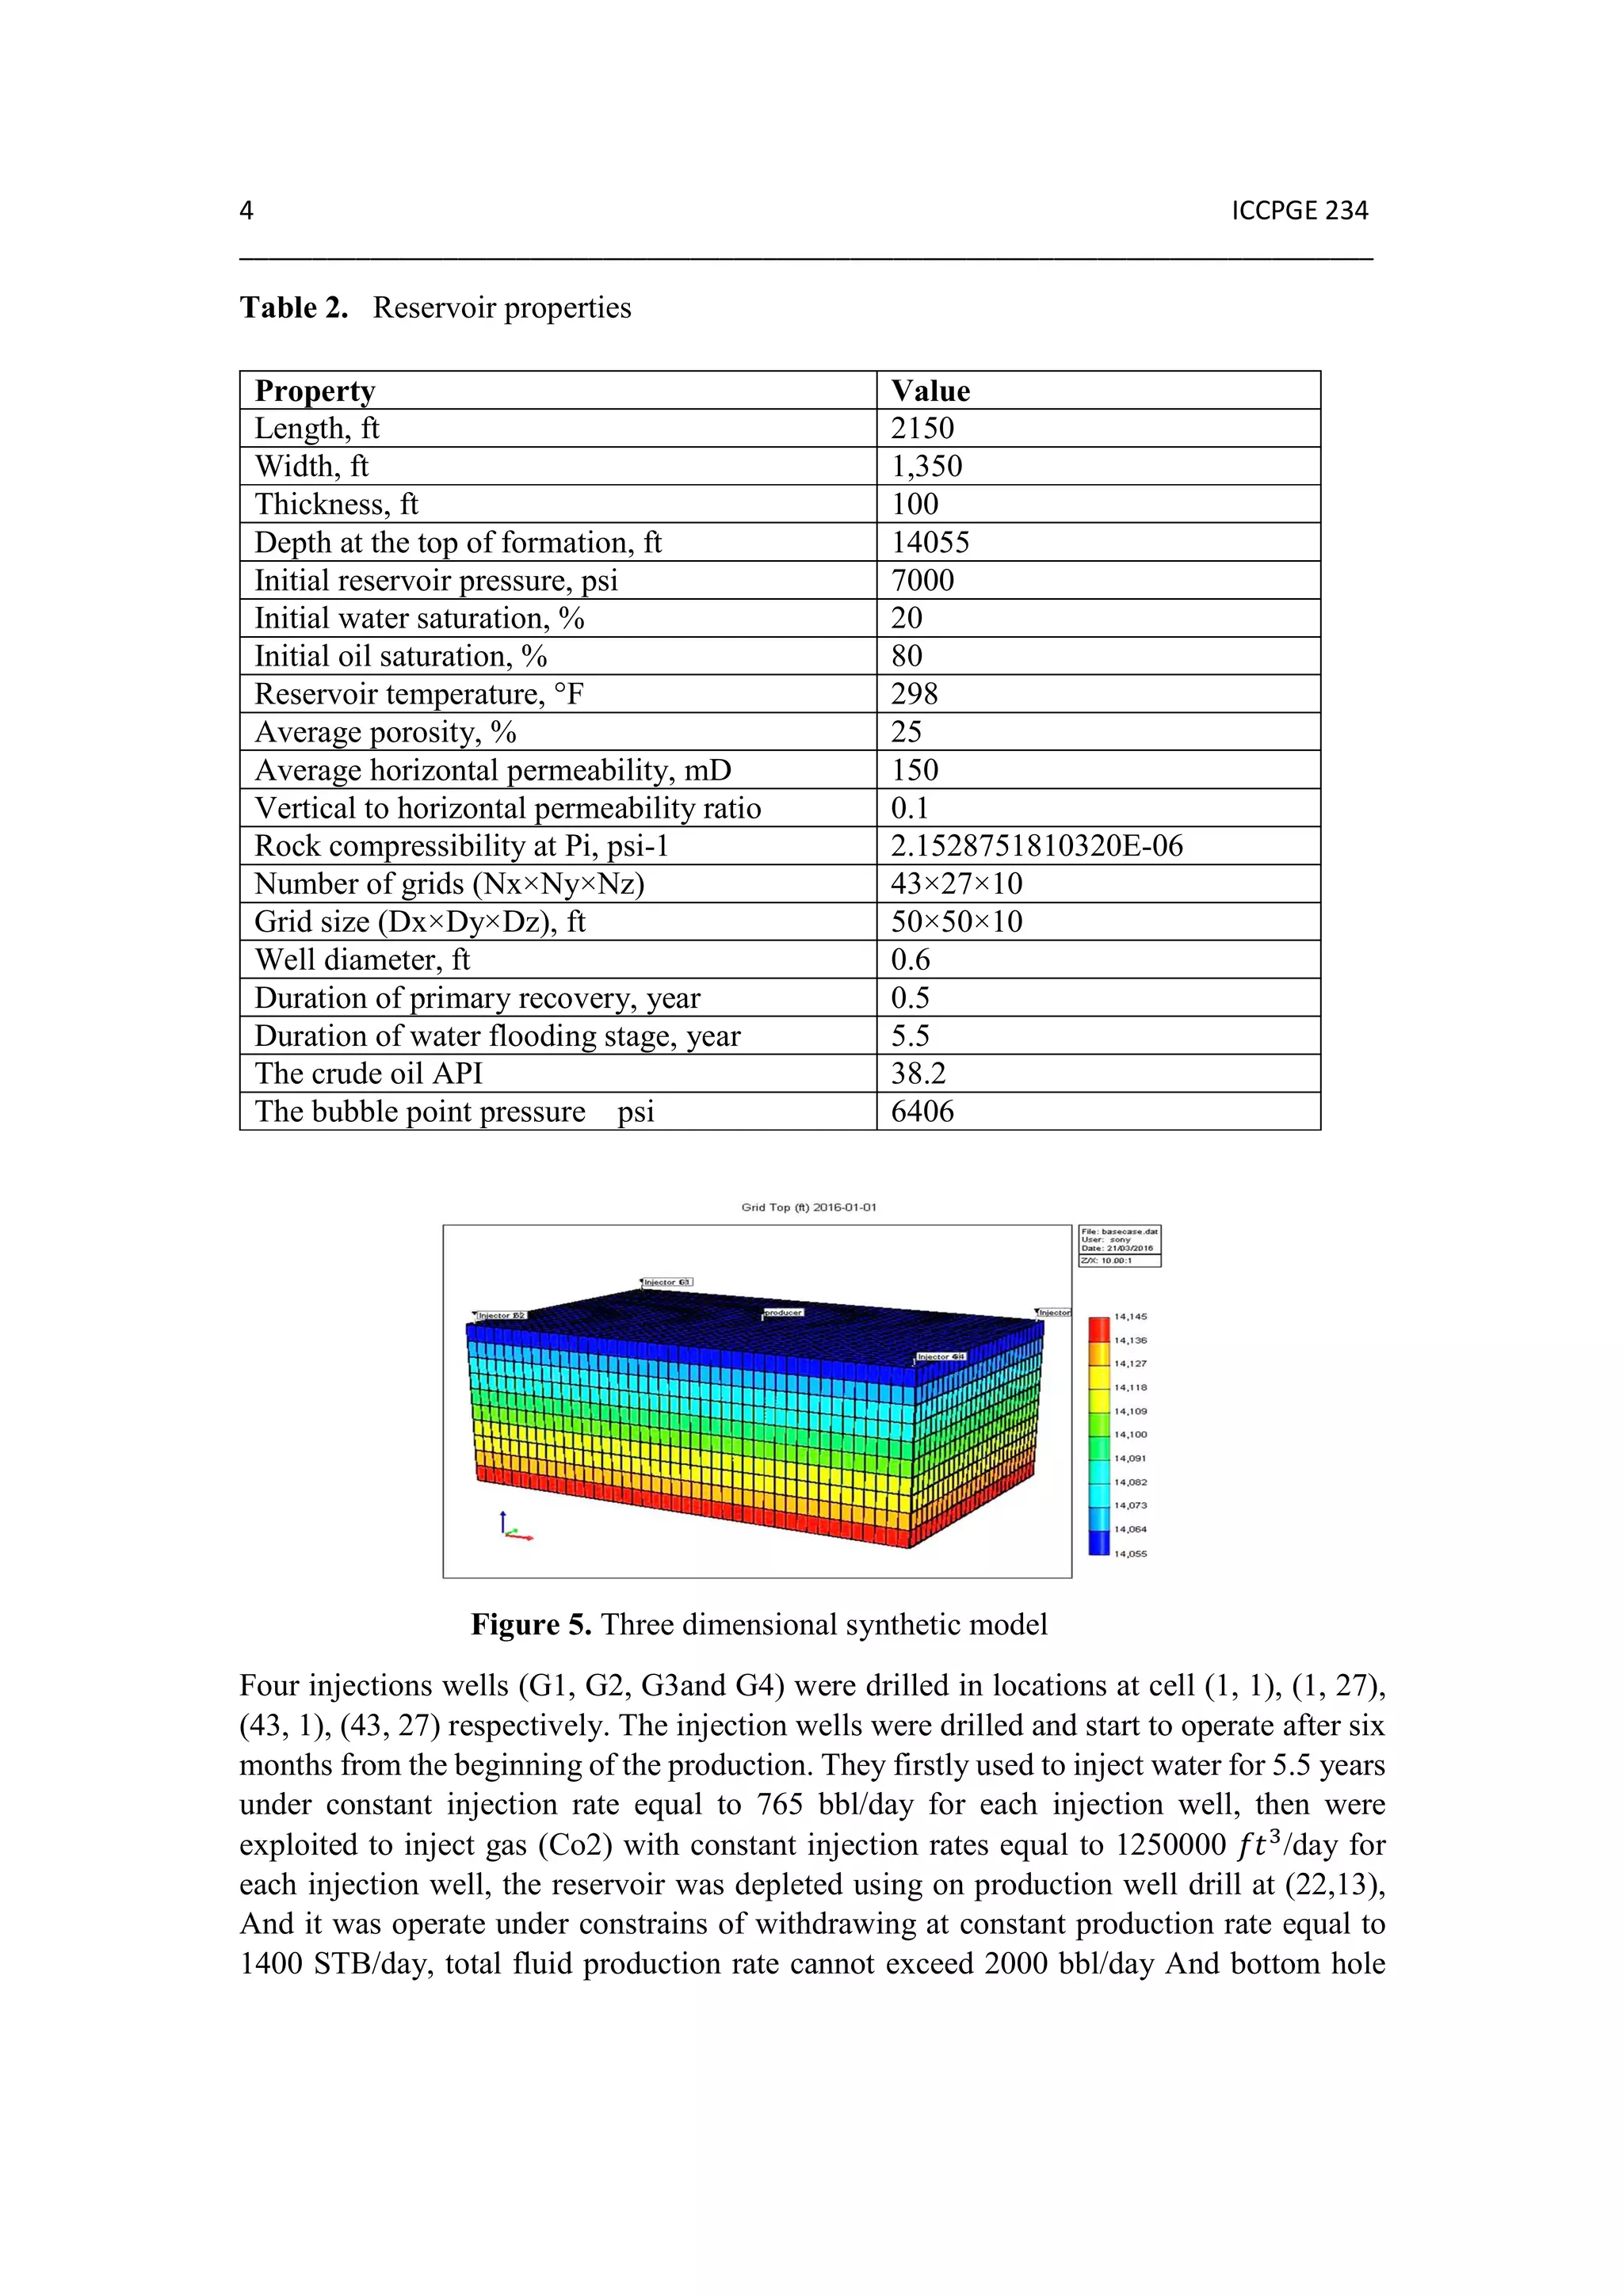
Table 3. Distribution of permeability on reservoir layers
Permeability
md
Fining
downward
Fining
upward
Random
1
Random
2
Random
3
Random
4
Random
5
301.782 1 10 3 6 5 9 8
226.091 2 9 7 5 10 1 3
196.384 3 8 5 7 9 10 4
176.352 4 7 2 10 6 5 9
160.467 5 6 9 8 2 7 1
146.682 6 5 10 4 1 3 2
133.885 7 4 1 9 8 6 10
121.198 8 3 4 1 7 2 6
107.478 9 2 6 3 4 8 7
89.7646 10 1 8 2 3 4 5
• Continuous Co2 injection and miscible Co2 WAG optimizing:
The above mentioned studies are followed by optimizing WAG technique. The sensitivity
analysis was designed to include wide range of parameters to predict the best scenario of
displacement such as slug size, WAG ratio, WAG length and gas injection rate
In typical gas injection processes, the mobility ratio between injected gas and the displaced
oil bank is very unfavorable because of low viscosity of the injected fluids. This lead to
viscous fingering (abridged breakthrough) and reduced sweep efficiency. To overcome
these problems, alternating injection of gas and water with specified volume, known as the
WAG process, has been develope [ ]
.
In WAG process, injection of water as a slightly incompressible fluid can maintain the
reservoir pressure level, which is necessary for developing the miscibility between gas and
oil with acceleration of gas solubility in oil (and therefore oil viscosity reduction). Because
of the density contrast, the injected gas and water usually tend to sweep different portions
of the reservoir. The upper portion of the pore space will tend to be swept by gas while
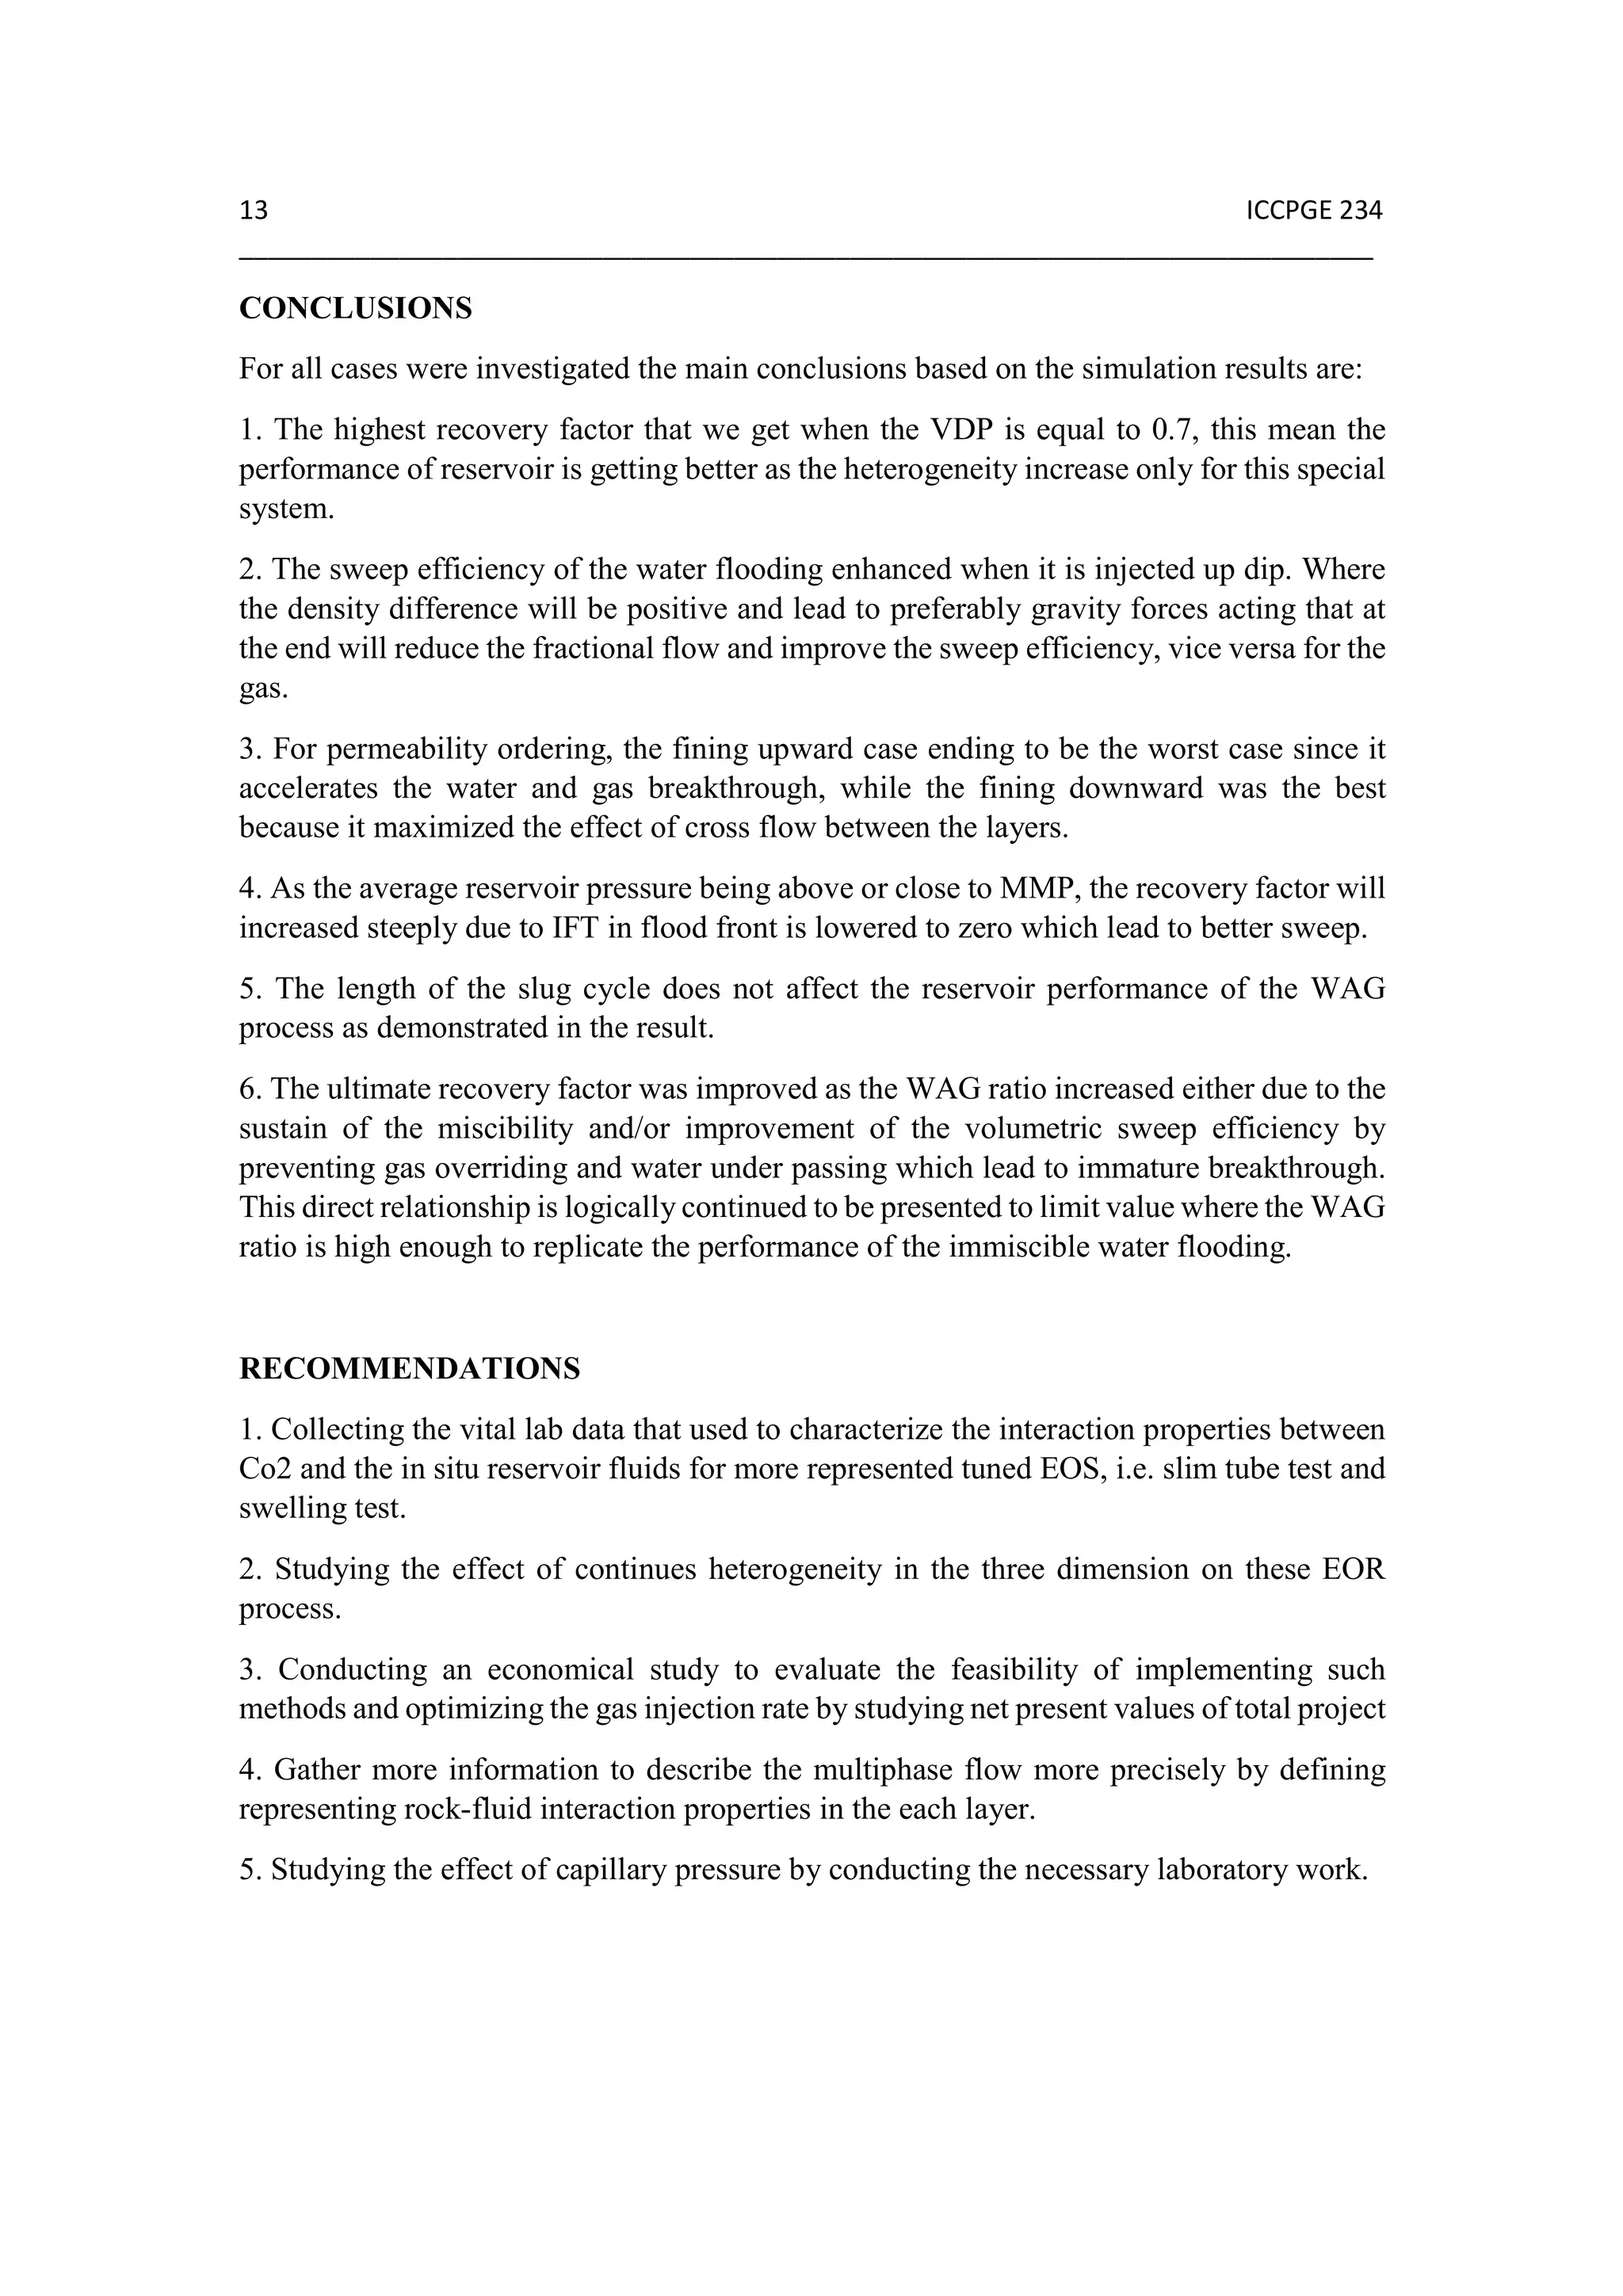
water will push the oil in the lower parts. In order to optimize the WAG process, there are
several parameters that should be designed carefully such as WAG Ratio, cycle length and
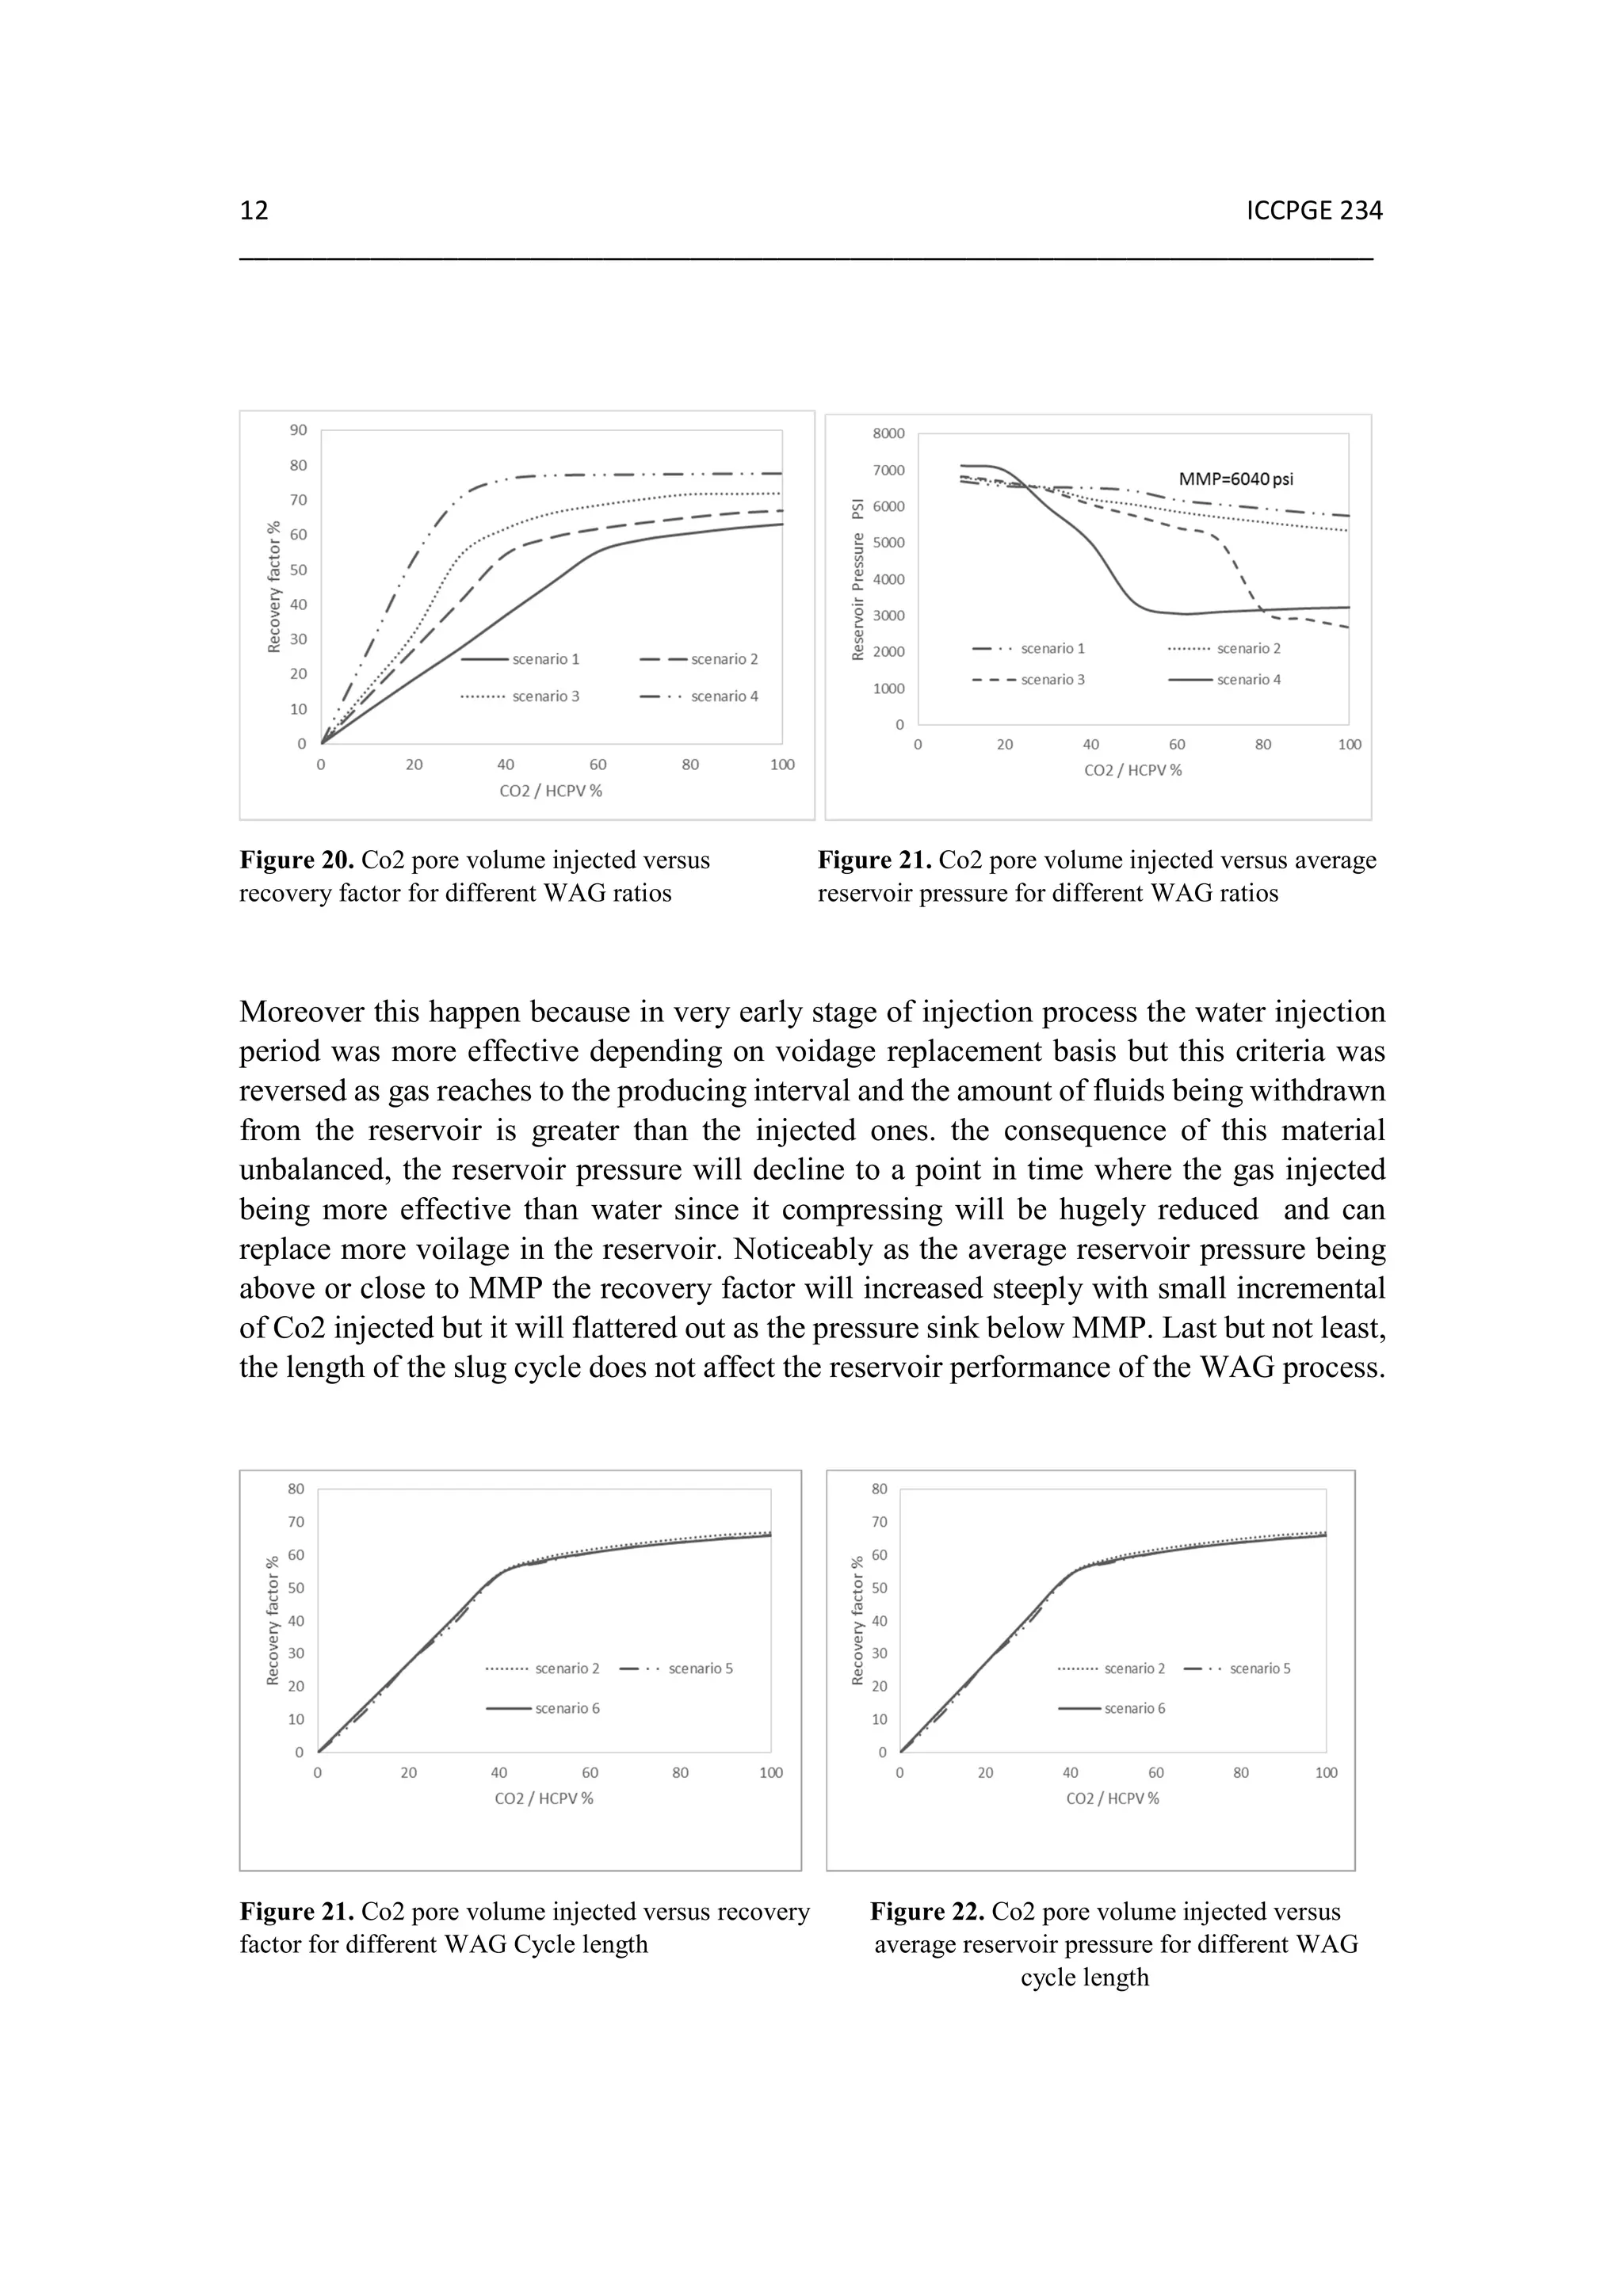
slug size. To study the effect of WAG ratio on recovery for this specific reservoir model,
four cases with WAG ratio of 0.5, 1.0, 2.0 and 0 (continuous CO2 injection) were
considered. Each injection scenario will be continued until the HCPV of injected CO2
reaches 1.0. To consider the effect of cycle length, an additional two cases for the WAG](https://image.slidesharecdn.com/42e7f38c-10fd-4939-a9c5-bad8f738e91b-160902101655/75/ICCPGE-7-2048.jpg)
![8 ICCPGE 234
______________________________________________________________________________
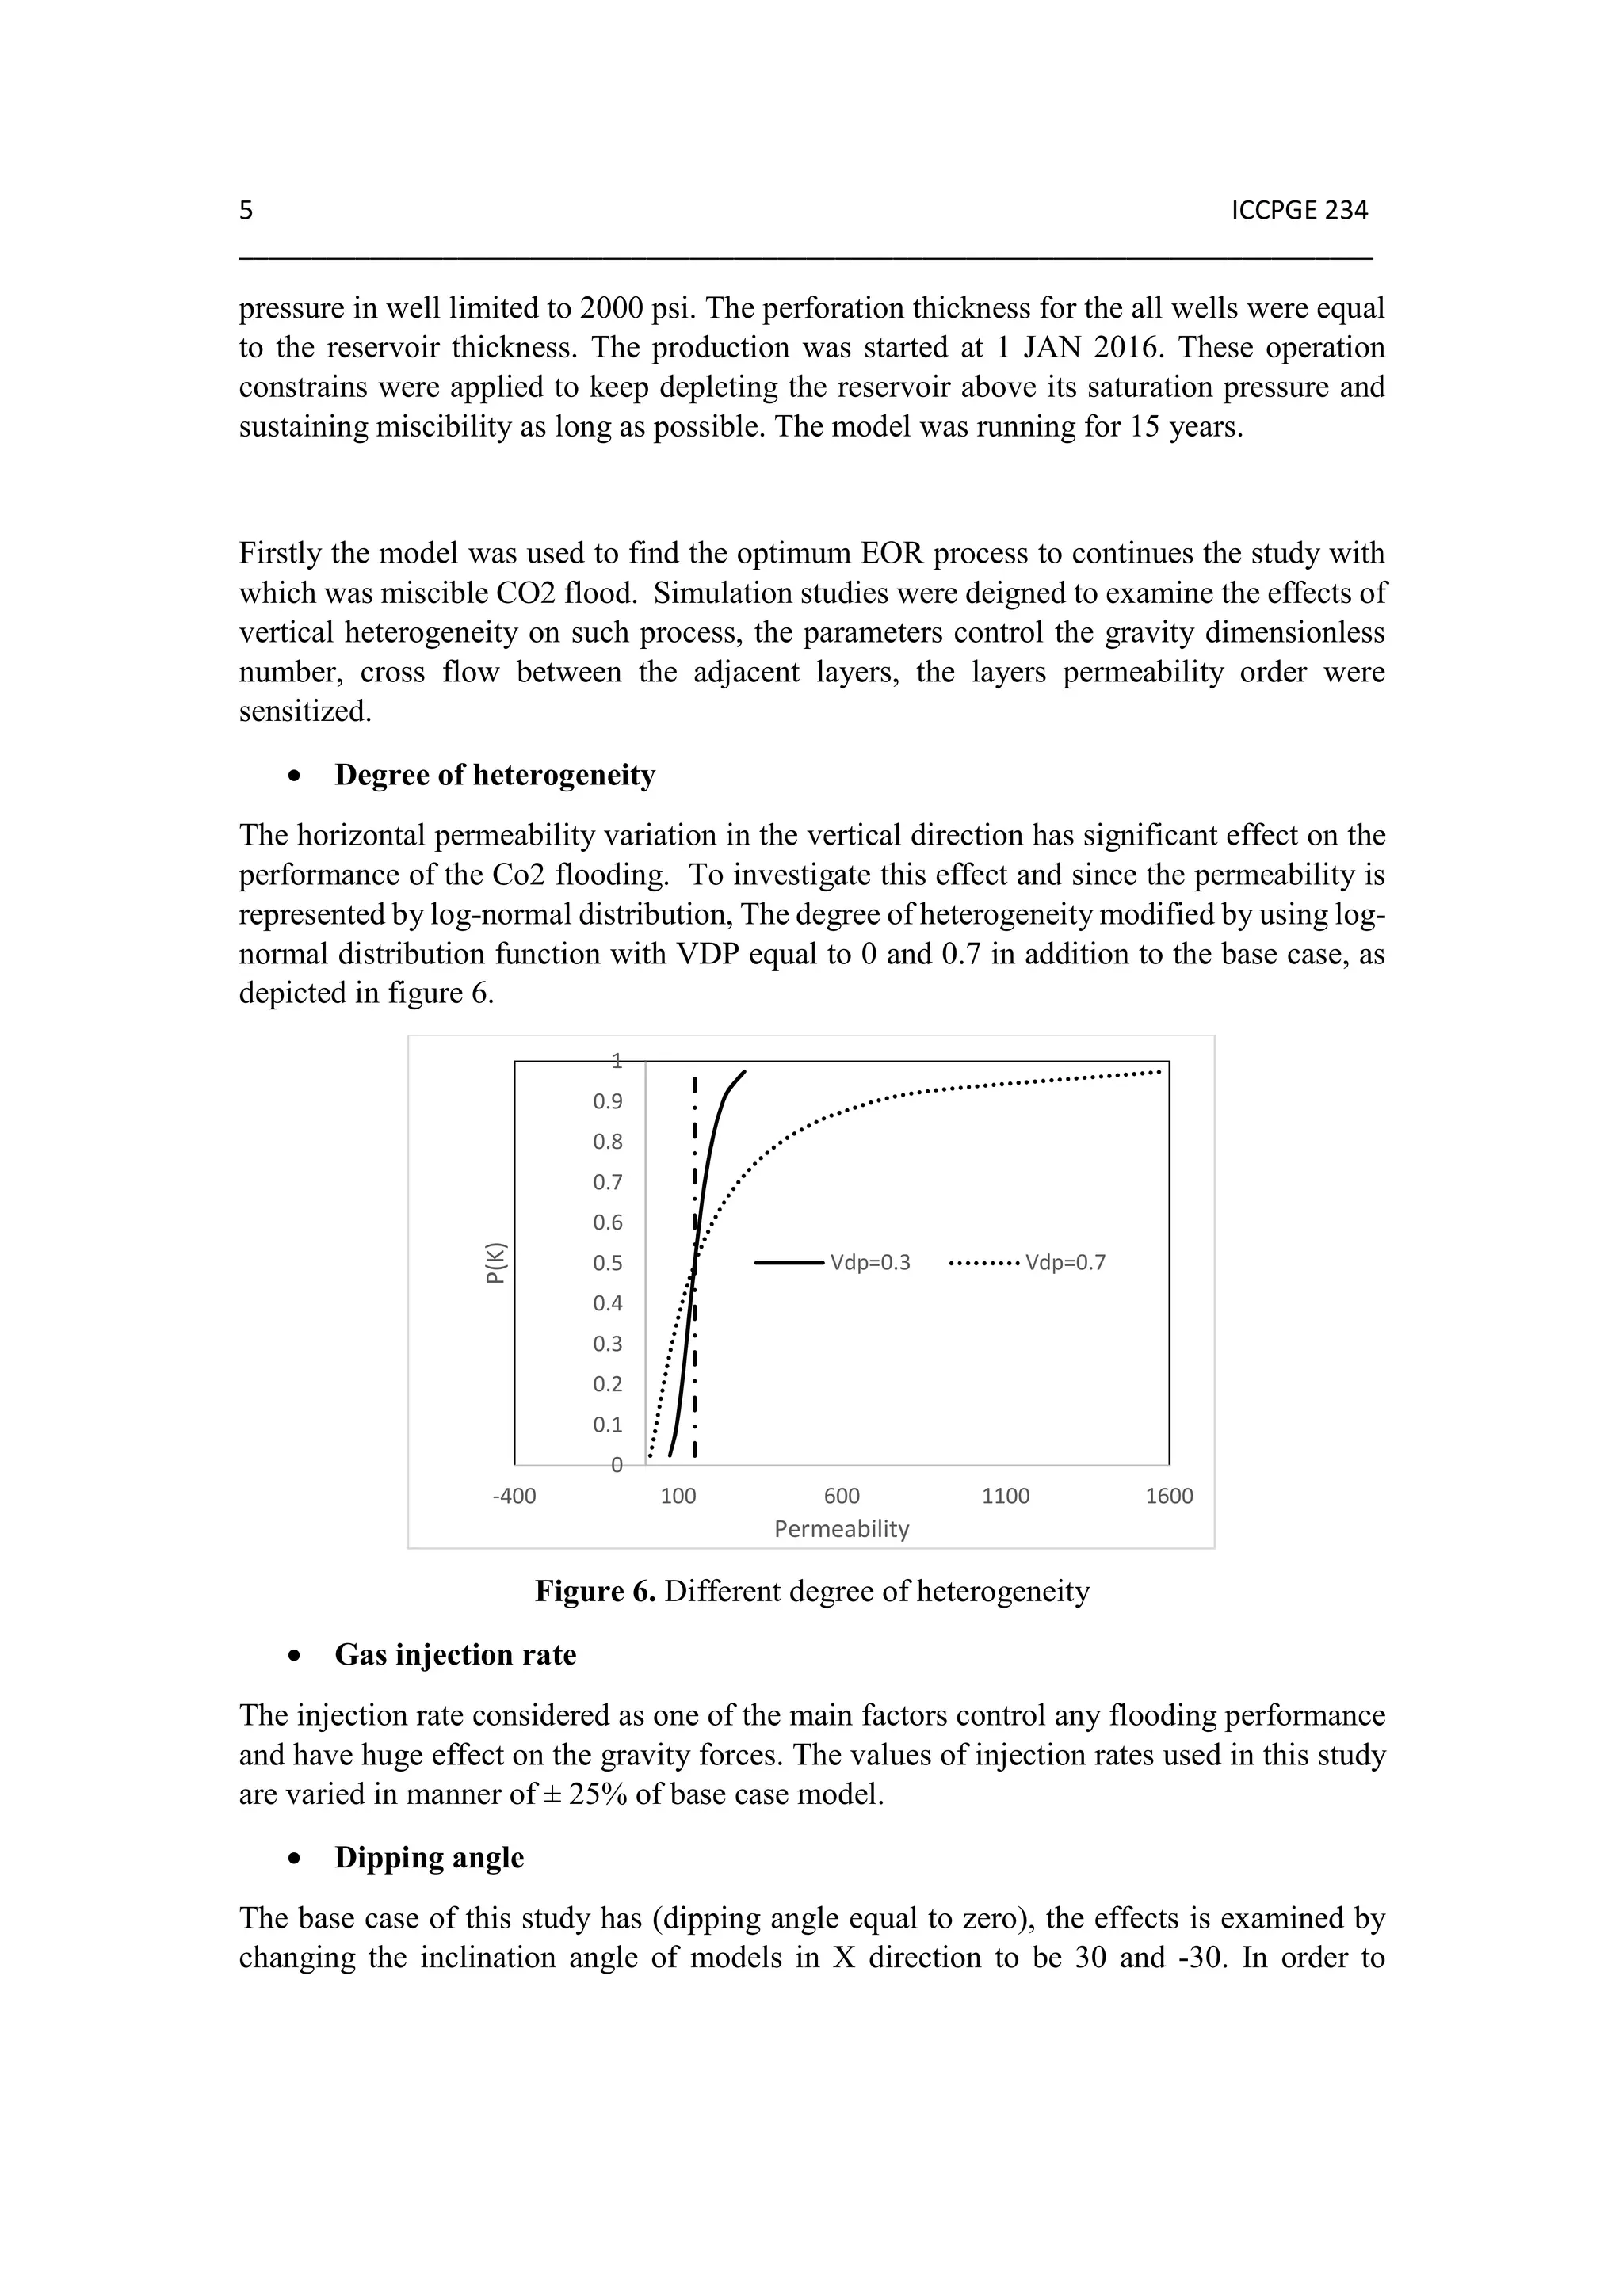
ratio of 0.5 will be provided. Table 4 provides a summary of the injection scheme in each
case. The injection rate of fluids is however fixed at 1400 rbbl/day except for all scenarios.
Table 4. Summary of WAG injection scheme in each case
Inj. scenario WAG ratio WAG cycle
length
CO2 inj. length Water inj.
length
[fraction] [months] [months] [months]
1 0 NA NA NA
2 0.5 18 12 6
3 1.0 18 9 9
4 2.0 18 6 12
5 0.5 12 8 4
6 0.5 9 6 3
Simulation results and discussions
Compositional simulation model was used to simulate some enhanced oil recovery
methods, examining their mechanisms of improving the ultimate oil recovery and studying
the effects of the degree of heterogeneity on these techniques performance. The results are
classified based on purpose of study to:
o Result of degree of heterogeneity
The effect of the degree of heterogeneity is obvious on recovery factor, depicted in figure
9, the less recovery factor that we get it when the VDP is equal to 0 and the highest recovery
factor when the VDP is equal to 0.7, this mean the performance of reservoir is getting better
as the heterogeneity increase. The strange response is established due to the reservoir is
layered with coarsen upward permeability- depth configurations with vertical permeability
being set as 10% of the perm J values.
Figure 9. Sensitivity for degree of heterogeneity Figure 10. Sensitivity for degree of heterogeneity
on the recovery factor on the reservoir pressure](https://image.slidesharecdn.com/42e7f38c-10fd-4939-a9c5-bad8f738e91b-160902101655/75/ICCPGE-8-2048.jpg)
![14 ICCPGE 234
______________________________________________________________________________
References:
[1] - Christensen, J R, Stenby, E H, Skauge , A, “Review of the WAG field experience”,
SPE 71203, revised paper 39883, presented at the 1998 SPE International petroleum
Conference and exhibition of Mexico, Villhermosa, March 3-5, 1998. Paper peer approved
22 January 2001
[2] - M. K. Zahoor, M. N. Derahman, and M. H. Yunan, “Wag Process Design – an Updated
Review,” Brazilian J. Pet. Gas, vol. 5, no. 2, pp. 109–121, 2011.
[3]- Don W. Green, G. Paul Willhite, Enhanced Oil Recovery Henry L. Doherty Memorial
Fund of AIME, Society of Petroleum Engineers, 1998.](https://image.slidesharecdn.com/42e7f38c-10fd-4939-a9c5-bad8f738e91b-160902101655/75/ICCPGE-14-2048.jpg)


