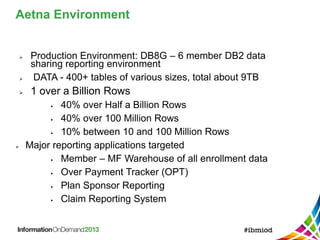
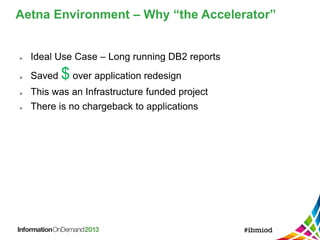
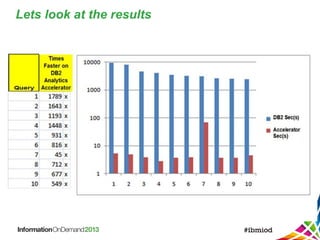
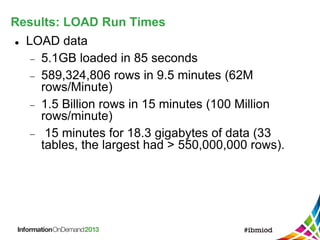
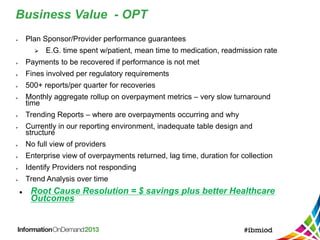
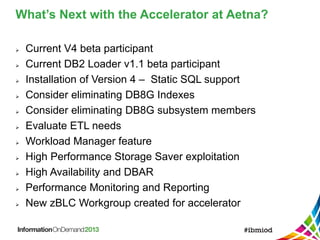
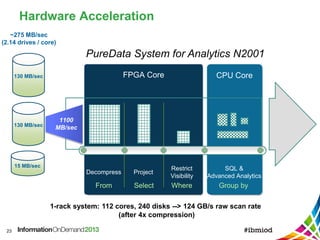
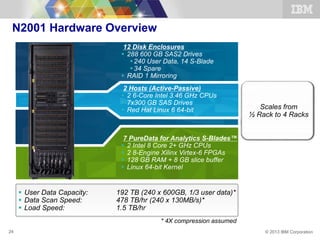
Aetna uses IBM's DB2 Analytics Accelerator to improve the performance of long-running reports on its DB2 database. The accelerator offloads eligible queries to the Netezza appliance, reducing query times from hours to seconds. Aetna saw a 4x compression rate on its data and was able to load 1.5 billion rows in 15 minutes. Reports that previously timed out after 82 minutes now return results in 27 seconds, improving business users' ability to analyze data.
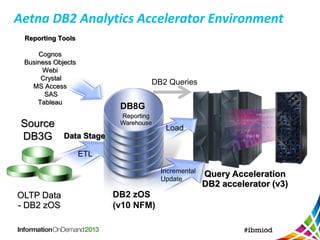
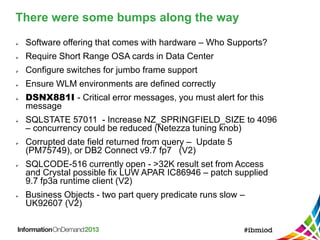
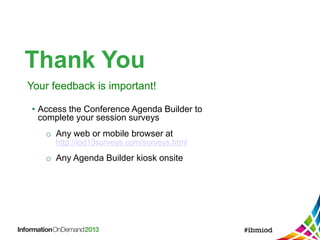
![There were some bumps along the way
(Below are V3 Netezza)
Reason Code 00D35011 on accelerated query PM90148 10/26
Includes 35 ptf’s
Accelerator stopping for no apparent reason New GUI V3 PTF3
UK96194
Query performance degrading when replication is enabled.
APARFIX PTF 3 prereq
Query statistics being reset PTF4
Accelerated query failing [57011] frequency statistics on the
Netezza-resident objects needed manual update](https://image.slidesharecdn.com/insight2013-aetnasproductionexperienceusingibmdb2analyticsaccelerator-161127194913/85/IBM-Insight-2013-Aetna-s-production-experience-using-IBM-DB2-Analytics-Accelerator-19-320.jpg)


![[DBA]_HiramFleitas_SQL_PASS_Summit_2017_Summary](https://cdn.slidesharecdn.com/ss_thumbnails/dbahiramfleitassqlpasssummit2017summary-180202201153-thumbnail.jpg?width=640&height=640&fit=bounds)


