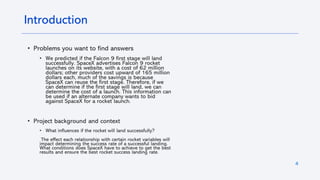
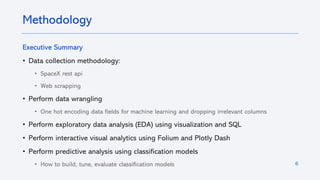
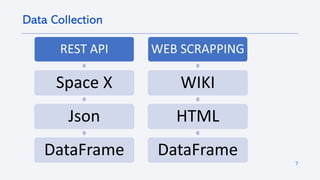
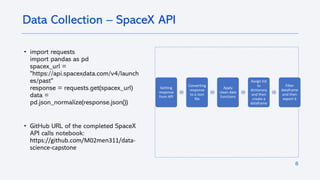
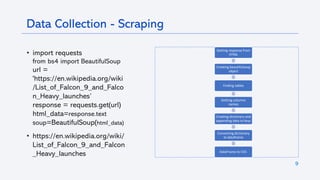
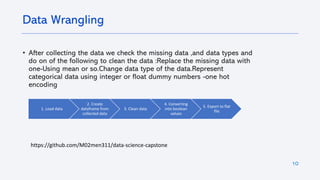
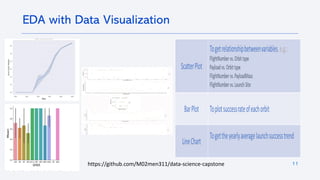
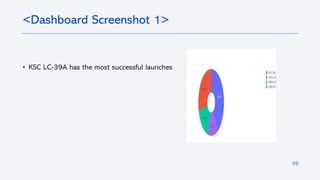
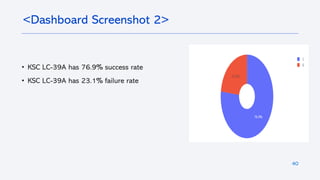
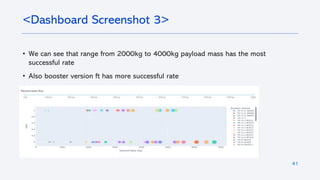
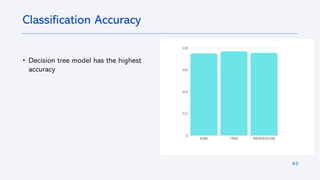
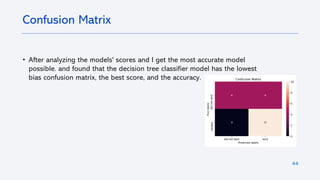
Mo’men abdelhady
20 DEC 2023
2
• Executive Summary
• Introduction
• Methodology
• Results
• Conclusion
• Appendix
Outline
3
• Summary of methodologies
• Data collection.
• Data wrangling.
• EDA with data visualization and sql.
• Building an interactive map with
folium.
• Building a dashboard with plotly dash.
• Predictive analysis (correlation).
• Summary of all results
• Exploratory data analysis results.
• Interactive analytics screenshots.
• Predictive analytics results.
Executive Summary
4
Introduction
• Problems you want to find answers
• We predicted if the Falcon 9 first stage will land
successfully. SpaceX advertises Falcon 9 rocket
launches on its website, with a cost of 62 million
dollars; other providers cost upward of 165 million
dollars each, much of the savings is because
SpaceX can reuse the first stage. Therefore, if we
can determine if the first stage will land, we can
determine the cost of a launch. This information can
be used if an alternate company wants to bid
against SpaceX for a rocket launch.
• Project background and context
• What influences if the rocket will land successfully?
The effect each relationship with certain rocket variables will
impact determining the success rate of a successful landing.
What conditions does SpaceX have to achieve to get the best
results and ensure the best rocket success landing rate.
5
Section 1
6
Executive Summary
• Data collection methodology:
• SpaceX rest api
• Web scrapping
• Perform data wrangling
• One hot encoding data fields for machine learning and dropping irrelevant columns
• Perform exploratory data analysis (EDA) using visualization and SQL
• Perform interactive visual analytics using Folium and Plotly Dash
• Perform predictive analysis using classification models
• How to build, tune, evaluate classification models
Methodology
7
Data Collection
REST API
Space X
Json
DataFrame
WEB SCRAPPING
WIKI
HTML
DataFrame
8
• import requests
import pandas as pd
spacex_url =
"https://api.spacexdata.com/v4/launch
es/past"
response = requests.get(spacex_url)
data =
pd.json_normalize(response.json())
• GitHub URL of the completed SpaceX
API calls notebook:
https://github.com/M02men311/data-
science-capstone
Data Collection – SpaceX API
Getting
response
from API
Converting
response
to a Json
file
Apply
clean data
functions
Assign list
to
dictionary
and then
create a
dataframe
Filter
dataframe
and then
export it
9
• import requests
from bs4 import BeautifulSoup
url =
'https://en.wikipedia.org/wiki
/List_of_Falcon_9_and_Falco
n_Heavy_launches’
response = requests.get(url)
html_data=response.text
soup=BeautifulSoup(html_data)
• https://en.wikipedia.org/wiki/
List_of_Falcon_9_and_Falcon
_Heavy_launches
Data Collection - Scraping
Getting response from
HTML
Creating beautifulsoup
object
Finding tables
Getting columns
names
Creating dictionary and
appending data to keys
Converting dictionary
to dataframe
DataFrame to CSV.
10
• After collecting the data we check the missing data ,and data types and
do on of the following to clean the data :Replace the missing data with
one-Using mean or so.Change data type of the data.Represent
categorical data using integer or float dummy numbers -one hot
encoding
Data Wrangling
1. Load data
2. Create
dataframe from
collected data
3. Clean data
4. Converting
into boolean
values
5. Export to flat
file
https://github.com/M02men311/data-science-capstone
11
EDA with Data Visualization
https://github.com/M02men311/data-science-capstone
12
• Displaying the names of the unique launch sites in the space mission
• Displaying 5 records where launch sites begin with the string 'KSC’
• Displaying the total payload mass carried by boosters launched by NASA
(CRS)
• Displaying average payload mass carried by booster version F9 v1.1
Listing the date where the successful landing outcome in drone ship was
achieved.
• Listing the names of the boosters which have success in ground pad and
have payload mass greater than 4000 but less than 6000
• Listing the total number of successful and failure mission outcomes
Listing the names of the booster_versions which have carried the
maximum payload mass.
• Listing the records which will display the month names, successful
landing_outcomes in ground pad booster versions, launch_site for the
months in year 2017 Ranking the count of successful landing_outcomes
between the date 2010-06-04 and 2017-03-20 in descending order
EDA with SQL
%sql select distinct Launch_Site
from SPACEXTBL
https://github.com/M02men311/data-
science-capstone
13
Build an Interactive Map with Folium
• Folium makes it easy to visualize geo-spatial data in
Python using interactive leaflet map. In this project,
we use latitudes and longitudes of each launch site
with a Circle Marker, Name Label and Cluster Markers
for Successful and failed launches on each site
• Since spaceX launches come from different launch
sites I displayed the information of failed and
successful launches as a cluster on the map.Through
zooming in and out you can observer the clusters of
success launches and failed launches
• https://github.com/M02men311/data-science-
capstone
14
Build a Dashboard with Plotly Dash
• Dash is a python framework created by plotlyfor
creating interactive web applications written on the
top of Flask, Plotly.Js and React.Js. In this project, we
used IBM's Theia IDE platform to create interactive
dashboard with Pie chart and Scatter plots.
• Plotly Dash is Python library that makes it easier to
create a dashboard for us as Data Scientist . With a
simple interactive dashboard one can change the
inputs to see representation of values in graphs.
• https://github.com/M02men311/data-science-
capstone
15
• Prepare data
• Create a column for the class
• Standardize the data
• Split into training data and test data
• Define model and parameters
• Train and Grid Search for best parameters
• Evaluation
Predictive Analysis (Classification)
• Exploratory data analysis results
• Interactive analytics demo in screenshots
• Predictive analysis results
16
Results
Section 2
18
• Sns.catplot(y=“launch site”,
x=“flight number”, hue=class
, data=df , aspect=5)
• Plt.xlabel=(“flight number”,
fontsize=25)
• Plt.ylabel=(“launch site” ,
fontsize=25)
• Plt.show()
Flight Number vs. Launch Site
19
• Sns.catplot(x=“launch site”,
y=“pay load mass <kg>”,
hue=class , data=df ,
aspect=5)
• Plt.ylabel=(“pay load mass
<kg>”, fontsize=25)
• Plt.xlabel=(“launch site” ,
fontsize=25)
• Plt.show()
Payload vs. Launch Site
20
• Sns.catplot(x=“orbit type”,
y=“success rate”,
data=df_success_rate)
• Plt.xlabel=(“success rate”,
fontsize=15)
• Plt.ylabel=(“orbit type” ,
fontsize=15)
• Plt.show()
Success Rate vs. Orbit Type
21
• Sns.catplot(x=“flight
number”, y=“orbit”,
hue=class , data=df ,
aspect=3)
• Plt.xlabel=(“orbit”,
fontsize=25)
• Plt.ylabel=(“flight number” ,
fontsize=25)
• Plt.show()
Flight Number vs. Orbit Type
22
• Sns.catplot(x=“payload”,
y=“orbit”, hue=class ,
data=df , aspect=3)
• Plt.xlabel=(“payload”,
fontsize=20)
• Plt.ylabel=(“orbit” ,
fontsize=20)
• Plt.show()
Payload vs. Orbit Type
23
• Sns.catplot(x=“year”,
y=“success rate”,
data=df_year_success )
• Plt.xlabel=(“year”,
fontsize=15)
• Plt.ylabel=(“success rate” ,
fontsize=15)
• Plt.show()
Launch Success Yearly Trend
24
• %sql select distinct launch_site from spacextable ;
• Launch_site:
• CCAFS LC-40
• CCAFS SLC-40
• KSC LC-39
• VAFB
All Launch Site Names
25
• %sql select * from spacextbl where launch_site like ‘CCA%’ limit 5
Launch Site Names Begin with 'CCA'
26
Total Payload Mass
The total payload carried by boosters from NASA is 99980
27
Average Payload Mass by F9 v1.1
average payload mass carried by booster version F9 v1.1 is
2534.67
28
First Successful Ground Landing Date
first successful landing outcome on ground pad is 01-05-2017
29
Successful Drone Ship Landing with Payload between 4000 and 6000
• names of boosters which have successfully landed on drone
ship and had payload mass greater than 4000 but less than
6000.
30
Total Number of Successful and Failure Mission Outcomes
• the total number of successful mission outcomes is 100
• the total number of failure mission outcomes is 1
31
Boosters Carried Maximum Payload
The Names of the booster which have carried the maximum
payload mass
32
2015 Launch Records
Failed landing_outcomes in drone ship, their booster versions,
and launch site names for in year 2015:
Month booster_version launch_site
1 F9 v1.1 B1012 CCAFS LC-40
4 F9 v1.1 B1015 CCAFS LC-40
33
Rank Landing Outcomes Between 2010-06-04 and 2017-03-20
Landing_outcomes Landings
Success 20
No attempt 10
Success(drone ship) 8
Success(ground pad) 6
Failure(drone ship) 4
Controlled(ocean) 3
Failure 3
Failure(parachute) 2
No attempt 1
Section 3
35
<Folium Map Screenshot 1>
Lat
Launch Site Long
CCAFS LC-40
CCAFS SLC-40
KSC LC-39A
VAFB SLC-4E
28.56319718
28.56230197
28.57325457
34.63283416
-80.57735648
-80.57682003
-80.64689529
-120.6107455
36
<Folium Map Screenshot 2>
• We can see that CCAFS SLC-40 has low rate
37
<Folium Map Screenshot 3>
• launch sites are less than 2km from railways
• launch sites are less than 2km from highways
• launch sites are less than 5km from coastline
• It keeps 15 km away from the city
Section 4
39
• KSC LC-39A has the most successful launches
<Dashboard Screenshot 1>
40
• KSC LC-39A has 76.9% success rate
• KSC LC-39A has 23.1% failure rate
<Dashboard Screenshot 2>
41
• We can see that range from 2000kg to 4000kg payload mass has the most
successful rate
• Also booster version ft has more successful rate
<Dashboard Screenshot 3>
Section 5
43
• Decision tree model has the highest
accuracy
Classification Accuracy
44
• After analyzing the models' scores and I get the most accurate model
possible. and found that the decision tree classifier model has the lowest
bias confusion matrix, the best score, and the accuracy.
Confusion Matrix
45
• The KNN algorithm is the best model in machine
learning for this dataset
• Launch site KSC LC-39A has the highest success
rate
• Orbit GEO,HEO & ES-L1,SS have highest success
rate
• Launches that have low payload has more success
rate
• Success rate is increasing directly proportional
with time
Conclusions
46
• Canva tool
• Smart art tool
• Jupyter lite & python (pyodide)
• Labs.cognitive.ai
Appendix
datascience-capstone-template-coursera.pdf

datascience-capstone-template-coursera.pdf

  • 1.
  • 2.
    2 • Executive Summary •Introduction • Methodology • Results • Conclusion • Appendix Outline
  • 3.
    3 • Summary ofmethodologies • Data collection. • Data wrangling. • EDA with data visualization and sql. • Building an interactive map with folium. • Building a dashboard with plotly dash. • Predictive analysis (correlation). • Summary of all results • Exploratory data analysis results. • Interactive analytics screenshots. • Predictive analytics results. Executive Summary
  • 4.
    4 Introduction • Problems youwant to find answers • We predicted if the Falcon 9 first stage will land successfully. SpaceX advertises Falcon 9 rocket launches on its website, with a cost of 62 million dollars; other providers cost upward of 165 million dollars each, much of the savings is because SpaceX can reuse the first stage. Therefore, if we can determine if the first stage will land, we can determine the cost of a launch. This information can be used if an alternate company wants to bid against SpaceX for a rocket launch. • Project background and context • What influences if the rocket will land successfully? The effect each relationship with certain rocket variables will impact determining the success rate of a successful landing. What conditions does SpaceX have to achieve to get the best results and ensure the best rocket success landing rate.
  • 5.
  • 6.
    6 Executive Summary • Datacollection methodology: • SpaceX rest api • Web scrapping • Perform data wrangling • One hot encoding data fields for machine learning and dropping irrelevant columns • Perform exploratory data analysis (EDA) using visualization and SQL • Perform interactive visual analytics using Folium and Plotly Dash • Perform predictive analysis using classification models • How to build, tune, evaluate classification models Methodology
  • 7.
    7 Data Collection REST API SpaceX Json DataFrame WEB SCRAPPING WIKI HTML DataFrame
  • 8.
    8 • import requests importpandas as pd spacex_url = "https://api.spacexdata.com/v4/launch es/past" response = requests.get(spacex_url) data = pd.json_normalize(response.json()) • GitHub URL of the completed SpaceX API calls notebook: https://github.com/M02men311/data- science-capstone Data Collection – SpaceX API Getting response from API Converting response to a Json file Apply clean data functions Assign list to dictionary and then create a dataframe Filter dataframe and then export it
  • 9.
    9 • import requests frombs4 import BeautifulSoup url = 'https://en.wikipedia.org/wiki /List_of_Falcon_9_and_Falco n_Heavy_launches’ response = requests.get(url) html_data=response.text soup=BeautifulSoup(html_data) • https://en.wikipedia.org/wiki/ List_of_Falcon_9_and_Falcon _Heavy_launches Data Collection - Scraping Getting response from HTML Creating beautifulsoup object Finding tables Getting columns names Creating dictionary and appending data to keys Converting dictionary to dataframe DataFrame to CSV.
  • 10.
    10 • After collectingthe data we check the missing data ,and data types and do on of the following to clean the data :Replace the missing data with one-Using mean or so.Change data type of the data.Represent categorical data using integer or float dummy numbers -one hot encoding Data Wrangling 1. Load data 2. Create dataframe from collected data 3. Clean data 4. Converting into boolean values 5. Export to flat file https://github.com/M02men311/data-science-capstone
  • 11.
    11 EDA with DataVisualization https://github.com/M02men311/data-science-capstone
  • 12.
    12 • Displaying thenames of the unique launch sites in the space mission • Displaying 5 records where launch sites begin with the string 'KSC’ • Displaying the total payload mass carried by boosters launched by NASA (CRS) • Displaying average payload mass carried by booster version F9 v1.1 Listing the date where the successful landing outcome in drone ship was achieved. • Listing the names of the boosters which have success in ground pad and have payload mass greater than 4000 but less than 6000 • Listing the total number of successful and failure mission outcomes Listing the names of the booster_versions which have carried the maximum payload mass. • Listing the records which will display the month names, successful landing_outcomes in ground pad booster versions, launch_site for the months in year 2017 Ranking the count of successful landing_outcomes between the date 2010-06-04 and 2017-03-20 in descending order EDA with SQL %sql select distinct Launch_Site from SPACEXTBL https://github.com/M02men311/data- science-capstone
  • 13.
    13 Build an InteractiveMap with Folium • Folium makes it easy to visualize geo-spatial data in Python using interactive leaflet map. In this project, we use latitudes and longitudes of each launch site with a Circle Marker, Name Label and Cluster Markers for Successful and failed launches on each site • Since spaceX launches come from different launch sites I displayed the information of failed and successful launches as a cluster on the map.Through zooming in and out you can observer the clusters of success launches and failed launches • https://github.com/M02men311/data-science- capstone
  • 14.
    14 Build a Dashboardwith Plotly Dash • Dash is a python framework created by plotlyfor creating interactive web applications written on the top of Flask, Plotly.Js and React.Js. In this project, we used IBM's Theia IDE platform to create interactive dashboard with Pie chart and Scatter plots. • Plotly Dash is Python library that makes it easier to create a dashboard for us as Data Scientist . With a simple interactive dashboard one can change the inputs to see representation of values in graphs. • https://github.com/M02men311/data-science- capstone
  • 15.
    15 • Prepare data •Create a column for the class • Standardize the data • Split into training data and test data • Define model and parameters • Train and Grid Search for best parameters • Evaluation Predictive Analysis (Classification)
  • 16.
    • Exploratory dataanalysis results • Interactive analytics demo in screenshots • Predictive analysis results 16 Results
  • 17.
  • 18.
    18 • Sns.catplot(y=“launch site”, x=“flightnumber”, hue=class , data=df , aspect=5) • Plt.xlabel=(“flight number”, fontsize=25) • Plt.ylabel=(“launch site” , fontsize=25) • Plt.show() Flight Number vs. Launch Site
  • 19.
    19 • Sns.catplot(x=“launch site”, y=“payload mass <kg>”, hue=class , data=df , aspect=5) • Plt.ylabel=(“pay load mass <kg>”, fontsize=25) • Plt.xlabel=(“launch site” , fontsize=25) • Plt.show() Payload vs. Launch Site
  • 20.
    20 • Sns.catplot(x=“orbit type”, y=“successrate”, data=df_success_rate) • Plt.xlabel=(“success rate”, fontsize=15) • Plt.ylabel=(“orbit type” , fontsize=15) • Plt.show() Success Rate vs. Orbit Type
  • 21.
    21 • Sns.catplot(x=“flight number”, y=“orbit”, hue=class, data=df , aspect=3) • Plt.xlabel=(“orbit”, fontsize=25) • Plt.ylabel=(“flight number” , fontsize=25) • Plt.show() Flight Number vs. Orbit Type
  • 22.
    22 • Sns.catplot(x=“payload”, y=“orbit”, hue=class, data=df , aspect=3) • Plt.xlabel=(“payload”, fontsize=20) • Plt.ylabel=(“orbit” , fontsize=20) • Plt.show() Payload vs. Orbit Type
  • 23.
    23 • Sns.catplot(x=“year”, y=“success rate”, data=df_year_success) • Plt.xlabel=(“year”, fontsize=15) • Plt.ylabel=(“success rate” , fontsize=15) • Plt.show() Launch Success Yearly Trend
  • 24.
    24 • %sql selectdistinct launch_site from spacextable ; • Launch_site: • CCAFS LC-40 • CCAFS SLC-40 • KSC LC-39 • VAFB All Launch Site Names
  • 25.
    25 • %sql select* from spacextbl where launch_site like ‘CCA%’ limit 5 Launch Site Names Begin with 'CCA'
  • 26.
    26 Total Payload Mass Thetotal payload carried by boosters from NASA is 99980
  • 27.
    27 Average Payload Massby F9 v1.1 average payload mass carried by booster version F9 v1.1 is 2534.67
  • 28.
    28 First Successful GroundLanding Date first successful landing outcome on ground pad is 01-05-2017
  • 29.
    29 Successful Drone ShipLanding with Payload between 4000 and 6000 • names of boosters which have successfully landed on drone ship and had payload mass greater than 4000 but less than 6000.
  • 30.
    30 Total Number ofSuccessful and Failure Mission Outcomes • the total number of successful mission outcomes is 100 • the total number of failure mission outcomes is 1
  • 31.
    31 Boosters Carried MaximumPayload The Names of the booster which have carried the maximum payload mass
  • 32.
    32 2015 Launch Records Failedlanding_outcomes in drone ship, their booster versions, and launch site names for in year 2015: Month booster_version launch_site 1 F9 v1.1 B1012 CCAFS LC-40 4 F9 v1.1 B1015 CCAFS LC-40
  • 33.
    33 Rank Landing OutcomesBetween 2010-06-04 and 2017-03-20 Landing_outcomes Landings Success 20 No attempt 10 Success(drone ship) 8 Success(ground pad) 6 Failure(drone ship) 4 Controlled(ocean) 3 Failure 3 Failure(parachute) 2 No attempt 1
  • 34.
  • 35.
    35 <Folium Map Screenshot1> Lat Launch Site Long CCAFS LC-40 CCAFS SLC-40 KSC LC-39A VAFB SLC-4E 28.56319718 28.56230197 28.57325457 34.63283416 -80.57735648 -80.57682003 -80.64689529 -120.6107455
  • 36.
    36 <Folium Map Screenshot2> • We can see that CCAFS SLC-40 has low rate
  • 37.
    37 <Folium Map Screenshot3> • launch sites are less than 2km from railways • launch sites are less than 2km from highways • launch sites are less than 5km from coastline • It keeps 15 km away from the city
  • 38.
  • 39.
    39 • KSC LC-39Ahas the most successful launches <Dashboard Screenshot 1>
  • 40.
    40 • KSC LC-39Ahas 76.9% success rate • KSC LC-39A has 23.1% failure rate <Dashboard Screenshot 2>
  • 41.
    41 • We cansee that range from 2000kg to 4000kg payload mass has the most successful rate • Also booster version ft has more successful rate <Dashboard Screenshot 3>
  • 42.
  • 43.
    43 • Decision treemodel has the highest accuracy Classification Accuracy
  • 44.
    44 • After analyzingthe models' scores and I get the most accurate model possible. and found that the decision tree classifier model has the lowest bias confusion matrix, the best score, and the accuracy. Confusion Matrix
  • 45.
    45 • The KNNalgorithm is the best model in machine learning for this dataset • Launch site KSC LC-39A has the highest success rate • Orbit GEO,HEO & ES-L1,SS have highest success rate • Launches that have low payload has more success rate • Success rate is increasing directly proportional with time Conclusions
  • 46.
    46 • Canva tool •Smart art tool • Jupyter lite & python (pyodide) • Labs.cognitive.ai Appendix