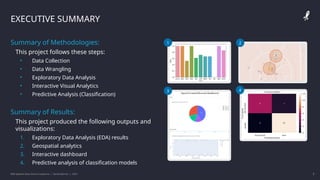
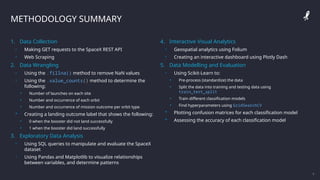
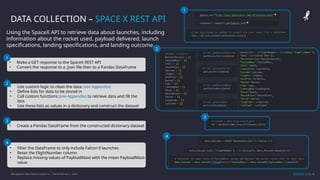
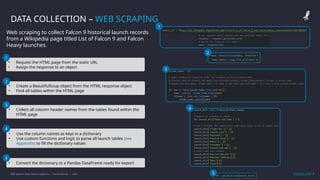
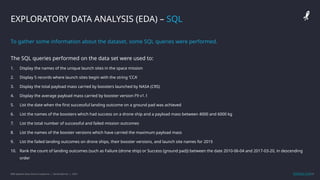
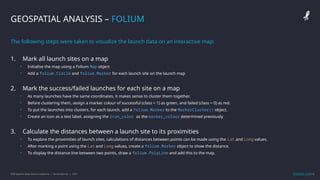
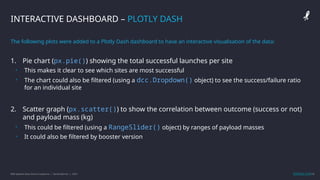
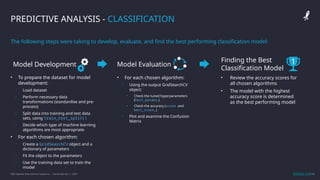
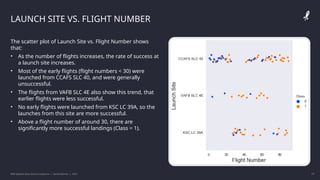
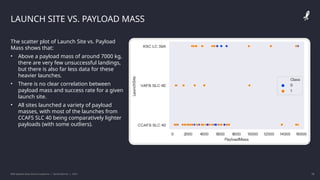
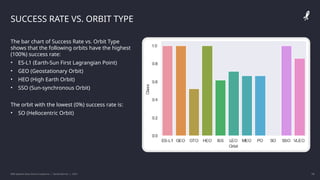
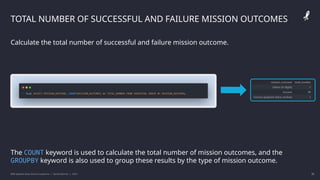
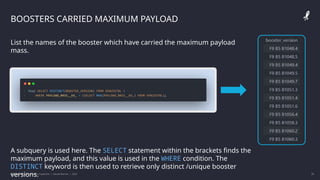
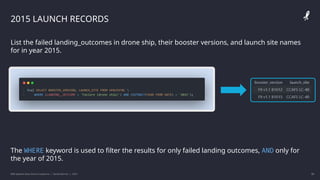
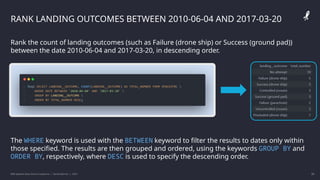
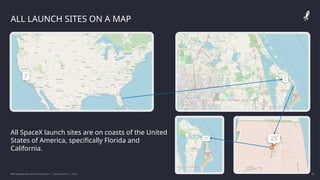
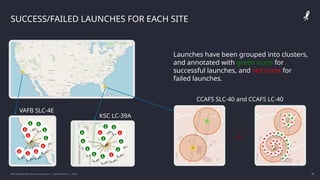
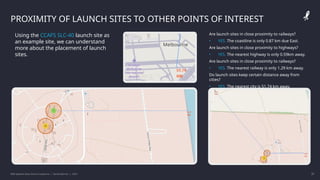
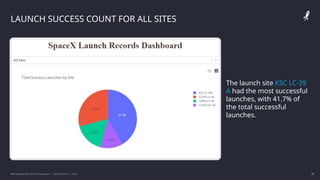
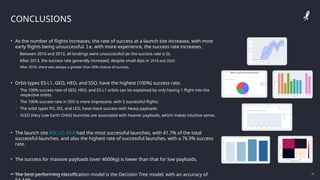
IBM DATA SCIENCE
CAPSTONE PROJECT
Space X Falcon 9 Landing Analysis
Daniel Barnes
IBM Applied Data Science Capstone | Daniel Barnes | 2022 2
2
Appendix
06
Conclusions
05
Results
04
Methodology
03
Introduction
02
Executive Summary
01
OUTLINE
IBM Applied Data Science Capstone | Daniel Barnes | 2022 3
3
EXECUTIVE SUMMARY
Summary of Methodologies:
This project follows these steps:
• Data Collection
• Data Wrangling
• Exploratory Data Analysis
• Interactive Visual Analytics
• Predictive Analysis (Classification)
Summary of Results:
This project produced the following outputs and
visualizations:
1. Exploratory Data Analysis (EDA) results
2. Geospatial analytics
3. Interactive dashboard
4. Predictive analysis of classification models
1 2
3 4
IBM Applied Data Science Capstone | Daniel Barnes | 2022 4
4
METHODOLOGY SUMMARY
• SpaceX launches Falcon 9 rockets at a cost of around
$62m. This is considerably cheaper than other
providers (which usually cost upwards of $165m), and
much of the savings are because SpaceX can land, and
then re-use the first stage of the rocket.
• If we can make predictions on whether the first stage
will land, we can determine the cost of a launch, and
use this information to assess whether or not an
alternate company should bid and SpaceX for a rocket
launch.
• This project will ultimately predict if the Space X
Falcon 9 first stage will land successfully.
INTRODUCTION
IBM Applied Data Science Capstone | Daniel Barnes | 2022 5
5
METHODOLOGY SUMMARY
1. Data Collection
• Making GET requests to the SpaceX REST API
• Web Scraping
2. Data Wrangling
• Using the .fillna() method to remove NaN values
• Using the .value_counts() method to determine the
following:
• Number of launches on each site
• Number and occurrence of each orbit
• Number and occurrence of mission outcome per orbit type
 Creating a landing outcome label that shows the following:
• 0 when the booster did not land successfully
• 1 when the booster did land successfully
3. Exploratory Data Analysis
• Using SQL queries to manipulate and evaluate the SpaceX
dataset
• Using Pandas and Matplotlib to visualize relationships
between variables, and determine patterns
4. Interactive Visual Analytics
• Geospatial analytics using Folium
• Creating an interactive dashboard using Plotly Dash
5. Data Modelling and Evaluation
• Using Scikit-Learn to:
• Pre-process (standardize) the data
• Split the data into training and testing data using
train_test_split
• Train different classification models
• Find hyperparameters using GridSearchCV
 Plotting confusion matrices for each classification model
 Assessing the accuracy of each classification model
IBM Applied Data Science Capstone | Daniel Barnes | 2022 6
6
DATA COLLECTION – SPACE X REST API
Using the SpaceX API to retrieve data about launches, including
information about the rocket used, payload delivered, launch
specifications, landing specifications, and landing outcome.
1
3
2
4
• Make a GET response to the SpaceX REST API
• Convert the response to a .json file then to a Pandas DataFrame
1
• Use custom logic to clean the data (see Appendix)
• Define lists for data to be stored in
• Call custom functions (see Appendix) to retrieve data and fill the
lists
• Use these lists as values in a dictionary and construct the dataset
2
• Create a Pandas DataFrame from the constructed dictionary dataset
3
• Filter the DataFrame to only include Falcon 9 launches
• Reset the FlightNumber column
• Replace missing values of PayloadMass with the mean PayloadMass
value
4
GitHub Link
IBM Applied Data Science Capstone | Daniel Barnes | 2022 7
7
DATA COLLECTION – WEB SCRAPING
Web scraping to collect Falcon 9 historical launch records
from a Wikipedia page titled List of Falcon 9 and Falcon
Heavy launches.
1
2
3
4
5
• Request the HTML page from the static URL
• Assign the response to an object
1
• Create a BeautifulSoup object from the HTML response object
• Find all tables within the HTML page
2
• Use the column names as keys in a dictionary
• Use custom functions and logic to parse all launch tables (see
Appendix) to fill the dictionary values
4
• Convert the dictionary to a Pandas DataFrame ready for export
5
• Collect all column header names from the tables found within the
HTML page
3
GitHub Link
IBM Applied Data Science Capstone | Daniel Barnes | 2022 8
8
DATA MANIPULATION/WRANGLING – PANDAS
Context:
• The SpaceX dataset contains several Space X launch facilities, and each
location is in the LaunchSite column.
• Each launch aims to a dedicated orbit, and some of the common orbit
types are shown in the figure below. The orbit type is in the Orbit
column.
Initial Data Exploration:
• Using the .value_counts() method to determine the following:
1. Number of launches on each site
2. Number and occurrence of each orbit
3. Number and occurrence of landing outcome per orbit type
1
2
3
GitHub Link
IBM Applied Data Science Capstone | Daniel Barnes | 2022 9
9
DATA MANIPULATION/WRANGLING – PANDAS
Context:
• The landing outcome is shown in the Outcome column:
 True Ocean – the mission outcome was successfully landed to a specific region of the ocean
 False Ocean – the mission outcome was unsuccessfully landed to a specific region of the
ocean.
 True RTLS – the mission outcome was successfully landed to a ground pad
 False RTLS – the mission outcome was unsuccessfully landed to a ground pad.
 True ASDS – the mission outcome was successfully landed to a drone ship
 False ASDS – the mission outcome was unsuccessfully landed to a drone ship.
 None ASDS and None None – these represent a failure to land.
Data Wrangling:
• To determine whether a booster will successfully land, it is best to have a binary
column, i.e., where the value is 1 or 0, representing the success of the landing.
• This is done by:
1. Defining a set of unsuccessful (bad) outcomes, bad_outcome
2. Creating a list, landing_class, where the element is 0 if the corresponding row in Outcome is
in the set bad_outcome, otherwise, it’s 1.
3. Create a Class column that contains the values from the list landing_class
4. Export the DataFrame as a .csv file.
1
3
3
4
GitHub Link
IBM Applied Data Science Capstone | Daniel Barnes | 2022 10
10
EXPLORATORY DATA ANALYSIS (EDA) – VISUALIZATION
SCATTER CHARTS
Scatter charts were produced to visualize
the relationships between:
• Flight Number and Launch Site
• Payload and Launch Site
• Orbit Type and Flight Number
• Payload and Orbit Type
BAR CHART
A bar chart was produced to visualize the
relationship between:
• Success Rate and Orbit Type
LINE CHARTS
Line charts were produced to visualize
the relationships between:
• Success Rate and Year (i.e. the launch
success yearly trend)
GitHub Link
Scatter charts are useful to observe
relationships, or correlations, between
two numeric variables.
Bar charts are used to compare a
numerical value to a categorical
variable. Horizontal or vertical bar
charts can be used, depending on the
size of the data.
Line charts contain numerical values
on both axes, and are generally used
to show the change of a variable over
time.
IBM Applied Data Science Capstone | Daniel Barnes | 2022 11
11
EXPLORATORY DATA ANALYSIS (EDA) – SQL
To gather some information about the dataset, some SQL queries were performed.
The SQL queries performed on the data set were used to:
1. Display the names of the unique launch sites in the space mission
2. Display 5 records where launch sites begin with the string ‘CCA’
3. Display the total payload mass carried by boosters launched by NASA (CRS)
4. Display the average payload mass carried by booster version F9 v1.1
5. List the date when the first successful landing outcome on a ground pad was achieved
6. List the names of the boosters which had success on a drone ship and a payload mass between 4000 and 6000 kg
7. List the total number of successful and failed mission outcomes
8. List the names of the booster versions which have carried the maximum payload mass
9. List the failed landing outcomes on drone ships, their booster versions, and launch site names for 2015
10. Rank the count of landing outcomes (such as Failure (drone ship) or Success (ground pad)) between the date 2010-06-04 and 2017-03-20, in descending
order
GitHub Link
IBM Applied Data Science Capstone | Daniel Barnes | 2022 12
12
GEOSPATIAL ANALYSIS – FOLIUM
The following steps were taken to visualize the launch data on an interactive map:
1. Mark all launch sites on a map
• Initialise the map using a Folium Map object
• Add a folium.Circle and folium.Marker for each launch site on the launch map
2. Mark the success/failed launches for each site on a map
• As many launches have the same coordinates, it makes sense to cluster them together.
• Before clustering them, assign a marker colour of successful (class = 1) as green, and failed (class = 0) as red.
• To put the launches into clusters, for each launch, add a folium.Marker to the MarkerCluster() object.
• Create an icon as a text label, assigning the icon_color as the marker_colour determined previously.
3. Calculate the distances between a launch site to its proximities
• To explore the proximities of launch sites, calculations of distances between points can be made using the Lat and Long values.
• After marking a point using the Lat and Long values, create a folium.Marker object to show the distance.
• To display the distance line between two points, draw a folium.PolyLine and add this to the map.
GitHub Link
IBM Applied Data Science Capstone | Daniel Barnes | 2022 13
13
INTERACTIVE DASHBOARD – PLOTLY DASH
The following plots were added to a Plotly Dash dashboard to have an interactive visualisation of the data:
1. Pie chart (px.pie()) showing the total successful launches per site
• This makes it clear to see which sites are most successful
• The chart could also be filtered (using a dcc.Dropdown() object) to see the success/failure ratio
for an individual site
2. Scatter graph (px.scatter()) to show the correlation between outcome (success or not)
and payload mass (kg)
• This could be filtered (using a RangeSlider() object) by ranges of payload masses
• It could also be filtered by booster version
GitHub Link
IBM Applied Data Science Capstone | Daniel Barnes | 2022 14
14
The following steps were taking to develop, evaluate, and find the best performing classification model:
PREDICTIVE ANALYSIS - CLASSIFICATION
GitHub Link
Model Development
• To prepare the dataset for model
development:
• Load dataset
• Perform necessary data
transformations (standardise and pre-
process)
• Split data into training and test data
sets, using train_test_split()
• Decide which type of machine learning
algorithms are most appropriate
• For each chosen algorithm:
• Create a GridSearchCV object and a
dictionary of parameters
• Fit the object to the parameters
• Use the training data set to train the
model
Model Evaluation
• For each chosen algorithm:
• Using the output GridSearchCV
object:
• Check the tuned hyperparameters
(best_params_)
• Check the accuracy (score and
best_score_)
• Plot and examine the Confusion
Matrix
Finding the Best
Classification Model
• Review the accuracy scores for
all chosen algorithms
• The model with the highest
accuracy score is determined
as the best performing model
1
RESULTS
Exploratory Data Analysis
Interactive Analytics
Predictive Analysis
EDA - WITH
VISUALIZATION
IBM Applied Data Science Capstone | Daniel Barnes | 2022 17
17
LAUNCH SITE VS. FLIGHT NUMBER
The scatter plot of Launch Site vs. Flight Number shows
that:
• As the number of flights increases, the rate of success at
a launch site increases.
• Most of the early flights (flight numbers < 30) were
launched from CCAFS SLC 40, and were generally
unsuccessful.
• The flights from VAFB SLC 4E also show this trend, that
earlier flights were less successful.
• No early flights were launched from KSC LC 39A, so the
launches from this site are more successful.
• Above a flight number of around 30, there are
significantly more successful landings (Class = 1).
IBM Applied Data Science Capstone | Daniel Barnes | 2022 18
18
LAUNCH SITE VS. PAYLOAD MASS
The scatter plot of Launch Site vs. Payload
Mass shows that:
• Above a payload mass of around 7000 kg,
there are very few unsuccessful landings,
but there is also far less data for these
heavier launches.
• There is no clear correlation between
payload mass and success rate for a given
launch site.
• All sites launched a variety of payload
masses, with most of the launches from
CCAFS SLC 40 being comparatively lighter
payloads (with some outliers).
IBM Applied Data Science Capstone | Daniel Barnes | 2022 19
19
SUCCESS RATE VS. ORBIT TYPE
The bar chart of Success Rate vs. Orbit Type
shows that the following orbits have the highest
(100%) success rate:
• ES-L1 (Earth-Sun First Lagrangian Point)
• GEO (Geostationary Orbit)
• HEO (High Earth Orbit)
• SSO (Sun-synchronous Orbit)
The orbit with the lowest (0%) success rate is:
• SO (Heliocentric Orbit)
IBM Applied Data Science Capstone | Daniel Barnes | 2022 20
20
ORBIT TYPE VS. FLIGHT NUMBER
This scatter plot of Orbit Type vs. Flight number
shows a few useful things that the previous
plots did not, such as:
• The 100% success rate of GEO, HEO, and ES-
L1 orbits can be explained by only having 1
flight into the respective orbits.
• The 100% success rate in SSO is more
impressive, with 5 successful flights.
• There is little relationship between Flight
Number and Success Rate for GTO.
• Generally, as Flight Number increases, the
success rate increases. This is most extreme
for LEO, where unsuccessful landings only
occurred for the low flight numbers (early
launches).
IBM Applied Data Science Capstone | Daniel Barnes | 2022 21
21
ORBIT TYPE VS. PAYLOAD MASS
This scatter plot of Orbit Type vs. Payload Mass
shows that:
• The following orbit types have more success
with heavy payloads:
• PO (although the number of data points is small)
• ISS
• LEO
• For GTO, the relationship between payload
mass and success rate is unclear.
• VLEO (Very Low Earth Orbit) launches are
associated with heavier payloads, which makes
intuitive sense.
IBM Applied Data Science Capstone | Daniel Barnes | 2022 22
22
LAUNCH SUCCESS YEARLY TREND
The line chart of yearly average success rate shows
that:
• Between 2010 and 2013, all landings were
unsuccessful (as the success rate is 0).
• After 2013, the success rate generally increased,
despite small dips in 2018 and 2020.
• After 2016, there was always a greater than 50%
chance of success.
EDA - WITH SQL
IBM Applied Data Science Capstone | Daniel Barnes | 2022 24
24
ALL LAUNCH SITE NAMES
Find the names of the unique launch sites.
The word UNIQUE returns only unique values from the LAUNCH_SITE column of the SPACEXTBL
table.
IBM Applied Data Science Capstone | Daniel Barnes | 2022 25
25
LAUNCH SITE NAMES BEGIN WITH 'CCA'
Find 5 records where launch sites begin with ‘CCA’.
LIMIT 5 fetches only 5 records, and the LIKE keyword is used with the wild card ‘CCA%’ to
retrieve string values beginning with ‘CCA’.
IBM Applied Data Science Capstone | Daniel Barnes | 2022 26
26
TOTAL PAYLOAD MASS
Calculate the total payload carried by boosters from NASA.
The SUM keyword is used to calculate the total of the LAUNCH column, and the SUM keyword (and
the associated condition) filters the results to only boosters from NASA (CRS).
IBM Applied Data Science Capstone | Daniel Barnes | 2022 27
27
AVERAGE PAYLOAD MASS BY F9 V1.1
Calculate the average payload mass carried by booster version F9 v1.1.
The AVG keyword is used to calculate the average of the PAYLOAD_MASS__KG_ column, and the
WHERE keyword (and the associated condition) filters the results to only the F9 v1.1 booster
version.
IBM Applied Data Science Capstone | Daniel Barnes | 2022 28
28
FIRST SUCCESSFUL GROUND LANDING DATE
Find the dates of the first successful landing outcome on ground pad.
The MIN keyword is used to calculate the minimum of the DATE column, i.e. the first date, and
the WHERE keyword (and the associated condition) filters the results to only the successful
ground pad landings.
IBM Applied Data Science Capstone | Daniel Barnes | 2022 29
29
SUCCESSFUL DRONE SHIP LANDING WITH PAYLOAD BETWEEN 4000
AND 6000
List the names of boosters which have successfully landed on drone ship and had payload mass
greater than 4000 but less than 6000.
The WHERE keyword is used to filter the results to include only those that satisfy both conditions
in the brackets (as the AND keyword is also used). The BETWEEN keyword allows for 4000 < x <
6000 values to be selected.
IBM Applied Data Science Capstone | Daniel Barnes | 2022 30
30
TOTAL NUMBER OF SUCCESSFUL AND FAILURE MISSION OUTCOMES
Calculate the total number of successful and failure mission outcome.
The COUNT keyword is used to calculate the total number of mission outcomes, and the
GROUPBY keyword is also used to group these results by the type of mission outcome.
IBM Applied Data Science Capstone | Daniel Barnes | 2022 31
31
BOOSTERS CARRIED MAXIMUM PAYLOAD
List the names of the booster which have carried the maximum payload
mass.
A subquery is used here. The SELECT statement within the brackets finds the
maximum payload, and this value is used in the WHERE condition. The
DISTINCT keyword is then used to retrieve only distinct /unique booster
versions.
IBM Applied Data Science Capstone | Daniel Barnes | 2022 32
32
2015 LAUNCH RECORDS
List the failed landing_outcomes in drone ship, their booster versions, and launch site names
for in year 2015.
The WHERE keyword is used to filter the results for only failed landing outcomes, AND only for
the year of 2015.
IBM Applied Data Science Capstone | Daniel Barnes | 2022 33
33
RANK LANDING OUTCOMES BETWEEN 2010-06-04 AND 2017-03-20
Rank the count of landing outcomes (such as Failure (drone ship) or Success (ground pad))
between the date 2010-06-04 and 2017-03-20, in descending order.
The WHERE keyword is used with the BETWEEN keyword to filter the results to dates only within
those specified. The results are then grouped and ordered, using the keywords GROUP BY and
ORDER BY, respectively, where DESC is used to specify the descending order.
LAUNCH SITES PROXIMITY
ANALYSIS – FOLIUM
INTERACTIVE MAP
IBM Applied Data Science Capstone | Daniel Barnes | 2022 35
35
ALL LAUNCH SITES ON A MAP
All SpaceX launch sites are on coasts of the United
States of America, specifically Florida and
California.
IBM Applied Data Science Capstone | Daniel Barnes | 2022 36
36
SUCCESS/FAILED LAUNCHES FOR EACH SITE
Launches have been grouped into clusters,
and annotated with green icons for
successful launches, and red icons for
failed launches.
¿
CCAFS SLC-40 and CCAFS LC-40
KSC LC-39A
VAFB SLC-4E
IBM Applied Data Science Capstone | Daniel Barnes | 2022 37
37
PROXIMITY OF LAUNCH SITES TO OTHER POINTS OF INTEREST
Are launch sites in close proximity to railways?
• YES. The coastline is only 0.87 km due East.
Are launch sites in close proximity to highways?
• YES. The nearest highway is only 0.59km away.
Are launch sites in close proximity to railways?
• YES. The nearest railway is only 1.29 km away.
Do launch sites keep certain distance away from
cities?
• YES. The nearest city is 51.74 km away.
Using the CCAFS SLC-40 launch site as
an example site, we can understand
more about the placement of launch
sites.
INTERACTIVE DASHBOARD
- PLOTLY DASH
IBM Applied Data Science Capstone | Daniel Barnes | 2022 39
39
LAUNCH SUCCESS COUNT FOR ALL SITES
The launch site KSC LC-39
A had the most successful
launches, with 41.7% of
the total successful
launches.
IBM Applied Data Science Capstone | Daniel Barnes | 2022 40
40
PIE CHART FOR THE LAUNCH SITE WITH HIGHEST LAUNCH SUCCESS
RATIO
Note:
The launch site KSC LC-39
A also had the highest
rate of successful
launches, with a 76.9%
success rate.
IBM Applied Data Science Capstone | Daniel Barnes | 2022 41
41
LAUNCH OUTCOME VS. PAYLOAD SCATTER PLOT FOR ALL SITES
• Plotting the launch outcome vs. payload for all sites shows a gap
around 4000 kg, so it makes sense to split the data into 2 ranges:
• 0 – 4000 kg (low payloads)
• 4000 – 10000 kg (massive payloads)
• From these 2 plots, it can be shown that the success for massive
payloads is lower than that for low payloads.
• It is also worth noting that some booster types (v1.0 and B5) have
not been launched with massive payloads.
1 2
1
2
Low payloads Massive payloads
Note: c
PREDICTIVE ANALYSIS -
CLASSIFICATION
IBM Applied Data Science Capstone | Daniel Barnes | 2022 43
43
CLASSIFICATION ACCURACY
Plotting the Accuracy Score and Best Score for
each classification algorithm produces the
following result:
• The Decision Tree model has the highest
classification accuracy
• The Accuracy Score is 94.44%
• The Best Score is 90.36%
IBM Applied Data Science Capstone | Daniel Barnes | 2022 44
44
CONFUSION MATRIX
• As shown previously, best performing
classification model is the Decision Tree
model, with an accuracy of 94.44%.
• This is explained by the confusion matrix,
which shows only 1 out of 18 total results
classified incorrectly (a false positive,
shown in the top-right corner).
• The other 17 results are correctly
classified (5 did not land, 12 did land).
CONCLUSIONS
IBM Applied Data Science Capstone | Daniel Barnes | 2022 46
46
CONCLUSIONS
• As the number of flights increases, the rate of success at a launch site increases, with most
early flights being unsuccessful. I.e. with more experience, the success rate increases.
• Between 2010 and 2013, all landings were unsuccessful (as the success rate is 0).
• After 2013, the success rate generally increased, despite small dips in 2018 and 2020.
• After 2016, there was always a greater than 50% chance of success.
• Orbit types ES-L1, GEO, HEO, and SSO, have the highest (100%) success rate.
• The 100% success rate of GEO, HEO, and ES-L1 orbits can be explained by only having 1 flight into the
respective orbits.
• The 100% success rate in SSO is more impressive, with 5 successful flights.
• The orbit types PO, ISS, and LEO, have more success with heavy payloads:
• VLEO (Very Low Earth Orbit) launches are associated with heavier payloads, which makes intuitive sense.
• The launch site KSC LC-39 A had the most successful launches, with 41.7% of the total
successful launches, and also the highest rate of successful launches, with a 76.9% success
rate.
• The success for massive payloads (over 4000kg) is lower than that for low payloads.
• The best performing classification model is the Decision Tree model, with an accuracy of
APPENDIX
IBM Applied Data Science Capstone | Daniel Barnes | 2022 48
48
DATA COLLECTION – SPACE X REST API
• Custom functions to retrieve the required information
• Custom logic to clean the data
IBM Applied Data Science Capstone | Daniel Barnes | 2022 49
49
DATA COLLECTION – WEB SCRAPING
• Custom functions for web
scraping
• Custom logic to fill up the
launch_dict values with values
from the launch tables

IBM Data Science Capstone Project 2022.pptx

  • 1.
    IBM DATA SCIENCE CAPSTONEPROJECT Space X Falcon 9 Landing Analysis Daniel Barnes
  • 2.
    IBM Applied DataScience Capstone | Daniel Barnes | 2022 2 2 Appendix 06 Conclusions 05 Results 04 Methodology 03 Introduction 02 Executive Summary 01 OUTLINE
  • 3.
    IBM Applied DataScience Capstone | Daniel Barnes | 2022 3 3 EXECUTIVE SUMMARY Summary of Methodologies: This project follows these steps: • Data Collection • Data Wrangling • Exploratory Data Analysis • Interactive Visual Analytics • Predictive Analysis (Classification) Summary of Results: This project produced the following outputs and visualizations: 1. Exploratory Data Analysis (EDA) results 2. Geospatial analytics 3. Interactive dashboard 4. Predictive analysis of classification models 1 2 3 4
  • 4.
    IBM Applied DataScience Capstone | Daniel Barnes | 2022 4 4 METHODOLOGY SUMMARY • SpaceX launches Falcon 9 rockets at a cost of around $62m. This is considerably cheaper than other providers (which usually cost upwards of $165m), and much of the savings are because SpaceX can land, and then re-use the first stage of the rocket. • If we can make predictions on whether the first stage will land, we can determine the cost of a launch, and use this information to assess whether or not an alternate company should bid and SpaceX for a rocket launch. • This project will ultimately predict if the Space X Falcon 9 first stage will land successfully. INTRODUCTION
  • 5.
    IBM Applied DataScience Capstone | Daniel Barnes | 2022 5 5 METHODOLOGY SUMMARY 1. Data Collection • Making GET requests to the SpaceX REST API • Web Scraping 2. Data Wrangling • Using the .fillna() method to remove NaN values • Using the .value_counts() method to determine the following: • Number of launches on each site • Number and occurrence of each orbit • Number and occurrence of mission outcome per orbit type  Creating a landing outcome label that shows the following: • 0 when the booster did not land successfully • 1 when the booster did land successfully 3. Exploratory Data Analysis • Using SQL queries to manipulate and evaluate the SpaceX dataset • Using Pandas and Matplotlib to visualize relationships between variables, and determine patterns 4. Interactive Visual Analytics • Geospatial analytics using Folium • Creating an interactive dashboard using Plotly Dash 5. Data Modelling and Evaluation • Using Scikit-Learn to: • Pre-process (standardize) the data • Split the data into training and testing data using train_test_split • Train different classification models • Find hyperparameters using GridSearchCV  Plotting confusion matrices for each classification model  Assessing the accuracy of each classification model
  • 6.
    IBM Applied DataScience Capstone | Daniel Barnes | 2022 6 6 DATA COLLECTION – SPACE X REST API Using the SpaceX API to retrieve data about launches, including information about the rocket used, payload delivered, launch specifications, landing specifications, and landing outcome. 1 3 2 4 • Make a GET response to the SpaceX REST API • Convert the response to a .json file then to a Pandas DataFrame 1 • Use custom logic to clean the data (see Appendix) • Define lists for data to be stored in • Call custom functions (see Appendix) to retrieve data and fill the lists • Use these lists as values in a dictionary and construct the dataset 2 • Create a Pandas DataFrame from the constructed dictionary dataset 3 • Filter the DataFrame to only include Falcon 9 launches • Reset the FlightNumber column • Replace missing values of PayloadMass with the mean PayloadMass value 4 GitHub Link
  • 7.
    IBM Applied DataScience Capstone | Daniel Barnes | 2022 7 7 DATA COLLECTION – WEB SCRAPING Web scraping to collect Falcon 9 historical launch records from a Wikipedia page titled List of Falcon 9 and Falcon Heavy launches. 1 2 3 4 5 • Request the HTML page from the static URL • Assign the response to an object 1 • Create a BeautifulSoup object from the HTML response object • Find all tables within the HTML page 2 • Use the column names as keys in a dictionary • Use custom functions and logic to parse all launch tables (see Appendix) to fill the dictionary values 4 • Convert the dictionary to a Pandas DataFrame ready for export 5 • Collect all column header names from the tables found within the HTML page 3 GitHub Link
  • 8.
    IBM Applied DataScience Capstone | Daniel Barnes | 2022 8 8 DATA MANIPULATION/WRANGLING – PANDAS Context: • The SpaceX dataset contains several Space X launch facilities, and each location is in the LaunchSite column. • Each launch aims to a dedicated orbit, and some of the common orbit types are shown in the figure below. The orbit type is in the Orbit column. Initial Data Exploration: • Using the .value_counts() method to determine the following: 1. Number of launches on each site 2. Number and occurrence of each orbit 3. Number and occurrence of landing outcome per orbit type 1 2 3 GitHub Link
  • 9.
    IBM Applied DataScience Capstone | Daniel Barnes | 2022 9 9 DATA MANIPULATION/WRANGLING – PANDAS Context: • The landing outcome is shown in the Outcome column:  True Ocean – the mission outcome was successfully landed to a specific region of the ocean  False Ocean – the mission outcome was unsuccessfully landed to a specific region of the ocean.  True RTLS – the mission outcome was successfully landed to a ground pad  False RTLS – the mission outcome was unsuccessfully landed to a ground pad.  True ASDS – the mission outcome was successfully landed to a drone ship  False ASDS – the mission outcome was unsuccessfully landed to a drone ship.  None ASDS and None None – these represent a failure to land. Data Wrangling: • To determine whether a booster will successfully land, it is best to have a binary column, i.e., where the value is 1 or 0, representing the success of the landing. • This is done by: 1. Defining a set of unsuccessful (bad) outcomes, bad_outcome 2. Creating a list, landing_class, where the element is 0 if the corresponding row in Outcome is in the set bad_outcome, otherwise, it’s 1. 3. Create a Class column that contains the values from the list landing_class 4. Export the DataFrame as a .csv file. 1 3 3 4 GitHub Link
  • 10.
    IBM Applied DataScience Capstone | Daniel Barnes | 2022 10 10 EXPLORATORY DATA ANALYSIS (EDA) – VISUALIZATION SCATTER CHARTS Scatter charts were produced to visualize the relationships between: • Flight Number and Launch Site • Payload and Launch Site • Orbit Type and Flight Number • Payload and Orbit Type BAR CHART A bar chart was produced to visualize the relationship between: • Success Rate and Orbit Type LINE CHARTS Line charts were produced to visualize the relationships between: • Success Rate and Year (i.e. the launch success yearly trend) GitHub Link Scatter charts are useful to observe relationships, or correlations, between two numeric variables. Bar charts are used to compare a numerical value to a categorical variable. Horizontal or vertical bar charts can be used, depending on the size of the data. Line charts contain numerical values on both axes, and are generally used to show the change of a variable over time.
  • 11.
    IBM Applied DataScience Capstone | Daniel Barnes | 2022 11 11 EXPLORATORY DATA ANALYSIS (EDA) – SQL To gather some information about the dataset, some SQL queries were performed. The SQL queries performed on the data set were used to: 1. Display the names of the unique launch sites in the space mission 2. Display 5 records where launch sites begin with the string ‘CCA’ 3. Display the total payload mass carried by boosters launched by NASA (CRS) 4. Display the average payload mass carried by booster version F9 v1.1 5. List the date when the first successful landing outcome on a ground pad was achieved 6. List the names of the boosters which had success on a drone ship and a payload mass between 4000 and 6000 kg 7. List the total number of successful and failed mission outcomes 8. List the names of the booster versions which have carried the maximum payload mass 9. List the failed landing outcomes on drone ships, their booster versions, and launch site names for 2015 10. Rank the count of landing outcomes (such as Failure (drone ship) or Success (ground pad)) between the date 2010-06-04 and 2017-03-20, in descending order GitHub Link
  • 12.
    IBM Applied DataScience Capstone | Daniel Barnes | 2022 12 12 GEOSPATIAL ANALYSIS – FOLIUM The following steps were taken to visualize the launch data on an interactive map: 1. Mark all launch sites on a map • Initialise the map using a Folium Map object • Add a folium.Circle and folium.Marker for each launch site on the launch map 2. Mark the success/failed launches for each site on a map • As many launches have the same coordinates, it makes sense to cluster them together. • Before clustering them, assign a marker colour of successful (class = 1) as green, and failed (class = 0) as red. • To put the launches into clusters, for each launch, add a folium.Marker to the MarkerCluster() object. • Create an icon as a text label, assigning the icon_color as the marker_colour determined previously. 3. Calculate the distances between a launch site to its proximities • To explore the proximities of launch sites, calculations of distances between points can be made using the Lat and Long values. • After marking a point using the Lat and Long values, create a folium.Marker object to show the distance. • To display the distance line between two points, draw a folium.PolyLine and add this to the map. GitHub Link
  • 13.
    IBM Applied DataScience Capstone | Daniel Barnes | 2022 13 13 INTERACTIVE DASHBOARD – PLOTLY DASH The following plots were added to a Plotly Dash dashboard to have an interactive visualisation of the data: 1. Pie chart (px.pie()) showing the total successful launches per site • This makes it clear to see which sites are most successful • The chart could also be filtered (using a dcc.Dropdown() object) to see the success/failure ratio for an individual site 2. Scatter graph (px.scatter()) to show the correlation between outcome (success or not) and payload mass (kg) • This could be filtered (using a RangeSlider() object) by ranges of payload masses • It could also be filtered by booster version GitHub Link
  • 14.
    IBM Applied DataScience Capstone | Daniel Barnes | 2022 14 14 The following steps were taking to develop, evaluate, and find the best performing classification model: PREDICTIVE ANALYSIS - CLASSIFICATION GitHub Link Model Development • To prepare the dataset for model development: • Load dataset • Perform necessary data transformations (standardise and pre- process) • Split data into training and test data sets, using train_test_split() • Decide which type of machine learning algorithms are most appropriate • For each chosen algorithm: • Create a GridSearchCV object and a dictionary of parameters • Fit the object to the parameters • Use the training data set to train the model Model Evaluation • For each chosen algorithm: • Using the output GridSearchCV object: • Check the tuned hyperparameters (best_params_) • Check the accuracy (score and best_score_) • Plot and examine the Confusion Matrix Finding the Best Classification Model • Review the accuracy scores for all chosen algorithms • The model with the highest accuracy score is determined as the best performing model 1
  • 15.
    RESULTS Exploratory Data Analysis InteractiveAnalytics Predictive Analysis
  • 16.
  • 17.
    IBM Applied DataScience Capstone | Daniel Barnes | 2022 17 17 LAUNCH SITE VS. FLIGHT NUMBER The scatter plot of Launch Site vs. Flight Number shows that: • As the number of flights increases, the rate of success at a launch site increases. • Most of the early flights (flight numbers < 30) were launched from CCAFS SLC 40, and were generally unsuccessful. • The flights from VAFB SLC 4E also show this trend, that earlier flights were less successful. • No early flights were launched from KSC LC 39A, so the launches from this site are more successful. • Above a flight number of around 30, there are significantly more successful landings (Class = 1).
  • 18.
    IBM Applied DataScience Capstone | Daniel Barnes | 2022 18 18 LAUNCH SITE VS. PAYLOAD MASS The scatter plot of Launch Site vs. Payload Mass shows that: • Above a payload mass of around 7000 kg, there are very few unsuccessful landings, but there is also far less data for these heavier launches. • There is no clear correlation between payload mass and success rate for a given launch site. • All sites launched a variety of payload masses, with most of the launches from CCAFS SLC 40 being comparatively lighter payloads (with some outliers).
  • 19.
    IBM Applied DataScience Capstone | Daniel Barnes | 2022 19 19 SUCCESS RATE VS. ORBIT TYPE The bar chart of Success Rate vs. Orbit Type shows that the following orbits have the highest (100%) success rate: • ES-L1 (Earth-Sun First Lagrangian Point) • GEO (Geostationary Orbit) • HEO (High Earth Orbit) • SSO (Sun-synchronous Orbit) The orbit with the lowest (0%) success rate is: • SO (Heliocentric Orbit)
  • 20.
    IBM Applied DataScience Capstone | Daniel Barnes | 2022 20 20 ORBIT TYPE VS. FLIGHT NUMBER This scatter plot of Orbit Type vs. Flight number shows a few useful things that the previous plots did not, such as: • The 100% success rate of GEO, HEO, and ES- L1 orbits can be explained by only having 1 flight into the respective orbits. • The 100% success rate in SSO is more impressive, with 5 successful flights. • There is little relationship between Flight Number and Success Rate for GTO. • Generally, as Flight Number increases, the success rate increases. This is most extreme for LEO, where unsuccessful landings only occurred for the low flight numbers (early launches).
  • 21.
    IBM Applied DataScience Capstone | Daniel Barnes | 2022 21 21 ORBIT TYPE VS. PAYLOAD MASS This scatter plot of Orbit Type vs. Payload Mass shows that: • The following orbit types have more success with heavy payloads: • PO (although the number of data points is small) • ISS • LEO • For GTO, the relationship between payload mass and success rate is unclear. • VLEO (Very Low Earth Orbit) launches are associated with heavier payloads, which makes intuitive sense.
  • 22.
    IBM Applied DataScience Capstone | Daniel Barnes | 2022 22 22 LAUNCH SUCCESS YEARLY TREND The line chart of yearly average success rate shows that: • Between 2010 and 2013, all landings were unsuccessful (as the success rate is 0). • After 2013, the success rate generally increased, despite small dips in 2018 and 2020. • After 2016, there was always a greater than 50% chance of success.
  • 23.
  • 24.
    IBM Applied DataScience Capstone | Daniel Barnes | 2022 24 24 ALL LAUNCH SITE NAMES Find the names of the unique launch sites. The word UNIQUE returns only unique values from the LAUNCH_SITE column of the SPACEXTBL table.
  • 25.
    IBM Applied DataScience Capstone | Daniel Barnes | 2022 25 25 LAUNCH SITE NAMES BEGIN WITH 'CCA' Find 5 records where launch sites begin with ‘CCA’. LIMIT 5 fetches only 5 records, and the LIKE keyword is used with the wild card ‘CCA%’ to retrieve string values beginning with ‘CCA’.
  • 26.
    IBM Applied DataScience Capstone | Daniel Barnes | 2022 26 26 TOTAL PAYLOAD MASS Calculate the total payload carried by boosters from NASA. The SUM keyword is used to calculate the total of the LAUNCH column, and the SUM keyword (and the associated condition) filters the results to only boosters from NASA (CRS).
  • 27.
    IBM Applied DataScience Capstone | Daniel Barnes | 2022 27 27 AVERAGE PAYLOAD MASS BY F9 V1.1 Calculate the average payload mass carried by booster version F9 v1.1. The AVG keyword is used to calculate the average of the PAYLOAD_MASS__KG_ column, and the WHERE keyword (and the associated condition) filters the results to only the F9 v1.1 booster version.
  • 28.
    IBM Applied DataScience Capstone | Daniel Barnes | 2022 28 28 FIRST SUCCESSFUL GROUND LANDING DATE Find the dates of the first successful landing outcome on ground pad. The MIN keyword is used to calculate the minimum of the DATE column, i.e. the first date, and the WHERE keyword (and the associated condition) filters the results to only the successful ground pad landings.
  • 29.
    IBM Applied DataScience Capstone | Daniel Barnes | 2022 29 29 SUCCESSFUL DRONE SHIP LANDING WITH PAYLOAD BETWEEN 4000 AND 6000 List the names of boosters which have successfully landed on drone ship and had payload mass greater than 4000 but less than 6000. The WHERE keyword is used to filter the results to include only those that satisfy both conditions in the brackets (as the AND keyword is also used). The BETWEEN keyword allows for 4000 < x < 6000 values to be selected.
  • 30.
    IBM Applied DataScience Capstone | Daniel Barnes | 2022 30 30 TOTAL NUMBER OF SUCCESSFUL AND FAILURE MISSION OUTCOMES Calculate the total number of successful and failure mission outcome. The COUNT keyword is used to calculate the total number of mission outcomes, and the GROUPBY keyword is also used to group these results by the type of mission outcome.
  • 31.
    IBM Applied DataScience Capstone | Daniel Barnes | 2022 31 31 BOOSTERS CARRIED MAXIMUM PAYLOAD List the names of the booster which have carried the maximum payload mass. A subquery is used here. The SELECT statement within the brackets finds the maximum payload, and this value is used in the WHERE condition. The DISTINCT keyword is then used to retrieve only distinct /unique booster versions.
  • 32.
    IBM Applied DataScience Capstone | Daniel Barnes | 2022 32 32 2015 LAUNCH RECORDS List the failed landing_outcomes in drone ship, their booster versions, and launch site names for in year 2015. The WHERE keyword is used to filter the results for only failed landing outcomes, AND only for the year of 2015.
  • 33.
    IBM Applied DataScience Capstone | Daniel Barnes | 2022 33 33 RANK LANDING OUTCOMES BETWEEN 2010-06-04 AND 2017-03-20 Rank the count of landing outcomes (such as Failure (drone ship) or Success (ground pad)) between the date 2010-06-04 and 2017-03-20, in descending order. The WHERE keyword is used with the BETWEEN keyword to filter the results to dates only within those specified. The results are then grouped and ordered, using the keywords GROUP BY and ORDER BY, respectively, where DESC is used to specify the descending order.
  • 34.
    LAUNCH SITES PROXIMITY ANALYSIS– FOLIUM INTERACTIVE MAP
  • 35.
    IBM Applied DataScience Capstone | Daniel Barnes | 2022 35 35 ALL LAUNCH SITES ON A MAP All SpaceX launch sites are on coasts of the United States of America, specifically Florida and California.
  • 36.
    IBM Applied DataScience Capstone | Daniel Barnes | 2022 36 36 SUCCESS/FAILED LAUNCHES FOR EACH SITE Launches have been grouped into clusters, and annotated with green icons for successful launches, and red icons for failed launches. ¿ CCAFS SLC-40 and CCAFS LC-40 KSC LC-39A VAFB SLC-4E
  • 37.
    IBM Applied DataScience Capstone | Daniel Barnes | 2022 37 37 PROXIMITY OF LAUNCH SITES TO OTHER POINTS OF INTEREST Are launch sites in close proximity to railways? • YES. The coastline is only 0.87 km due East. Are launch sites in close proximity to highways? • YES. The nearest highway is only 0.59km away. Are launch sites in close proximity to railways? • YES. The nearest railway is only 1.29 km away. Do launch sites keep certain distance away from cities? • YES. The nearest city is 51.74 km away. Using the CCAFS SLC-40 launch site as an example site, we can understand more about the placement of launch sites.
  • 38.
  • 39.
    IBM Applied DataScience Capstone | Daniel Barnes | 2022 39 39 LAUNCH SUCCESS COUNT FOR ALL SITES The launch site KSC LC-39 A had the most successful launches, with 41.7% of the total successful launches.
  • 40.
    IBM Applied DataScience Capstone | Daniel Barnes | 2022 40 40 PIE CHART FOR THE LAUNCH SITE WITH HIGHEST LAUNCH SUCCESS RATIO Note: The launch site KSC LC-39 A also had the highest rate of successful launches, with a 76.9% success rate.
  • 41.
    IBM Applied DataScience Capstone | Daniel Barnes | 2022 41 41 LAUNCH OUTCOME VS. PAYLOAD SCATTER PLOT FOR ALL SITES • Plotting the launch outcome vs. payload for all sites shows a gap around 4000 kg, so it makes sense to split the data into 2 ranges: • 0 – 4000 kg (low payloads) • 4000 – 10000 kg (massive payloads) • From these 2 plots, it can be shown that the success for massive payloads is lower than that for low payloads. • It is also worth noting that some booster types (v1.0 and B5) have not been launched with massive payloads. 1 2 1 2 Low payloads Massive payloads Note: c
  • 42.
  • 43.
    IBM Applied DataScience Capstone | Daniel Barnes | 2022 43 43 CLASSIFICATION ACCURACY Plotting the Accuracy Score and Best Score for each classification algorithm produces the following result: • The Decision Tree model has the highest classification accuracy • The Accuracy Score is 94.44% • The Best Score is 90.36%
  • 44.
    IBM Applied DataScience Capstone | Daniel Barnes | 2022 44 44 CONFUSION MATRIX • As shown previously, best performing classification model is the Decision Tree model, with an accuracy of 94.44%. • This is explained by the confusion matrix, which shows only 1 out of 18 total results classified incorrectly (a false positive, shown in the top-right corner). • The other 17 results are correctly classified (5 did not land, 12 did land).
  • 45.
  • 46.
    IBM Applied DataScience Capstone | Daniel Barnes | 2022 46 46 CONCLUSIONS • As the number of flights increases, the rate of success at a launch site increases, with most early flights being unsuccessful. I.e. with more experience, the success rate increases. • Between 2010 and 2013, all landings were unsuccessful (as the success rate is 0). • After 2013, the success rate generally increased, despite small dips in 2018 and 2020. • After 2016, there was always a greater than 50% chance of success. • Orbit types ES-L1, GEO, HEO, and SSO, have the highest (100%) success rate. • The 100% success rate of GEO, HEO, and ES-L1 orbits can be explained by only having 1 flight into the respective orbits. • The 100% success rate in SSO is more impressive, with 5 successful flights. • The orbit types PO, ISS, and LEO, have more success with heavy payloads: • VLEO (Very Low Earth Orbit) launches are associated with heavier payloads, which makes intuitive sense. • The launch site KSC LC-39 A had the most successful launches, with 41.7% of the total successful launches, and also the highest rate of successful launches, with a 76.9% success rate. • The success for massive payloads (over 4000kg) is lower than that for low payloads. • The best performing classification model is the Decision Tree model, with an accuracy of
  • 47.
  • 48.
    IBM Applied DataScience Capstone | Daniel Barnes | 2022 48 48 DATA COLLECTION – SPACE X REST API • Custom functions to retrieve the required information • Custom logic to clean the data
  • 49.
    IBM Applied DataScience Capstone | Daniel Barnes | 2022 49 49 DATA COLLECTION – WEB SCRAPING • Custom functions for web scraping • Custom logic to fill up the launch_dict values with values from the launch tables