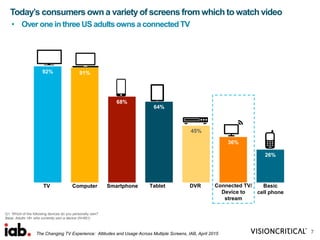
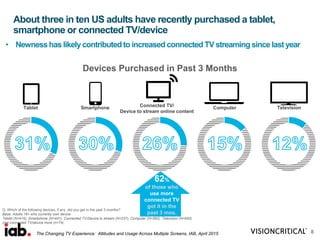
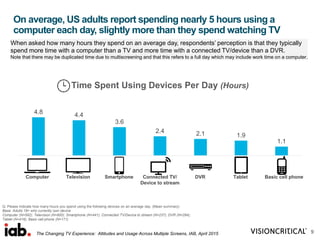
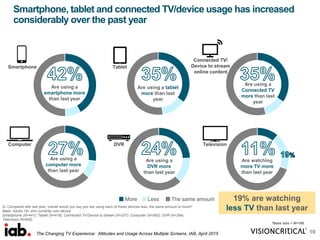
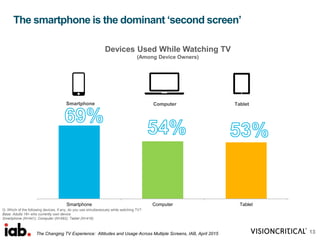
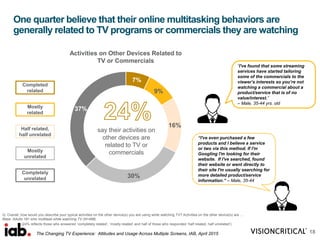
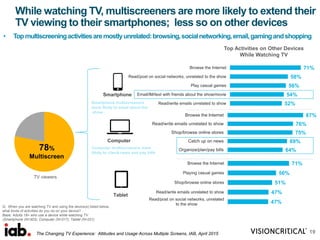
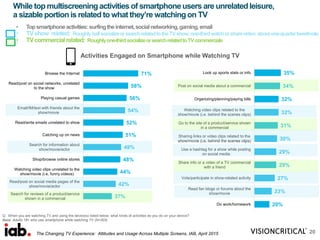
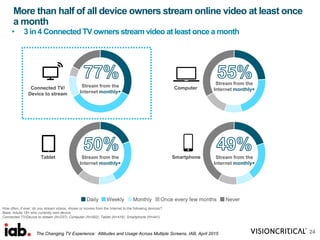
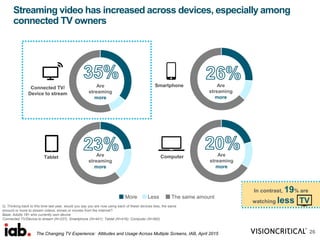
The document reports on a study conducted by IAB on device ownership, usage, and attitudes towards television viewing across multiple screens. Some key findings include:
- Nearly two-thirds of Americans own a smartphone and tablet, while one in three own a connected TV. Many have also purchased a new device like a smartphone, tablet or connected TV in the past year.
- On average, Americans spend nearly 5 hours a day on their computer, over 3 hours on their smartphone, and 2.5 hours streaming content to their connected TV.
- Multiscreening while watching TV is common, with 78% using a second screen like a smartphone. This is mostly for unrelated activities but some content on these screens is related
Pesquisa Accenture Multi-tasking and Taking Control. O estudo realizado com 3,5 mil pessoas, em seis países, apontou que conquistar a atenção exclusiva dos telespectadores está mais difícil. O consumidor moderno concilia a TV com outras atividades.
Reference: Millward Brown | AD Reaction Video | Global Digital Strategist
Millward Brown’s AdReaction Video study explored how, where, and why multiscreen users in 42 countries are viewing video, and what marketers need to know to create video that is effective across screens. We have interviewed over 13 500 multiscreen users (ages 16-45 who own or have access to a TV and a smartphone or tablet). We also tested 20 Tv ads in 8 countries across TV, digital and mobile platforms.
#ADReaction
Voice technology is quickly becoming the status quo for brands looking to reach and better engage consumers. The numbers make that clear: According to a new study by Adobe Analytics, 91% of 401 business decision makers surveyed said they already are making significant investments in voice, and 94% said they plan to increase their investments in the next year.
From the Ericsson ConsumerLab: http://www.ericsson.com/thinkingahead/consumerlab
We have entered a new era in television. On-demand packages delivered via
Over The Top (OTT), cable or IPTV are being embraced by people around the world.
These new technologies
and services not only improve
people’s viewing experience –
they also change the fundamental ways in which we approach entertainment.
The explosive growth of TV connected devices is driving rapid change for the TV industry. ADI found that TV connected device (TVCD) sales are up 143% year over year (YoY). In addition, TVE time spent viewing on connected devices is up 149% YoY.
Kid´s Audience Behavior Across PlatformsJonathan Blum
With increasingly diverse platforms available, kids consume multiple types of media and spend many of their waking hours in front of multiple types of screens, often simultaneously. As more technologies and devices become available to kids (and as kids become older and savvy enough to use these devices), how do behaviors change and shift from one platform to another? How does the presence of other household members affect the amount and type of content consumed?
Courtesy of: Nielsen
2014 The prevalent multi-screen trend in China and note for marketersConcur
Multi-screen viewing is one of the latest digital trends to emerge in China, making the need to adapt to the multi-screen landscape a major challenge for marketers and brands in 2014. The focus of this paper is to study the often-noticed trend of how people in China are using a combination of smartphones, tablets and computer to consume digital content, and how marketers should capture the multi-screen opportunity.
Ericsson Mobility Report, November 2015 - Regional report North East AsiaEricsson
The November 2015 edition of the Mobility Report provides updated trends and forecasts for mobile data traffic. From the addition of 87 million new mobile broadband subscriptions in Q3 2015 to the estimate that video will account for 70 percent of total mobile traffic by 2021.
Mobile money, Market Information, and Tools for Improving Food Security: Prospects and Challenges in Mozambique - Alan de Brauw
Presentation at MSU/IFPRI conference on “Agricultural Public Investments, Policies, and Markets for Mozambique’s Food Security and Economic Transformation”, Maputo, Mozambique, 20 November 2014
Portuguese version: http://www.slideshare.net/IFPRIDSG/alan-port
Using Social Media to Advance Your InstitutionLannie Byrd
Using Social Media to Advanced Your Institution presented to the 2014 MIAA Summer Advancement Conference at Pittsburg State University in Pittsburg, KS. The presentation focuses on the digital landscape in 2014, basics of social media and advanced social media topics focusing on content strategy and native advertising.
Size does matter—at least when it comes to TV Everywhere (TVE) viewing, according to a new report from Adobe Digital Insights (ADI), which looked at TVE consumption trends from January 2015 to January 2017.
Using proven science to understand consumer media behavior is something Nielsen is unrivaled at doing. This is especially true when we look at shifting behaviors beyond the here and now.
TV & Video: An Analysis of Consumer Habit Ericsson
From the Ericsson ConsumerLab: http://www.ericsson.com/thinkingahead/consumerlab
We have entered a new era in television. On-demand packages delivered via
Over The Top (OTT), cable or IPTV are being embraced by people around the world.
These new technologies
and services not only improve
people’s viewing experience –
they also change the fundamental ways in which we approach entertainment.
Media and Mobile Trends 2015: Where and How Are Consumers Tuning In?Deloitte United States
Explore the results of Deloitte’s ninth edition of the Digital Democracy Survey, including:
•Evolving media consumption habits, including preferences related to binge watching, streaming video, and over-the-top viewing habits
•Effectiveness of various advertising methods, both traditional and online
•Changing consumer behaviors related to mobile device ownership and usage
For more information visit www.deloitte.com/us/tmtrends.
Millward Brown Research: AdReaction: Video Creative in a Digital WorldIAB Europe
AdReaction studies have been conducted since 2001, delivering insights on consumers' perceptions of advertising, particularly digital formats.
AdReaction: Video Creative in a Digital World addresses key questions facing marketers, including:
• How are videos viewed by screen – and for how long?
• What do people think of video ads by screen?
• How can I create ads that consumers won’t skip?
We surveyed, via smartphone or tablet, more than 13,500 16-45 year old multiscreen users across 42 countries. Multiscreen users were defined as people who own, or have access to, a TV and a smartphone and/or a tablet. We also conducted parallel copy testing for 20 ads in eight countries, across TV, online video and mobile video ad formats, interviewing more than 10,000 consumers.
This report summarizes overall global learning. For data by country, please visit www.millwardbrown.com/adreaction
Millward Brown AdReaction: Video Creative in a Digital World Global ReportKantar
Millward Brown's AdReaction Video explores how, where and why multiscreen users in 42 countries are viewing video, and what marketers need to know to create video that is effective across screens. We interviewed over 13,500 multiscreen users (ages 16-45 who own or have access to a TV and a smartphone of tablet). We also tested 20 TV as in 8 countries across TV, digital and mobile platforms.
http://www.millwardbrown.com/adreaction/video/
Connecting the story - THE FIRST GLOBAL STUDY OF NEWS CONSUMPTION ACROSS MULT...Merlien Institute
Presented by Joe Hall, Senior Business Insights Manager, BBC
at Market Research in the Mobile World Europe
8 - 11 October 2013, London, Europe
This event is proudly organised by Merlien Institute
Check out our upcoming events by visiting http://www.mrmw.net
Advancements in viewing technology and increased competition for eyeballs have resulted in a more fragmented environment where consumers can watch TV from a wide array of devices and access content from countless sources. Led by certain segments of the population, most notably Millennials, consumers have quickly adapted to this new environment and are drastically changing their viewing patterns at an accelerating rate. In this report, we asked more than 1,000 Americans about their TV viewing behaviors to provide context for the shifts in their consumption habits and better understand viewing audiences.
Hành Vi Khách Hàng Lai - Cross Platform - Việt Nam 2014Digital Story
Theo báo cáo trên đây thì năm 2015 sẽ là năm của tiếp thị trên di động.
Chính bởi vậy, đây sẽ chính là chủ đề tiếp theo mà năm nay Digital Story muốn mang tới cho quý vị.
Similar to The Changing TV Experience: Attitudes and Usage Across Multiple Screens (20)
The State of Social report is our quarterly check-in with
50 of the top brands in the world and their sophistication
across the major social properties. In Q4, we’re
introducing one new channel and researching new tactics,
strategies, and campaigns to see who’s pushing the
envelope in the social world.
Last quarter, sports, retail, and automotive were the
leading industries in our study. Who led the industry in
Q4? Let’s dive into the data
The Digital Future: a game plan for consumer packaged-goodsAidelisa Gutierrez
The CPG industry is fast approaching a tipping point;
companies need to plan for a “1-5-10” market in the U.S.
over the next five years. The experience of other sectors
demonstrates that early movers often establish tough-totrump
positions and advantages.
Nielsen Global New Product Innovation Report- June 2015Aidelisa Gutierrez
Innovation matters. It can drive profitability and growth, helping
companies succeed even during tough economic times. Nielsen’s
Breakthrough Innovation research found that the top innovations
launched in the U.S. generate more than $50 million revenue their first
year; in fact, the 2015 winners generated, on average, more than twice
this amount, $119 million. In Europe, the top innovations produce
upwards of £/€10 million in their launch year. Innovation also helps
companies stay relevant to shoppers, and it can build long-term loyalty
SCREEN WARS: THE BATTLE FOR EYE SPACE IN A TV-EVERYWHERE WORLDAidelisa Gutierrez
While media fragmentation is happening across all formats, the “Screen Wars” report focuses on video programming, which we define as any type of content, such as TV, cable shows, professional video or user-generated content, that is watched on your TV, PC, mobile phone, tablet or e-reader device. The Nielsen Global Digital Landscape Survey polled 30,000 online respondents in 60 countries to understand how the changing digital landscape is affecting how, where and why we watch video programming. We also examine consumption preferences for video programming, including the devices most commonly used for selected genres and the devices used to view video at home and on the go.
http://www.nielsen.com/us/en/insights/reports/2015/screen-wars-the-battle-for-eye-space-in-a-tv-everywhere-world.html
1. Connect your CRM data. Don’t just collect it and keep it in silos.
2. Invest more in mobile. Mobile targeting and ROI are looking better than ever.
3. Personalize. It’s the big pay-off of all that data and analysis.
4. Measure, measure, measure. Know what works and double down.
5. Be up front about privacy. Consider the other side of targeting.
In all six cultures Catalyst studied, altruistic leader
behaviors such as empowerment and humility were
an important part of the repertoire among inclusive
leaders. Further, Catalyst found that the practice of
altruistic leadership is an effective way of helping
women and men feel included. Our results suggest
that global organizations seeking to create more
inclusive work cultures should consider how
to develop and reinforce altruistic leadership
behaviors among their talent—especially among
emerging leaders.
Millennials overwhelmingly believe that business needs a reset in terms of paying as much attention to people and purpose as it does products and profit. Seventy-five
percent of Millennials believe businesses are too
fixated on their own agendas and not focused
enough on helping to improve society.
The economist intelligence unit: Voice of the customer, whose job is it, anywayAidelisa Gutierrez
In what areas should marketing focus investments in order to contribute most to your business in 3 years?
#1 Customer Analytic
#2 Customer Relationship Management
#3 Social Media
Essentials of Automations: The Art of Triggers and Actions in FMESafe Software
In this second installment of our Essentials of Automations webinar series, we’ll explore the landscape of triggers and actions, guiding you through the nuances of authoring and adapting workspaces for seamless automations. Gain an understanding of the full spectrum of triggers and actions available in FME, empowering you to enhance your workspaces for efficient automation.
We’ll kick things off by showcasing the most commonly used event-based triggers, introducing you to various automation workflows like manual triggers, schedules, directory watchers, and more. Plus, see how these elements play out in real scenarios.
Whether you’re tweaking your current setup or building from the ground up, this session will arm you with the tools and insights needed to transform your FME usage into a powerhouse of productivity. Join us to discover effective strategies that simplify complex processes, enhancing your productivity and transforming your data management practices with FME. Let’s turn complexity into clarity and make your workspaces work wonders!
Why You Should Replace Windows 11 with Nitrux Linux 3.5.0 for enhanced perfor...SOFTTECHHUB
The choice of an operating system plays a pivotal role in shaping our computing experience. For decades, Microsoft's Windows has dominated the market, offering a familiar and widely adopted platform for personal and professional use. However, as technological advancements continue to push the boundaries of innovation, alternative operating systems have emerged, challenging the status quo and offering users a fresh perspective on computing.
One such alternative that has garnered significant attention and acclaim is Nitrux Linux 3.5.0, a sleek, powerful, and user-friendly Linux distribution that promises to redefine the way we interact with our devices. With its focus on performance, security, and customization, Nitrux Linux presents a compelling case for those seeking to break free from the constraints of proprietary software and embrace the freedom and flexibility of open-source computing.
UiPath Test Automation using UiPath Test Suite series, part 5DianaGray10
Welcome to UiPath Test Automation using UiPath Test Suite series part 5. In this session, we will cover CI/CD with devops.
Topics covered:
CI/CD with in UiPath
End-to-end overview of CI/CD pipeline with Azure devops
Speaker:
Lyndsey Byblow, Test Suite Sales Engineer @ UiPath, Inc.
Epistemic Interaction - tuning interfaces to provide information for AI supportAlan Dix
Paper presented at SYNERGY workshop at AVI 2024, Genoa, Italy. 3rd June 2024
https://alandix.com/academic/papers/synergy2024-epistemic/
As machine learning integrates deeper into human-computer interactions, the concept of epistemic interaction emerges, aiming to refine these interactions to enhance system adaptability. This approach encourages minor, intentional adjustments in user behaviour to enrich the data available for system learning. This paper introduces epistemic interaction within the context of human-system communication, illustrating how deliberate interaction design can improve system understanding and adaptation. Through concrete examples, we demonstrate the potential of epistemic interaction to significantly advance human-computer interaction by leveraging intuitive human communication strategies to inform system design and functionality, offering a novel pathway for enriching user-system engagements.
Generative AI Deep Dive: Advancing from Proof of Concept to ProductionAggregage
Join Maher Hanafi, VP of Engineering at Betterworks, in this new session where he'll share a practical framework to transform Gen AI prototypes into impactful products! He'll delve into the complexities of data collection and management, model selection and optimization, and ensuring security, scalability, and responsible use.
Dr. Sean Tan, Head of Data Science, Changi Airport Group
Discover how Changi Airport Group (CAG) leverages graph technologies and generative AI to revolutionize their search capabilities. This session delves into the unique search needs of CAG’s diverse passengers and customers, showcasing how graph data structures enhance the accuracy and relevance of AI-generated search results, mitigating the risk of “hallucinations” and improving the overall customer journey.
LF Energy Webinar: Electrical Grid Modelling and Simulation Through PowSyBl -...DanBrown980551
Do you want to learn how to model and simulate an electrical network from scratch in under an hour?
Then welcome to this PowSyBl workshop, hosted by Rte, the French Transmission System Operator (TSO)!
During the webinar, you will discover the PowSyBl ecosystem as well as handle and study an electrical network through an interactive Python notebook.
PowSyBl is an open source project hosted by LF Energy, which offers a comprehensive set of features for electrical grid modelling and simulation. Among other advanced features, PowSyBl provides:
- A fully editable and extendable library for grid component modelling;
- Visualization tools to display your network;
- Grid simulation tools, such as power flows, security analyses (with or without remedial actions) and sensitivity analyses;
The framework is mostly written in Java, with a Python binding so that Python developers can access PowSyBl functionalities as well.
What you will learn during the webinar:
- For beginners: discover PowSyBl's functionalities through a quick general presentation and the notebook, without needing any expert coding skills;
- For advanced developers: master the skills to efficiently apply PowSyBl functionalities to your real-world scenarios.
Maruthi Prithivirajan, Head of ASEAN & IN Solution Architecture, Neo4j
Get an inside look at the latest Neo4j innovations that enable relationship-driven intelligence at scale. Learn more about the newest cloud integrations and product enhancements that make Neo4j an essential choice for developers building apps with interconnected data and generative AI.
Goodbye Windows 11: Make Way for Nitrux Linux 3.5.0!SOFTTECHHUB
As the digital landscape continually evolves, operating systems play a critical role in shaping user experiences and productivity. The launch of Nitrux Linux 3.5.0 marks a significant milestone, offering a robust alternative to traditional systems such as Windows 11. This article delves into the essence of Nitrux Linux 3.5.0, exploring its unique features, advantages, and how it stands as a compelling choice for both casual users and tech enthusiasts.
In his public lecture, Christian Timmerer provides insights into the fascinating history of video streaming, starting from its humble beginnings before YouTube to the groundbreaking technologies that now dominate platforms like Netflix and ORF ON. Timmerer also presents provocative contributions of his own that have significantly influenced the industry. He concludes by looking at future challenges and invites the audience to join in a discussion.
GraphSummit Singapore | The Art of the Possible with Graph - Q2 2024Neo4j
Neha Bajwa, Vice President of Product Marketing, Neo4j
Join us as we explore breakthrough innovations enabled by interconnected data and AI. Discover firsthand how organizations use relationships in data to uncover contextual insights and solve our most pressing challenges – from optimizing supply chains, detecting fraud, and improving customer experiences to accelerating drug discoveries.
UiPath Test Automation using UiPath Test Suite series, part 6DianaGray10
Welcome to UiPath Test Automation using UiPath Test Suite series part 6. In this session, we will cover Test Automation with generative AI and Open AI.
UiPath Test Automation with generative AI and Open AI webinar offers an in-depth exploration of leveraging cutting-edge technologies for test automation within the UiPath platform. Attendees will delve into the integration of generative AI, a test automation solution, with Open AI advanced natural language processing capabilities.
Throughout the session, participants will discover how this synergy empowers testers to automate repetitive tasks, enhance testing accuracy, and expedite the software testing life cycle. Topics covered include the seamless integration process, practical use cases, and the benefits of harnessing AI-driven automation for UiPath testing initiatives. By attending this webinar, testers, and automation professionals can gain valuable insights into harnessing the power of AI to optimize their test automation workflows within the UiPath ecosystem, ultimately driving efficiency and quality in software development processes.
What will you get from this session?
1. Insights into integrating generative AI.
2. Understanding how this integration enhances test automation within the UiPath platform
3. Practical demonstrations
4. Exploration of real-world use cases illustrating the benefits of AI-driven test automation for UiPath
Topics covered:
What is generative AI
Test Automation with generative AI and Open AI.
UiPath integration with generative AI
Speaker:
Deepak Rai, Automation Practice Lead, Boundaryless Group and UiPath MVP
Climate Impact of Software Testing at Nordic Testing DaysKari Kakkonen
My slides at Nordic Testing Days 6.6.2024
Climate impact / sustainability of software testing discussed on the talk. ICT and testing must carry their part of global responsibility to help with the climat warming. We can minimize the carbon footprint but we can also have a carbon handprint, a positive impact on the climate. Quality characteristics can be added with sustainability, and then measured continuously. Test environments can be used less, and in smaller scale and on demand. Test techniques can be used in optimizing or minimizing number of tests. Test automation can be used to speed up testing.
By Design, not by Accident - Agile Venture Bolzano 2024
The Changing TV Experience: Attitudes and Usage Across Multiple Screens
1. The Changing TV Experience: Attitudes and
Usage Across Multiple Screens
April 2015
2. Objectives and Methodology
Objectives
• The IAB wanted to benchmark device ownership and usage and to understand how device behaviors and
perceptions are affecting or altering the TV viewing experience. Specifically, the objectives included
exploration into the impact of multiscreening and connected TV viewing.
Methodology
• Quantitative research was conducted among Adults 18 or older using Vision Critical’s Springboard
America online panel (fielded Jan 19-21, 2015).
• The sample used from Vision Critical’s Springboard America (SBA) online panel was designed to be
representative to the US census/online adult over 18 population. Sample size for this research is 651.
• In addition, 13 participants from the online quantitative survey were invited to participate in a 2-day online
discussion forum to share their experiences with streaming video content to their TV in comparison to
watching regular TV.
Definitions
• Multiscreening refers to using any of the following devices used simultaneously while watching TV:
Smartphone (iPhone, Android smartphone or Other smartphone), Tablet (iPad, Android-based tablet,
Windows-based tablet, Kindle Fire or Other tablet), Computer (desktop, laptop, netbook).
• Connected TV/device refers to a Connected TV (Smart TV) that can connect to the Internet directly or a
device to stream content to TV (Chromecast, Apple TV, Boxee Box, Roku, etc.).
2The Changing TV Experience: Attitudes and Usage Across Multiple Screens, IAB, April 2015
IAB Research Using Vision Critical’s Springboard America Online Panel, Representative of General US Adult 18+ Online Population, January 2015
3. Summary
3
IAB Research Using Vision Critical’s Springboard America Online Panel, Representative of General US Adult 18+ Online Population, January 2015
• Device Ownership and Usage
• Today’s consumers own a variety of streaming video-capable screens and they are using these devices more than
they did a year ago:
• Computer and TV ownership are nearly ubiquitous, Smartphone and Tablet ownership are on par – nearly two-thirds of
Americans own one and one in three US adults owns a connected TV.
• In addition, nearly 3 in 10 US adults has bought a new smartphone, tablet or connected TV in the past year.
• US adults surveyed say they spend nearly 5 hrs a day on their computer, slightly more than they spend watching TV. The
next most used devices are smartphone (3.6 hrs) and connected TV (2.4 hrs).
• 42% of smartphone owners report using their smartphones more; 35% use a tablet or connected TV more and 27% use
their computers more than they did a year ago.
• In contrast, 19% of TV viewers report watching less TV than they did a year ago.
• Streaming Video
• Most stream monthly: Three quarters of connected TV/device owners and roughly half of computer, tablet or smartphone
owners report streaming online video at least once a month.
• A sizable portion stream daily: One-third of connected TV owners stream video to their TV daily. One in four computer
owners and one in five smartphone or tablet owners stream video daily.
• Streaming video has increased across devices: One in three connected TV owners, one in four smartphone or tablet
owners and one in five computer owners have increased their online video streaming from a year ago.
The Changing TV Experience: Attitudes and Usage Across Multiple Screens, IAB, April 2015
4. Summary
4
• Multiscreening
• Multiscreening is the new normal:
• 78% of US adults who watch TV use another device while watching TV and the smartphone is the predominant second
screen: Two in three smartphone owners multiscreen while watching TV; over half of all computer or tablet owners
multiscreen
• Multiscreening is a daily habit and it is growing:
• 84% of smartphone multiscreeners do so daily, as do 79% of computer multiscreeners and 65% on tablets.
• The rise in multitasking is driven by smartphone and tablet owners: Multiscreening activity has increased for 40% of
smartphone multiscreeners, 39% who do so on tablets and 28% on computers.
• Which screen gets multiscreeners’ attention?
• Smartphone and tablet multiscreeners are more likely to pay attention to the TV (roughly 60:40 split); Computer
multiscreeners’ focus is half and half.
• Multiscreeners in aggregate report that about one-quarter of their device activities are related to what they’re watching.
• What exactly are multiscreeners doing while watching TV?
• Browsing the internet is the #1 multiscreening activity across devices and while the top activities are mostly unrelated
(social networking, email, gaming and shopping), a portion of multiscreeners’ activity is related to the TV show or
commercials.
• Top multiscreening activities on smartphones are unrelated leisure but smartphone multiscreeners are more likely to
extend the TV viewing experience to their devices. Half of them email, text or IM about the show and roughly one-third
socialize or search related to TV commercials.
• Computer multiscreening is mostly utilitarian but some activity is related to TV: Roughly 4 in 10 will search for info about
the show or a product advertised.
• Tablet multiscreening is a hybrid mix: Like smartphone use, top activities are unrelated leisure but TV-related
multiscreening mirrors that of computer users. Roughly 4 in 10 search, and about one-third socialize or visit sites related
to the TV show. 4 in 10 also visit sites or search products related to TV commercials; about 1 in 4 socialize around the
ads.
IAB Research Using Vision Critical’s Springboard America Online Panel, Representative of General US Adult 18+ Online Population, January 2015
The Changing TV Experience: Attitudes and Usage Across Multiple Screens, IAB, April 2015
5. Summary
5
• Connected TV
• Interestingly, about half of consumers state they are less likely to multiscreen while streaming a video to a connected TV than
while watching regular TV.
• One in three Americans over the age of 18 owns a connected TV/device daily to stream online video to a TV and one-third of
them use it daily.
• Connected TV owners lead in online streaming frequency:
• Three in four stream online video at least once a month
• They report spending an average of 2.4 hours per day streaming video to their TV, which is slightly longer than DVR owners
spend with their DVRs (2.1 hrs)
• Connected TV owners are also most likely to say they are streaming more now than compared to a year ago:
• 35% of connected TV viewers have increased their video streaming on this device.
• Meanwhile, 19% of TV viewers are watching less TV than they did last year.
• The increase is mainly driven by the recent purchase of a connected TV/device to stream (50%) followed by being able to
control how (40%) and when (38%) to watch video. One in three attribute their increased connected TV streaming to access
to or improved video content.
• Connected TV vs. TV:
• 38% of Connected TV owners say at least half of their TV screen time is spent streaming online video to their connected TV
• Half of connected TV owners consider their viewing experience to be as good as their TV.
• One quarter find streaming to be a superior experience when compared to their regular/pay TV provider, as it offers users
more control, better selection and the convenience to watch based on their schedules.
• Half prefer to stream video to their connected TV because there are fewer commercials and two in five find those
commercials to be less disruptive than regular TV ads.
• Connected TV content:
• Over three-quarters of connected TV users stream Netflix and YouTube video content at least once a month.
• About half stream TV shows, Amazon Prime and portal videos at least monthly.
• Original digital video is viewed regularly over connected TVs; over one-third stream webisodes monthly.
IAB Research Using Vision Critical’s Springboard America Online Panel, Representative of General US Adult 18+ Online Population, January 2015
The Changing TV Experience: Attitudes and Usage Across Multiple Screens, IAB, April 2015
6. Device Ownership and Usage
The Changing TV Experience: Attitudes and Usage Across Multiple Screens, IAB, April 2015
7. Q1. Which of the following devices do you personally own?
Base: Adults 18+ who currently own a device (N=651)
7
92% 91%
68%
64%
45%
36%
26%
TV Computer Smartphone Tablet DVR Connected TV/
Device to
stream
Basic
cell phone
• Over one in three US adults ownsa connected TV
Today’s consumers own a variety of screens from which to watch video
The Changing TV Experience: Attitudes and Usage Across Multiple Screens, IAB, April 2015
8. About three in ten US adults have recently purchased a tablet,
smartphone or connected TV/device
8
Q: Which of the following devices, if any, did you get in the past 3 months?
Base: Adults 18+ who currently own device
Tablet (N=416); Smartphone (N=441); Connected TV/Device to stream (N=237); Computer (N=592); Television (N=600)
Use connected TV/device more (n=74)
Connected TV/
Device to stream online content
SmartphoneTablet
Devices Purchased in Past 3 Months
Computer Television
62%
of those who
use more
connected TV
got it in the
past 3 mos.
• Newnesshas likely contributedto increased connected TV streaming since last year
The Changing TV Experience: Attitudes and Usage Across Multiple Screens, IAB, April 2015
9. 4.8 4.4
3.6
2.4 2.1 1.9
1.1
Computer Television Smartphone Connected TV/
Device to stream
DVR Tablet Basic Cell Phone
9
Q: Please indicate how many hours you spend using the following devices on an average day. (Mean summary)
Base: Adults 18+ who currently own device
Computer (N=592); Television (N=600); Smartphone (N=441); Connected TV/Device to stream (N=237); DVR (N=294);
Tablet (N=416); Basic cell phone (N=171)
Time Spent Using Devices Per Day (Hours)
Connected TV/
Device to stream
Smartphone TabletComputer Television Basic cell phoneDVR
On average, US adults report spending nearly 5 hours using a
computer each day, slightly more than they spend watching TV
When asked how many hours they spend on an average day, respondents’ perception is that they typically
spend more time with a computer than a TV and more time with a connected TV/device than a DVR.
Note that there may be duplicated time due to multiscreening and that this refers to a full day which may include work time on a computer.
The Changing TV Experience: Attitudes and Usage Across Multiple Screens, IAB, April 2015
10. Smartphone, tablet and connected TV/device usage has increased
considerably over the past year
Q: Compared with last year, overall would you say you are using each of these devices less, the same amount or more?
Base: Adults 18+ who currently own device
Smartphone (N=441); Tablet (N=416); Connected TV/Device to stream (N=237); Computer (N=592); DVR (N=294);
Television (N=600)
10
Smartphone
Are using a tablet
more than last
year
Tablet
Are using a
computer more
than last year
Computer DVR
*Base size < N=100
Are using a
Connected TV
more than last
year
Connected TV/
Device to stream
online content
Television
Are using a
smartphone more
than last year
Are using a
DVR more
than last year
Are watching
more TV more
than last year
19% are watching
less TV than last year
The Changing TV Experience: Attitudes and Usage Across Multiple Screens, IAB, April 2015
11. Multitasking Behaviors: How does owning
multiple screens affect TV viewing?
The Changing TV Experience: Attitudes and Usage Across Multiple Screens, IAB, April 2015
12. For the majority of the TV viewing audience, watching TV is no
longer a standalone experience
12
Q: Which of the following devices, if any, do you use simultaneously while watching TV?
Base: Adults 18+ who Use TV (600)
Smartphone
Tablet
Computer
Use Another Device While
Watching TV
Yes, use another device
while watching TV
None, I never use any
other devices while I
watch TV
78% of US adults who watch TV use another device while watching TV
The Changing TV Experience: Attitudes and Usage Across Multiple Screens, IAB, April 2015
13. The smartphone is the dominant ‘second screen’
13
Q: Which of the following devices, if any, do you use simultaneously while watching TV?
Base: Adults 18+ who currently own device
Smartphone (N=441); Computer (N=592); Tablet (N=416)
Smartphone Computer Tablet
Smartphone TabletComputer
Devices Used While Watching TV
(Among Device Owners)
The Changing TV Experience: Attitudes and Usage Across Multiple Screens, IAB, April 2015
14. Multiscreening is a daily habit
Q: How frequently do you use the following devices while you are watching TV?
Base: Adults 18+ who use device while watching TV
Smartphone (N=303); Computer (N=317); Tablet (N=221)
14
Smartphone
Use a computer
daily while
watching TV
Computer
*Base size < N=100
Use tablet daily
while watching
TV
Tablet
Use a smartphone
daily while
watching TV
Frequency of Using Devices
While Watching TV
(among multiscreeners)
The Changing TV Experience: Attitudes and Usage Across Multiple Screens, IAB, April 2015
15. Multiscreening is on the rise, especially among those with a
smartphone or tablet.
Q: Thinking back to this time last year, would you say you are using each of these devices less, the same amount or more when you are watching TV?
Base: Adults 18+ who use device while watching TV
Smartphone (N=303); Tablet (N=221); Computer (N=317)
15
Are using a
smartphone
more
than last year
while watching
TV
Are using a
tablet
more
than last year
while watching
TV
Are using a
computer
more
than last year
while watching
TV
Multitasking While Watching TV
Compared to Last Year
(among multiscreeners)
Smartphone ComputerTablet
TV vs. ConnectedTV: 45% say they are less likely to multiscreen
while streaming a video on connectedTVthan while watching
regular TV
Q: How much do you agree or disagree with the following statements? (Top 2 Box Summary)
Base: Adults 18+ who stream online videos to their Connected TV/device to stream “once every few months or more” (N=196)
“I don't usually work on the
computer if I am streaming to the
television. I guess that is because
since I went to the effort to stream
something, I am more interested
in the program, and pay closer
attention to it.”
– Female, 55-64 yrs. old
The Changing TV Experience: Attitudes and Usage Across Multiple Screens, IAB, April 2015
16. 60%
40%
58%
42%
52%
48%
Q: When you are watching TV and using another device, how would you describe your level of attention to the TV and/or the device?
Base: Adults 18+ who use device while watching TV
Computer (N=317); Smartphone (N=303); Tablet (N=221)
16
Attention
is on the
TV
(Only/Mostly/
Half on TV)
Attention
is on the
Device
(Only/Mostly/Half
on Device)
SmartphoneComputer Tablet
Smartphone and tablet multiscreeners are more likely to pay attention to the TV;
Computermultiscreeners’ focus is half and half
TV TV TV
Attention on
Smartphone
Attention on Device
Attention on
Tablet
Attention on
Computer
Attention on
TV
Attention on TV
Attention on
TV
Attention on
TV
The Changing TV Experience: Attitudes and Usage Across Multiple Screens, IAB, April 2015
17. Discussion Forum: When you are watching TV and using another device, how would you describe your level of attention to the TV
and/or the device?
Base: Adults 18+ who use device while watching TV (N= 13)
17
Smartphone
Computer
Tablet
“During an ordinary streaming session
where I'm watching a regular TV show I will
more than likely be doing something via a
mobile device and/or laptop/desktop
computer either personal or work related.
The only time I won't & dedicate myself fully
to the program is for a favorite program or
family time.”
– Male, 35-44
“If it is something for my daughter I tend to
be on my tablet. However if we are watching
something as a family or just my husband
and I, I usually don't plan to multi-task.”
– Female, 25-34
“If I'm watching a soap opera or a comedy I
almost always multiscreen. If I'm watching
something that I need to pay attention to
like Blacklist or Walking Dead, then I don't
multiscreen because I want to concentrate
on the show.”
– Female, 35-44
“I multi-screen when watching children's
shows with my daughter, but I'm less likely
to do so when watching a thriller or horror
movie.”
– Male, 25-34
Multiscreening and attention
TV
The Changing TV Experience: Attitudes and Usage Across Multiple Screens, IAB, April 2015
18. One quarter believe that their online multitasking behaviors are
generally related to TV programs or commercials they are watching
Q: Overall, how would you describe your typical activities on the other device(s) you are using while watching TV? Activities on the other device(s) are ...
Base: Adults 18+ who multitask while watching TV (N=498)
18
7%
9%
16%
30%
37%
say their activities on
other devices are
related to TV or
commercials
Activities on Other Devices Related to
TV or Commercials
Mostly
related
Mostly
unrelated
Half related,
half unrelated
Completely
unrelated
Completed
related
“I've found that some streaming
services have started tailoring
some of the commercials to the
viewer’s interests so you’re not
watching a commercial about a
product/service that is of no
value/interest.”
– Male, 35-44 yrs. old
“I've even purchased a few
products and I believe a service
or two via this method. If I'm
Googling I'm looking for their
website. If I've searched, found
their website or went directly to
their site I'm usually searching for
more detailed product/service
information.” – Male, 35-44
The Changing TV Experience: Attitudes and Usage Across Multiple Screens, IAB, April 2015
(24% reflects those who answered ‘completely related’, ‘mostly related’ and half of those who responded ‘half related, half unrelated’)
19. • Topmultiscreeningactivitiesaremostlyunrelated:browsing,socialnetworking,email,gamingandshopping
While watching TV, multiscreeners are more likely to extend their
TV viewing to their smartphones; less so on other devices
19
TV viewers
Top Activities on Other Devices
While Watching TV
Q: When you are watching TV and using the device(s) listed below,
what kinds of activities do you do on your device?
Base: Adults 18+ who use a device while watching TV
(Smartphone (N=303); Computer (N=317); Tablet (N=221)
78%
Multiscreen
Smartphone
Tablet
Computer
71%
58%
56%
54%
52%
Browse the Internet
Read/post on social networks, unrelated to the show
Play casual games
Email/IM/text with friends about the show/movie
Read/write emails unrelated to show
87%
76%
75%
69%
64%
Browse the Internet
Read/write emails unrelated to show
Shop/browse online stores
Catch up on news
Organize/plan/pay bills
71%
56%
51%
47%
47%
Browse the Internet
Playing casual games
Shop/browse online stores
Read/write emails unrelated to show
Read/post on social networks, unrelated
to the show
Computer multiscreeners more
likely to check news and pay bills
Smartphone multiscreeners
more likely to email about the
show
The Changing TV Experience: Attitudes and Usage Across Multiple Screens, IAB, April 2015
20. 35%
34%
32%
32%
31%
30%
29%
29%
27%
23%
20%
Look up sports stats or info
Post on social media about a commercial
Organizing/planning/paying bills
Watching video clips related to the
show/movie (i.e. behind the scenes clips)
Go to the site of a product/service shown
in a commercial
Sharing links or video clips related to the
show/movie (i.e. behind the scenes clips)
Use a hashtag for a show while posting
on social media
Share info or a video of a TV commercial
with a friend
Vote/participate in show-related activity
Read fan blogs or forums about the
show/movie
Do work/homework
71%
58%
56%
54%
52%
51%
49%
48%
44%
42%
37%
Browse the Internet
Read/post on social networks, unrelated
to the show
Playing casual games
Email/IM/text with friends about the
show/movie
Read/write emails unrelated to show
Catching up on news
Search for information about
show/movie/actor
Shop/browse online stores
Watching video clips unrelated to the
show/movie (i.e. funny videos)
Read/post on social media pages of the
show/movie/actor
Search for reviews of a product/service
shown in a commercial
While top multiscreeningactivities of smartphoneusers are unrelatedleisure,
a sizable portionis related to whatthey’re watchingon TV
Q: When you are watching TV and using the device(s) listed below, what kinds of activities do you do on your device?
Base: Adults 18+ who use smartphone while watching TV (N=303)
20
Activities Engaged on Smartphone while Watching TV
• Topsmartphoneactivities: surfingtheinternet,socialnetworking,gaming,email
• TVshow related: RoughlyhalfsocializeorsearchrelatedtotheTVshow;one-thirdwatchorsharevideo:aboutone-quartertweet/vote
• TVcommercialrelated: Roughlyone-thirdsocializeorsearchrelatedtoTVcommercials
The Changing TV Experience: Attitudes and Usage Across Multiple Screens, IAB, April 2015
21. 87%
76%
75%
69%
64%
55%
52%
48%
44%
44%
41%
Browse the Internet
Read/write emails unrelated to show
Shop/browse online stores
Catching up on news
Organizing/planning/paying bills
Read/post on social networks,
unrelated to the show
Playing casual games
Watching video clips unrelated to the
show/movie (i.e. funny videos)
Do work/homework
Search for information about
show/movie/actor
Go to the site of a product/service
shown in a commercial
Computermultiscreening is mostly utilitarian but some activity is related to TV
Q: When you are watching TV and using the device(s) listed below, what kinds of activities do you do on your device?
Base: Adults 18+ who use computer while watching TV (N=317)
21
Activities Engaged on Computer while Watching TV
• Topcomputeractivities:surfingtheinternet,email,shopping,news,bills
• TVshow related: Lessthanhalfsearch, andaboutone-thirdsocializeorvisitsitesrelatedtotheTVshow
• TVcommercialrelated: Roughly4in10 visitsitesorsearchproductsrelatedtoTVcommercials;about1in4socializearoundtheads
40%
38%
35%
33%
33%
26%
26%
25%
23%
23%
17%
Search for reviews of a product/service
shown in a commercial
Email/IM/text with friends about the
show/movie
Look up sports stats or info
Read/post on social media pages of the
show/movie/actor
Watching video clips related to the
show/movie (i.e. behind the scenes…
Post on social media about a
commercial
Read fan blogs or forums about the
show/movie
Sharing links or video clips related to the
show/movie (i.e. behind the scenes…
Share info or a video of a TV
commercial with a friend
Vote/participate in show-related activity
Use a hashtag for a show while posting
on social media
The Changing TV Experience: Attitudes and Usage Across Multiple Screens, IAB, April 2015
22. 71%
56%
51%
47%
47%
45%
43%
41%
40%
37%
37%
Browse the Internet
Playing casual games
Shop/browse online stores
Read/write emails unrelated to show
Read/post on social networks,
unrelated to the show
Catching up on news
Search for information about
show/movie/actor
Watching video clips unrelated to the
show/movie (i.e. funny videos)
Search for reviews of a
product/service shown in a…
Email/IM/text with friends about the
show/movie
Go to the site of a product/service
shown in a commercial
Q: When you are watching TV and using the device(s) listed below, what kinds of activities do you do on your device?
Base: Adults 18+ who use tablet while watching TV (N=221)
22
36%
34%
33%
31%
28%
27%
26%
24%
24%
22%
14%
Watching video clips related to the
show/movie (i.e. behind the scenes…
Look up sports stats or info
Organizing/planning/paying bills
Read/post on social media pages of
the show/movie/actor
Post on social media about a
commercial
Sharing links or video clips related to
the show/movie (i.e. behind the…
Do work/homework
Read fan blogs or forums about the
show/movie
Share info or a video of a TV
commercial with a friend
Vote/participate in show-related
activity
Use a hashtag for a show while
posting on social media
Activities Engaged on Tablet while Watching TV
Tablet multiscreeningis a hybrid mix: Like smartphoneuse, top activities are unrelated
leisure but there is some TV-relatedmultiscreeningand it mirrors that of computer users
• Toptabletactivities: surfingtheinternet,gaming,shopping,email,socialmedia
• TVshow related:Roughly4in10search,andaboutone-thirdsocializeorvisitsitesrelatedtotheTVshow
• TVcommercialrelated:Roughly4in10 visitsitesorsearchproductsrelatedtoTVcommercials;about1in4socializearoundtheads
The Changing TV Experience: Attitudes and Usage Across Multiple Screens, IAB, April 2015
23. Streaming Habits: When the TV is off, what,
how and where do consumers watch video?
The Changing TV Experience: Attitudes and Usage Across Multiple Screens, IAB, April 2015
24. More than half of all device owners stream online video at least once
a month
Stream from the
Internet monthly+
How often, if ever, do you stream videos, shows or movies from the Internet to the following devices?
Base: Adults 18+ who currently own device
Connected TV/Device to stream (N=237); Computer (N=592); Tablet (N=416); Smartphone (N=441)
24
Connected TV/
Device to stream
Stream from the
Internet monthly+Computer
Stream from the
Internet monthly+
Tablet Smartphone Stream from the
Internet monthly+
• 3 in 4 ConnectedTV owners stream video at least once a month
The Changing TV Experience: Attitudes and Usage Across Multiple Screens, IAB, April 2015
25. Connected TV users are heavier video streamers
Stream from the
Internet daily
How often, if ever, do you stream videos, shows or movies from the Internet to the following devices?
Base: Adults 18+ who currently own device
Connected TV/Device to stream (N=237); Computer (N=592); Tablet (N=416); Smartphone (N=441)
25
Connected TV/
Device to stream
Stream from the
Internet dailyComputer
Stream from the
Internet daily
Tablet Smartphone Stream from the
Internet daily
• 1 in 3 ConnectedTV owners stream video to their ConnectedTV daily
The Changing TV Experience: Attitudes and Usage Across Multiple Screens, IAB, April 2015
26. Streaming video has increased across devices, especially among
connected TV owners
Are
streaming
more
Q: Thinking back to this time last year, would you say you are now using each of these devices less, the same
amount or more to stream videos, shows or movies from the Internet?
Base: Adults 18+ who currently own device
Connected TV/Device to stream (N=237); Smartphone (N=441); Tablet (N=416); Computer (N=592)
26
Are
streaming
more
Are
streaming
more
Are
streaming
more
Connected TV/
Device to stream
Tablet Computer
Smartphone
In contrast, 19% are
watching less TV
The Changing TV Experience: Attitudes and Usage Across Multiple Screens, IAB, April 2015
27. Increase in streaming video to TV is driven by the recent purchase of a
connected TV/device and being able to control how and when to play content
50%
40%
38%
33%
33%
32%
31%
24%
21%
18%
13%
11%
I bought or received a new device since last year
that enables me to stream online video to TV
I like being able to pause or replay what I'm watching
I prefer to stream TV shows on my time rather
than plan to watch the next episode on TV
My setup is now easier to use, making it more
convenient to stream online video to TV
There is more online video content available to stream now
There is better online video content available to stream now
I now subscribe to more sources for online video content
I have more free time now
I prefer to look for something to watch
online rather than surf channels on TV
I cancelled my cable/satellite/fiber optic TV subscription
I like to read about the video content before I watch it
(comments, reviews, votes/stars)
It takes too long to find something to watch on TV
Q: You said that you are now streaming online video to your TV more than you did last year. Why is that?
Base: Adults 18+ who are now streaming online video more to their Connected TV/Device to stream (N=84)
27
Why Streaming More To Connected TV/Device to Stream*
*Base size < N=100
Low base size
35%
Stream
More cTV
• Half say they streammore to a connectedTV becausethey got one in the past year
• Nearly4 in 10 stream more because they prefer the controls and schedule
• One in three attribute their increasedconnectedTV streaming to accessto or improved video content
Stream More to
Connected TV
9%
Stream
Less
Top reason to stream less
is “have less free time”
The Changing TV Experience: Attitudes and Usage Across Multiple Screens, IAB, April 2015
28. For most streamers, it began with the purchase of a connected TV or device
to stream used in tandem with a Netflix orAmazon Prime subscription to
view content.
Discussion Forum: Please share with us how you began streaming video content to your TV. What was your original
motivation for streaming video content? When did you start streaming video to your TV?
Base: Adults 25+ who currently own a streaming device (N=13)
28
“It really started with mobile devices
for me. Having content on the go was a
nice treat for me. But then I started
getting addicted to binge watching and
watching old TV shows that were
"new" to me at the time. Then I started
to watch more streaming at home
using Amazon Prime and using Airplay
to my TV. So it was probably a couple
of years, when I started and now it's
apart of my routine away and at
home.” – Male, 25-34 yrs. old
“I began to stream video first on
my computer. Then my son gifted
me with Apple TV one Christmas
which started my interest in
streaming to the TV.”
– Female, 55-64 yrs. old
“My husband went and bought a
smart TV two years ago and I fell
in love with streaming Netflix. I
love everything that is available,
but wish more were.”
– Female, 35-44 yrs. old
“I subscribed to Amazon Prime
about 5 years ago and that's
when I started streaming video
on my smart TV, smartphone
and iPad. I found it was really
easy to watch shows and
movies while I was on the go.”
– Male, 25-34 yrs. old
“Back in 2008 when I first started streaming
from Netflix I believe I was only streaming thru a
Roku box which I had specifically purchased for
that purpose and later on as they
came available I was using several different
devices i.e. satellite provider box, Xbox 360, etc.
I Currently have several subscription services
i.e. Hulu Plus & Amazon Prime along with
Netflix.” – Male, 35-44 yrs. old
The Changing TV Experience: Attitudes and Usage Across Multiple Screens, IAB, April 2015
29. Over three-quarters of connected TV users stream Netflix and YouTube video
content at least once a month
Stream from
YouTube
monthly+
How often, if ever, do you stream videos, shows or movies from the Internet to the following devices?
Base: Adults 18+ who stream online videos to their Connected TV/device to stream “once every few months or more” (N=196)
29
Stream Netflix
monthly+
Stream from a
TV network
app monthly+
Stream from
Amazon Prime
Instant Video
monthly+
Stream from
portal site
monthly+
Stream from
webisode site
monthly+
Stream from
Hulu Plus
monthly+
Stream from
iTunes
monthly+
Stream from
Vevo monthly+
Stream from
Vimeo
monthly+
TV Network App Video section of portal site
Online only webisode site
Content Streamed to Connected TV
Ex: Ex:
Ex:
The Changing TV Experience: Attitudes and Usage Across Multiple Screens, IAB, April 2015
30. Long form video is streamed to connected TV, Computer and Tablet;
Smartphone viewing is primarily of short form video
30
Q: What kinds of videos do you stream to each of your devices?
Base: Adults 18+ who stream online videos to device “once every few months or more”
Connected TV/Device to stream (N=196); Computer (N=398); Tablet (N=259); Smartphone (N=257)
Types of Video Streamed by Device
71%
68%
38%
37%
35%
30%
27%
24%
23%
22%
18%
Movies
TV shows
Cartoons/
Children’s shows
Live sports games
Online only
shows/webisodes
Music videos
News/weather
Show clips
Movie trailers
User generated
short clips
How-to videos
51%
49%
49%
48%
47%
46%
46%
38%
33%
25%
23%
TV shows
Movies
User generated
short clips
Music videos
News/weather
How-to videos
Movie trailers
Show clips
Online only
shows/webisodes
Live sports games
Cartoons/
Children’s shows
47%
42%
40%
40%
39%
38%
35%
34%
34%
31%
14%
TV shows
Movies
Movie trailers
User generated
short clips
Music videos
News/weather
Show clips
How-to videos
Online only
shows/webisodes
Cartoons/
Children’s shows
Live sports games
51%
51%
47%
42%
40%
37%
26%
26%
25%
19%
14%
User generated
short clips
News/weather
Music videos
How-to videos
Movie trailers
Show clips
TV shows
Movies
Cartoons/
Children’s shows
Online only
shows/webisodes
Live sports games
Connected TV/
Device to stream
Computer Tablet Smartphone
The Changing TV Experience: Attitudes and Usage Across Multiple Screens, IAB, April 2015
31. Connected TV vs. TV: How do consumers
compare connected TV to regular TV?
The Changing TV Experience: Attitudes and Usage Across Multiple Screens, IAB, April 2015
32. Connected TV owners allocate a considerable portion of their
viewing time to streaming
Q: Overall, about how much of your viewing time would you say is spent watching TV (regular, cable, DirectTV, FIOS, satellite) vs. streaming online video to your TV?
My TV or video viewing time is spent ...
Base: Adults 18+ who own a Connected TV (N=153)
(Reflects sum of responses ‘only streaming video to TV’, ‘mostly streaming video to TV’ and ‘half watching TV, half streaming video to TV’) Connected TV/device to
stream “once every few months or more” (N=196)
32
Only watching TVMostly streaming
video to TV
Half watching TV,
half streaming video
to TV
Only streaming
video to TV
Mostly watching TV
21%
40%
27%
8%
3%
The Changing TV Experience: Attitudes and Usage Across Multiple Screens, IAB, April 2015
say at least half of
their TV screen time
is spent streaming
online video to their
connected TV
TV
Show
33. 33
Q: Thinking about the TV shows/movies that you watch from your cable/satellite/fiber optic provider and those that you stream from the Internet to your TV, how would you compare the two?
Base: Adults 18+ who stream online videos to their Connected TV/device to stream “once every few months or more” (N=196)
Q: Why do say that streaming from the Internet is a better experience than regular TV or cable?
Base: Adults 18+ who stated that “Streaming from the Internet is a better experience than regular TV or cable” (N=49)
Q: Why do say that both viewing experiences are the same?
Base: Adults 18+ who stated that “Both viewing experiences are the same” (N=99)
Q: Why do say that TV service provider is a better experience than streaming?
Base: Adults 18+ who stated that “TV service provider is a better experience than streaming” (N=48)
More dependable/no technical/buffering
issues/difficulties
19%
Better quality/better quality programming 17%
Fast/faster 10%
Better selection/choices/more content that
interests me
10%
Better quality picture/video 6%
Easy/easier 6%
Has newer content 6%
TV service is Better…*
Same/no difference/enjoy both equally
(exclusive)
48%
Quality is the same 14%
Video/graphics are the same 6%
Content/shows are the same 5%
They’re the same…*
I can watch what I want/have more control
over what I watch
33%
Better selection/choices/more content that
interests me
29%
I can watch anytime/anywhere/when I
want to
27%
Less commercials 12%
Cheaper 10%
Doesn't have commercials 10%
I can pause/rewind by streaming 8%
Streaming is Better…*
76% of connected TV viewers see no difference between TV and connected
TV or think connected TV is better
Streaming from the Internet
is a better experience than
regular TV or cable
25%
Both viewing experiences are the same
51%
TV service provider is a
better experience than
streaming
24%
*Base size < N=100
The Changing TV Experience: Attitudes and Usage Across Multiple Screens, IAB, April 2015
34. 23%
21%
17%
12%
11%
8%
12%
10%
31%
23%
21%
16%
16%
19%
11%
13%
54%
44%
38%
28%
27%
27%
23%
23%
I am more likely to stream video to my TV because
fewer commercials are shown than on regular TV
I would prefer to watch commercials while streaming
video to my TV than pay for a subscription
The commercials shown during video I stream to my
TV are less disruptive than those shown on regular TV
The commercials shown during video I stream on my
smartphone are more memorable than those shown on regular TV
The commercials shown during video I stream to my
TV are more memorable than those shown on regular TV
The commercials shown during video I stream on my
tablet are more memorable than those shown on regular TV
The commercials shown during video I stream to my
TV are better than those shown on regular TV
The commercials shown during video I stream on my
computer are more memorable than those shown on regular TV
Those with a connected TV/device to stream are more receptive to
commercials because there are fewer of them when they stream video and
they find them to be less disruptive.
34
Top 2 Box
Q: How much do you agree or disagree with the following statements? (Top 2 Box Summary)
Base: Adults 18+ who stream online videos to their Connected TV/device to stream “once every few months or more” (N=196)
Agreement Statements
“I think they are more memorable
when you watch streaming
content because they have less
commercials in general
compared to non-streaming
content. I think they are less
intrusive because there are less
of them and you don't feel
bombarded with information on a
multitude of products.”
– Male, 25-34 yrs. old
The Changing TV Experience: Attitudes and Usage Across Multiple Screens, IAB, April 2015
35. Other benefits to streaming online video as compared to TV:
Discussion Forum: Do you feel there are any differences in the experience of watching regular TV versus watching
streaming video or do you feel they are the same?
Base: Adults 18+ who currently own a streaming device (N=13)
35
“When watching regular TV
you can only watch what's
being broadcast at that time
and sometimes you have to
make sacrifices when two
interesting shows are
on. When streaming you don't
have to make sacrifices.”
– Male, 25-34 yrs. old
“With cable you do not have the
ability to back, forward, skip around
and watch exactly what you want at
that time.”
– Female, 25-34 yrs. old
“I get to choose what I
want to watch instead of
having to choose from
satellite where there are a
lot of channels, but very
few shows that I am
interested in. There are
infinite number of videos
to choose from online.”
– Female, 25-34 yrs. old
vs.
“Normal TV at home is limited because
you can't take it with you. Streaming
offers the convenience of take
anywhere and watch when you want.”
– Male, 25-34 yrs. old
• Offers users control(abilityto pause, forward,rewind)
• Offers the convenience to watchbased on viewer’s schedule
• Offers the ability to view on-the-go
The Changing TV Experience: Attitudes and Usage Across Multiple Screens, IAB, April 2015
36. Streaming video is changing the TV experience:
• Most Americans view TV accompanied by a device
• Multiscreening is a daily activity and many say they’re multiscreening more as compared
to a year ago.
• The smartphone is most popularly used as the second screen device: Two-thirds of
smartphone owners watch TV with their phone, most do so daily, and they are more likely
to multiscreen related to the TV show or commercials than are other device
multiscreeners.
• Multiscreeners say they pay slightly more attention to the TV except computer
multiscreeners who evenly split their attention.
• About one-quarter of multiscreeners say they do something related to what they’re
watching on TV on their devices.
• While most multiscreening is unrelated (browsing is the #1 activity), some multiscreening
is related to the TV shows and commercials, particularly among smartphone
multiscreeners.
• Streaming video across devices, particularly to a connected TV,
is growing
• At least half of all owners of video-capable devices stream video on them at least once a
month.
• Three out of four Connected TV owners stream video monthly and one in three streams
video to their connected TV daily.
• In contrast, only 11% of TV viewers are watching more TV and 19% are actually watching
less TV.
36
Takeaways
The Changing TV Experience: Attitudes and Usage Across Multiple Screens, IAB, April 2015
37. Streaming video is changing the TV experience:
• Connected TV currently represents only about 1 in 3 consumers but these viewers are
streaming more than they did last year and are getting into the habit of watching video
daily.
• Many indicate that they see no difference in quality between viewing video over a
connected TV or watching ‘regular’ TV. Some even prefer streaming to their connected TV
because they can control the viewing experience and schedule.
• Connected TV viewers watch about 2 hours a day – TV time that is not reachable via
regular TV advertising.
• Implications:
• As the many ways to view video evolve and grow more popular, marketers are faced with
new challenges but also offered new opportunities to reach consumers.
• Today’s multiscreening TV viewers are reachable over multiple screens, offering ‘extended’
advertising canvases in which to capture consumers’ attention. These ‘bonus’ digital
formats are additive to the marketers’ traditional media platforms.
• Connected TV viewers, on the other hand, take away from traditional TV buying channels
in that their TV screen is occupied by digital content. These consumers are only reachable
at these prime hours via digital video advertising or advanced TV ads.
• As video viewing evolves and ways to reach consumers expand beyond the traditional
means, marketers and advertisers will be faced with ever-increasing choices in their ad
buys. One thing is for certain, the lines between TV and digital are increasingly blurring
and the consumer views it all as just ‘video’. Marketers and advertisers should evolve
their media mix along with consumers’ media behaviors in order to stay relevant and keep
their brands top of mind.
37
Takeaways
The Changing TV Experience: Attitudes and Usage Across Multiple Screens, IAB, April 2015
38. Appendix
The Changing TV Experience: Attitudes and Usage Across Multiple Screens, IAB, April 2015
39. Monthly+ streamers of original digital video webisodes are heavy
daily streamers of content
Stream from the
Internet daily
How often, if ever, do you stream videos, shows or movies from the Internet to the following devices?
Base: Adults 18+ who currently own device AND stream videos from an online only webisode site to their device ‘Monthly or more”
Computer (N=70); Connected TV/Device to stream (N=74); Tablet (N=68); Smartphone (N=64)
39
Connected TV/
Device to stream
Stream from the
Internet dailyComputer
Stream from the
Internet daily
Tablet Smartphone Stream from the
Internet daily
Among those who stream webisodes “Monthly+”*
*Base size < N=75
The Changing TV Experience: Attitudes and Usage Across Multiple Screens, IAB, April 2015
40. At least 3 out of 10 monthly+ streamers of webisodes state they are
streaming more to their devices when compared to a year ago
Are
streaming
more
Q: Thinking back to this time last year, would you say you are now using each of these devices less, the same amount or more to
stream videos, shows or movies from the Internet?
Base: Adults 18+ who currently own device AND stream videos from an online only webisode site to their device ‘Monthly or more”
Tablet (N=68); Connected TV/Device to stream (N=74); Smartphone (N=64); Computer (N=70);
40
Are
streaming
more
Are
streaming
more
Are
streaming
more
Connected TV/
Device to stream
Tablet
Computer
Smartphone
*Base size < N=75
Among those who stream webisodes “Monthly+”*
The Changing TV Experience: Attitudes and Usage Across Multiple Screens, IAB, April 2015
41. 13%
15%
11%
22%
15%
19%
35%
30%
30%
I often share or repost a video I've viewed on a smartphone
I often share or repost a video I've viewed on a tablet
I often share or repost a video I've viewed on a computer
Three out of ten connected TV streamers indicate they frequently share or
repost video they have viewed on one of their devices
41
Agreement Statements
Top 2 Box
Q: How much do you agree or disagree with the following statements? (Top 2 Box Summary)
Base: Adults 18+ who stream online videos to their Connected TV/device to stream “once every few months or more” (N=196)
The Changing TV Experience: Attitudes and Usage Across Multiple Screens, IAB, April 2015
42. 37%
27%
16%
31%
26%
16%
68%
53%
32%
I prefer watching longer videos like a movie or
TV show on a connected TV than on a tablet
I am more likely to watch short videos (less than 15 minutes)
on a smartphone/tablet than on a connected TV
I usually stream videos on a smartphone to entertain my child
Screen size is a strong consideration when deciding the type of content to
stream.
42
Top 2 Box
Q: How much do you agree or disagree with the following statements? (Top 2 Box Summary)
Base: Adults 18+ who stream online videos to their Connected TV/device to stream “once every few months or more” (N=196)
Agreement Statements
The Changing TV Experience: Attitudes and Usage Across Multiple Screens, IAB, April 2015
43. When deciding what content to stream, most find specific programming they
have an interest in or browse specific genres they enjoy.
Discussion Forum: Walk us through your decision-making process when you are deciding what to watch on TV
(regular TV or streaming online video content to your TV).
Base: Adults 25+ who currently own a streaming device (N=13)
43
“Now that I only stream shows my
decision making process is a mixture of
knowing what I want to watch
beforehand and watching things that
strike my mood. If I find a new show
that's peaked my interest then I stream
with the intention of watching that
show. However, most of the movies I
watch are based on my mood.”
– Male, 25-34 yrs. old
“Storyline is huge to
us. We like to be able to
follow a story from the
beginning to the end. We
hate stalls or time delays. We
get involved in murder
mysteries, anything that
we can guess on who done
it and how is great.”
– Female, 35-44 yrs. old
“I know when new episodes of my
favorite shows are out on Netflix and
I set up enough time to stream just
those shows during the week. I know
what I want to watch beforehand. It
does differ for regular TV you can't
really watch what you want and when
you do you can't go back, or forward.
Streaming it lets me watch what I want
when I want.” – Female, 25-34yrs. old
“If there is a particular show
airing that day, I will watch that.
If not, I like to browse around
until I find something that
interests me. I prefer to watch
streaming shows when I am
binge watching or can't find
anything on regular TV (cable)
to watch.” – Male, 25-34 yrs. old
“Most of the time I know what I want to
watch when I start watching
something. Normally I might see an ad
for a new show, and if it appeals to me,
I will watch.”
– Female, 55-64 yrs. old
“Content and storyline are
important. Time is limited and I
want to feel like watching a
show or movie was worth the
time spent. I'm not just looking
for content that's
entertaining. It should be
engrossing.” – Male, 25-34
The Changing TV Experience: Attitudes and Usage Across Multiple Screens, IAB, April 2015