Download as PDF, PPTX

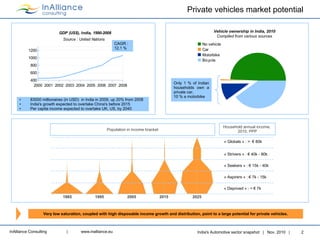


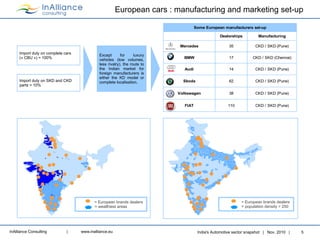

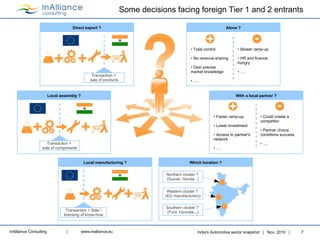

The document provides an overview of India's automotive sector as of November 2010. It notes that vehicle ownership in India is still very low, with only 1% of households owning a car and 10% owning a motorbike, indicating significant potential for growth. It also discusses trends in total vehicle sales and by vehicle type. Passenger vehicle and motorcycle sales are growing the fastest but motorcycles still dominate the market. The largest car manufacturers hold over 80% of the car market. Most foreign manufacturers have set up assembly plants to import vehicle kits and parts due to high import duties on fully built vehicles. The document identifies major automotive industry clusters and considerations for foreign parts suppliers entering the Indian market.


