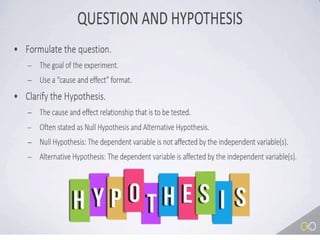
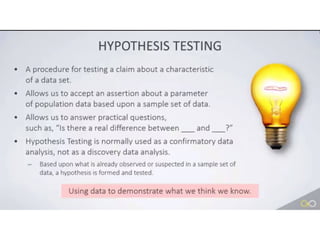
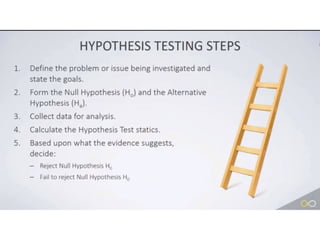
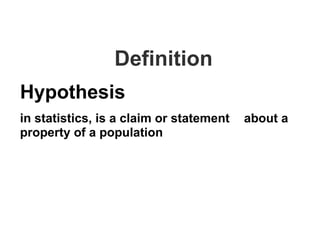
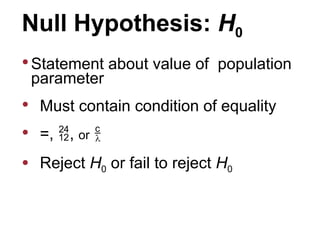
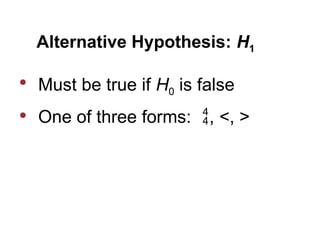
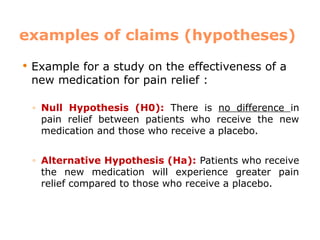
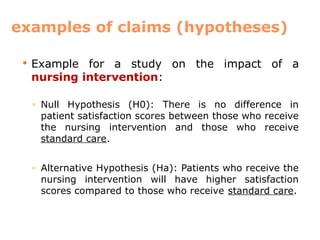
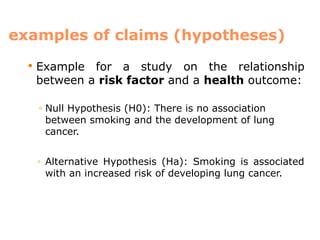
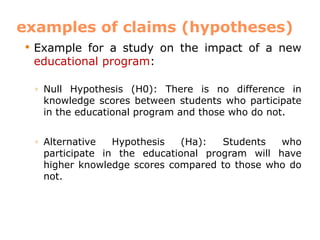
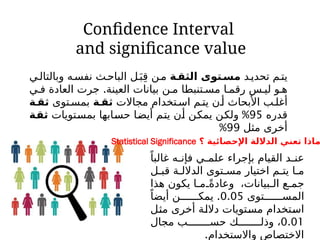
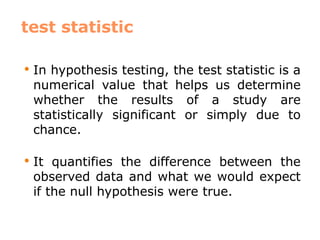
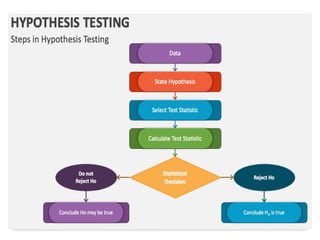
Introduction to
Hypothesis Testing
Chapter 5
Definition
Hypothesis
in statistics, is a claim or statement about a
property of a population
Components of a
Formal Hypothesis Test
Null Hypothesis: H0
 Statement about value of population
parameter
 Must contain condition of equality
 =, , or 
 Reject H0 or fail to reject H0
Alternative Hypothesis: H1
 Must be true if H0 is false
 One of three forms: , <, >
Note about Forming Your Own
Claims (Hypotheses)
If you are conducting a study and
want to use a hypothesis test to
support your claim, the claim must
be worded so that it becomes the
alternative hypothesis.
examples of claims (hypotheses)
 Example for a study on the effectiveness of a
new medication for pain relief :
◦ Null Hypothesis (H0): There is no difference in
pain relief between patients who receive the new
medication and those who receive a placebo.
◦ Alternative Hypothesis (Ha): Patients who receive
the new medication will experience greater pain
relief compared to those who receive a placebo.
examples of claims (hypotheses)
 Example for a study on the impact of a
nursing intervention:
◦ Null Hypothesis (H0): There is no difference in
patient satisfaction scores between those who receive
the nursing intervention and those who receive
standard care.
◦ Alternative Hypothesis (Ha): Patients who receive the
nursing intervention will have higher satisfaction
scores compared to those who receive standard care.
examples of claims (hypotheses)
 Example for a study on the relationship
between a risk factor and a health outcome:
◦ Null Hypothesis (H0): There is no association
between smoking and the development of lung
cancer.
◦ Alternative Hypothesis (Ha): Smoking is associated
with an increased risk of developing lung cancer.
examples of claims (hypotheses)
 Example for a study on the impact of a new
educational program:
◦ Null Hypothesis (H0): There is no difference in
knowledge scores between students who participate
in the educational program and those who do not.
◦ Alternative Hypothesis (Ha): Students who
participate in the educational program will have
higher knowledge scores compared to those who do
not.
Confidence Interval
and significance value
‫د‬‫تحدي‬ ‫م‬‫يت‬
‫ة‬‫الثق‬ ‫توى‬‫مس‬
‫ي‬‫وبالتال‬ ‫ه‬‫نفس‬ ‫ث‬‫الباح‬ ‫ل‬َ‫ب‬ِ‫ق‬ ‫ن‬‫م‬
.
‫ي‬ ‫ف‬ ‫العادة‬ ‫جرت‬ ‫العينة‬ ‫بيانات‬ ‫ن‬ ‫م‬ ‫تنبطا‬ ‫مس‬ ‫ا‬ ‫رقم‬ ‫س‬ ‫لي‬ ‫و‬ ‫ه‬
‫مجاالت‬ ‫تخدام‬ ‫اس‬ ‫م‬ ‫يت‬ ‫ن‬‫أ‬ ‫األبحاث‬ ‫ب‬ ‫أغل‬
‫ة‬ ‫ثق‬
‫توى‬‫بمس‬
‫ة‬‫ثق‬
‫قدره‬
95
%
‫بمستويات‬ ‫حسابها‬ ‫أيضا‬ ‫يتم‬ ‫أن‬ ‫يمكن‬ ‫ولكن‬
‫ثقة‬
‫مثل‬ ‫أخرى‬
99
%
‫؟‬ ‫اإلحصائية‬ ‫الداللة‬ ‫تعني‬ ‫ماذا‬
Statistical Significance
ً‫غالبا‬ ‫ه‬ ‫فإن‬ ‫ي‬ ‫علم‬ ‫بإجراء‬ ‫القيام‬ ‫د‬ ‫عن‬
‫ل‬ ‫قب‬ ‫ة‬ ‫الدالل‬ ‫توى‬ ‫مس‬ ‫اختيار‬ ‫م‬ ‫يت‬ ‫ا‬ ‫م‬
‫هذا‬ ‫يكون‬ ‫ا‬ ‫م‬ ً‫وعادة‬ ،‫بيانات‬ ‫ال‬ ‫ع‬ ‫جم‬
‫توى‬ ‫المس‬
0.05
.
ً‫أيضا‬ ‫ن‬ ‫يمك‬
‫مثل‬ ‫أخرى‬ ‫داللة‬ ‫مستويات‬ ‫استخدام‬
0.01
‫مجال‬ ‫ب‬ ‫حس‬ ‫ك‬ ‫وذل‬ ،
.‫واالستخدام‬ ‫االختصاص‬
O
‫توى‬ ‫مس‬ ‫د‬ ‫عن‬ ‫دال‬ ‫ائي‬ ‫االحص‬ ‫االختبار‬ ‫ان‬ ‫نقول‬ ‫ا‬ ‫عندم‬
0.05
،
‫اإلختبار‬ ‫هذا‬ ‫و‬ ‫أ‬ ‫ث‬ ‫البح‬ ‫هذا‬ ‫ا‬ ‫أعدن‬ ‫و‬ ‫ل‬ ‫ا‬ ‫أنن‬ ‫ي‬ ‫يعن‬ ‫هذا‬ ‫فان‬
100
‫ة‬‫النتيج‬ ‫س‬‫نف‬ ‫ى‬‫عل‬ ‫ل‬‫نحص‬ ‫وف‬‫س‬ ‫ا‬‫فانن‬ ‫مرة‬
95
‫وف‬‫وس‬ ،‫مرة‬
‫و‬ ‫ه‬ ‫ة‬ ‫مختلف‬ ‫ة‬ ‫نتيج‬ ‫ى‬ ‫عل‬ ‫ل‬ ‫نحص‬ ‫ن‬ ‫أ‬ ‫ي‬ ‫ف‬ ‫أ‬ ‫الخط‬ ‫بة‬ ‫نس‬ ‫تكون‬
(
‫أي‬ ‫المئة‬ ‫اصل‬ ‫من‬ ‫مرات‬ ‫خمسة‬
0.05
.)
O
‫الداللة‬ ‫لمستوى‬ ‫بالنسبة‬ ‫ر‬‫األم‬ ‫وكذلك‬
0.01
‫انني‬ ‫يعني‬ ‫فانه‬ ،
‫ة‬ ‫النتيج‬ ‫س‬ ‫نف‬ ‫ى‬ ‫عل‬ ‫ل‬ ‫احص‬ ‫وف‬ ‫س‬
99
‫الـ‬ ‫ل‬ ‫أص‬ ‫ن‬ ‫م‬ ‫مرة‬
100
.
‫أ‬ ‫الخط‬ ‫بة‬ ‫نس‬ ‫ا‬ ‫بينم‬ ‫االختبار‬ ‫و‬ ‫أ‬ ‫ة‬ ‫التجرب‬ ‫ا‬ ‫فيه‬ ‫د‬ ‫أعي‬ ‫ي‬ ‫الت‬ ‫مرة‬
‫كل‬ ‫في‬ ‫فقط‬ ‫واحدة‬ ‫مرة‬ ‫لتكون‬ ‫بكثير‬ ‫تقل‬
100
.‫مرة‬
O
‫ة‬ ‫الدالل‬ ‫توى‬ ‫مس‬ ‫ن‬ ‫أ‬ ‫ا‬ ‫بقولن‬ ‫بق‬ ‫س‬ ‫ا‬ ‫م‬ ‫ص‬ ‫تلخي‬ ‫ن‬ ‫ويمك‬
‫اإلحتمال‬ ‫ة‬ ‫درج‬ ‫و‬ ‫ه‬ ،‫االحتمال‬ ‫توى‬ ‫مس‬ ‫و‬ ‫أ‬ ‫ائية‬ ‫اإلحص‬
‫فرية‬ ‫الص‬ ‫ة‬ ‫الفرضي‬ ‫ه‬ ‫ب‬ ‫ض‬ ‫رف‬ُ‫ت‬ ‫الذي‬
H0
‫ي‬ ‫ه‬ ‫تكون‬ ‫ا‬ ‫عندم‬
‫النوع‬ ‫ن‬ ‫م‬ ‫أ‬ ‫الخط‬ ‫ي‬ ‫ف‬ ‫الوقوع‬ ‫احتمال‬ ‫و‬ ‫ه‬ ‫ي‬ ‫أ‬ ،‫حيحة‬ ‫الص‬
: ) (
‫أنواع‬ ‫ثالثة‬ ‫وهي‬ ، ‫ألفا‬ ‫األول‬
-
‫د‬ ‫ن‬‫ع‬ ‫ل‬‫ا‬‫د‬
0.05
‫ة‬‫ق‬‫ث‬‫ل‬‫ا‬ ‫ى‬‫و‬‫ت‬‫س‬‫م‬ ‫ي‬‫أ‬
95
%
‫ك‬
‫ش‬‫ل‬‫ا‬‫و‬
5
.%
-
‫د‬ ‫عن‬ ‫دال‬
0.01
‫ي‬ ‫أ‬
‫ة‬‫الثق‬ ‫توى‬‫مس‬
99
%
‫ك‬ ‫والش‬
1
.%
-
‫د‬
‫ن‬‫ع‬ ‫ل‬‫ا‬‫د‬
0.001
‫ي‬
‫أ‬
‫ة‬ ‫ق‬‫ث‬‫ل‬‫ا‬ ‫ى‬‫و‬‫ت‬ ‫س‬‫م‬
99.9
%
‫ك‬ ‫ش‬‫ل‬‫ا‬‫و‬
0.1
%
test statistic
 In hypothesis testing, the test statistic is a
numerical value that helps us determine
whether the results of a study are
statistically significant or simply due to
chance.
 It quantifies the difference between the
observed data and what we would expect
if the null hypothesis were true.
test statistic
 The test statistic is calculated using the
data collected in the study and a specific
formula or statistical test.
 The choice of test statistic depends on
the type of data and the research question
being investigated.
test statistic
 Once we have the test statistic, we compare it to a critical
value or a p-value to make a decision. If the test statistic is
larger than the critical value or if the p-value is smaller
than a predetermined significance level (usually 0.05), we
reject the null hypothesis and conclude that there is
evidence of a significant effect or difference.
 If the test statistic is smaller than the critical value or if
the p-value is greater than the significance level, we fail to
reject the null hypothesis and conclude that there is not
enough evidence to support a significant effect or
difference.
Critical Region
Critical Region (or Rejection Region)
Set of all values of the test statistic that would cause a
rejection of the null hypothesis
Critical
Region
Critical Region
Critical Region (or Rejection Region)
Set of all values of the test statistic that
would cause a rejection of the null
hypothesis
Critical
Region
Critical Region
Set of all values of the test statistic that
would cause a rejection of the null
hypothesis
Critical
Regions
Significance Level of the Hypothesis
Test
 denoted by 
 the probability that the test statistic will
fall in the critical region when the null
hypothesis is actually true
 The probability of rejecting the null
hypothesis
 common choices are 0.05, 0.01, and
0.10
Example
 Let's consider a scenario where a group of nursing students is conducting a study
to investigate the effect of a new pain management intervention on
postoperative pain in patients. The null hypothesis (H0) in this case could be:
 H0: There is no difference in postoperative pain scores between patients who
receive the new pain management intervention and those who receive standard
care.
 The alternative hypothesis (Ha), on the other hand, would state the expected
difference or effect:
 Ha: Patients who receive the new pain management intervention will have lower
postoperative pain scores compared to those who receive standard care.
 In this example, the null hypothesis assumes that there is no difference between the
two groups in terms of postoperative pain scores. The alternative hypothesis,
however, suggests that the new pain management intervention will lead to lower
pain scores compared to standard care.
 To test these hypotheses, the nursing students would collect data on postoperative
pain scores from two groups of patients: one group receiving the new pain
management intervention and another group receiving standard care. They would
then analyze the data using appropriate statistical tests, such as t-tests or chi-
square tests, to determine if there is enough evidence to reject the null hypothesis
in favor of the alternative hypothesis.
 By using this example, you can explain to nursing students that the null hypothesis
represents the absence of an effect or difference, while the alternative hypothesis
represents the expected effect or difference. It's important to emphasize that the
purpose of hypothesis testing is to evaluate the evidence and make conclusions
based on the data collected.

Hypothesis Testing , p value and confidance interval

  • 1.
  • 6.
    Definition Hypothesis in statistics, isa claim or statement about a property of a population
  • 7.
    Components of a FormalHypothesis Test
  • 8.
    Null Hypothesis: H0 Statement about value of population parameter  Must contain condition of equality  =, , or   Reject H0 or fail to reject H0
  • 9.
    Alternative Hypothesis: H1 Must be true if H0 is false  One of three forms: , <, >
  • 10.
    Note about FormingYour Own Claims (Hypotheses) If you are conducting a study and want to use a hypothesis test to support your claim, the claim must be worded so that it becomes the alternative hypothesis.
  • 11.
    examples of claims(hypotheses)  Example for a study on the effectiveness of a new medication for pain relief : ◦ Null Hypothesis (H0): There is no difference in pain relief between patients who receive the new medication and those who receive a placebo. ◦ Alternative Hypothesis (Ha): Patients who receive the new medication will experience greater pain relief compared to those who receive a placebo.
  • 12.
    examples of claims(hypotheses)  Example for a study on the impact of a nursing intervention: ◦ Null Hypothesis (H0): There is no difference in patient satisfaction scores between those who receive the nursing intervention and those who receive standard care. ◦ Alternative Hypothesis (Ha): Patients who receive the nursing intervention will have higher satisfaction scores compared to those who receive standard care.
  • 13.
    examples of claims(hypotheses)  Example for a study on the relationship between a risk factor and a health outcome: ◦ Null Hypothesis (H0): There is no association between smoking and the development of lung cancer. ◦ Alternative Hypothesis (Ha): Smoking is associated with an increased risk of developing lung cancer.
  • 14.
    examples of claims(hypotheses)  Example for a study on the impact of a new educational program: ◦ Null Hypothesis (H0): There is no difference in knowledge scores between students who participate in the educational program and those who do not. ◦ Alternative Hypothesis (Ha): Students who participate in the educational program will have higher knowledge scores compared to those who do not.
  • 15.
    Confidence Interval and significancevalue ‫د‬‫تحدي‬ ‫م‬‫يت‬ ‫ة‬‫الثق‬ ‫توى‬‫مس‬ ‫ي‬‫وبالتال‬ ‫ه‬‫نفس‬ ‫ث‬‫الباح‬ ‫ل‬َ‫ب‬ِ‫ق‬ ‫ن‬‫م‬ . ‫ي‬ ‫ف‬ ‫العادة‬ ‫جرت‬ ‫العينة‬ ‫بيانات‬ ‫ن‬ ‫م‬ ‫تنبطا‬ ‫مس‬ ‫ا‬ ‫رقم‬ ‫س‬ ‫لي‬ ‫و‬ ‫ه‬ ‫مجاالت‬ ‫تخدام‬ ‫اس‬ ‫م‬ ‫يت‬ ‫ن‬‫أ‬ ‫األبحاث‬ ‫ب‬ ‫أغل‬ ‫ة‬ ‫ثق‬ ‫توى‬‫بمس‬ ‫ة‬‫ثق‬ ‫قدره‬ 95 % ‫بمستويات‬ ‫حسابها‬ ‫أيضا‬ ‫يتم‬ ‫أن‬ ‫يمكن‬ ‫ولكن‬ ‫ثقة‬ ‫مثل‬ ‫أخرى‬ 99 % ‫؟‬ ‫اإلحصائية‬ ‫الداللة‬ ‫تعني‬ ‫ماذا‬ Statistical Significance ً‫غالبا‬ ‫ه‬ ‫فإن‬ ‫ي‬ ‫علم‬ ‫بإجراء‬ ‫القيام‬ ‫د‬ ‫عن‬ ‫ل‬ ‫قب‬ ‫ة‬ ‫الدالل‬ ‫توى‬ ‫مس‬ ‫اختيار‬ ‫م‬ ‫يت‬ ‫ا‬ ‫م‬ ‫هذا‬ ‫يكون‬ ‫ا‬ ‫م‬ ً‫وعادة‬ ،‫بيانات‬ ‫ال‬ ‫ع‬ ‫جم‬ ‫توى‬ ‫المس‬ 0.05 . ً‫أيضا‬ ‫ن‬ ‫يمك‬ ‫مثل‬ ‫أخرى‬ ‫داللة‬ ‫مستويات‬ ‫استخدام‬ 0.01 ‫مجال‬ ‫ب‬ ‫حس‬ ‫ك‬ ‫وذل‬ ، .‫واالستخدام‬ ‫االختصاص‬
  • 16.
    O ‫توى‬ ‫مس‬ ‫د‬‫عن‬ ‫دال‬ ‫ائي‬ ‫االحص‬ ‫االختبار‬ ‫ان‬ ‫نقول‬ ‫ا‬ ‫عندم‬ 0.05 ، ‫اإلختبار‬ ‫هذا‬ ‫و‬ ‫أ‬ ‫ث‬ ‫البح‬ ‫هذا‬ ‫ا‬ ‫أعدن‬ ‫و‬ ‫ل‬ ‫ا‬ ‫أنن‬ ‫ي‬ ‫يعن‬ ‫هذا‬ ‫فان‬ 100 ‫ة‬‫النتيج‬ ‫س‬‫نف‬ ‫ى‬‫عل‬ ‫ل‬‫نحص‬ ‫وف‬‫س‬ ‫ا‬‫فانن‬ ‫مرة‬ 95 ‫وف‬‫وس‬ ،‫مرة‬ ‫و‬ ‫ه‬ ‫ة‬ ‫مختلف‬ ‫ة‬ ‫نتيج‬ ‫ى‬ ‫عل‬ ‫ل‬ ‫نحص‬ ‫ن‬ ‫أ‬ ‫ي‬ ‫ف‬ ‫أ‬ ‫الخط‬ ‫بة‬ ‫نس‬ ‫تكون‬ ( ‫أي‬ ‫المئة‬ ‫اصل‬ ‫من‬ ‫مرات‬ ‫خمسة‬ 0.05 .) O ‫الداللة‬ ‫لمستوى‬ ‫بالنسبة‬ ‫ر‬‫األم‬ ‫وكذلك‬ 0.01 ‫انني‬ ‫يعني‬ ‫فانه‬ ، ‫ة‬ ‫النتيج‬ ‫س‬ ‫نف‬ ‫ى‬ ‫عل‬ ‫ل‬ ‫احص‬ ‫وف‬ ‫س‬ 99 ‫الـ‬ ‫ل‬ ‫أص‬ ‫ن‬ ‫م‬ ‫مرة‬ 100 . ‫أ‬ ‫الخط‬ ‫بة‬ ‫نس‬ ‫ا‬ ‫بينم‬ ‫االختبار‬ ‫و‬ ‫أ‬ ‫ة‬ ‫التجرب‬ ‫ا‬ ‫فيه‬ ‫د‬ ‫أعي‬ ‫ي‬ ‫الت‬ ‫مرة‬ ‫كل‬ ‫في‬ ‫فقط‬ ‫واحدة‬ ‫مرة‬ ‫لتكون‬ ‫بكثير‬ ‫تقل‬ 100 .‫مرة‬
  • 17.
    O ‫ة‬ ‫الدالل‬ ‫توى‬‫مس‬ ‫ن‬ ‫أ‬ ‫ا‬ ‫بقولن‬ ‫بق‬ ‫س‬ ‫ا‬ ‫م‬ ‫ص‬ ‫تلخي‬ ‫ن‬ ‫ويمك‬ ‫اإلحتمال‬ ‫ة‬ ‫درج‬ ‫و‬ ‫ه‬ ،‫االحتمال‬ ‫توى‬ ‫مس‬ ‫و‬ ‫أ‬ ‫ائية‬ ‫اإلحص‬ ‫فرية‬ ‫الص‬ ‫ة‬ ‫الفرضي‬ ‫ه‬ ‫ب‬ ‫ض‬ ‫رف‬ُ‫ت‬ ‫الذي‬ H0 ‫ي‬ ‫ه‬ ‫تكون‬ ‫ا‬ ‫عندم‬ ‫النوع‬ ‫ن‬ ‫م‬ ‫أ‬ ‫الخط‬ ‫ي‬ ‫ف‬ ‫الوقوع‬ ‫احتمال‬ ‫و‬ ‫ه‬ ‫ي‬ ‫أ‬ ،‫حيحة‬ ‫الص‬ : ) ( ‫أنواع‬ ‫ثالثة‬ ‫وهي‬ ، ‫ألفا‬ ‫األول‬ - ‫د‬ ‫ن‬‫ع‬ ‫ل‬‫ا‬‫د‬ 0.05 ‫ة‬‫ق‬‫ث‬‫ل‬‫ا‬ ‫ى‬‫و‬‫ت‬‫س‬‫م‬ ‫ي‬‫أ‬ 95 % ‫ك‬ ‫ش‬‫ل‬‫ا‬‫و‬ 5 .% - ‫د‬ ‫عن‬ ‫دال‬ 0.01 ‫ي‬ ‫أ‬ ‫ة‬‫الثق‬ ‫توى‬‫مس‬ 99 % ‫ك‬ ‫والش‬ 1 .% - ‫د‬ ‫ن‬‫ع‬ ‫ل‬‫ا‬‫د‬ 0.001 ‫ي‬ ‫أ‬ ‫ة‬ ‫ق‬‫ث‬‫ل‬‫ا‬ ‫ى‬‫و‬‫ت‬ ‫س‬‫م‬ 99.9 % ‫ك‬ ‫ش‬‫ل‬‫ا‬‫و‬ 0.1 %
  • 18.
    test statistic  Inhypothesis testing, the test statistic is a numerical value that helps us determine whether the results of a study are statistically significant or simply due to chance.  It quantifies the difference between the observed data and what we would expect if the null hypothesis were true.
  • 19.
    test statistic  Thetest statistic is calculated using the data collected in the study and a specific formula or statistical test.  The choice of test statistic depends on the type of data and the research question being investigated.
  • 20.
    test statistic  Oncewe have the test statistic, we compare it to a critical value or a p-value to make a decision. If the test statistic is larger than the critical value or if the p-value is smaller than a predetermined significance level (usually 0.05), we reject the null hypothesis and conclude that there is evidence of a significant effect or difference.  If the test statistic is smaller than the critical value or if the p-value is greater than the significance level, we fail to reject the null hypothesis and conclude that there is not enough evidence to support a significant effect or difference.
  • 21.
    Critical Region Critical Region(or Rejection Region) Set of all values of the test statistic that would cause a rejection of the null hypothesis Critical Region
  • 22.
    Critical Region Critical Region(or Rejection Region) Set of all values of the test statistic that would cause a rejection of the null hypothesis Critical Region
  • 23.
    Critical Region Set ofall values of the test statistic that would cause a rejection of the null hypothesis Critical Regions
  • 25.
    Significance Level ofthe Hypothesis Test  denoted by   the probability that the test statistic will fall in the critical region when the null hypothesis is actually true  The probability of rejecting the null hypothesis  common choices are 0.05, 0.01, and 0.10
  • 28.
    Example  Let's considera scenario where a group of nursing students is conducting a study to investigate the effect of a new pain management intervention on postoperative pain in patients. The null hypothesis (H0) in this case could be:  H0: There is no difference in postoperative pain scores between patients who receive the new pain management intervention and those who receive standard care.  The alternative hypothesis (Ha), on the other hand, would state the expected difference or effect:  Ha: Patients who receive the new pain management intervention will have lower postoperative pain scores compared to those who receive standard care.  In this example, the null hypothesis assumes that there is no difference between the two groups in terms of postoperative pain scores. The alternative hypothesis, however, suggests that the new pain management intervention will lead to lower pain scores compared to standard care.  To test these hypotheses, the nursing students would collect data on postoperative pain scores from two groups of patients: one group receiving the new pain management intervention and another group receiving standard care. They would then analyze the data using appropriate statistical tests, such as t-tests or chi- square tests, to determine if there is enough evidence to reject the null hypothesis in favor of the alternative hypothesis.  By using this example, you can explain to nursing students that the null hypothesis represents the absence of an effect or difference, while the alternative hypothesis represents the expected effect or difference. It's important to emphasize that the purpose of hypothesis testing is to evaluate the evidence and make conclusions based on the data collected.