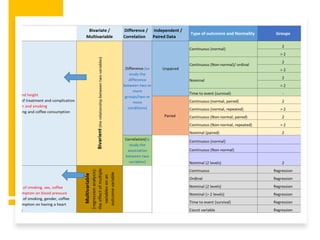
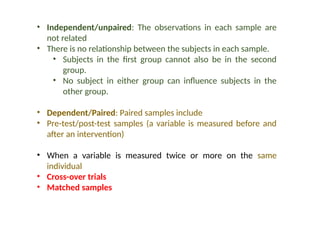
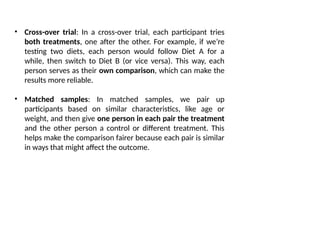
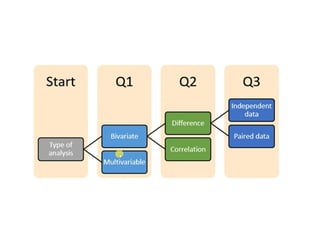
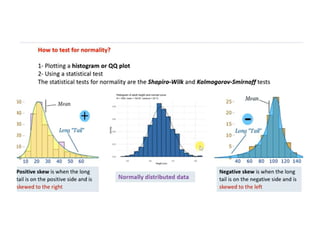
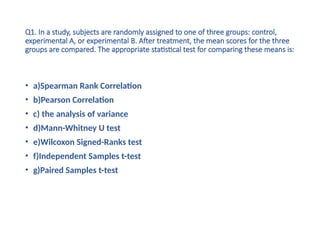
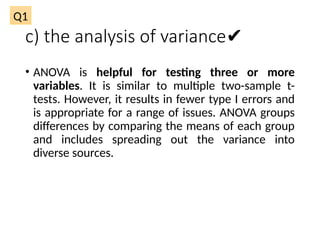
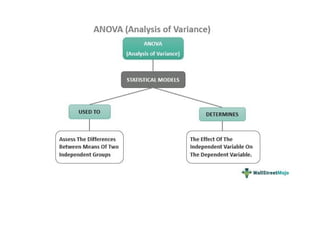
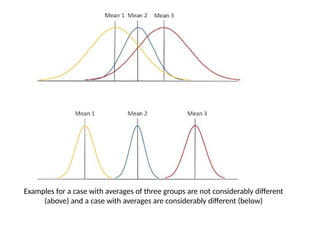
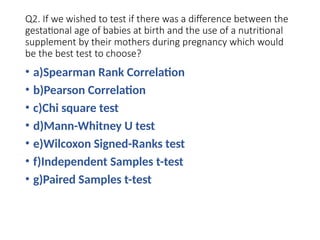
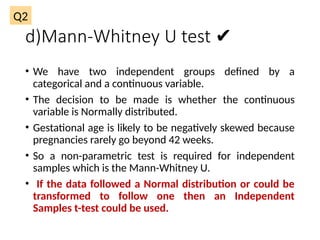
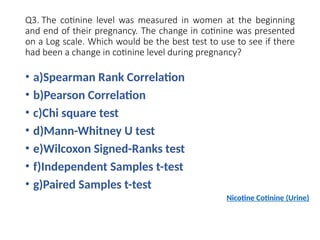
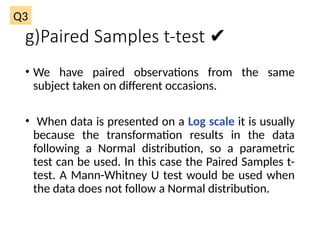
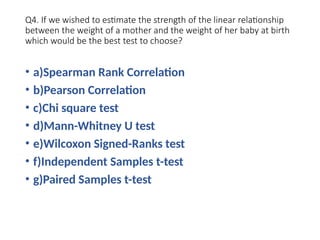
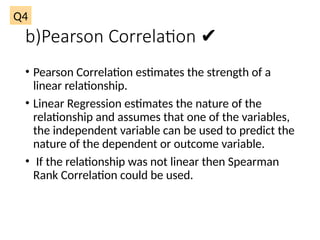
Common Statistical
Techniques
• Independent/unpaired: The observations in each sample are
not related
• There is no relationship between the subjects in each sample.
• Subjects in the first group cannot also be in the second
group.
• No subject in either group can influence subjects in the
other group.
• Dependent/Paired: Paired samples include
• Pre-test/post-test samples (a variable is measured before and
after an intervention)
• When a variable is measured twice or more on the same
individual
• Cross-over trials
• Matched samples
• Cross-over trial: In a cross-over trial, each participant tries
both treatments, one after the other. For example, if we’re
testing two diets, each person would follow Diet A for a
while, then switch to Diet B (or vice versa). This way, each
person serves as their own comparison, which can make the
results more reliable.
• Matched samples: In matched samples, we pair up
participants based on similar characteristics, like age or
weight, and then give one person in each pair the treatment
and the other person a control or different treatment. This
helps make the comparison fairer because each pair is similar
in ways that might affect the outcome.
Q1. In a study, subjects are randomly assigned to one of three groups: control,
experimental A, or experimental B. After treatment, the mean scores for the three
groups are compared. The appropriate statistical test for comparing these means is:
• a)Spearman Rank Correlation
• b)Pearson Correlation
• c) the analysis of variance
• d)Mann-Whitney U test
• e)Wilcoxon Signed-Ranks test
• f)Independent Samples t-test
• g)Paired Samples t-test
c) the analysis of variance✔
• ANOVA is helpful for testing three or more
variables. It is similar to multiple two-sample t-
tests. However, it results in fewer type I errors and
is appropriate for a range of issues. ANOVA groups
differences by comparing the means of each group
and includes spreading out the variance into
diverse sources.
Q1
Examples for a case with averages of three groups are not considerably different
(above) and a case with averages are considerably different (below)
Q2. If we wished to test if there was a difference between the
gestational age of babies at birth and the use of a nutritional
supplement by their mothers during pregnancy which would
be the best test to choose?
• a)Spearman Rank Correlation
• b)Pearson Correlation
• c)Chi square test
• d)Mann-Whitney U test
• e)Wilcoxon Signed-Ranks test
• f)Independent Samples t-test
• g)Paired Samples t-test
d)Mann-Whitney U test ✔
• We have two independent groups defined by a
categorical and a continuous variable.
• The decision to be made is whether the continuous
variable is Normally distributed.
• Gestational age is likely to be negatively skewed because
pregnancies rarely go beyond 42 weeks.
• So a non-parametric test is required for independent
samples which is the Mann-Whitney U.
• If the data followed a Normal distribution or could be
transformed to follow one then an Independent
Samples t-test could be used.
Q2
Q3. The cotinine level was measured in women at the beginning
and end of their pregnancy. The change in cotinine was presented
on a Log scale. Which would be the best test to use to see if there
had been a change in cotinine level during pregnancy?
• a)Spearman Rank Correlation
• b)Pearson Correlation
• c)Chi square test
• d)Mann-Whitney U test
• e)Wilcoxon Signed-Ranks test
• f)Independent Samples t-test
• g)Paired Samples t-test
Nicotine Cotinine (Urine)
g)Paired Samples t-test ✔
• We have paired observations from the same
subject taken on different occasions.
• When data is presented on a Log scale it is usually
because the transformation results in the data
following a Normal distribution, so a parametric
test can be used. In this case the Paired Samples t-
test. A Mann-Whitney U test would be used when
the data does not follow a Normal distribution.
Q3
Q4. If we wished to estimate the strength of the linear relationship
between the weight of a mother and the weight of her baby at birth
which would be the best test to choose?
• a)Spearman Rank Correlation
• b)Pearson Correlation
• c)Chi square test
• d)Mann-Whitney U test
• e)Wilcoxon Signed-Ranks test
• f)Independent Samples t-test
• g)Paired Samples t-test
b)Pearson Correlation ✔
• Pearson Correlation estimates the strength of a
linear relationship.
• Linear Regression estimates the nature of the
relationship and assumes that one of the variables,
the independent variable can be used to predict the
nature of the dependent or outcome variable.
• If the relationship was not linear then Spearman
Rank Correlation could be used.
Q4
Q5. The pre-operative and post-operative anxiety levels of adolescent patients undergoing orthopaedic
surgery were measured using the State-Trait Anxiety Inventory STAI scale. The authors reported the
pre-operative anxiety levels as mean = 33.8 (SD = 5.1) and post-operative anxiety levels as mean = 38.8
(SD = 7.2). Which would have been the most appropriate test to assess the relationship between pre and
post operative anxiety?
• a)Spearman Rank Correlation
• b)Pearson Correlation
• c)Chi square test
• d)Mann-Whitney U test
• e)Wilcoxon Signed-Ranks test
• f)Independent Samples t-test
• g)Paired Samples t-test
g)Paired Samples t-test ✔
• We have paired data from the same subjects so a
Paired Samples t-test is appropriate assuming the
differences in the data followed a Normal
distribution which is implied by the presentation of
the means and standard deviations.
• The authors of this study did not present the mean
difference of the pre - post values which should be
quoted together with 95% confidence intervals.
Q5
Q6. Which test would you choose to compare
two groups with skewed unpaired continuous
data?
• a)Spearman Rank Correlation
• b)Pearson Correlation
• c)Chi square test
• d)Mann-Whitney U test
• e)Wilcoxon Signed-Ranks test
• f)Independent Samples t-test
• g)Paired Samples t-test
d)Mann-Whitney U test ✔
Q6
Q7. Which test would you choose to compare
the relationship between two continuous
variables which had skewed distributions?
• a)Spearman Rank Correlation
• b)Pearson Correlation
• c)Chi square test
• d)Mann-Whitney U test
• e)Wilcoxon Signed-Ranks test
• f)Independent Samples t-test
• g)Paired Samples t-test
a)Spearman Rank Correlation ✔
• The Spearman Rank Correlation coefficient is used.
• Pearson correlation assumes that at least one of
the variables follows a Normal distribution.
Q7
Q8. Which test would you choose to compare a single sample
of non-parametric values with a published value?
• a)Spearman Rank Correlation
• b)Pearson Correlation
• c)Chi square test
• d)Mann-Whitney U test
• e)Wilcoxon Signed-Ranks test
• f)Independent Samples t-test
• g)Paired Samples t-test
e)Wilcoxon Signed-Ranks test ✔
• You would use the Wilcoxon Signed-Ranks test to
compare the data values from your sample with the
published value where the data does not follow a
Normal distribution. You pair each sample value
with the published value. If the data was Normally
distributed you could use the one sample t-test.
Q8

chapter no. 6 choose statistical analysis.pptx

  • 1.
  • 3.
    • Independent/unpaired: Theobservations in each sample are not related • There is no relationship between the subjects in each sample. • Subjects in the first group cannot also be in the second group. • No subject in either group can influence subjects in the other group. • Dependent/Paired: Paired samples include • Pre-test/post-test samples (a variable is measured before and after an intervention) • When a variable is measured twice or more on the same individual • Cross-over trials • Matched samples
  • 4.
    • Cross-over trial:In a cross-over trial, each participant tries both treatments, one after the other. For example, if we’re testing two diets, each person would follow Diet A for a while, then switch to Diet B (or vice versa). This way, each person serves as their own comparison, which can make the results more reliable. • Matched samples: In matched samples, we pair up participants based on similar characteristics, like age or weight, and then give one person in each pair the treatment and the other person a control or different treatment. This helps make the comparison fairer because each pair is similar in ways that might affect the outcome.
  • 7.
    Q1. In astudy, subjects are randomly assigned to one of three groups: control, experimental A, or experimental B. After treatment, the mean scores for the three groups are compared. The appropriate statistical test for comparing these means is: • a)Spearman Rank Correlation • b)Pearson Correlation • c) the analysis of variance • d)Mann-Whitney U test • e)Wilcoxon Signed-Ranks test • f)Independent Samples t-test • g)Paired Samples t-test
  • 8.
    c) the analysisof variance✔ • ANOVA is helpful for testing three or more variables. It is similar to multiple two-sample t- tests. However, it results in fewer type I errors and is appropriate for a range of issues. ANOVA groups differences by comparing the means of each group and includes spreading out the variance into diverse sources. Q1
  • 10.
    Examples for acase with averages of three groups are not considerably different (above) and a case with averages are considerably different (below)
  • 11.
    Q2. If wewished to test if there was a difference between the gestational age of babies at birth and the use of a nutritional supplement by their mothers during pregnancy which would be the best test to choose? • a)Spearman Rank Correlation • b)Pearson Correlation • c)Chi square test • d)Mann-Whitney U test • e)Wilcoxon Signed-Ranks test • f)Independent Samples t-test • g)Paired Samples t-test
  • 12.
    d)Mann-Whitney U test✔ • We have two independent groups defined by a categorical and a continuous variable. • The decision to be made is whether the continuous variable is Normally distributed. • Gestational age is likely to be negatively skewed because pregnancies rarely go beyond 42 weeks. • So a non-parametric test is required for independent samples which is the Mann-Whitney U. • If the data followed a Normal distribution or could be transformed to follow one then an Independent Samples t-test could be used. Q2
  • 13.
    Q3. The cotininelevel was measured in women at the beginning and end of their pregnancy. The change in cotinine was presented on a Log scale. Which would be the best test to use to see if there had been a change in cotinine level during pregnancy? • a)Spearman Rank Correlation • b)Pearson Correlation • c)Chi square test • d)Mann-Whitney U test • e)Wilcoxon Signed-Ranks test • f)Independent Samples t-test • g)Paired Samples t-test Nicotine Cotinine (Urine)
  • 14.
    g)Paired Samples t-test✔ • We have paired observations from the same subject taken on different occasions. • When data is presented on a Log scale it is usually because the transformation results in the data following a Normal distribution, so a parametric test can be used. In this case the Paired Samples t- test. A Mann-Whitney U test would be used when the data does not follow a Normal distribution. Q3
  • 15.
    Q4. If wewished to estimate the strength of the linear relationship between the weight of a mother and the weight of her baby at birth which would be the best test to choose? • a)Spearman Rank Correlation • b)Pearson Correlation • c)Chi square test • d)Mann-Whitney U test • e)Wilcoxon Signed-Ranks test • f)Independent Samples t-test • g)Paired Samples t-test
  • 16.
    b)Pearson Correlation ✔ •Pearson Correlation estimates the strength of a linear relationship. • Linear Regression estimates the nature of the relationship and assumes that one of the variables, the independent variable can be used to predict the nature of the dependent or outcome variable. • If the relationship was not linear then Spearman Rank Correlation could be used. Q4
  • 17.
    Q5. The pre-operativeand post-operative anxiety levels of adolescent patients undergoing orthopaedic surgery were measured using the State-Trait Anxiety Inventory STAI scale. The authors reported the pre-operative anxiety levels as mean = 33.8 (SD = 5.1) and post-operative anxiety levels as mean = 38.8 (SD = 7.2). Which would have been the most appropriate test to assess the relationship between pre and post operative anxiety? • a)Spearman Rank Correlation • b)Pearson Correlation • c)Chi square test • d)Mann-Whitney U test • e)Wilcoxon Signed-Ranks test • f)Independent Samples t-test • g)Paired Samples t-test
  • 18.
    g)Paired Samples t-test✔ • We have paired data from the same subjects so a Paired Samples t-test is appropriate assuming the differences in the data followed a Normal distribution which is implied by the presentation of the means and standard deviations. • The authors of this study did not present the mean difference of the pre - post values which should be quoted together with 95% confidence intervals. Q5
  • 19.
    Q6. Which testwould you choose to compare two groups with skewed unpaired continuous data? • a)Spearman Rank Correlation • b)Pearson Correlation • c)Chi square test • d)Mann-Whitney U test • e)Wilcoxon Signed-Ranks test • f)Independent Samples t-test • g)Paired Samples t-test
  • 20.
  • 21.
    Q7. Which testwould you choose to compare the relationship between two continuous variables which had skewed distributions? • a)Spearman Rank Correlation • b)Pearson Correlation • c)Chi square test • d)Mann-Whitney U test • e)Wilcoxon Signed-Ranks test • f)Independent Samples t-test • g)Paired Samples t-test
  • 22.
    a)Spearman Rank Correlation✔ • The Spearman Rank Correlation coefficient is used. • Pearson correlation assumes that at least one of the variables follows a Normal distribution. Q7
  • 23.
    Q8. Which testwould you choose to compare a single sample of non-parametric values with a published value? • a)Spearman Rank Correlation • b)Pearson Correlation • c)Chi square test • d)Mann-Whitney U test • e)Wilcoxon Signed-Ranks test • f)Independent Samples t-test • g)Paired Samples t-test
  • 24.
    e)Wilcoxon Signed-Ranks test✔ • You would use the Wilcoxon Signed-Ranks test to compare the data values from your sample with the published value where the data does not follow a Normal distribution. You pair each sample value with the published value. If the data was Normally distributed you could use the one sample t-test. Q8