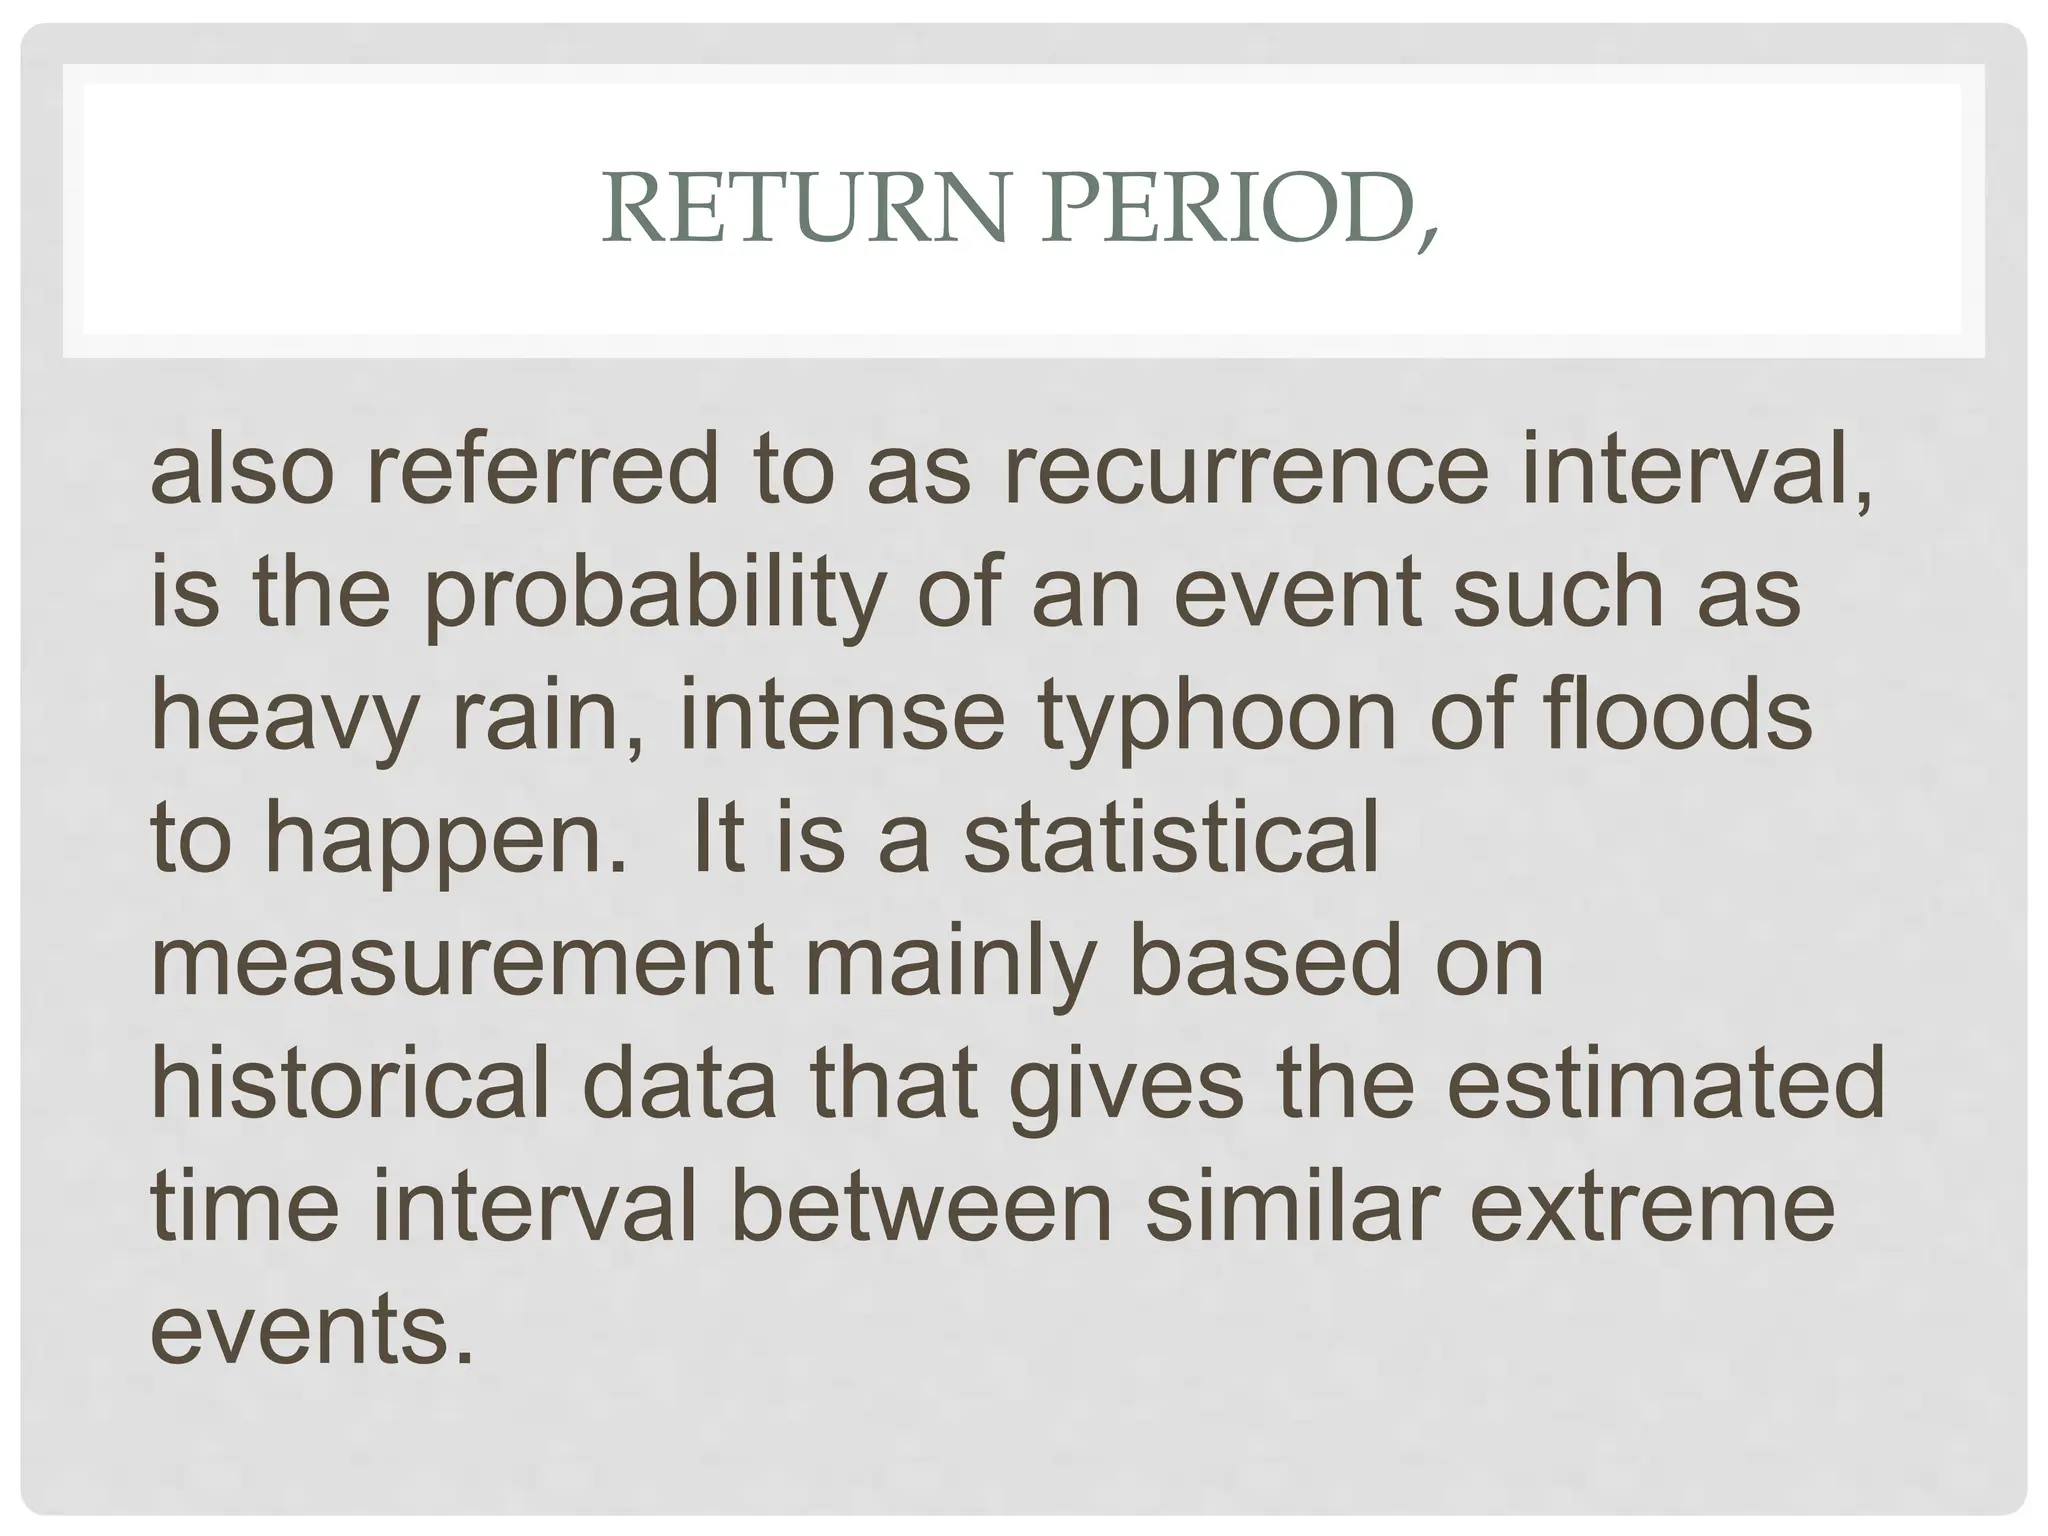
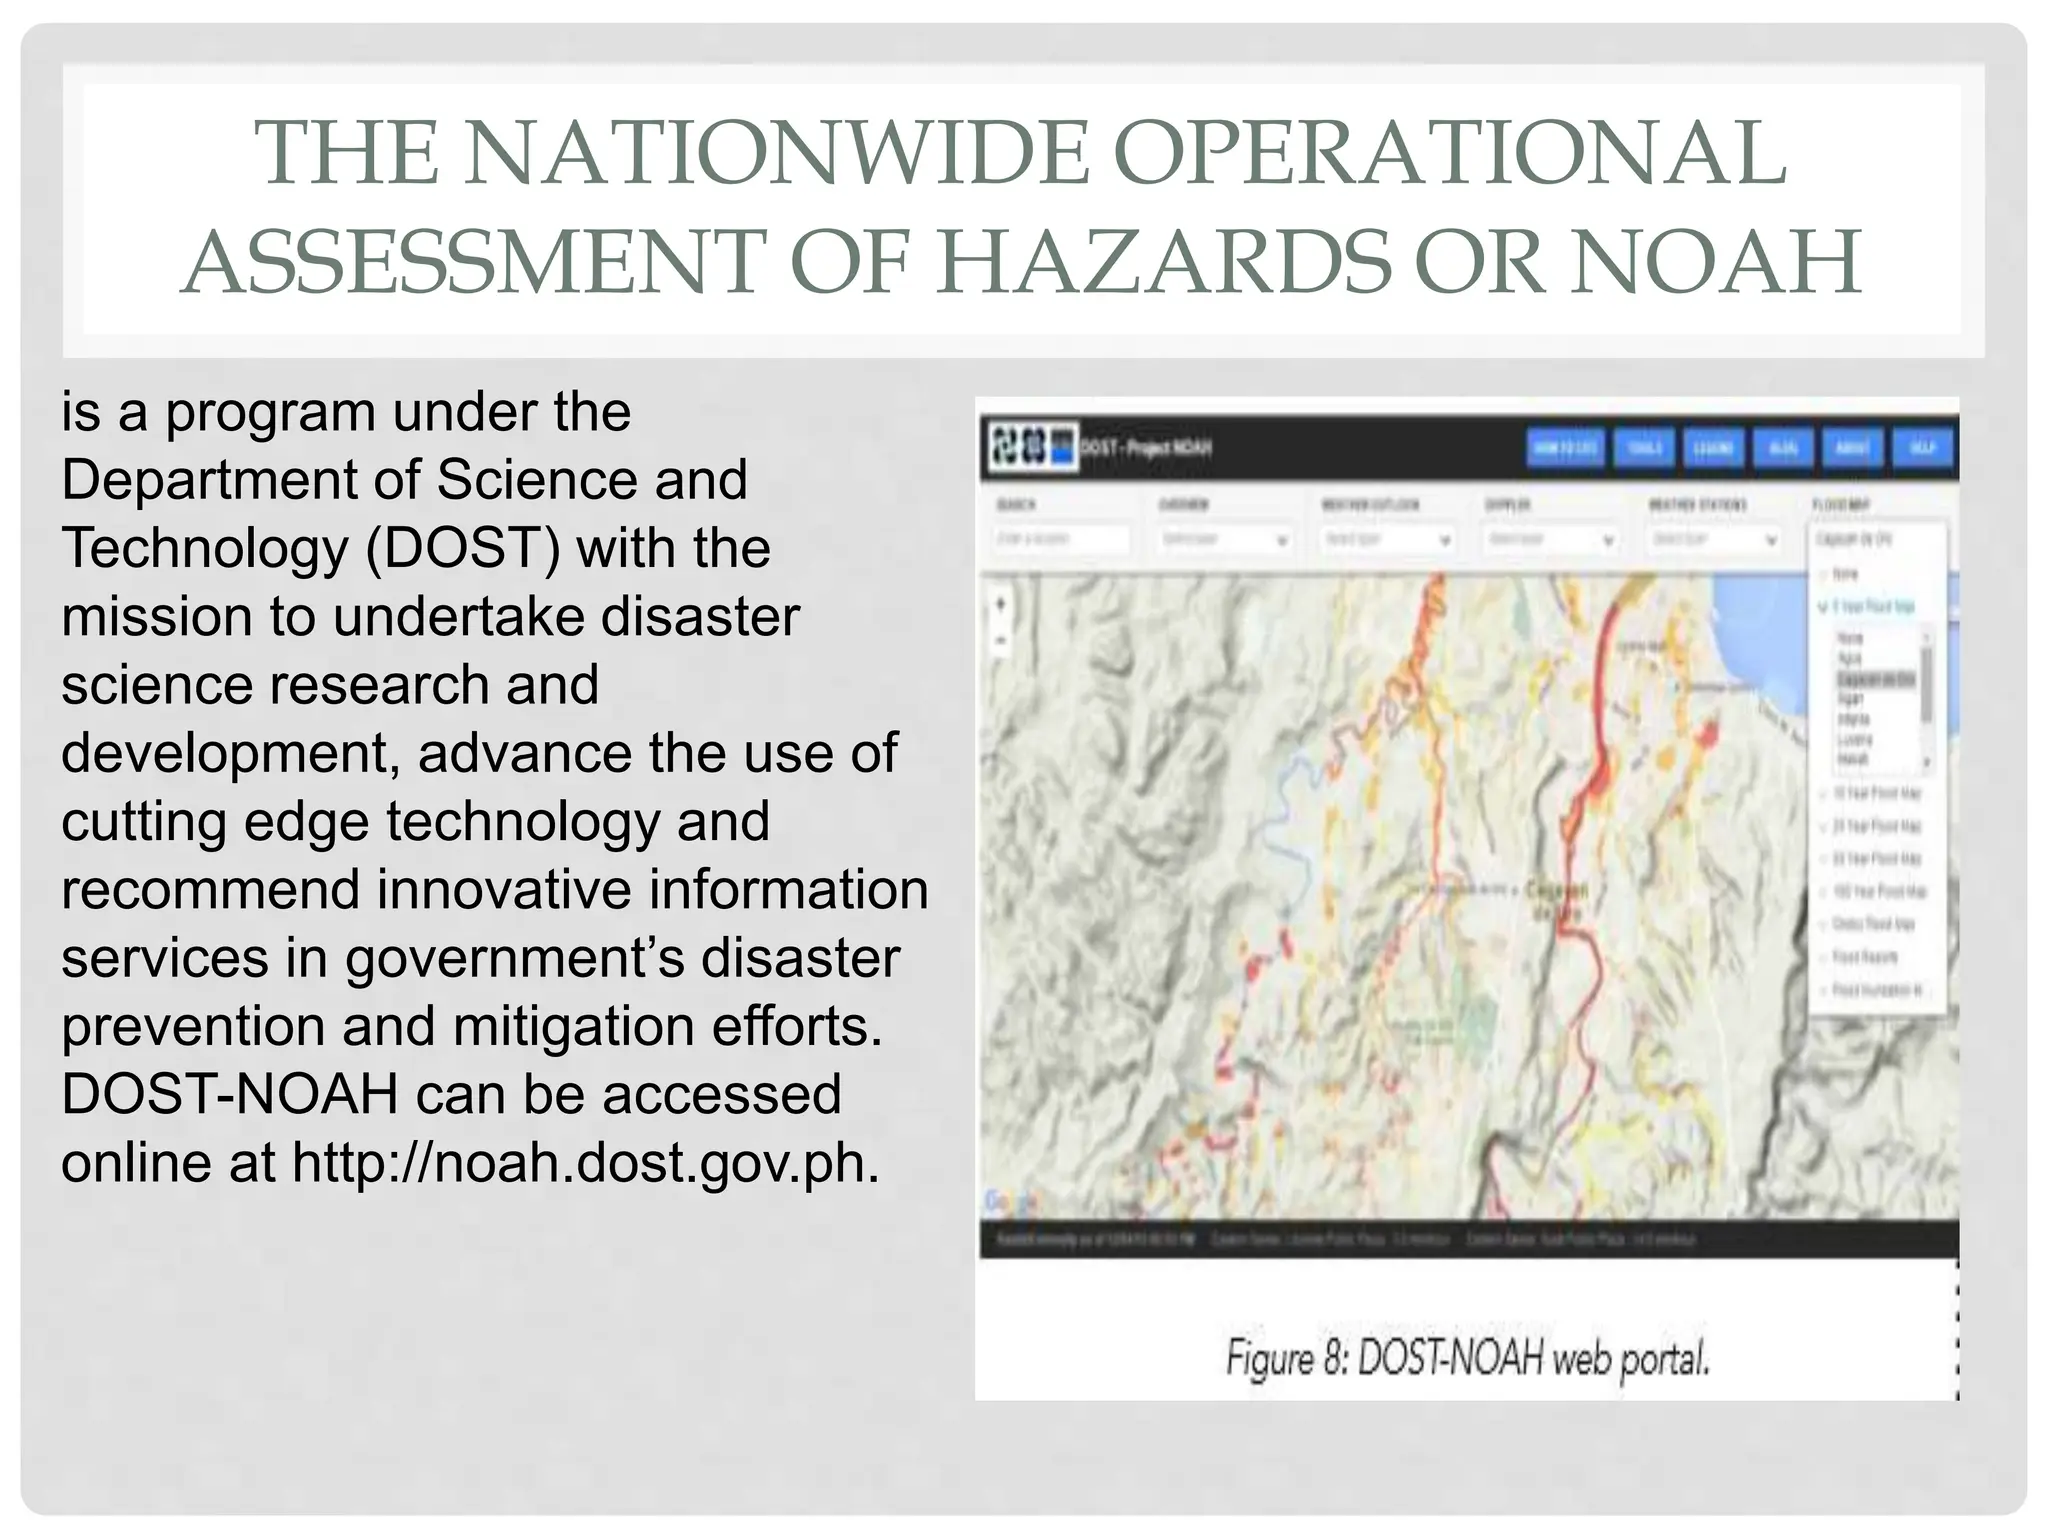
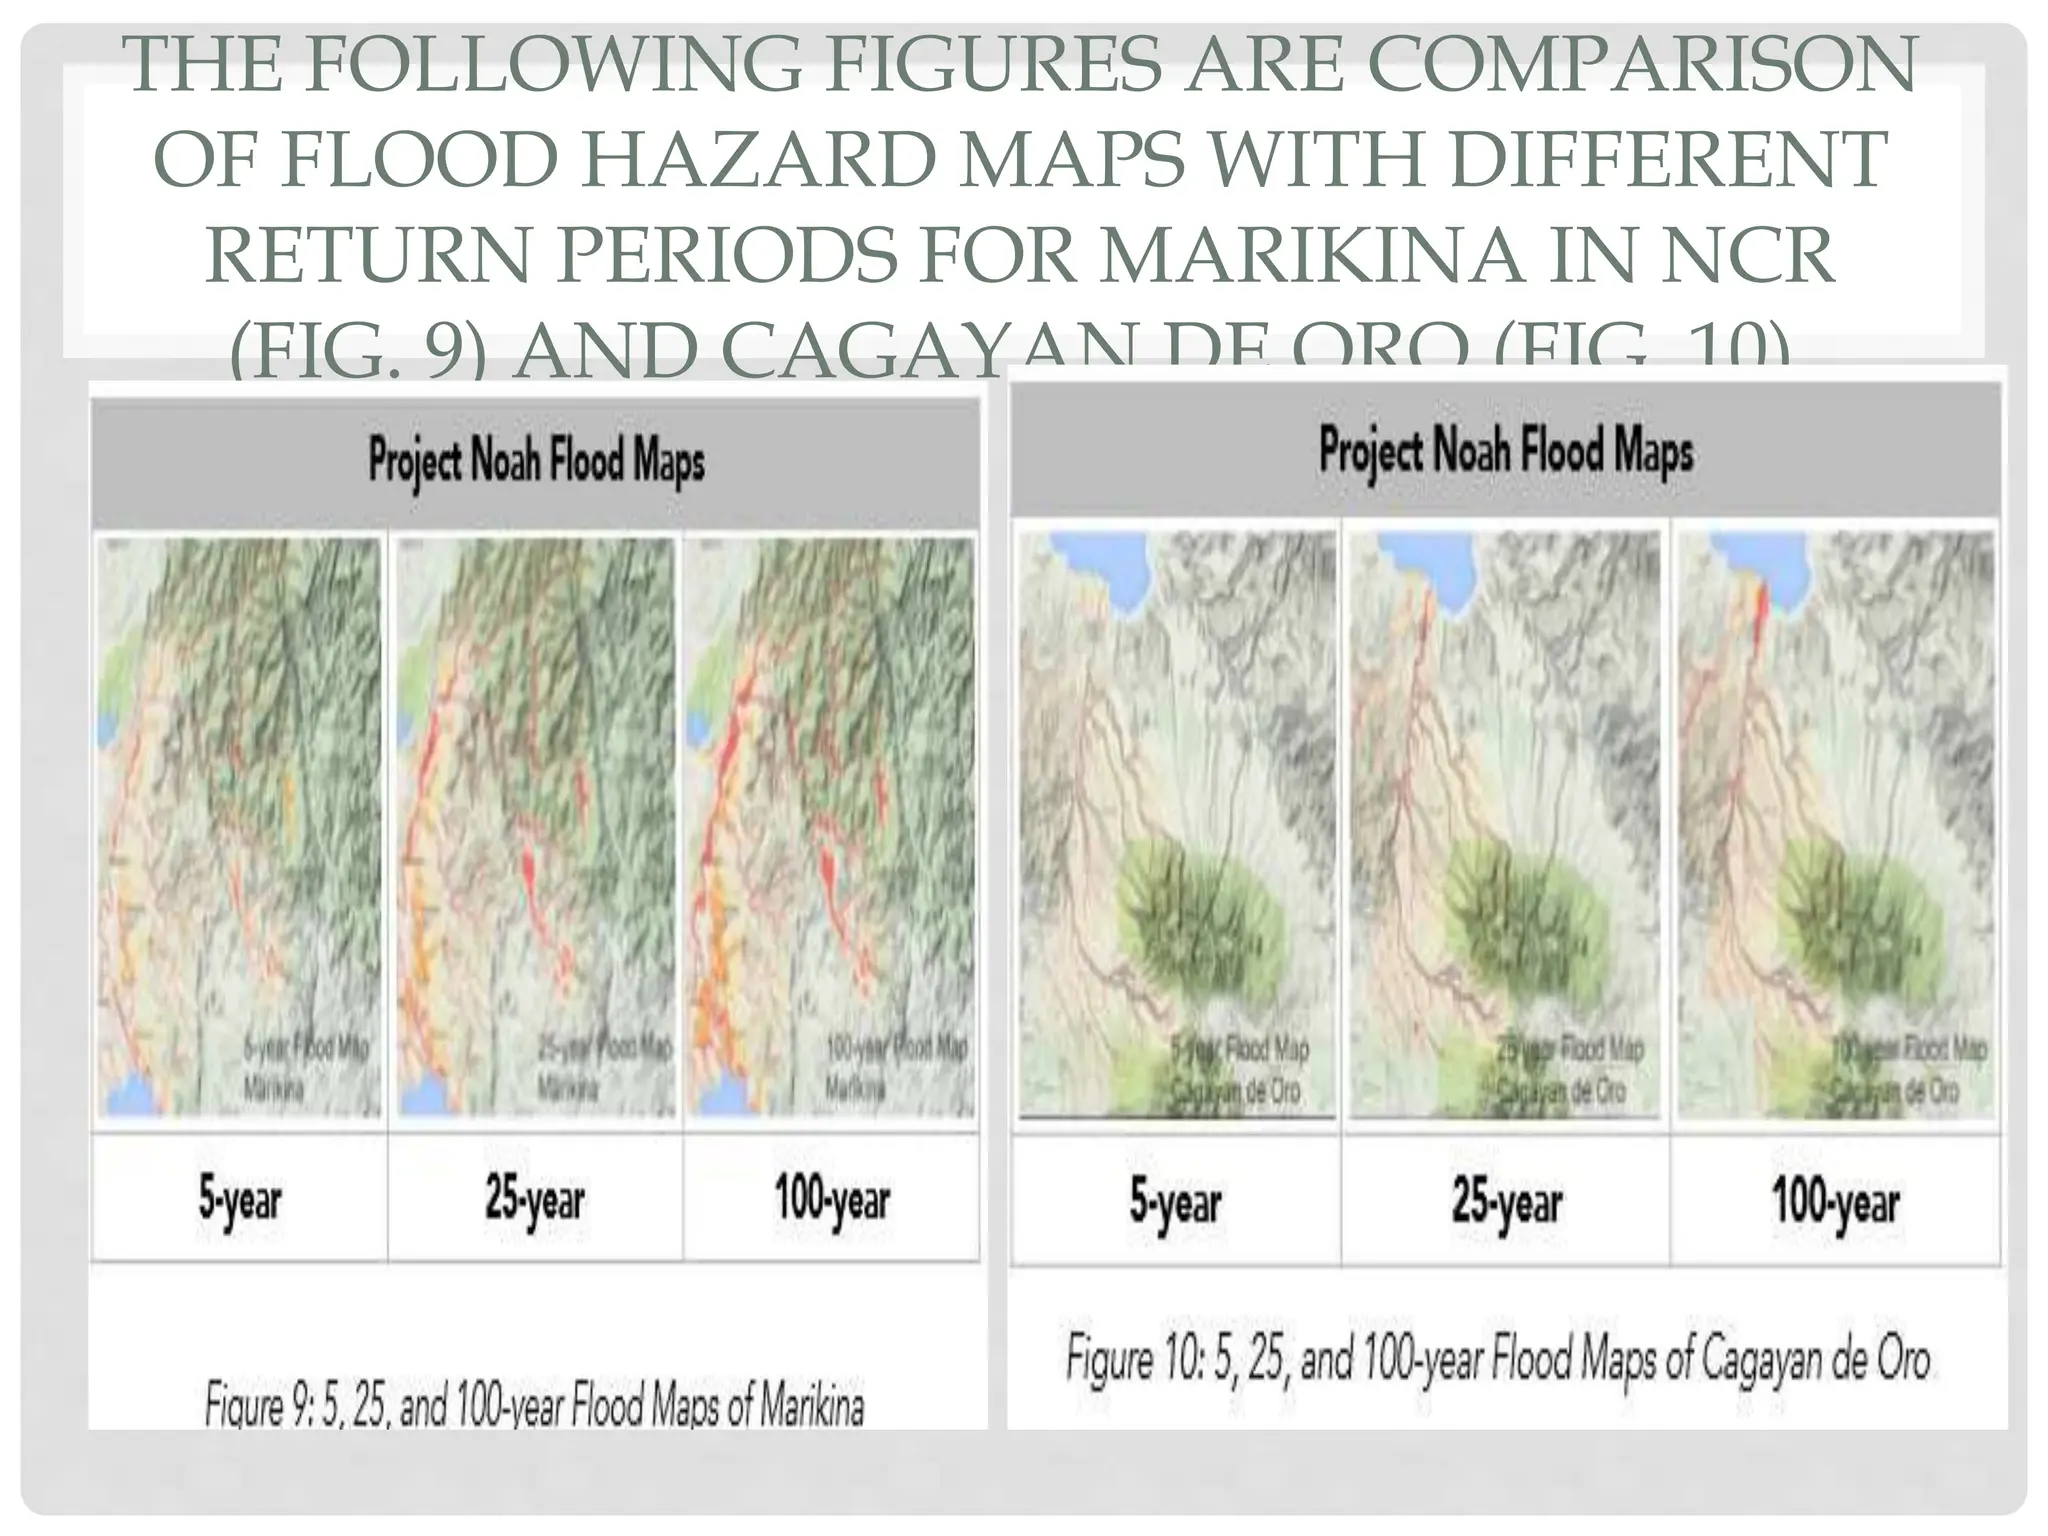
2. RETURN PERIOD,
also referred to as recurrence interval,
is the probability of an event such as
heavy rain, intense typhoon of floods
to happen. It is a statistical
measurement mainly based on
historical data that gives the estimated
time interval between similar extreme
events.
3. FOR EXAMPLE,
the return period of a heavy rainfall event is 100
years, this can be expressed as an event with a
probability of happening equivalent to 1/100 or
1%. This does not mean that the next similar
extreme event will happen 100 years after,
instead, it means that in a given year, there is a
1% chance that the event will happen.
Consequently, 100-year floods can happen in 2
consecutive years. In analysis of extreme
hydrometeorological events, “return periods” are
usually used to infer the severity of an event.
4. RAINFALL IN THE PHILIPPINES
Rainfall is the most important climatic
element in the Philippines. Rainfall
distribution throughout the country
varies from one region to another,
depending upon the direction of the
moisture-bearing winds and the
location of the mountain systems.
5. THE MODIFIED CORONAS CLIMATE CLASSIFICATION
(FIG. 1) DESCRIBES THE MONTHLY RAINFALL
VARIATIONS IN DIFFERENT PARTS OF THE
COUNTRY.
6.
7. RAINFALL OBSERVATION
Aside from rain gauge monitoring in different parts
of the Philippines, PAGASA publishes regularly
updated color-coded satellite images (Fig. 2) from
the Multi-Functional Transport Satellite or MTSAT
(as of Dec 2015, but will soon shift to a newer
satellite called Himawari-8) to visualize rain
distribution across the country. Color code is as
follows: Red – heavy rain; Yellow – light to
moderate rain; White – clouds; Blue – clear sky.
8. In addition to the satellite observation, PAGASA
operates 10 weather radar stations (as of 2015)
all over the Philippines. Fig. 3 shows the
locations of these weather radar systems.
Weather radar can detect hydrometeors (e.g. rain,
clouds) by transmitting electromagnetic radiation
to the atmosphere then analyze the returning
“echoes” reflected by weather elements present in
the sky. Figure 4 shows a sample radar image
over Bataan also using a color coding scheme to
visualize rainfall in the region.
9.
10.
11.
12. THE NATIONWIDE OPERATIONAL
ASSESSMENT OF HAZARDS OR NOAH
is a program under the
Department of Science and
Technology (DOST) with the
mission to undertake disaster
science research and
development, advance the use of
cutting edge technology and
recommend innovative information
services in government’s disaster
prevention and mitigation efforts.
DOST-NOAH can be accessed
online at http://noah.dost.gov.ph.
13. THE FOLLOWING FIGURES ARE COMPARISON
OF FLOOD HAZARD MAPS WITH DIFFERENT
RETURN PERIODS FOR MARIKINA IN NCR
(FIG. 9) AND CAGAYAN DE ORO (FIG. 10).
14. Another local website,
http://www.nababaha.com, a
non-profit project by the
members of the Volcano-
Techtonics Laboratory of the
National Institute of Geological
Sciences of University of the
Philippines, publishes a list of
flood hazard maps of different
regions
(http://www.nababaha.com/list.h
tm), with the same dataset as
DOST-NOA
15. National Mapping and Resource
Information Authority (NAMRIA) is
an agency of the Philippine
government under the Department of
Environment and Natural Resources
(DENR) responsible for providing the
public with mapmaking services and
acting as the central mapping
agency, depository, and distribution
facility of natural resources data in
the form of maps, charts, texts, and
statistics. On its website’s download
page,
http://www.namria.gov.ph/download.php,
hazard/susceptibility maps for storm
surge, rain-induced landslide and flood
are freely available.
On the left: Figure 11:
Flood/Flashflood susceptibility map (left
image)
16. The Mines and Geosciences Bureau (MGB), a government agency also
under the Department of Environment and Natural Resources (DENR), is
responsible for the conservation, management, development and proper
use of the country’s mineral resources including those in reservations and
lands of public domains. MGB maintains a geohazard visualization portal
accessible at this URL http:// gdis.denr.gov.ph/mgbgoogle/.
Editor's Notes
Rainfall is the most important climatic element in the Philippines. Rainfall distribution throughout the country varies from one region to another, depending upon the direction of the moisture-bearing winds and the location of the mountain systems. The mean annual rainfall of the Philippines varies from 965 to 4,064 millimeters annually. Baguio City, eastern Samar, and eastern Surigao receive the greatest amount of rainfall while the southern portion of Cotabato receives the least amount of rain. At General Santos City in Cotabato, the average annual rainfall is only 978 millimeters for the whole year. What is the usual rainfall in you area?
Another product of PAGASA is its watershed monitoring network or Flood monitoring system. Using water level sensors that measures the height of the water level of major river systems, users can monitor impending flooding in major river systems in the Philippines. Figure 5 show the major waterways of Metro Manila and their corresponding water levels.
While we are usually concerned with heavy rainfall events, lack of rain is also a significant condition that we also experience. Weather in different parts of the Philippines can vary significantly for certain years as a response to changing global climate. One of the main climate drivers that affect the Philippines is the El Niño Southern Oscillation (ENSO) or simply El Niño.
El Niño is a significant increase in ocean temperature over the eastern and central Pacific ocean. It occurs at irregular intervals ranging from 2-7 years usually developing in the early months of the year and decay the following year. In the Philippines, El Niño conditions are often characterized by dry and warm to hot climate.
Months prior to the onset of El Niño, PAGASA publishes Drought/Dry spell outlook (Fig.6) that can warn us of impending dry conditions so we can prepare for such extreme events. Drought/Dry spell assessment (Fig.7) is also regularly published to report unusual climate conditions in different parts of the Philippines.
The NOAH website displays the PAGASA radar data, rainfall measurements of rain gauges of DOST, and has flood hazard maps for different regions of the Philippines with 5-year, 25-year, 50-year and 100-year return periods. Fig. 8 shows a sample 5-year flood hazard map accessible in its website.
PRACTICE (60 MINS) 1. Ask the learners to explore the publicly available hazard maps discussed and pin-point your location. (If school has no IT facility, the hazards maps can be printed beforehand and distributed to the students) 2. Enumerate the hazards of your area by providing corresponding hazard map 3. Discuss and enumerate the steps that can be taken to reduce future disasters in your community. 4. Present (individually or by groups) in front of class the results of the discussion.
ENRICHMENT 1. Ask the learners to go to their local barangay and see what hazard maps (or similar information) are being used to prepare the local community on certain hydrometeorological events.