Download to read offline
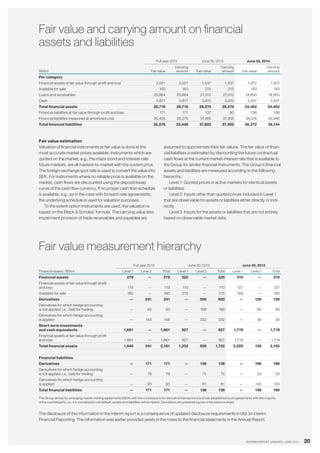
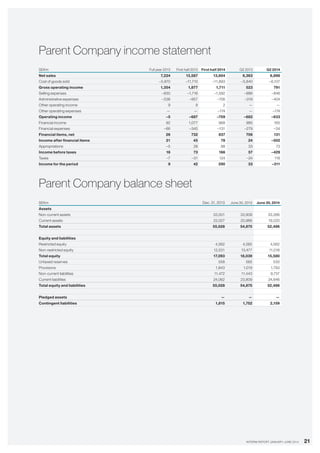
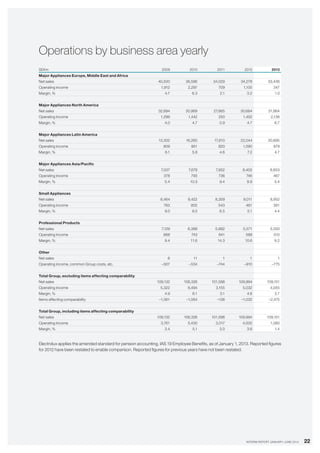
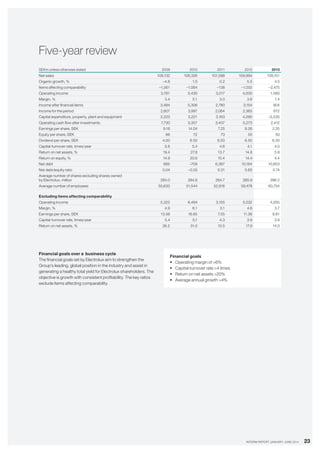

In the second quarter of 2014, Electrolux reported a 4.9% decline in net sales to SEK 26,330m, primarily due to weak market demand in Latin America, although operating income improved to SEK 1,167m, reflecting a 13% year-on-year increase. The company's cash flow strengthened, reaching SEK 3.3bn, while restructuring costs for ongoing programs amounted to SEK 1.1bn. Income for the period was negative at SEK -92m, impacted by items affecting comparability, but earnings per share improved from SEK 2.24 to SEK 2.85 in the same timeframe.


