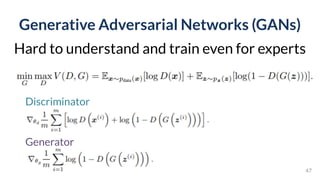
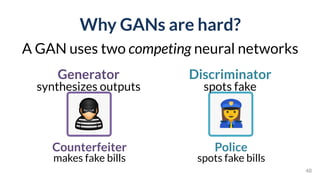
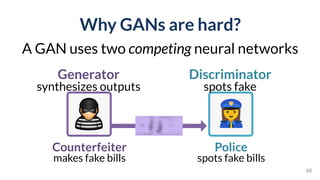
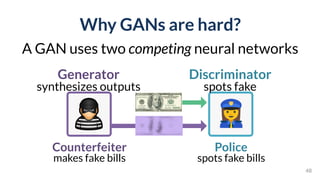
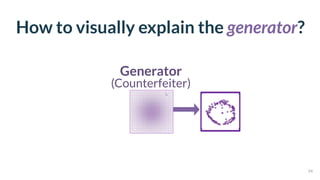
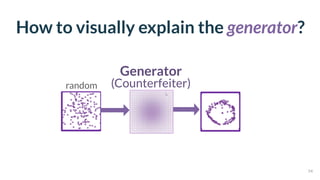
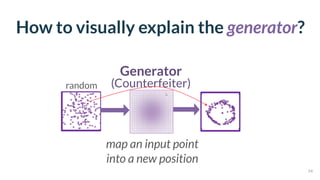
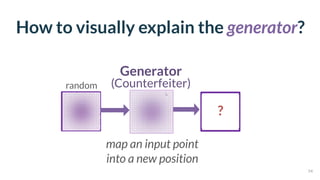
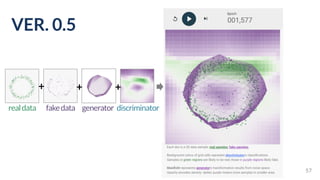
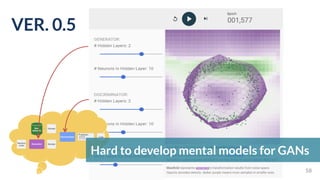
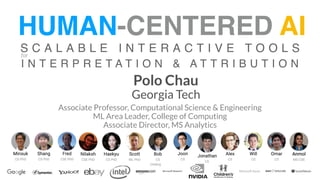
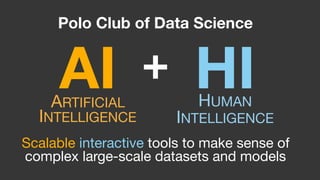
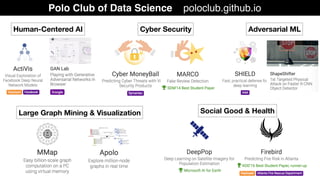
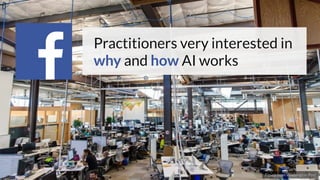
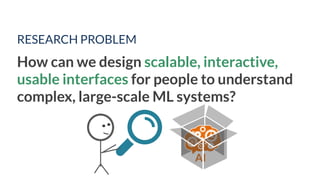
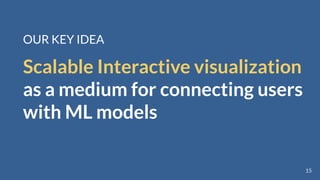
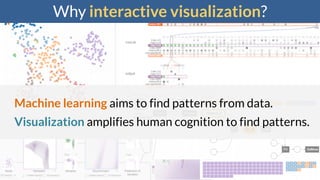
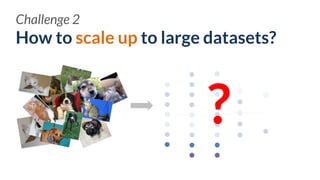
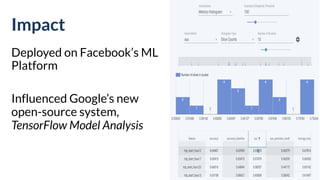
This document discusses the need for scalable interactive tools in human-centered AI to help users understand complex machine learning systems. It highlights the development of visualization tools that cater to various users, from experts to novices, and showcases research such as Activis and Gan Lab aimed at improving interpretability. The findings illustrate how such tools can enhance the understanding and accessibility of intricate models and their applications in real-world scenarios.


![8
Our ShapeShifter Attack: Stop Sign ! Person
Spotlighted in new DARPA GARD program [PKDD’18; with Intel]
Real Stop Sign
Printed Adversarial
Stop Sign](https://image.slidesharecdn.com/human-centered-ai-polo-chau-190423181122/85/Human-Centered-AI-Scalable-Interactive-Tools-for-Interpretation-and-Attribution-8-320.jpg)
![8
Our ShapeShifter Attack: Stop Sign ! Person
Spotlighted in new DARPA GARD program [PKDD’18; with Intel]](https://image.slidesharecdn.com/human-centered-ai-polo-chau-190423181122/85/Human-Centered-AI-Scalable-Interactive-Tools-for-Interpretation-and-Attribution-9-320.jpg)
![SHIELD: Fast Practical Defense for
Deep Learning via JPEG Compression
[KDD’18 Audience Appreciation Award runner up; with intel]
9](https://image.slidesharecdn.com/human-centered-ai-polo-chau-190423181122/85/Human-Centered-AI-Scalable-Interactive-Tools-for-Interpretation-and-Attribution-10-320.jpg)


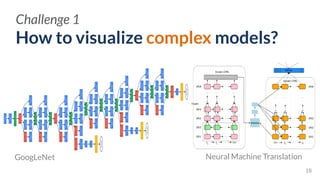
![How to make tools easy-to-use for
various users?
Challenge 3
EXPERTS NOVICES
[Hohman, Kahng, Pienta, Chau, TVCG, 2018]
PRACTITIONERS](https://image.slidesharecdn.com/human-centered-ai-polo-chau-190423181122/85/Human-Centered-AI-Scalable-Interactive-Tools-for-Interpretation-and-Attribution-24-320.jpg)
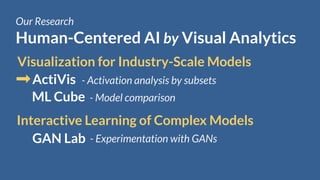
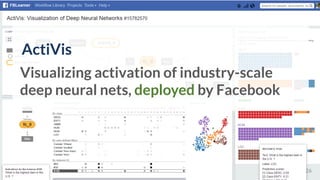
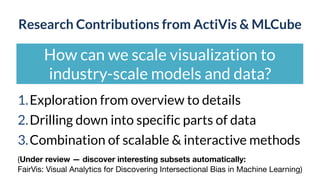
![ActiVis
Scaling Visualization to
Industry-scale Models and Data
Deployed by[Kahng, et al. IEEE VIS’17]](https://image.slidesharecdn.com/human-centered-ai-polo-chau-190423181122/85/Human-Centered-AI-Scalable-Interactive-Tools-for-Interpretation-and-Attribution-26-320.jpg)
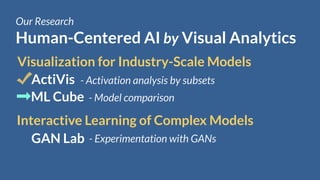
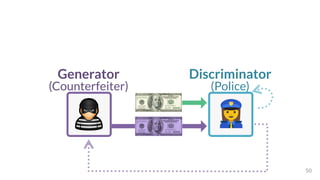
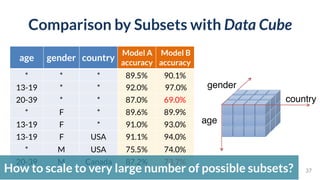
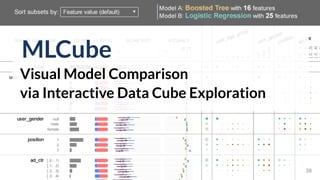
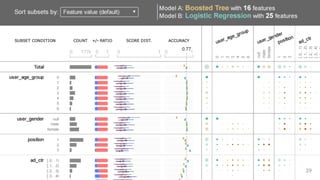
![ML Cube
Interactive Model Comparison
Deployed by[Kahng, et al. HILDA’16]](https://image.slidesharecdn.com/human-centered-ai-polo-chau-190423181122/85/Human-Centered-AI-Scalable-Interactive-Tools-for-Interpretation-and-Attribution-40-320.jpg)
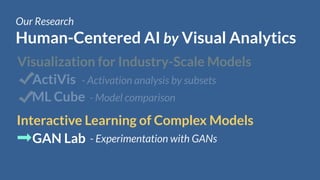
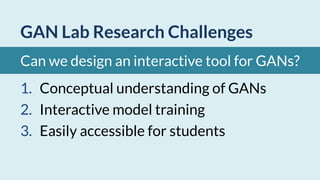
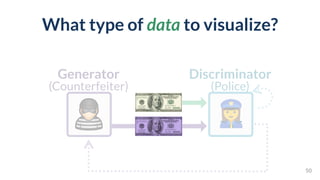
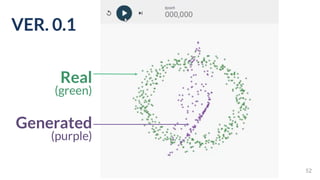
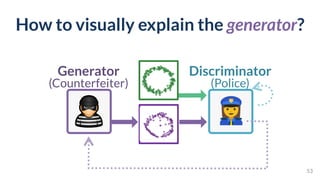
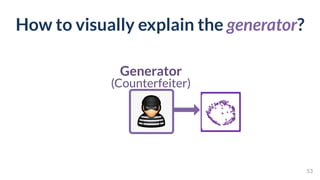
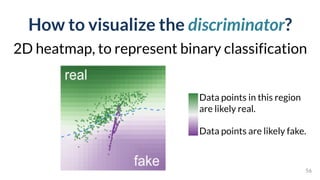
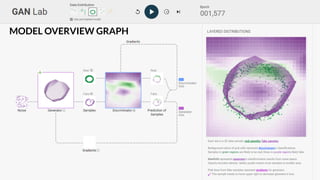
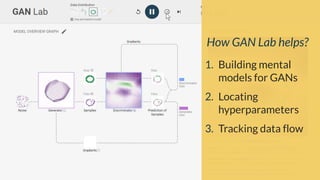
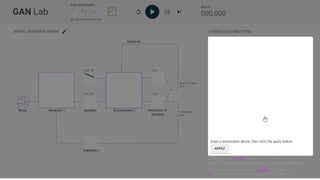
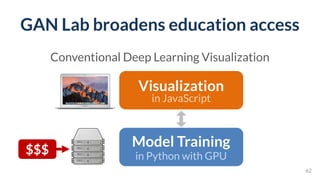
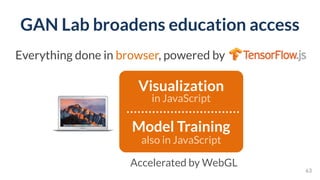
![GAN Lab
Interactive understanding of
complex deep learning models
PAIR | People + AI Research Initiative
[Kahng, et al. IEEE VIS’18]](https://image.slidesharecdn.com/human-centered-ai-polo-chau-190423181122/85/Human-Centered-AI-Scalable-Interactive-Tools-for-Interpretation-and-Attribution-48-320.jpg)
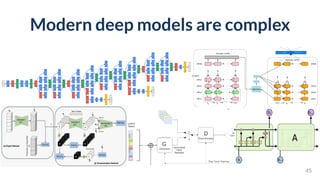
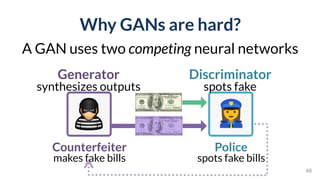
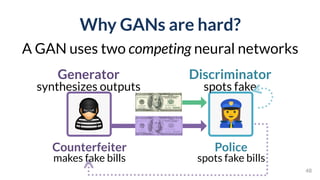
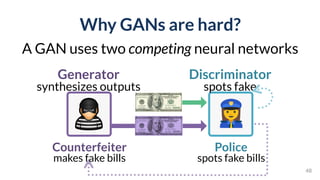
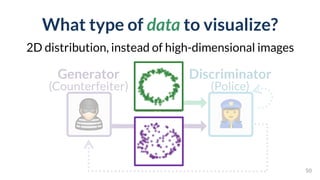
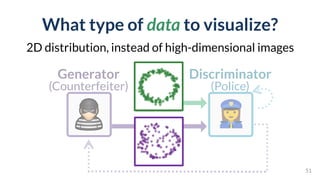
![Generative Adversarial Networks (GANs)
46
“the most interesting idea in the last 10 years in ML”
- Yann LeCun
Face images generated by BEGAN [Berthelot et al., 2017]](https://image.slidesharecdn.com/human-centered-ai-polo-chau-190423181122/85/Human-Centered-AI-Scalable-Interactive-Tools-for-Interpretation-and-Attribution-51-320.jpg)