Downloaded 462 times
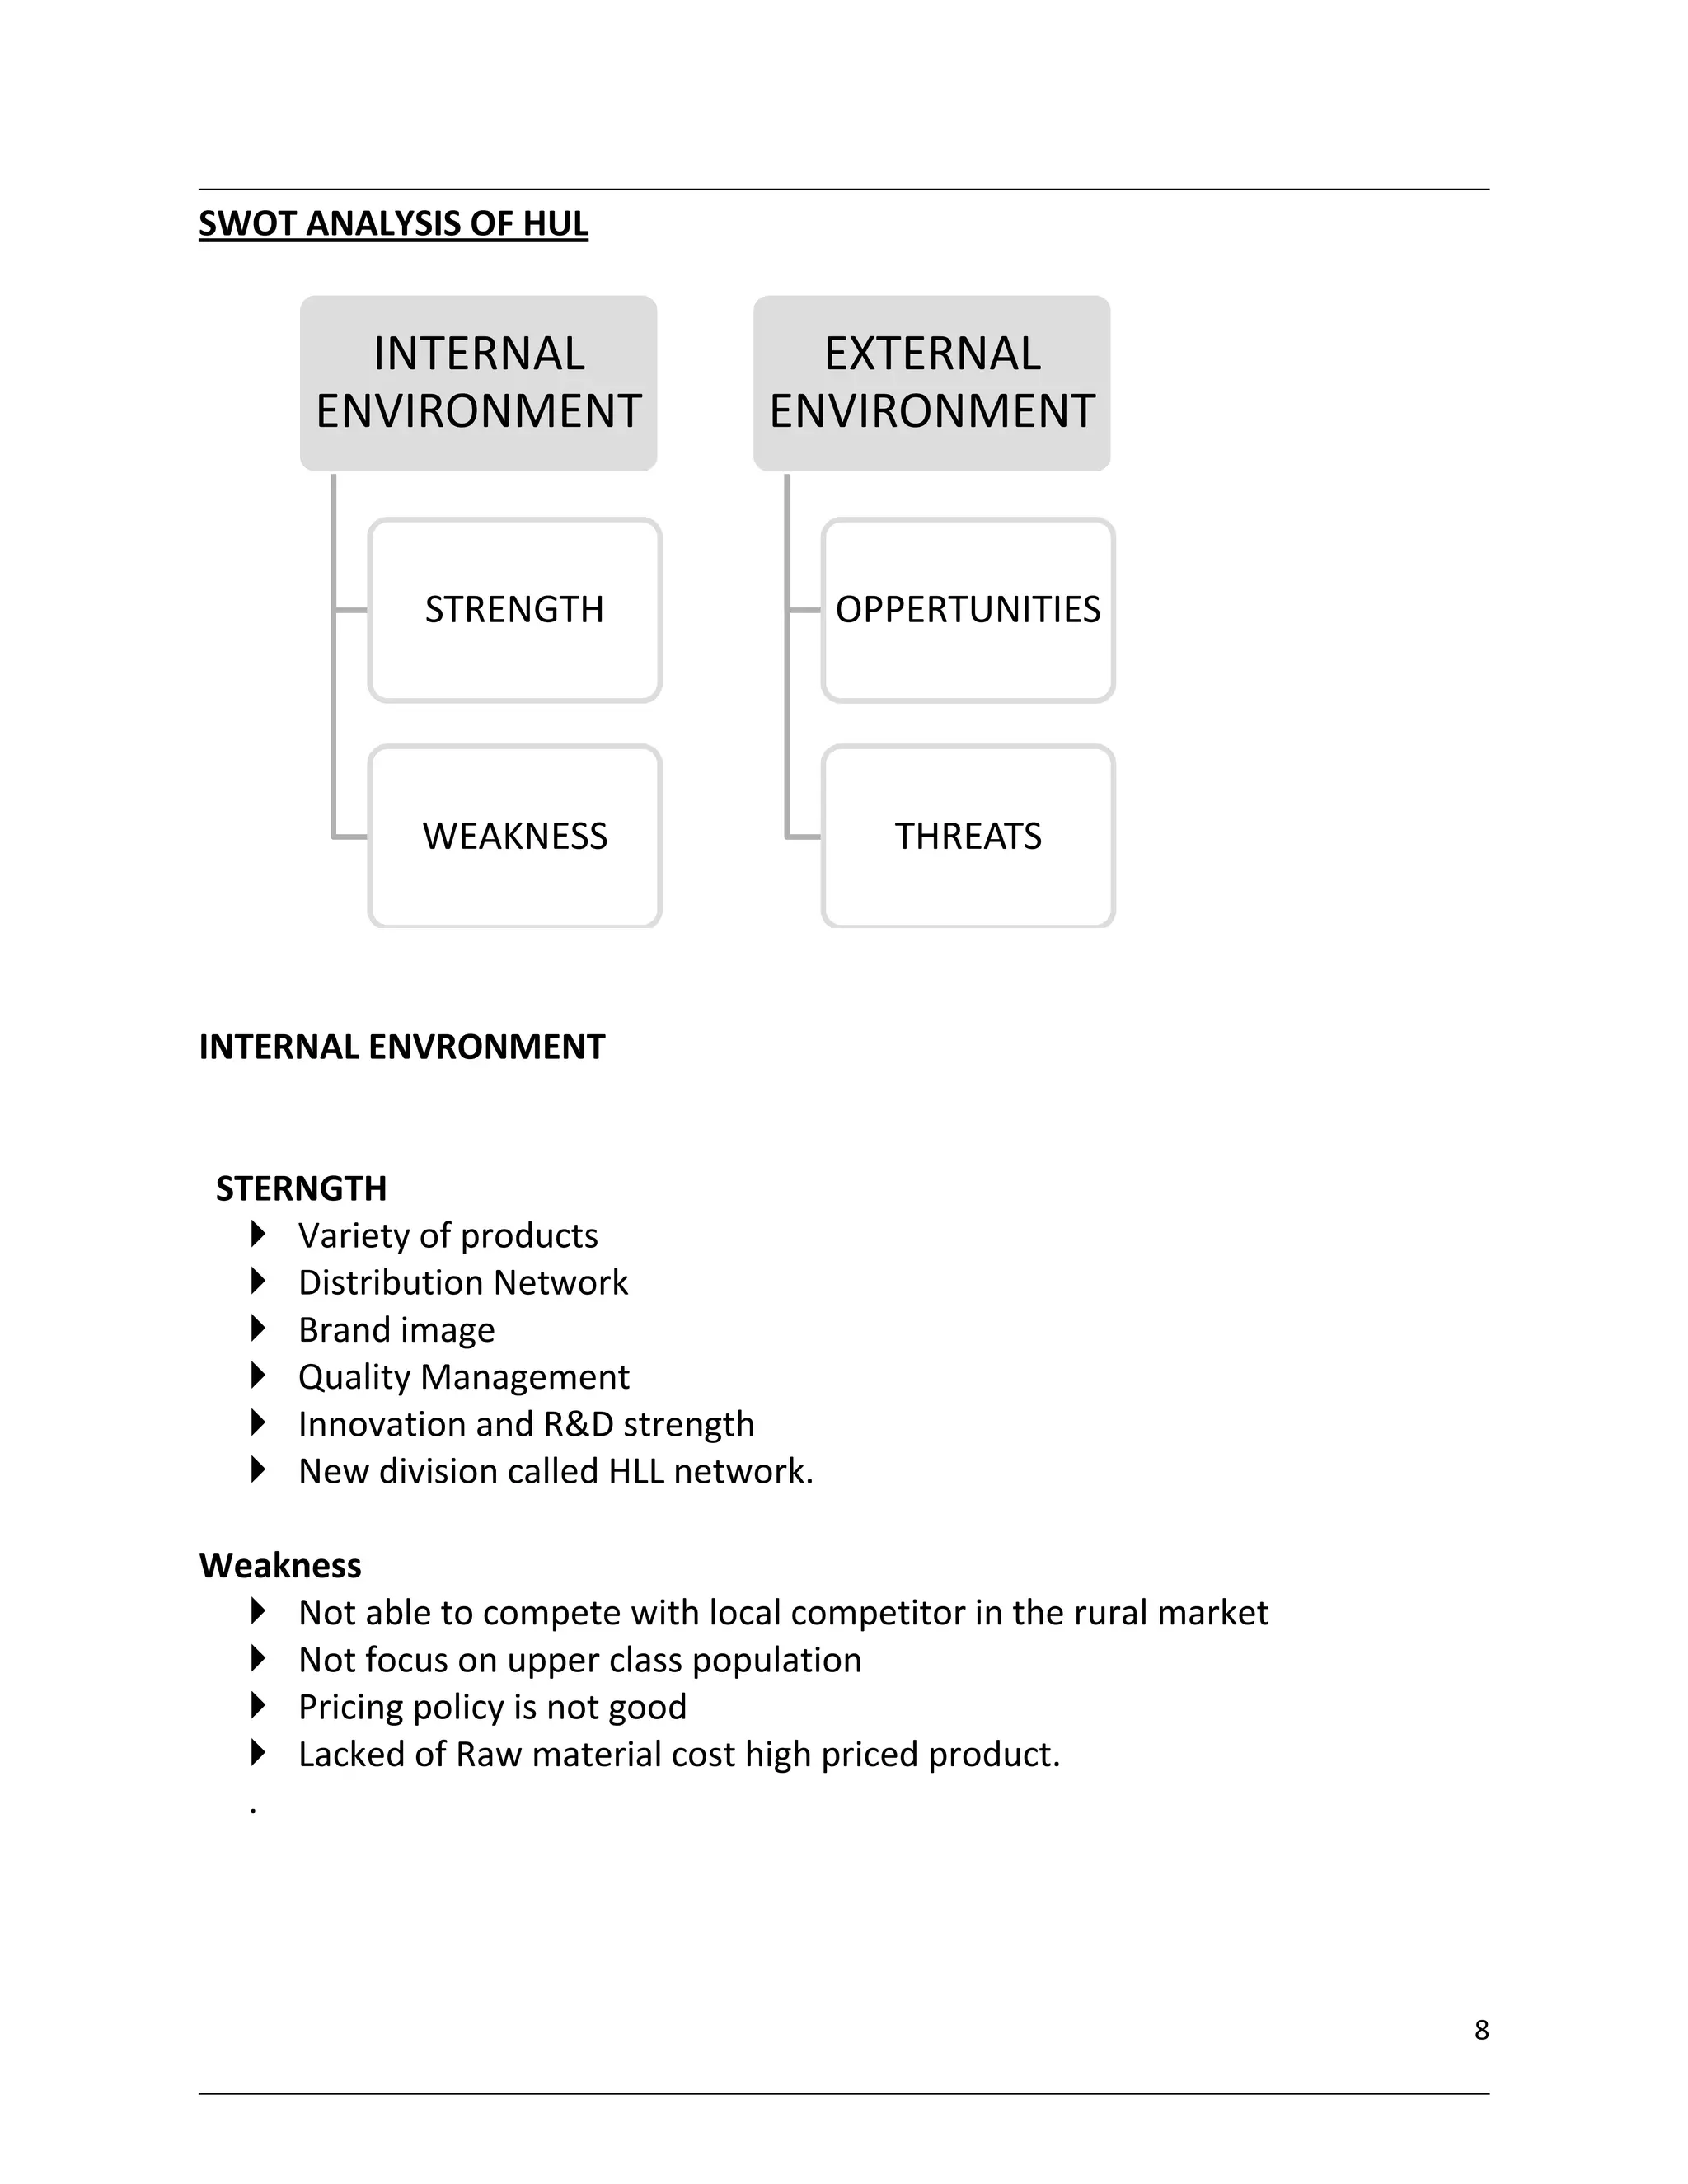

Hindustan Unilever Limited (HUL) is a leading Fast Moving Consumer Goods (FMCG) company in India with a portfolio of brands spanning 20 product categories. HUL has over 35 brands including Lux, Lifebuoy, Surf Excel, Rin, Wheel, Closeup, Lakmé, Dove, Pond's, and Vaseline. The company has over 16,000 employees and annual turnover of around 19,401 crores. HUL's competitors include Procter & Gamble, Nestle, ITC, and Dabur. A SWOT analysis identifies HUL's strengths as its variety of products, distribution network, and brand image, while weaknesses include not focusing on