How to take dynamic data in life cycle inventory from brazilian sugarcane ethanol

Abstract Ethanol derived from sugarcane is the energy source with the highest growth in Brazil over the past 40 years. The explanation can be summarized by its ability to replace fossil fuels with lower emissions and be produced by a renewable raw material with energetic potential eight times higher than gasoline. Studies indicate increased ethanol demand by 2050. The increase in production implies higher environmental interference according to the cultivation time in the field, with the resources used and the local production of sugarcane. The method of Life Cycle Assessment (LCA) is a tool for measuring the performance of a product during its life cycle. However, agricultural or regional factors are dynamic over time and affect its performance in a future evaluation. Thus, this article aims to suggest an inventory methodology life cycle that can represent the dynamic behavior of the determinants of environmental effects in the assessment of ethanol life cycle. The methodology involves principles of Input Output Analysys (IOA) adjusted for regression statistical technique to structure the flows from product system of LCA Keywords: Sugarcane, Dynamic Variables, Inventory Lifecycle, Life Cycle Assessments

Recommended
Recommended
More Related Content
What's hot
What's hot (13)
Viewers also liked
Viewers also liked (9)
Similar to How to take dynamic data in life cycle inventory from brazilian sugarcane ethanol
Similar to How to take dynamic data in life cycle inventory from brazilian sugarcane ethanol (20)
More from eSAT Journals
More from eSAT Journals (20)
Recently uploaded
Recently uploaded (20)
How to take dynamic data in life cycle inventory from brazilian sugarcane ethanol
- 1. IJRET: International Journal of Research in Engineering and Technology eISSN: 2319-1163 | pISSN: 2321-7308 _______________________________________________________________________________________ Volume: 05 Issue: 02 | Feb-2016, Available @ http://www.ijret.org 1 HOW TO TAKE DYNAMIC DATA IN LIFE CYCLE INVENTORY FROM BRAZILIAN SUGARCANE ETHANOL Flavio Numata Junior1 , Cassia Maria Lie Ugaya2 1 Doctoral Student in Mechanical Engineering, Academic Department of Mechanical, UTFPR, Parana, Brazil 2 PhD in Mechanical Engineering, Academic Department of Mechanical, UTFPR, Parana, Brazil Abstract Ethanol derived from sugarcane is the energy source with the highest growth in Brazil over the past 40 years. The explanation can be summarized by its ability to replace fossil fuels with lower emissions and be produced by a renewable raw material with energetic potential eight times higher than gasoline. Studies indicate increased ethanol demand by 2050. The increase in production implies higher environmental interference according to the cultivation time in the field, with the resources used and the local production of sugarcane. The method of Life Cycle Assessment (LCA) is a tool for measuring the performance of a product during its life cycle. However, agricultural or regional factors are dynamic over time and affect its performance in a future evaluation. Thus, this article aims to suggest an inventory methodology life cycle that can represent the dynamic behavior of the determinants of environmental effects in the assessment of ethanol life cycle. The methodology involves principles of Input Output Analysys (IOA) adjusted for regression statistical technique to structure the flows from product system of LCA Keywords: Sugarcane, Dynamic Variables, Inventory Lifecycle, Life Cycle Assessments --------------------------------------------------------------------***---------------------------------------------------------------------- 1. INTRODUCTION LCA is considered the most consistent method of evaluating the environmental performance of products. LCA is a method which operates in industrial ecology, standardized by the International Organization for Standardization, the series of ISO 14040 standard, which aims to support decisions aimed at public policies, to product design, development and improvements in production processes and projects within a environmental perspective (ABNT 2009). In LCA, the term "cradle-to-grave" specifies that all stages of a product's life cycle are being considered, including the steps of use, waste generation and disposal. To "cradle-to- cradle" or "cradle-to-cradle" means the final disposal of the product stage is the process of recycling. Or, the "cradle-to- gate", extends from obtaining the raw materials to product manufacturing. Basically, the LCA comprises performing steps (ABNT 2009): • Definition of Purpose and Scope: The purpose of the definition should include the intended purpose and contain all the aspects considered relevant. The scope refers to the applicability of the study, ie where the data will come and where the results are applied. At this stage some considerations should be taken, such as: the product system to be evaluated, the definition of system boundaries, the definition of process units, the establishment of the system of functional unit and possible assumptions and limitations. • The inventory analysis refers to data collection and calculation procedures. The inventory analysis steps include: preparation for data collection, refinement of system boundaries, determining the procedures for calculation and allocation procedures. • The impact assessment: should consist of at least the followingelements: selection and definition of the categories: where the major focus of environmental issues, method selection and impact assessment categories are identified. Rating: where the inventory data is sorted and grouped in various selected categories. Characterization: where the inventory data assigned to a particular category are modeled so that the results can be expressed as a numerical indicator for that category As noted, the LCA method has a hierarchical structure of data composition to measure the environmental effects. Nevertheless, this systematization complicates the organization of data, especially in the data inventory phase. This step is complicated by the data collection difficulties for analysis and quantification of the resources that are critical in the generation of environmental effects, which are at times, certain information is unavailable. According to ISO 2001 (2001) the uncertainty of LCA information must be worked systematically to minimize the degree of uncertainty generated by the various factors that can influence the quality of the results of this analysis Lifecycle (ICV) and affect the scope of the LCA study. Studies have explored the origin of uncertainty (Huijbregts 1998; Weidema et al 2003), summarized in the table below:
- 2. IJRET: International Journal of Research in Engineering and Technology eISSN: 2319-1163 | pISSN: 2321-7308 _______________________________________________________________________________________ Volume: 05 Issue: 02 | Feb-2016, Available @ http://www.ijret.org 2 Table 1: Data Uncertainties Taxonomy Sources: Bjorklund (2002); Heijungs and Huijbregts (2004); Huijbregts (1998b); Huijbregts et al (2001); Huijbregts et al (2003); Notten and Petrie (2003); Steen (1997); Von Bahr and Steen (2004), adapted. Uncertainties can be linked both to external factors to the production cycle, being uncontrolled and dynamic; as the internal variables of the product system operates normalized data to be framed in more stabilized environment. Because of the variety of interactions between processes and production technologies, the systematization of information can become very complex, requiring a finely tuned depuration concepts and data to consider environmentally relevant variables. Therefore, the uncertainty of the data may affect the LCA results can be observed in the relationship between the nature of the data uncertainty with interference on the assessments made: Table 2: Relationship between inventory data and uncertainty influence on ACV Source of Incertainty Impacts generated in LCA Uncertainty of parameters Imprecision of emission data, lack of parameter or evaluation period Variability of uncertainty No consideration of regional, temporal or technological characteristics in the evaluation Evaluation model Not representative modeling of product behaviour in the life cycle Source: by author Thus, it notes the importance of the inventory data to evaluate environmental performance. The inventory is intended to identify the amount of raw materials and energy required and all forms of emissions generated during the lifecycle of a process, product, activity or service. The volume of data and their interactions are high, so database and applications are designed to house a variety of information to assist calculations and simulations (Ross et al 2002). Some countries have their own databases, with Germany, Switzerland, Denmark, USA and more recently Japan and the Netherlands. The most consistent database is present in Europe housed in the International Reference Life Cycle Data System (ILCD). Brazilian data are housed in Ecoinvent. Base regarded as one of the most consistent and relevant in the world. For example, the production of ethanol system has records for LCA. Still, how to organize and process the data for the inventory is a difficult task. 2. STUDY AREA To understand the complexity in the construction of the assessment inventory, in Brazil, there are over 100 varieties of sugarcane, specified by Ridesa groups, Sugarcane Technology Center (CTC), Agronomic Institute Camoinas (IAC) and CanaVialis - Monsanto (CanaVialis). Each of the varieties of sugarcane has to do with: • Production environment: soil and climatic characteristics of the site; • Variety of behavior: their adaptation and development Local conditions, therefore, determine the appropriate type of cane to be grown. In addition to natural resources, important inputs for productivity are the nutrients. The sugarcane occupies the third position in the national fertilizer use to improve their productivity (INPI, 2013), leaving behind only soybeans and corn. Other resources used to increase the production come from the waste generated in their own field, with straw, and the plants, with vinasse and filter cake. According to the association of geographic factors, the type of sugar and nutrients, is given the proper way of cultivation and management, and directly related to the time of the crop cycle. Time is a factor in the specification of the data collected for the ICV because it can represent, for example, specific information to minimize the uncertainties of temporal variability. They are adopted three forms of sugarcane cultivation in Brazil, related to the geographical conditions, combined with the use of nutrients and development time (INPI, 2013): • Cane of year; • Cane year and a half; • Cana of winter. Dimension Source Description Data inaccuracy The formand collection tools may interfere with the accuracy of the information Lack of data Product Systems involves many processes, sometimes unavailable at certain time or totally No representative data Using similar processes information may not depict reality the study for having origins or different performances Temporal Certain data are not static and may change over time Geographic Different sites have specific characteristics and can generate different data over time even though it originated from a parameter Technological The technological evolution of products and processes generate data with different performance Type of model The analysis model can not adequately represent the behavior of processes Workframe Structuring in order for data processing can lead to errors of judgment Parameters Variability Evaluation model
- 3. IJRET: International Journal of Research in Engineering and Technology eISSN: 2319-1163 | pISSN: 2321-7308 _______________________________________________________________________________________ Volume: 05 Issue: 02 | Feb-2016, Available @ http://www.ijret.org 3 Each of these types determines direct specific information in the dossiers considered the primary energy flows, ie, the energy inputs required for extraction and production. Even disregarding the indirect contributions, for example, in energy expenditure and equipment operations, one can observe interference from various factors throughout the life cycle. This information is adequate and consistent data to perform the LCA based on an ICV that considers (Weidema and Wesneas, 1996): • data acquisition method (estimation of statistical information); • quantitative data method (mass and energy balance); • evaluation period; • geographical location; • technological level. As for the data evaluation method that provides alignment with the principles of LCA and dynamic (Fava et al 2011). The IOA approaches can be presented by the forms (Miller and Blair 2009): • Traditional: based on analysis of sector industries to economic sector; • Structure of tables: tab on arrays of data inputs and outputs; • Input-output matrices and emissions: insertion of the emission factor for environmental assessment. These elements constitute the systematization of the model, which involves the interdependence between production sites and consumer productive scope. This feature is similar in structure of a product system for ACV. The outflows (outputs) are the result of the transformation of the inflow of funds flows (inputs) from the respective providers. The cycle involves the following materials and energy transformations with connections between each step and its products. The mathematical structure of an entry-exit system consists of a relationship with unknowns data sectors or processes involved. The system dynamics is present in accordance with the principles of Sterman (2001): • Temporal variation: the time horizon shows changes in state variables of a system; • Relationship between its components: interaction between system elements; • Formation of mesh internal to the system that the coupling between the components can form internal networks in the system; For these characteristics, the model has been applied to study environmental assessments involving resource flows and their emissions (Marques 2002). The IOA method analyzes the relationship between the output production scale (X) processing data (A) and the final demand (f). The analysis is determined by the balance between the products involved (Miller and Blair 2009): = + The equation is composed of the element X which is the final product and the f factor of final demand of resource transformation. The element A, in turn, represents the resources needed to produce the unit of final product. The term A is best known as the technological matrix of the system under assessment, listing the varieties of resources of each sector and the processes involved in producing the final product, highlighting the idea of the resources flow in each respective analysis phase. The initial equation can be reworked considering a relationship between the total and the final demand, obtaining the configuration: – = = ( − ) . This, it presents: I: identity matrix (I - A) -1 : term that relates the productive sectors The term (I - A) -1 is the recognized model of Leontief. This method was developed to evaluate the total composition production unit in relation to the involved resource. The term A is significant for the metric results and often presents difficulties in quantifying the absence of inventory data. This limitation can be circumvented by the inverse matrix of the product system, adopting the inflows and outflows of a certain time to carry out a process (Suh and Huppes 2005). Idea also understood by Lenzen (2007) called for structural analysis model, which also adopts the process flows. According to the number of processes involved, consideration is explained by aggregation (sum) of the flows, in accordance also with the variation that may occur over a period of time. Another way of determining this information, can be made by dividing the total production of the feature in their respective sector by the unitary reference quantity, to get exactly the required amount of production. This procedure helps to solve the problem of inventory data, associating the resources needed by the process (Suh and Huppes 2005). This data is also known for production of technical coefficient (Mattila 2013; Hendrickson et al 2006). In addition to this adaptation, you can rearrange the equation to assess the environmental dimension (Suh and Huppes 2005). This variant fits the model when the magnitude of impacts are associated with the effects of a sector is directly proportional to the output produced (Matilla 2013). To portray the behavior of the process (f) is added to the factor representing environmental discharges (emission factor) at a given time (period) to measure the effects caused to the environment. Thus, the measurement of the effects equation takes the composition: = ( − ) . . .
- 4. IJRET: International Journal of Research in Engineering and Technology eISSN: 2319-1163 | pISSN: 2321-7308 _______________________________________________________________________________________ Volume: 05 Issue: 02 | Feb-2016, Available @ http://www.ijret.org 4 The equation measuring environmental impacts with a combination of the methods of IOA and ACV by incorporation of flow elements in the product model between resources and environmental driver. The use of the emission factor is specific data as the product of the system under review. The time element T represents the evaluation period, determined at annual intervals that concentrates the most significant environmental results of the LCA (Cherubini 2011). Converting the conceptual unknowns IOA method for variables used in LCA assumptions are: ( − ) : result by interaction between e e : volume primary resource, the raw material for processing into ethanol (ton sugarcane) : Unit parameter input use by the resource (raw material) evaluated (input unit / ton sugarcane) : evaluation period (years) : evaluation period (years) is the emission factor (tCO2 / kg resource) With the organization of the influencing factors, it is necessary to structure the product system under review, the agricultural stage of sugarcane, with stakeholders flows in the process. The Inventory database Lifecycle (ICV) of the agricultural phase was rescued from the works of Macedo et al (2008, 2004), Brazilian repository that shows the ICV data of energy flows and emissions from the agricultural phase and industrial ethanol derived from sugarcane. In this research we considered the flows of resources directly linked to processes, ie, the products needed for production at each stage of evaluation. This consideration is aligned with the principles of the IOA method, which was adopted in this research because of the influences acting on the processes through the use of its main features according to the different productive technological routes of fuels (IEA 2012). The agricultural phase has the highest environmental influences on ethanol life cycle (Numata Junior andUgaya 2014; Lisbon et al 2011). In general context, agriculture is responsible for 14% of direct GHG emissions and other 17% through indirect processes and may represent almost a third of anthropogenic total emissions (IPCC 2006). Soil characteristics and applications of corrective inputs and climatic factors, are examples of factors that affect environmental performance. This context fits into a hybrid evaluation by the IOA method in the life cycle of products, the contributions of different factors on the product system Factors that represent the input streams, output and other significant elements of production are taken into account as the process parameters and emissions that would form the technological matrix system (Guinée et al 2011); and may be made by data (Huang et al 2011): • Coefficient of importance factor (w) • Ratio of Factor (s) feature (s) in (s) method (s) for standardization of data in the system (v) • Resource usage coefficient (k) According Mattila (2013) rating the environmental impact can be measured by the product of these variables, i.e. valued by the product of representative processes factors. In the context of this study, the input and output streams in agricultural phase are shown in Figure1: Fig -1:Inflows and output of agricultural production phase of sugarcane Sugarcane (TC) Forecast sugarcane (TC) Fertilizer application (kg Fert / TC) Emission factor resources (kg CO2 / kg resource) Timeline frontier Input flux Output flux Vinasse application (kg Fert / TC) Straw application (kg Fert / TC) Filtre cake application (kg Fert / TC)
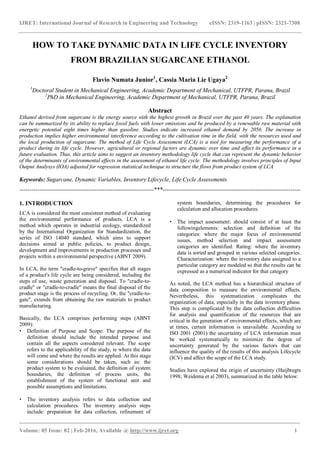
- 5. IJRET: International Journal of Research in Engineering and Technology eISSN: 2319-1163 | pISSN: 2321-7308 _______________________________________________________________________________________ Volume: 05 Issue: 02 | Feb-2016, Available @ http://www.ijret.org 5 The method stroke evaluation focuses on the environmental performance in the system according to the relations between products and processes and their effects generated. The flow elements are considered mass applied fertilizers (input) to meet the expected growing demand for sugarcane (output). The flow elements relate to the principles of IOA, as well as the representation adopted to the mathematical entity state space. Following a time reference, the relationship between the demand for sugarcane and productivity is linked to your planting season. To combine the best conditions for planting in Brazil crops are performed in the periods from May to November known as the "winter of cane", from October to November as the "year of cane" and from January to April as the " year cane and a half "(INPI 2013, p.5). In addition to link environmental factors to periods of cultivation, the element that emphasizes the consideration of the forms of cultivation to the temporal relationship is your relationship with fertilizer applications. For example, research conducted in São Paulo year and a half of sugar can be reduced by up to 39% less fertilizer compared to the year of sugarcane due to productivity afforded by climate (INPI 2009) The fertilizer application parameter is related to the types of sugarcane cultivation cycles (Macedo 2004) in the following order: • Caneof winter (May to November): 5.1 kg fertilizer / tc • Caneof year (October-November): 5.5 kg fertilizer / tc • Cane of year and a half (January-April): 4.8 kg fertilizer / tc The culture of the adopted typology is related to sugarcane cutting period and also makes it possible to identify the amount of investments made in the evaluation period of the life cycle. Adopting the temporal reference of a year, the method (cultivation time units fit in a coefficient) in years for each of the types of crops, analyzed as follows: • Cane of winter (May to November): 0.5 • Cane of year (October-November): 1.0 • Cane of year and a half (January-April): 1.5 These factors must be considered according to the type of cultivation of sugar were also selected in the previous condition. Consideration of the growing season over the demand for sugarcane possible to identify the volume of emissions generated as the fertilizer load applied by the adopted type of crop (INPI 2011). This form of consideration helps to normalize the data use of fertilizers by the projection occurs over long periods, allowing minimize deviations in the results of evaluation. In this sense, we see a dynamic nature embedded in the behavior of variables. This feature is evident with the rise of consumption and productivity of these variables over 20 years, from 1990 to 2010 (ANDA and IPEADATA 2011; BNDES and CGEE 2008) illustrated in chart 1: Chart -1:Fertilizer consumption and productivity of sugarcane for 1990-2010 Sources: ANDA and IPEADATA 2011; BNDES and CGEE 2008. 0,00 100,00 200,00 300,00 400,00 500,00 600,00 700,00 800,00 0 200000 400000 600000 800000 1000000 1200000 1400000 1600000 1800000 Fertilizantes Cana-de-açúcar Cana de açucar (Mt) Fertilizantes (t) 1990 1995 2000 2005 2010 Sugarcane Sugarcane Fertilizer Fertilizer
- 6. IJRET: International Journal of Research in Engineering and Technology eISSN: 2319-1163 | pISSN: 2321-7308 _______________________________________________________________________________________ Volume: 05 Issue: 02 | Feb-2016, Available @ http://www.ijret.org 6 It is observed that the dynamics present in the flow of input variables and outputs is housed in the temporal vector. Taking the same principle, the estimated future consumption of fertilizers for productivity sugarcane has the following projections: Chart -2:forecast consumer fertilizers and productivity of sugarcane. Sources: MME 2014; BNDES 2011. Note that the future projection is similar in behavior to the history presented in the twentieth chart with estimated future linked to the growth in demand for sugarcane as an alternative source of energy (FIESP 2013; MME 2014). This fact also has a similar projection, with increasing estimated consumption by 2050 (FAO 2012). As noted future projections must match the historical setting by using links on a variable of interest (consumption of fertilizers, for example) for variables that can influence it, identifying situations to evaluate different effects produced, featuring a form of regression-based forecasting (Makridakis andWheelwright; Hyndman 1998). Therefore, and in accordance with the principles of forecasting the future model evaluation can be adjusted by linear consideration, by means of a line in accordance with the set of observations. This procedure conforms to the fundamentals proposed by Gauss and Legendre approach with use of a coefficient when the data are unknown (future) to minimize distortion. Application of the least squares method is suitable for the evaluation because of waste (unknown values) have Gaussian distribution, and the Central Limit Theorem indicate normal distribution to evaluate the data with use of linear algebra. Following the projections presented by the straight line equation, y = a + bx, the coefficients a and b are the parameters of the mathematical model and x and y are ancoradores points system; having proportional adjustment factor to the slope present in the equation of the line, traditionally represented by (Makridakis and Wheelwright; Hyndman 1998): = + : dependent variable; : independent variable; : coeficient linear; : coeficient angular. So if you can admit: = + ; = + ... or how many observations necessary for time and related consumption. The minimization of the variation △ Y (minimization of deviations squared) allows to identify a consistent value y according to the projected estimates: ∑ ( − − ) taking the derivative of equation regarding the coefficients have: and : ∑ ( − − ) and ∑ ( − − ), And after making a difference between them to obtain the coefficient b, which represents the adjustment of the linear approximation performed. = n (∑X. Y) − (∑ )(∑ ) (∑ ) − (∑ ) ) Following the theoretical assumptions presented obtains the slope (b) of 0,1954 adjustment factor corresponding to the feature behavior assessed over time to be inserted in ICV. According to previous exposure to valuation of environmental effects can be measured by the composition of the required production demand of sugarcane, the period 0 1E+09 2E+09 3E+09 4E+09 5E+09 6E+09 7E+09 8E+09 2020 2030 2040 2050 Sugarcane(ton) Cane of winter Cane of year Cane of year and half
- 7. IJRET: International Journal of Research in Engineering and Technology eISSN: 2319-1163 | pISSN: 2321-7308 _______________________________________________________________________________________ Volume: 05 Issue: 02 | Feb-2016, Available @ http://www.ijret.org 7 (interval) of estimated time, the type of crop, the emission factor and the adjustment fator. Therefore: = ∆ 0,1954 Variables: : Parameter Unit application of fertilizers for each type of sugar (kg fert/tc) forecast sugarcane (tc) ∆ : Time interval, expressed in decades (years) : temporal type parameter of the sugar cane industry (years); : emission factor (kg CO2 eq/fert) The evaluation of the agricultural phase will have two forms of consideration, one facing the ethanol 1G and one for the 2G. Although this step is concentrated in the field, your product, sugarcane and its derivatives, co-products, take different destinations in each generation. In 1G the process of cultivation involves all traditional activities, soil preparation and method of planting in accordance with climatic conditions of each locality, maintaining much of the straw of sugarcane in the fields 2G ethanol also known as cellulosic ethanol (UNICA 2009), is generated from the hydrolysis of straw. The straw that was previously filed with the field for tillage is replaced allocation for power plants, interfering with emissions in the agricultural phase.To perform the LCA of agricultural stage of sugarcane was considered the next system product and its process flows (direct sources): Fig -2:System product of the agricultural phase. For analysis, we considered the principles of IOA method associated with LCA to take into account factors of different nature, and that vary over time, it is a forward-looking assessment. It is considered only the flows of resources that directly influence the outcome of cases, to recognize the contributions at each stage of the life cycle. It was also considered the references of the IPCC (2006) on the emissions caused by fertilizer and organic compounds. The resources and data considered the flows of inputs and outputs are: Table 2: Flux from agricultural phase Sources: EPE, 2014; Hassuani 2005; Macedo and Seabra 2012; Neto et al 2015; Veiga et al 2006. The evaluation of this phase is very important because it is the most significant emissions in the life cycle of ethanol, and fertilizers, the largest contribution of the variable effects. The co-products have also generated their contribution through the straw, the filter cake and vinasse (Lisbon et al 2011). These residues processes formed by organic compounds are used in the management of the soil for treatment and recovery for the next harvest, but are also responsible for methane (CH4), nitrous oxide (N2O) along with the fertilizer synthetic origin (IPCC 2007). To identify future values straw application in the field, broke first, the projected data for allocation of straw to the mills, respectively, estimated at 14.9% in 2020 and 20.0% in 2030 (Walter and Ensinas 2010; Dias et al 2014; UNICA 2010) and the years following estimated second National Energy Resources Volume (un/tc) Resources Volume (tc) Fertilizer to cane of winter 5,1 Sugarcane Forecast Fertilizer to cane of year 5,5 Fertilizer to cane of year and half 4,8 Straw (total) 30% Straw Forecast Vinasse 150 m3 Filter of cake 30 kg Output flowsInput flows Agricultural phase
- 8. IJRET: International Journal of Research in Engineering and Technology eISSN: 2319-1163 | pISSN: 2321-7308 _______________________________________________________________________________________ Volume: 05 Issue: 02 | Feb-2016, Available @ http://www.ijret.org 8 Plan - Energy Demand in 2050 (EPE 2014) and the BNDES survey - Industry / 41 on Biofuels (Milanez et al 2014). Next, we considered the processes for the preparation of straw in order to identify how much can be maintained in the field and, from that, as may be directed to the distilleries. Basically, it was considered the following relationship between processes to make up the total volume of straw: This straw volume in each section of the "Preparatory operations + field + target destination plant = total straw generated" Straw preparation operations, consider the payment of straw, compaction / baling and final cleaning, each operation, an average loss of 5%, representing about 15% of the total volume (EMBRAPA 2012; IPNI 2013). The projected use of straw in power plants are 40% in 2040 and 60% in 2050 (EPE 2014; Milanez et al 2014; CNI 2012). Given these estimates and process losses can be predicted approximately 45% in 2040 and 25% in 2050 straw used in the field. With the maintenance of the straw in the field, you reinsert this product again the process of cultivation form that can reduce emissions from burning and use of fertilizers. The stillage has no more significant interference in soil management in relation to possible environmental effects. The vinasse is used as organic fertilizer for fertigation of growing areas for its potassium supply and an average rate of 150 m3 per hectare (Neto et al 2015)vinasse has applications combined with straw, with almost no interference in the breakdown of straw (Oliveira et al 1999; Zotelli 2012). About 81% to 100% of vinasse demineralization occurs in two years (Neto et al 2015). The filter cake can present 1.8% of phosphorus in its composition and about 70% humidity, so it has proper application for the renewal of the plantation (EMBRAPA 2011). Its application rate varies between 15-40 tons per hectare of cultivated area (Neto et al 2015), according to the need of renewal or application throughout acreage or between the lines of sugarcane ratoon. As to its use in the field, the application occurs on the second crop cycle of sugarcane. Decomposition occurs after three years of use generating effect until one year after the deposition of the substance (Rocha 2013; Signor et al 2014). Thus, the emission period will be extended for another three years of the obtained crop of sugarcane. With the exhibits displayed, one can prepare the contribution metric of each of byproducts on the environmental effects advantage of the following relation: variable (input feature), analysis time interval cultivation characterization factor and the adjustment coefficient the temporal behavior of the resource. The vinassewas considered as another input feature, with an average application of 150 m3 per hectare of cultivated area (Neto et al 2015). The projection area planted following the estimates of the National Energy Plan 2050 (EPE 2014). The filter cake was also seen in the input stream to the value of 20 kg / tc (Neto et al 2015). The applications of filter cake ranging from 15-30 kg / tc, as the research involves the South and Southeast of the country, places that offer the best growing conditions of sugarcane, we adopted the value of 20 kg / tc (Neto et al 2015). In addition to the considerations on flows of inputs and outputs, it is appropriate to take into account the analysis period. Time may be an important factor if any impact on the process, for example, by impacts or by extension technological developments. If any transition production methods or input new products possibly there will be a different flow of resources. Transformations can be seen through the relationship between the flows of inputs and outputs of the product system that cause environmental effects. (Beloin-Saint-Pierre, Heijungs and Le Blanc 2014; Collet et al 2014). To carry out the LCA of ethanol with these characteristics, it is necessary to consider their production cycles. The time scale is associated with the range of forms of cultivation, that is, the growing season of winter cane, year or year and a half, with the period under review, to identify the environmental performance of a production cycle. The end of the production cycle does not determine the order of discharges made by the resources. Basically, emissions are generated according to the composition of the substance (content of compound), decomposers elements (macro and micro) and soil and climatic conditions of the location (Rocha 2013). They were considered research conducted in the same region considered in this thesis to identify behavioral factors of the participants resources at this stage. The importance of considering an element of characterization is justified by considerations of a technical coefficient to ensure more consistent results analysis (Huang; Keisler andLinkov, 2011). The representative coefficients of degradation were adopted: • Straw: 0.7007 (Zotelli2012) • Vinasse: 0.4500 (Carmo et al, 2012) • Filter cake: 0.8100 (Rocha 2013) Considering the previous exhibitions, the equation that houses the inventory of elements for dynamic measurement of environmental effects generated by the straw is given by: = 0,25 ∆ + 2 0,7007 Where: : Parameter straw on a dry matter 140 kgms : Emission fator from straw: 6,163 kg CO2/kg Bagasse coefficient generated per ton of cane: 0,25 Straw coefficient decomposition behavior: 0,7007 Equation for vinasse: = 150 ∆ + 2 0,4500 Where: : Plantation area in hectare (ha) Coefficent application vinasse per hectare area: 150 m3
- 9. IJRET: International Journal of Research in Engineering and Technology eISSN: 2319-1163 | pISSN: 2321-7308 _______________________________________________________________________________________ Volume: 05 Issue: 02 | Feb-2016, Available @ http://www.ijret.org 9 : Emission fator from vinasse: 5,698 kg CO2 /kg Vinasse coefficient decomposition behavior: 0,4500 Equation for filter cake: = 20 ∆ + 3 0,8100 Where: Filter cake application coefficient per ton of cane: 20 kg : Emission fator from filter cake: 5,698 kg CO2 /kg Filter cake coefficient decomposition behavior: 0,8100 Gathering the metrics for each stream, we can obtain the global equation: = ∆ 0,1954 + 0,25 ∆ + 2 0,700 + 150 ∆ + 2 0,4500 + 20 ∆ + 3 0,8100 3. CONCLUSIONS The phase of the inventory involves the collection of data, so it is considered one of the most complex stages of LCA. The amounts of raw materials, energy resources and depend on each type of process, product or service, according to the propositions of standard ISO 14044 (ABNT 2009). In this sense, the metrics meet the regulatory requirements regarding: • Data collection: consistency of specific and relevant data with respect to your exact process and drive; • Data: According to the mass balance and energy; • Relationships: consider the flows of inputs and outputs according to the physical properties. The modeling of the processes, the metrics have alignments as (Frischknecht et al 2007): • Processes: takes into account the industrial infrastructure of the type of equipment and its workers; • Borders: the evaluation is bounded from the "cradle to gate", considering the agricultural and industrial phases; • Time: the differential valuation model is consideration of the time factor that allows portray the environmental effects dynamically. Regarding elementary streams are considered according to (Frischknecht et al 2007): • Resources: considers the determinants of environmental effects; • Energy: takes into account the form of energy consumed at each stage of the life cycle, as a renewable source of energy. • Thermodynamics: considered to be the energy exchanges and PCI resources used The inventory model meets the requirements of standardization and systematization of data to properly assess the environmental performance of sugarcane in prospective assessment of conditions. This purpose is very relevant to a renewable energy source that has grown extensively over the years in Brazil and in other countries for its clean energy potential. ACKNOWLEDGEMENT The authors wish to acknowledge contribuction of colleaues from research group of LCA from Federal Technological University of Paraná – UTFPR. REFERENCES [1] AGÊNCIA NACIONAL DE ENERGIA ELETRICA (ANEEL). Rules Resolution No. 235/2006: establishes the requirements for qualifying cogeneration thermal power plants and arrangements. Available in: http://www.aneel.gov.br/cedoc/ren2006235.pdf. Accessed on October 25, 2015. [2] BANCO NACIONAL DE DESENVOLVIMENTO ECONÔMICO E SOCIAL (BNDES). Research forecast. Brasília: BNDES, 2011. [3] BOUWMAN, A. F.; BOUMANS, L. J. M. Modeling global anual N2O and NO emissions from fertilized fields. Global biogeochemical cycles, vol. 16, n.4, 1080, doi. 10.1029/2001GB001812, 2002. [4] CARMO, J.B.; FILOSO, S.; ZOTELLI, L.C.; SOUSA NETO, E.R.; PITOMBO, L.M.; DUARTE-NETO, P.J.; VARGAS, V.P.; ANDRADE, C.A.; GAVA, G.J.C.; ROSSETTO, R.; CANTARELLA, H.; ELIA NETO, A.; MARTINELLI, L.A. Infield greenhouse gas emissions from sugarcane soils in Brazil: effects from synthetic and organic fertilizer application and crop trash accumulation. GCB Bioenergy, v.5, p.267-280, 2013. http://dx.doi.org/10.1111/j.1757- 1707.2012.01199.x [5] CENTRO DE GESTÃO E ESTUDOS ESTRATÉGICOS (CGEE). Bioethanol fuel: an opportunity for Brazil. Brasília: CGEE, 2009. [6] DIAS, M. O. S.; JUNQUEIRA, T. L.; CAVALETT, O.; MACIEL FILHO, R.; BONOMI, A. Integrated first and second generation ethanol production from sugarcane. ChemicalEngineeringTransactions. AIDIC. doi 10.3303/CET1437075. Vol.37, 2014. [7] EMPRESA BRASILEIRA DE PESQUISA AGROPECUÁRIA (EMBRAPA). Mitigation of greenhouse gas emissions. Use of ethanol from sugarcane produced in Brazil. EmbrapaAgrobiologia. Rio de Janeiro: EMBRAPA/RJ, 2009. [8] FAVA, J. AdaptativeAproaches. In: UNITED NATIONS ENVIRONMENT PROGRAMME (UNEP). Global guidance principles for Life Cycle Assessment Databases: A basis for greener processes and products. [S. I.]: UNEP/SETAC Life Cycle Initiative, 2011. cap. 5. p. 98-105. [9] HAMELINK, C. N. ET AL. Etanol from lignocellulosic biomass: Techno-economic performance in short, middle and long term. BiomassandBioenergy 28 (2005), 384-410. Disponível em: http://www.star- info/pedf/ndocs/transport/bioethanol_biomass.pdf Acesso em 4 set 2015.
- 10. IJRET: International Journal of Research in Engineering and Technology eISSN: 2319-1163 | pISSN: 2321-7308 _______________________________________________________________________________________ Volume: 05 Issue: 02 | Feb-2016, Available @ http://www.ijret.org 10 [10]HASSUANI, S. J.; LEAL, M. R. L. V.; MACEDO, I. C. Biomass power generation – sugar cane bagasse and trash. Piracicaba: PNUD/CTC, 2005. [11]HERBST, A.; TORO, F.; REITZE, F.; JOCHEM, E. Introduction to energy systems modelling. Swiss Journal of Economics and Statistics, vol. 148 (2), 2012. [12]INTERNATIONAL PLANT NUTRITION INSTITUTE (INPI). Rational use of fertilizers and the cultivation of sugarcane. Agricultural information, n. 127, september/2009. [13]INTERGOVERNMENTAL PANEL ON CLIMATE CHANGE (IPCC). Organization for Economic Cooperation and Development (OCDE) and International Energy Agency (IEA). Revised 1996 IPCC, Guidelines for National Greenhouse Gas Inventories, Org. for Econ. Coop. Dev., Paris, 1997. [14]INSTITUTO DE PESQUISAS ECONÔMICAS APLICADA (IPEA). Basic macroeconomic data IPEADATA. Brasília: IPEA. Disponível em: http://www.ipeadata.gov.br Acesso em 10 jun 2015. [15]DO CARMO, J. B.; FILOSO, S. ZOTELLI, L. C.; SOUZA NETO, E. R.; PITOMBO, L. M.; DUARTE NETO, P; J;; VARGAS, V. P.; ANDRADE, C. A.; GAVA, G, J. C.; ROSSETTO, R.; CANTARELLA, H.; NETO, A. E.; MARTINELLI, L. A. Infield greenhouse gas emissions from sugarcane soils in Brazil: effects from synthetic and organic fertilizer application and crop trash accumulation. GCB Bioenergy (2013) 5, 257- 280. doi: 10.1111/j.1757-1707.2012.01199.x [16]HUANG, I. B.; KEISLER, J.; LINKOV, I. Multi- criteria decision analysis in environmental sciences: ten years of applications and trends. Sci. Total environ. 409, 3578-3594, 2011. [17]HUIJBREGTS, M. A. J. Application of Uncertainty and Variability in LCA - Part I: A General Framework for the Analysis of Uncertainty and Variability in Life Cycle Assessment. International Journal of Life Cycle Assessment 3 (5): 273-280. 1998a. [18]HUIJBREGTS, M. A. J. Application of Uncertainty and Variability in LCA - Part II: Dealing with Parameter Uncertainty and Uncertainty due to Choices in Life Cycle Assessment. International Journal of Life Cycle Assessment 3 (6): 35-42. 1998b. [19]LENZEN, M. Structural path analysis of ecosystem networks. Ecol Model 200 (3-4); 334-342, 2007. [20]LISBOA, C. C.; BUTTERBACH-BAHL, K.; MAUDER, M.; KIESE, R. Bioethanol production from sugarcane and emissions of greenhouses gases – Known and unknowns. Global ChangeBiologyBioenergy, Washington, v. 3, p. 277-292, 2011. [21]MACEDO, I. C.; LEAL; M. R. L. V.; Evolução tecnológica dos sistemas de geração de energia nas usinas de açúcar e álcool. Biomassa&Energia, v.1; n.3; p. 245-253, 2004. [22]MAKRIDAKIS, S.; WHEELWRIGHT, S.; HYNDMAN,R. Forecasting: methods and application. 3o ed. New York John Wiley & Sons, 1998. [23]MATTILA, T. J. Input-output analysis of the networks of production, consumption and environmental destruction in Finland. Doctoral dissertation. Department of Mathematics and Systems Analysis, Aalto Unniversity School of Science. Helsinki: UnigrafiaOy, 2013. [24]MARQUES, J. J. L. Análise Input-Output como instrumento de avaliação dos impactos das medidas de redução de emissões de CO2. Master's Thesis in Innovation and Development Policy. University of Aveiro, Department of Environment and Planning, 2002. [25]MILLER, R. E.; BLAIR, P. D. Input-Output Analysis - Foundations and Extensions. Second Edition, Cambridge: University Press, 2009. [26]OLIVEIRA, B. G.; CARVALHO, J. L. N.; CERRI, C. E. P.; CERRI, C. C.; FEIGL, B. J. Soil greenhouse gas fluxes from vinasse application in Brazilian sugarcane áreas. Geoderma, v. 200-201, p.77-84, 2013. http://dx.doi.org/10.1016/j.geoderma.2013.02.005. [27]SIGNOR, D.; PISSIONI, L. L. M.; CERRI, C. E. P. Effect of greenhouse gas emissions by deposition of straw sugarcane on the ground. Bragantia: Campinas, 2014. [28]SORDI; R. A.; MANECHINI, C. Utilization of trash: a view from the agronomic and industrial perspective. Scientia Agricola, v.70, p.1-2, 2013. http://dx.doi.org/10.1590/S0103-90162013000500002. [29]VASHOSAZ, HASSAN, Application Dynamic System in environmental impact assessment method-case study: The man-made lake in Tehran. Singapoore: IACSIT, 2011. [30]VITTI, A. C.; TRIVELIN, P. C. O.; CANTARELLA, H.; FRANCO, H. C. J.; FARONI, C. E.; OTTO, R.; TRIVELIN, M. O.; TOVAJAR, J. G. Mineralization of straw and root growth of sugarcane related to nitrogen fertilization at planting. Journal of Soil Science, v.32, p.2757-2762, 2008. [31]RENEWABLE POLICY NETWORK FOR THE 21 CENTURY (REN21). Renewables Global Futures Report 2013. REN: Paris, 2013. [32]SEABRA, J. E. A.; MACEDO, I. C. Comparative analysis for power generation and ethanol production from sugarcane residual biomass in Brazil. Energy Policy 39 (2011), 421-428. [33]UNIÃO DA INDÚSTRIA DA CANA-DE-AÇÚCAR (UNICA). Ethanol and bioelectricity - of sugarcane in the future energy matrix. São Paulo: Burti, 2009. [34]WALTER, A.; ENSINAS, A. V. Combined production of second-generation biofuels and electricity from sugarcane residues. Energy 35, 874-879, 2010. [35]WEIDEMA, B. P., FRESS, N., PETERSEN, E. H., IGAARD, H. Reducing Uncertainty in LCI - Developing a Data Collection Strategy. Environmental Project No. 862. Danish Environmental Protection Agency, Danish Ministry of the Environment, Ramboll, Denmark, 71 p. 2003. [36]ZOTELLI, L. C. Straw and stillage: CO2, N2O and CH4 in soil with sugarcane. Agronomy Institute (IAC). Dissertation in Tropical and Subtropical Agriculture. Campinas: IAC, 2012.