This document provides a comprehensive guide on preparing scientific research questionnaires and conducting statistical analysis using SPSS. It details the importance of clear objectives, various types of questions, effective design, and the use of statistical software for data analysis. The guidance includes specific procedures for questionnaire construction, data collection, and the use of SPSS for statistical processing, emphasizing best practices in research methodologies.

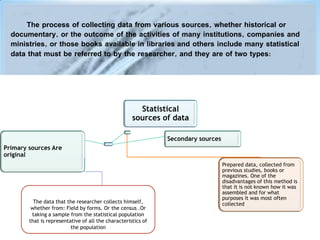
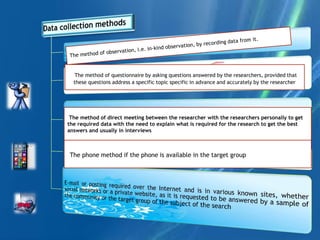


![Dissertation [www.writekraft.com]](https://cdn.slidesharecdn.com/ss_thumbnails/dissertation-190406083208-thumbnail.jpg?width=640&height=640&fit=bounds)