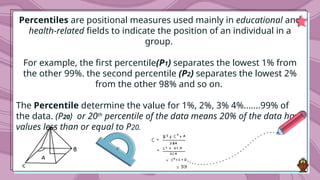
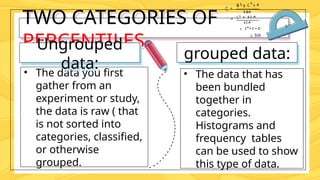
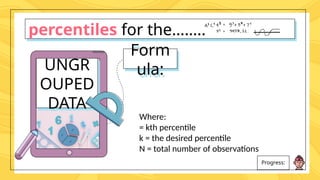
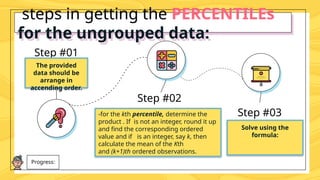
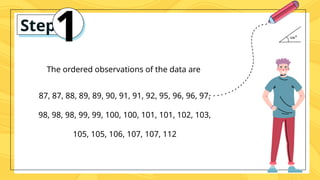
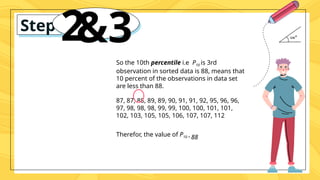
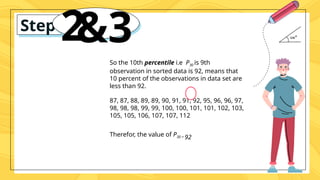
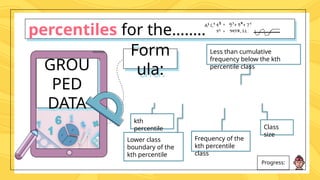
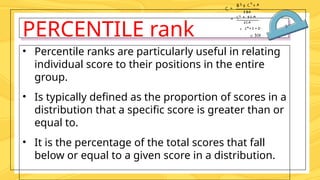
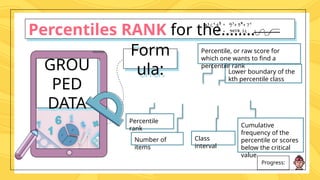
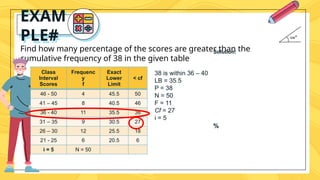
percen
tile
WHAT IS
PERCENT
ILE?
01
• are values that devide the distribution
into 100 equal parts.
• There are 99 percentiles, denoted by
P1 , P2, ……………P99.
• They are generally used to characterize
values according to the percentage
below them.
PERCENTILES
Percentiles are positional measures used mainly in educational and
health-related fields to indicate the position of an individual in a
group.
For example, the first percentile(P1) separates the lowest 1% from
the other 99%. the second percentile (P2) separates the lowest 2%
from the other 98% and so on.
The Percentile determine the value for 1%, 2%, 3% 4%.......99% of
the data. (P20) or 20th
percentile of the data means 20% of the data have
values less than or equal to P20.
TWO CATEGORIES OF
PERCENTILES
• The data you first
gather from an
experiment or study,
the data is raw ( that
is not sorted into
categories, classified,
or otherwise
grouped.
Ungrouped
data:
grouped data:
• The data that has
been bundled
together in
categories.
Histograms and
frequency tables
can be used to show
this type of data.
percentiles for the……..
Progress:
UNGR
OUPED
DATA
Form
ula:
Where:
= kth percentile
k = the desired percentile
N = total number of observations
Progress:
Step #01
The provided
data should be
arrange in
accending order.
Step #02
Step #03
Solve using the
formula:
steps in getting the PERCENTILEs
for the ungrouped data:
-for the kth percentile, determine the
product . If is not an integer, round it up
and find the corresponding ordered
value and if is an integer, say k, then
calculate the mean of the Kth
and (k+1)th ordered observations.
Understa
nding
it with the
following
02
Exam
ple:
For the following height data collected from
students find the 10th and 30th percentiles.
91, 89, 88, 87, 89, 91, 87, 92, 90, 98, 95, 97,
96, 100, 101, 96, 98, 99, 98, 100, 102, 99, 101,
105, 103, 107, 105, 106, 107, 112.
The ordered observations of the data are
87, 87, 88, 89, 89, 90, 91, 91, 92, 95, 96, 96, 97,
98, 98, 98, 99, 99, 100, 100, 101, 101, 102, 103,
105, 105, 106, 107, 107, 112
Step #
1
Step #
2
&3
So the 10th percentile i.e P10 is 3rd
observation in sorted data is 88, means that
10 percent of the observations in data set
are less than 88.
87, 87, 88, 89, 89, 90, 91, 91, 92, 95, 96, 96,
97, 98, 98, 98, 99, 99, 100, 100, 101, 101,
102, 103, 105, 105, 106, 107, 107, 112
Therefor, the value of P10 = 88
Step #
2
&3
So the 10th percentile i.e P30 is 9th
observation in sorted data is 92, means that
10 percent of the observations in data set are
less than 92.
87, 87, 88, 89, 89, 90, 91, 91, 92, 95, 96, 96, 97,
98, 98, 98, 99, 99, 100, 100, 101, 101, 102, 103,
105, 105, 106, 107, 107, 112
Therefor, the value of P30 = 92
percentiles for the……..
Progress:
GROU
PED
DATA
Form
ula:
kth
percentile
Lower class
boundary of the
kth percentile
Less than cumulative
frequency below the kth
percentile class
Frequency of the
kth percentile
class
Class
size
Calculate the 65th percentile and the 32nd percentile of the
mathematics test of 50 students.
EXAM
PLE#
Class
Interval
Scores
Frequenc
y
f
Exact
Lower
Limit
< cf
46 - 50 4 45.5 50
41 – 45 8 40.5 46
36 - 40 11 35.5 38
31 – 35 9 30.5 27
26 – 30 12 25.5 18
21 - 25 6 20.5 6
i = 5 N = 50
𝑷 𝟔𝟓
Calculate the 65th percentile and the 32nd percentile of the
mathematics test of 50 students.
EXAM
PLE#
Class
Interval
Scores
Frequenc
y
f
Exact
Lower
Limit
< cf
46 - 50 4 45.5 50
41 – 45 8 40.5 46
36 - 40 11 35.5 38
31 – 35 9 30.5 27
26 – 30 12 25.5 18
21 - 25 6 20.5 6
i = 5 N = 50
𝑷 𝟑𝟐
PERCENTILE rank
• Percentile ranks are particularly useful in relating
individual score to their positions in the entire
group.
• Is typically defined as the proportion of scores in a
distribution that a specific score is greater than or
equal to.
• It is the percentage of the total scores that fall
below or equal to a given score in a distribution.
Percentiles RANK for the……..
Progress:
GROU
PED
DATA
Form
ula:
Percentile
rank
Number of
items
Percentile, or raw score for
which one wants to find a
percentile rank
Class
interval
Cumulative
frequency of the
percentile or scores
below the critical
value
Lower boundary of the
kth percentile class
Find how many percentage of the scores are greater than the
cumulative frequency of 38 in the given table
EXAM
PLE#
Class
Interval
Scores
Frequenc
y
f
Exact
Lower
Limit
< cf
46 - 50 4 45.5 50
41 – 45 8 40.5 46
36 - 40 11 35.5 38
31 – 35 9 30.5 27
26 – 30 12 25.5 18
21 - 25 6 20.5 6
i = 5 N = 50
38 is within 36 – 40
LB = 35.5
P = 38
N = 50
F = 11
Cf = 27
i = 5
Solution:
%
Solut
ion
foun
d!
03
CREDITS: This presentation template was
created by Slidesgo, including icons by Flaticon,
and infographics & images by Freepik
THANK
you for
listening!

HOW TO GET PERCENTILE POWERPOINT PRESENTATION

  • 1.
  • 2.
  • 3.
    • are valuesthat devide the distribution into 100 equal parts. • There are 99 percentiles, denoted by P1 , P2, ……………P99. • They are generally used to characterize values according to the percentage below them. PERCENTILES
  • 4.
    Percentiles are positionalmeasures used mainly in educational and health-related fields to indicate the position of an individual in a group. For example, the first percentile(P1) separates the lowest 1% from the other 99%. the second percentile (P2) separates the lowest 2% from the other 98% and so on. The Percentile determine the value for 1%, 2%, 3% 4%.......99% of the data. (P20) or 20th percentile of the data means 20% of the data have values less than or equal to P20.
  • 5.
    TWO CATEGORIES OF PERCENTILES •The data you first gather from an experiment or study, the data is raw ( that is not sorted into categories, classified, or otherwise grouped. Ungrouped data: grouped data: • The data that has been bundled together in categories. Histograms and frequency tables can be used to show this type of data.
  • 6.
    percentiles for the…….. Progress: UNGR OUPED DATA Form ula: Where: =kth percentile k = the desired percentile N = total number of observations
  • 7.
    Progress: Step #01 The provided datashould be arrange in accending order. Step #02 Step #03 Solve using the formula: steps in getting the PERCENTILEs for the ungrouped data: -for the kth percentile, determine the product . If is not an integer, round it up and find the corresponding ordered value and if is an integer, say k, then calculate the mean of the Kth and (k+1)th ordered observations.
  • 8.
  • 9.
    Exam ple: For the followingheight data collected from students find the 10th and 30th percentiles. 91, 89, 88, 87, 89, 91, 87, 92, 90, 98, 95, 97, 96, 100, 101, 96, 98, 99, 98, 100, 102, 99, 101, 105, 103, 107, 105, 106, 107, 112.
  • 10.
    The ordered observationsof the data are 87, 87, 88, 89, 89, 90, 91, 91, 92, 95, 96, 96, 97, 98, 98, 98, 99, 99, 100, 100, 101, 101, 102, 103, 105, 105, 106, 107, 107, 112 Step # 1
  • 11.
    Step # 2 &3 So the10th percentile i.e P10 is 3rd observation in sorted data is 88, means that 10 percent of the observations in data set are less than 88. 87, 87, 88, 89, 89, 90, 91, 91, 92, 95, 96, 96, 97, 98, 98, 98, 99, 99, 100, 100, 101, 101, 102, 103, 105, 105, 106, 107, 107, 112 Therefor, the value of P10 = 88
  • 12.
    Step # 2 &3 So the10th percentile i.e P30 is 9th observation in sorted data is 92, means that 10 percent of the observations in data set are less than 92. 87, 87, 88, 89, 89, 90, 91, 91, 92, 95, 96, 96, 97, 98, 98, 98, 99, 99, 100, 100, 101, 101, 102, 103, 105, 105, 106, 107, 107, 112 Therefor, the value of P30 = 92
  • 13.
    percentiles for the…….. Progress: GROU PED DATA Form ula: kth percentile Lowerclass boundary of the kth percentile Less than cumulative frequency below the kth percentile class Frequency of the kth percentile class Class size
  • 14.
    Calculate the 65thpercentile and the 32nd percentile of the mathematics test of 50 students. EXAM PLE# Class Interval Scores Frequenc y f Exact Lower Limit < cf 46 - 50 4 45.5 50 41 – 45 8 40.5 46 36 - 40 11 35.5 38 31 – 35 9 30.5 27 26 – 30 12 25.5 18 21 - 25 6 20.5 6 i = 5 N = 50 𝑷 𝟔𝟓
  • 15.
    Calculate the 65thpercentile and the 32nd percentile of the mathematics test of 50 students. EXAM PLE# Class Interval Scores Frequenc y f Exact Lower Limit < cf 46 - 50 4 45.5 50 41 – 45 8 40.5 46 36 - 40 11 35.5 38 31 – 35 9 30.5 27 26 – 30 12 25.5 18 21 - 25 6 20.5 6 i = 5 N = 50 𝑷 𝟑𝟐
  • 16.
    PERCENTILE rank • Percentileranks are particularly useful in relating individual score to their positions in the entire group. • Is typically defined as the proportion of scores in a distribution that a specific score is greater than or equal to. • It is the percentage of the total scores that fall below or equal to a given score in a distribution.
  • 17.
    Percentiles RANK forthe…….. Progress: GROU PED DATA Form ula: Percentile rank Number of items Percentile, or raw score for which one wants to find a percentile rank Class interval Cumulative frequency of the percentile or scores below the critical value Lower boundary of the kth percentile class
  • 18.
    Find how manypercentage of the scores are greater than the cumulative frequency of 38 in the given table EXAM PLE# Class Interval Scores Frequenc y f Exact Lower Limit < cf 46 - 50 4 45.5 50 41 – 45 8 40.5 46 36 - 40 11 35.5 38 31 – 35 9 30.5 27 26 – 30 12 25.5 18 21 - 25 6 20.5 6 i = 5 N = 50 38 is within 36 – 40 LB = 35.5 P = 38 N = 50 F = 11 Cf = 27 i = 5 Solution: %
  • 19.
  • 20.
    CREDITS: This presentationtemplate was created by Slidesgo, including icons by Flaticon, and infographics & images by Freepik THANK you for listening!