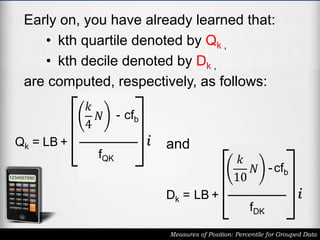
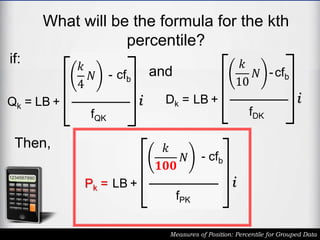
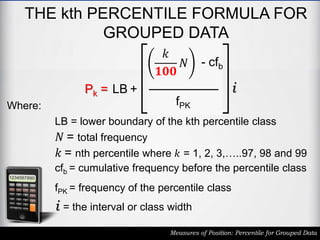
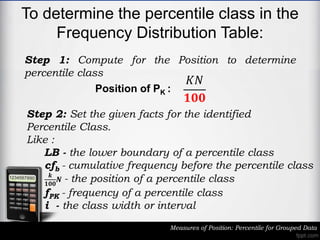
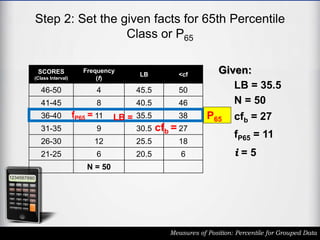
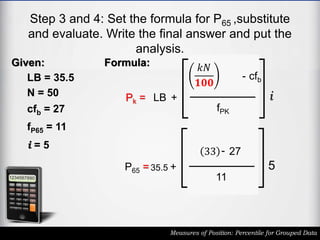
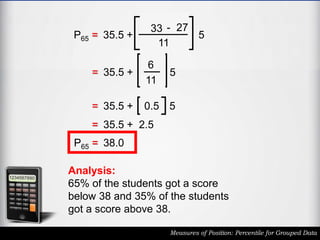
Major project report on Tata Motors and its marketing strategies
ย
COT2-PPTttttttttttttttttttttttttttttttttt.pptx
1. OBJECTIVES
โข Define Percentile in statistic
โข Calculate the Percentile for Grouped
data
โข Relate the concept of measure of
position of Percentile for Group data in
real-life situations.
3. Classroom Rules
Please Read.
1. Be respectful
2. Participate Actively
3. Ask Questions when things are not
clear
4.Speak respectfully and avoid using
offensive language
8. Early on, you have already learned that:
โข kth quartile denoted by Qk ,
โข kth decile denoted by Dk ,
are computed, respectively, as follows:
Measures of Position: Percentile for Grouped Data
Qk = LB +
๐
4
๐ - cfb
fQK
i
Dk = LB +
๐
10
๐ -cfb
fDK
i
and
9. What will be the formula for the kth
percentile?
Measures of Position: Percentile for Grouped Data
Qk = LB +
๐
4
๐ - cfb
fQK
i Dk = LB +
๐
10
๐ -cfb
fDK
i
and
if:
Pk = LB +
๐
๐๐๐
๐ - cfb
fPK
i
Then,
10. THE PERCENTILE FOR
GROUPED DATA
The percentile is ninety-nine score points
which divide a distribution into one 100
equal parts
Measures of Position: Percentile for Grouped Data
11. THE kth PERCENTILE FORMULA FOR
GROUPED DATA
Measures of Position: Percentile for Grouped Data
Pk = LB +
๐
๐๐๐
๐ - cfb
fPK
i
LB = lower boundary of the kth percentile class
๐ = total frequency
cfb = cumulative frequency before the percentile class
fPK = frequency of the percentile class
i = the interval or class width
๐ = nth percentile where ๐ = 1, 2, 3,โฆ..97, 98 and 99
Where:
12. To determine the percentile class in the
Frequency Distribution Table:
Measures of Position: Percentile for Grouped Data
Step 1: Compute for the Position to determine
percentile class
๐พ๐
๐๐๐
Position of PK :
Step 2: Set the given facts for the identified
Percentile Class.
Like :
LB - the lower boundary of a percentile class
cfb - cumulative frequency before the percentile class
๐
๐๐๐
๐ต - the position of a percentile class
fPK - frequency of a percentile class
i - the class width or interval
13. To determine the percentile class in the
Frequency Distribution Table:
Measures of Position: Percentile for Grouped Data
Step 3: Set the formula and substitute the variables
using the given facts and then, evaluate.
Step 4: Write the analysis of the value of the
Percentile Class
14. Example: What should be the score to
exceed the exact 65% (65th percentile)
of the students?
Measures of Position: Percentile for Grouped Data
Class
score
Frequency
(f)
LB CF
46-50 4
41-45 8
36-40 11
31-35 9
26-30 12
21-25 6
15. Example: What should be the score to
exceed the exact 65% (65th percentile)
of the students?
Measures of Position: Percentile for Grouped Data
Class
score
Frequency(
F)
LB CF
46-50 4 45.5 50
41-45 8 40.5 46
36-40 11 35.5 38
31-35 9 30.5 27
26-30 12 25.5 18
21-25 6 20.5 6
16. Calculate the 65th Percentile of the
Mathematics Test Scores of 50
Students.
17. Compute for the Position of the 65th Percentile
Class or P65
Measures of Position: Percentile for Grouped Data
SCORES
(Class Interval)
Frequency
(f)
LB <cf
46-50 4 45.5 50
41-45 8 40.5 46
36-40 11 35.5 38
31-35 9 30.5 27
26-30 12 25.5 18
21-25 6 20.5 6
N = 50
65๐
100
Position of P65 :
:
65(๐๐)
100
:
3250
100
:32.50 or
33th
The 33 position is
between the
cumulative
frequency 27th and
38th. Use the class
36-40
P65
18. Step 2: Set the given facts for 65th Percentile
Class or P65
Measures of Position: Percentile for Grouped Data
SCORES
(Class Interval)
Frequency
(f)
LB <cf
46-50 4 45.5 50
41-45 8 40.5 46
36-40 11 35.5 38
31-35 9 30.5 27
26-30 12 25.5 18
21-25 6 20.5 6
N = 50
P65
Given:
LB = 35.5
N = 50
cfb = 27
fP65 = 11
i = 5
cfb =
LB =
fP65 =
19. Step 3 and 4: Set the formula for P65 ,substitute
and evaluate. Write the final answer and put the
analysis.
Measures of Position: Percentile for Grouped Data
Given:
LB = 35.5
N = 50
cfb = 27
fP65 = 11
i = 5
Pk = LB +
๐๐
๐๐๐
- cfb
fPK
i
Formula:
P65 = 35.5 +
33 - 27
11
5
20. Measures of Position: Percentile for Grouped Data
P65 = 35.5 +
33 - 27
11
5
P65 = 35.5 +
6
11
5
P65 = 35.5 + 0.5 5
P65 = 35.5 + 2.5
P65 = 38.0
Analysis:
65% of the students got a score
below 38 and 35% of the students
got a score above 38.