Download to read offline

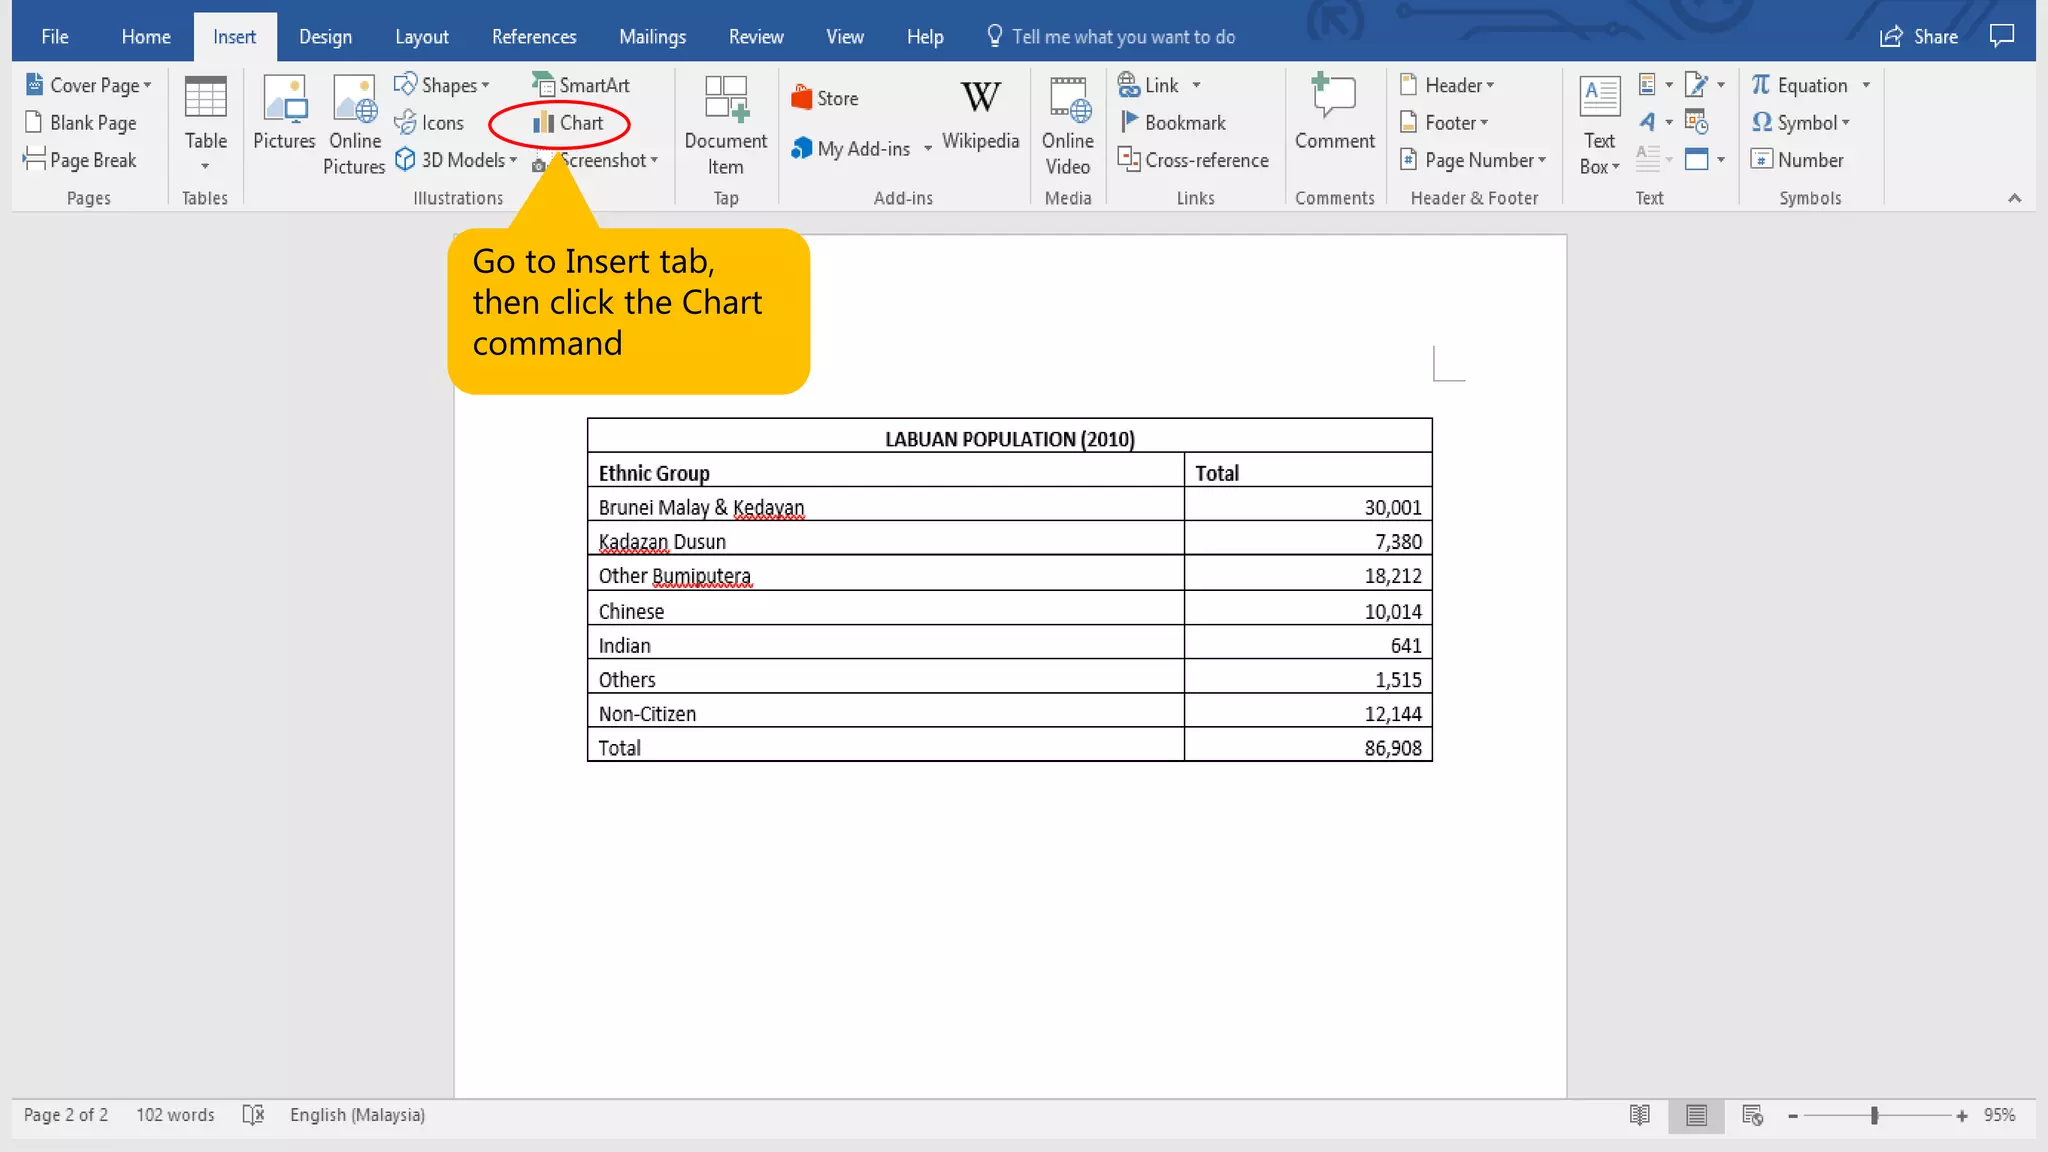
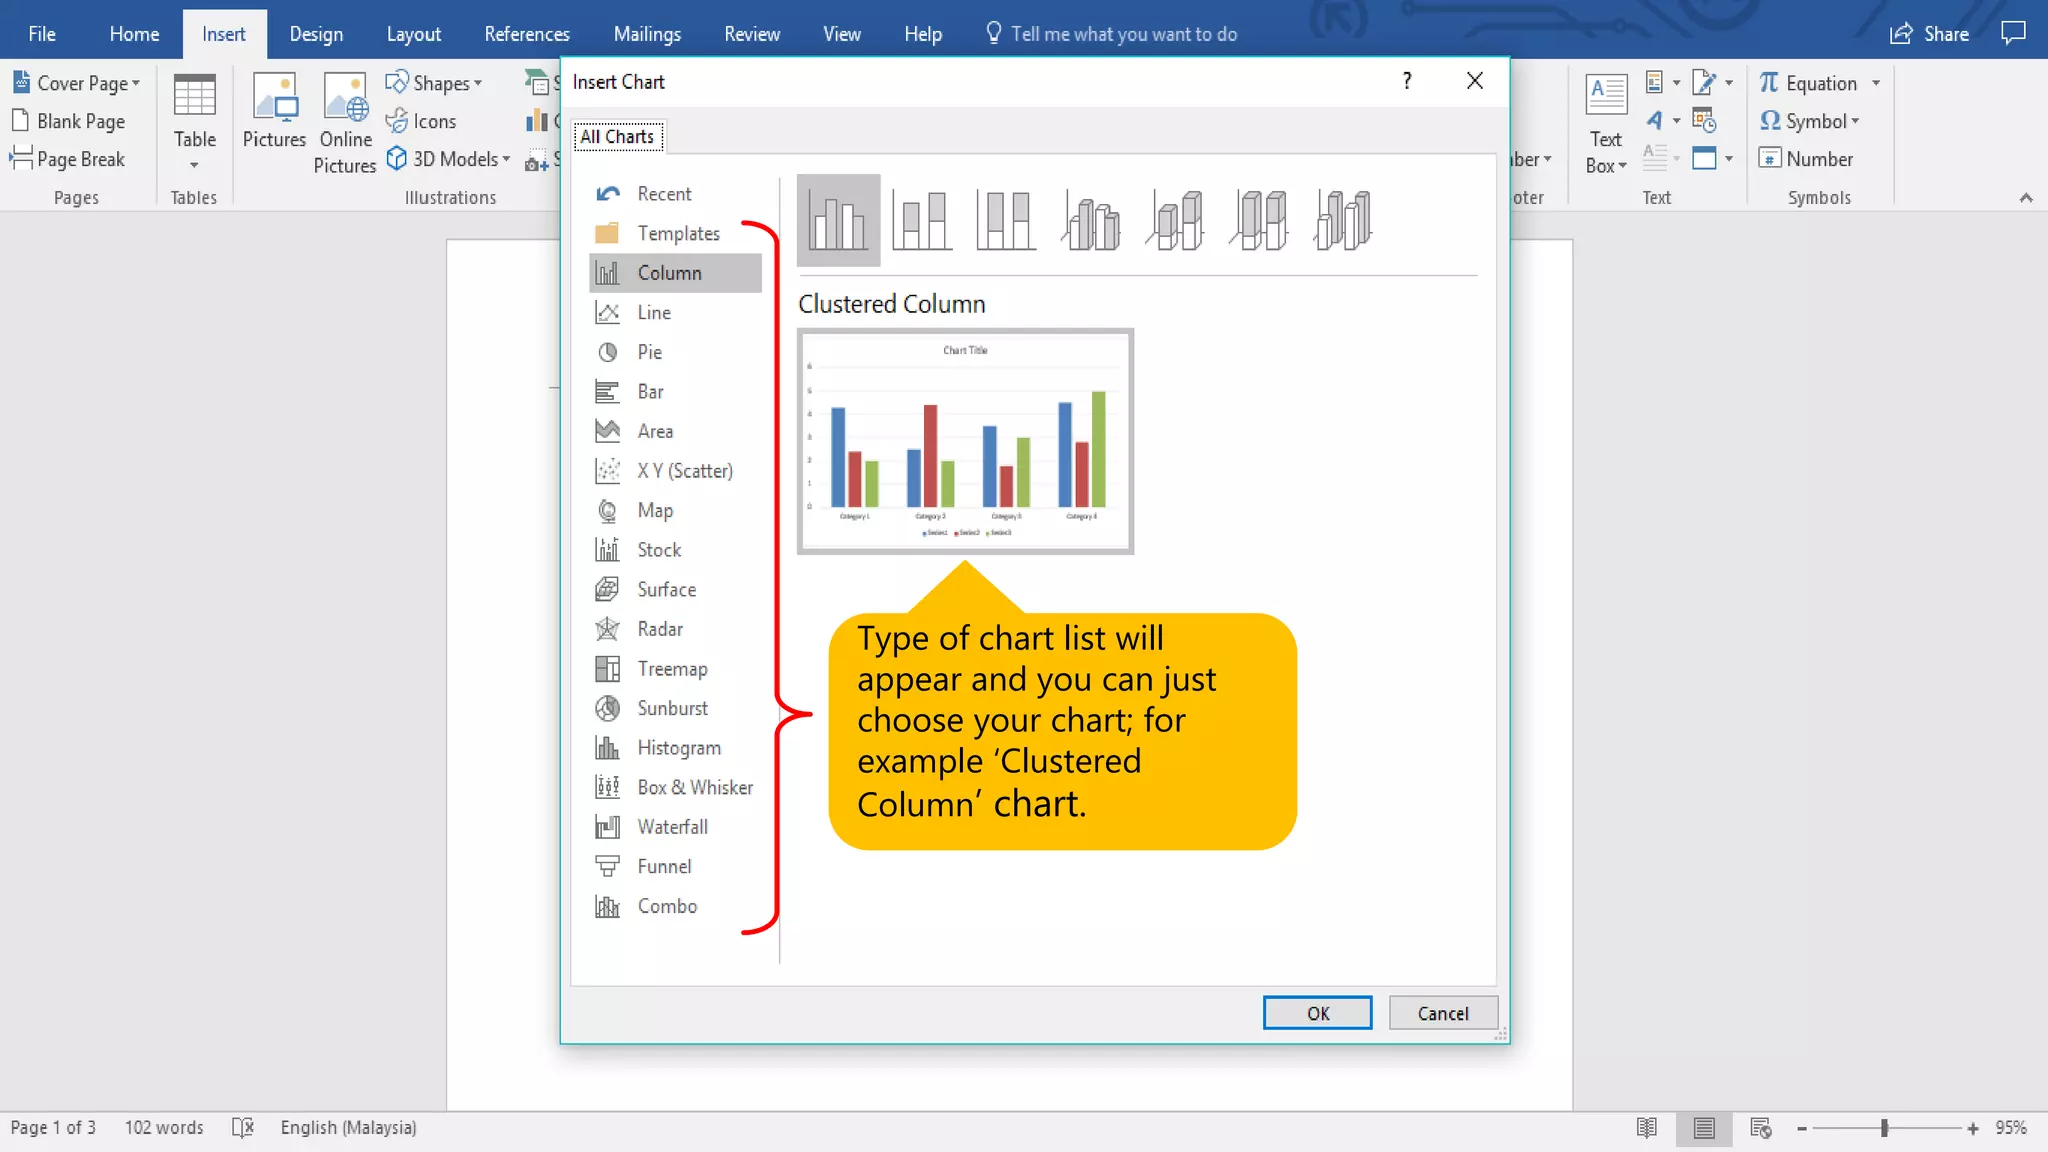
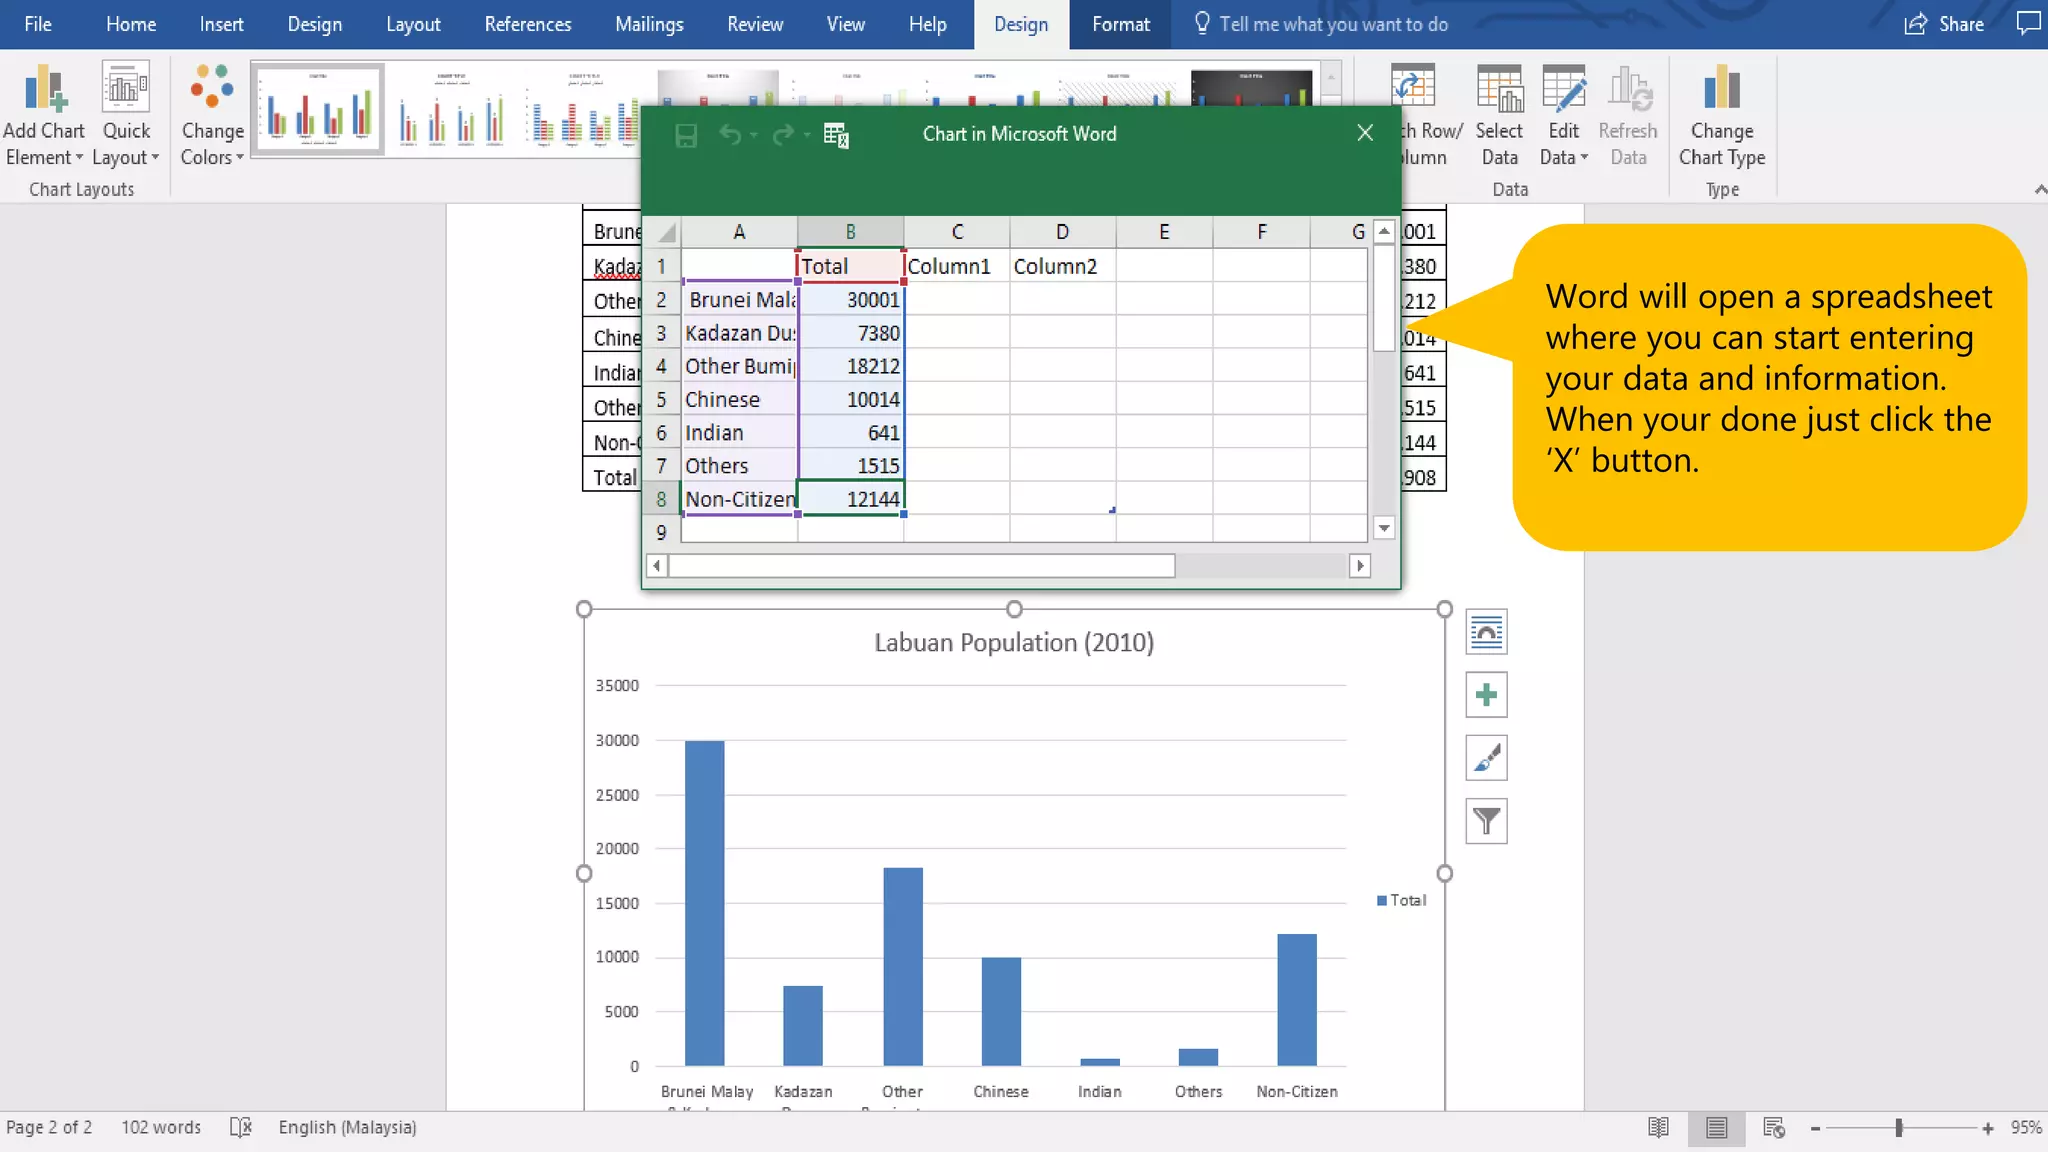
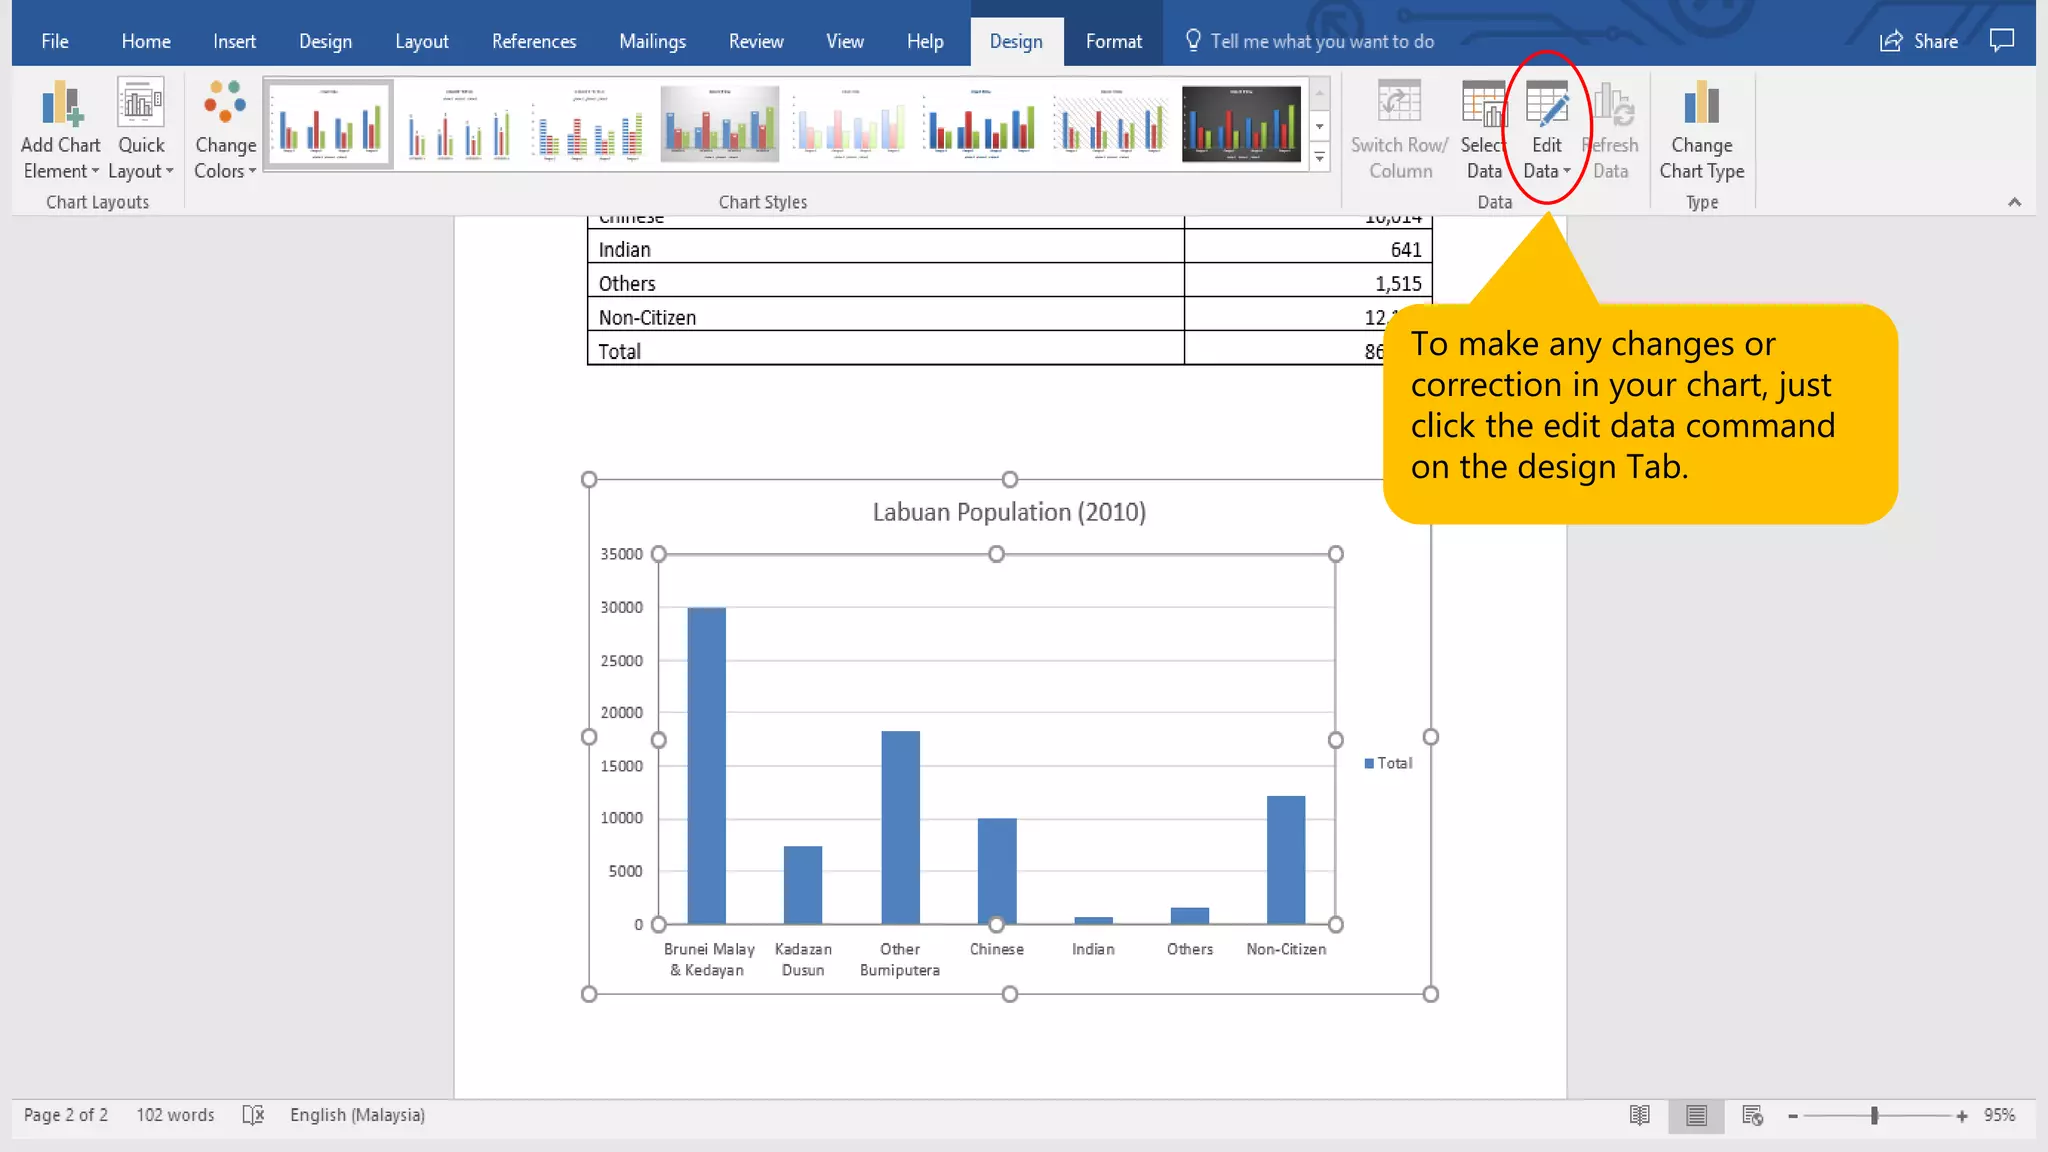
This document provides instructions for creating charts in Microsoft Word 2016. It explains that you first go to the Insert tab and click the Chart command, which will display a list of chart types to choose from such as Clustered Column. Word will then open a spreadsheet where you enter your data and information, and click an X button when done. To later edit the chart data, click the Edit Data command on the Design tab.