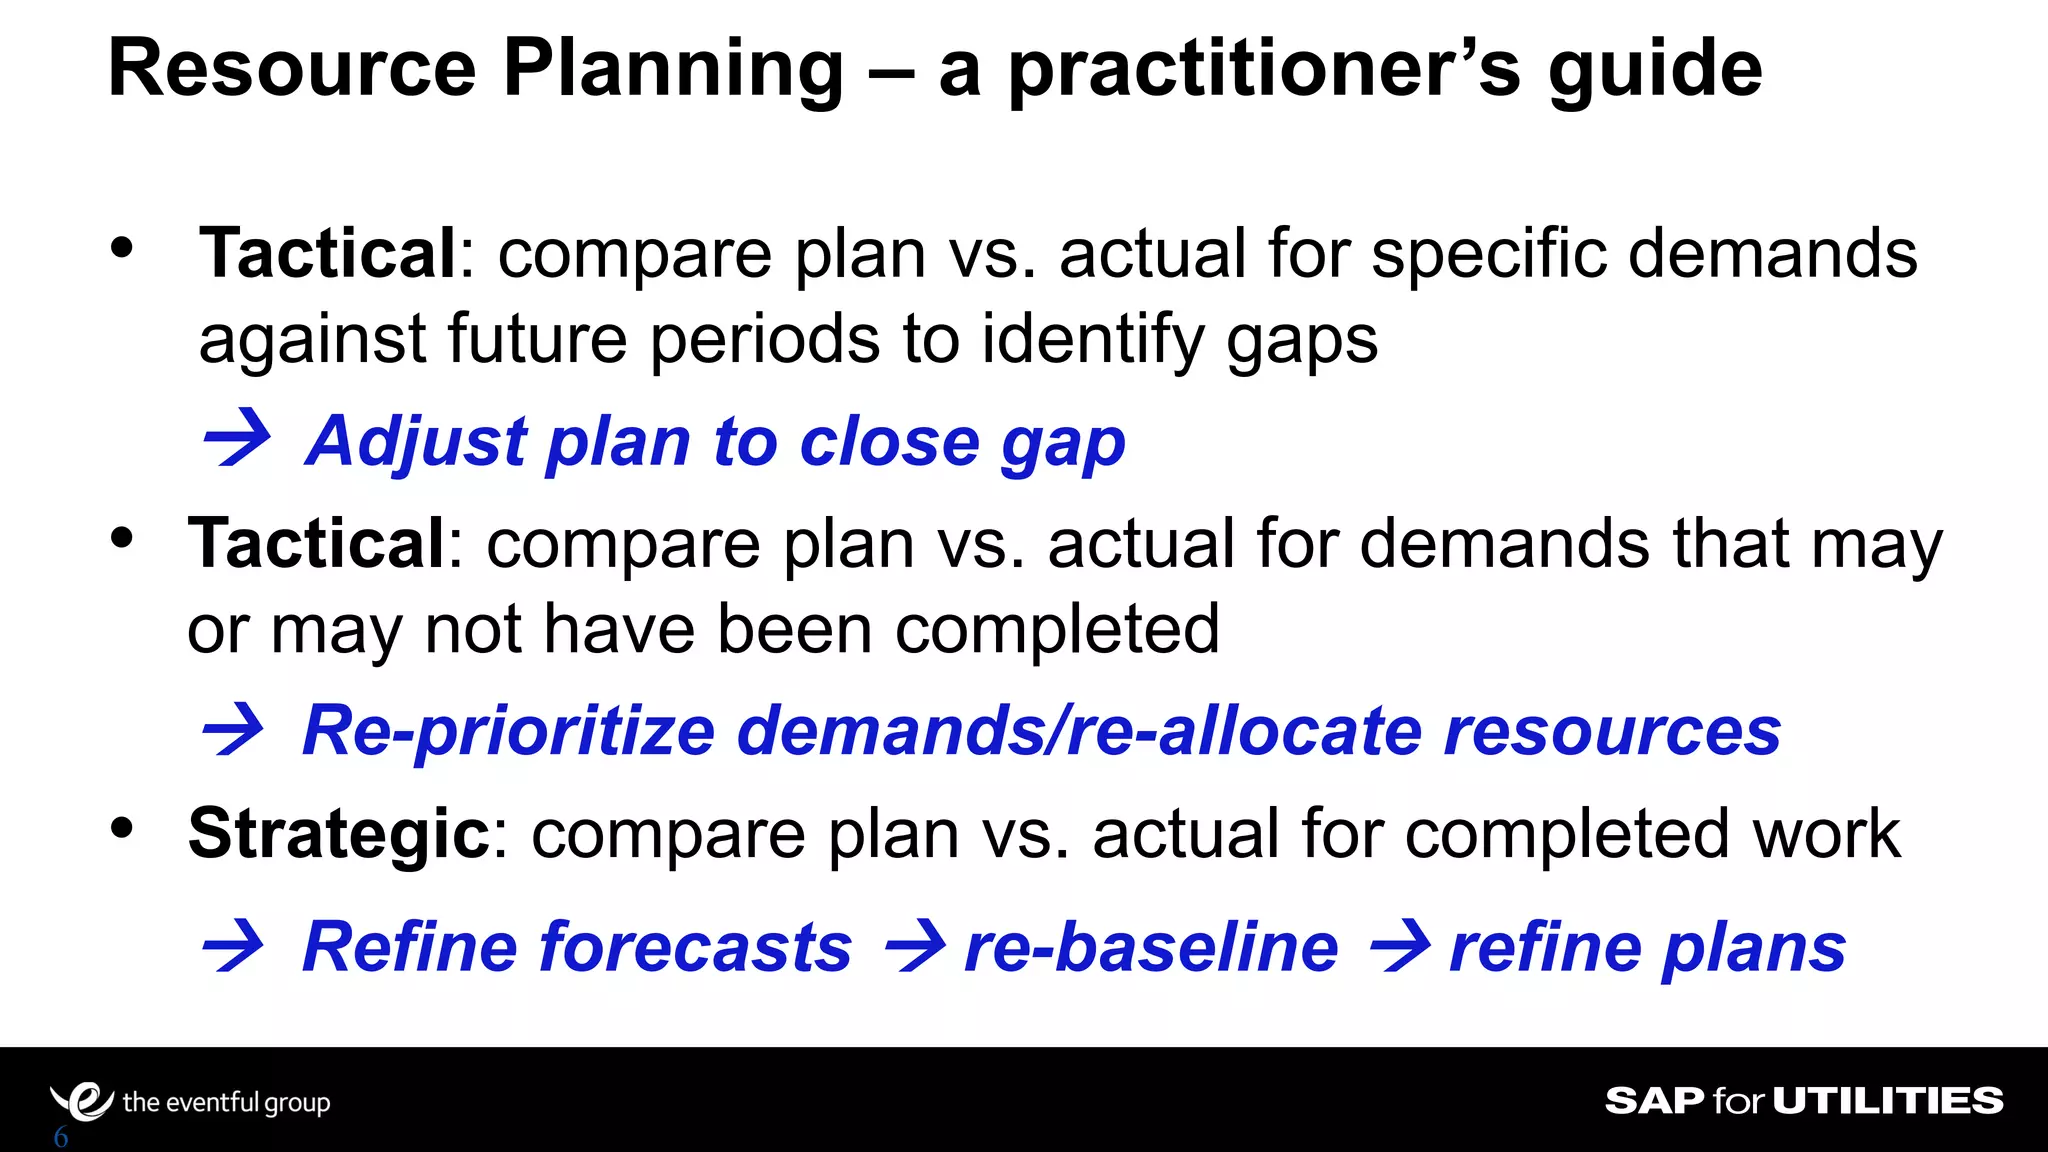
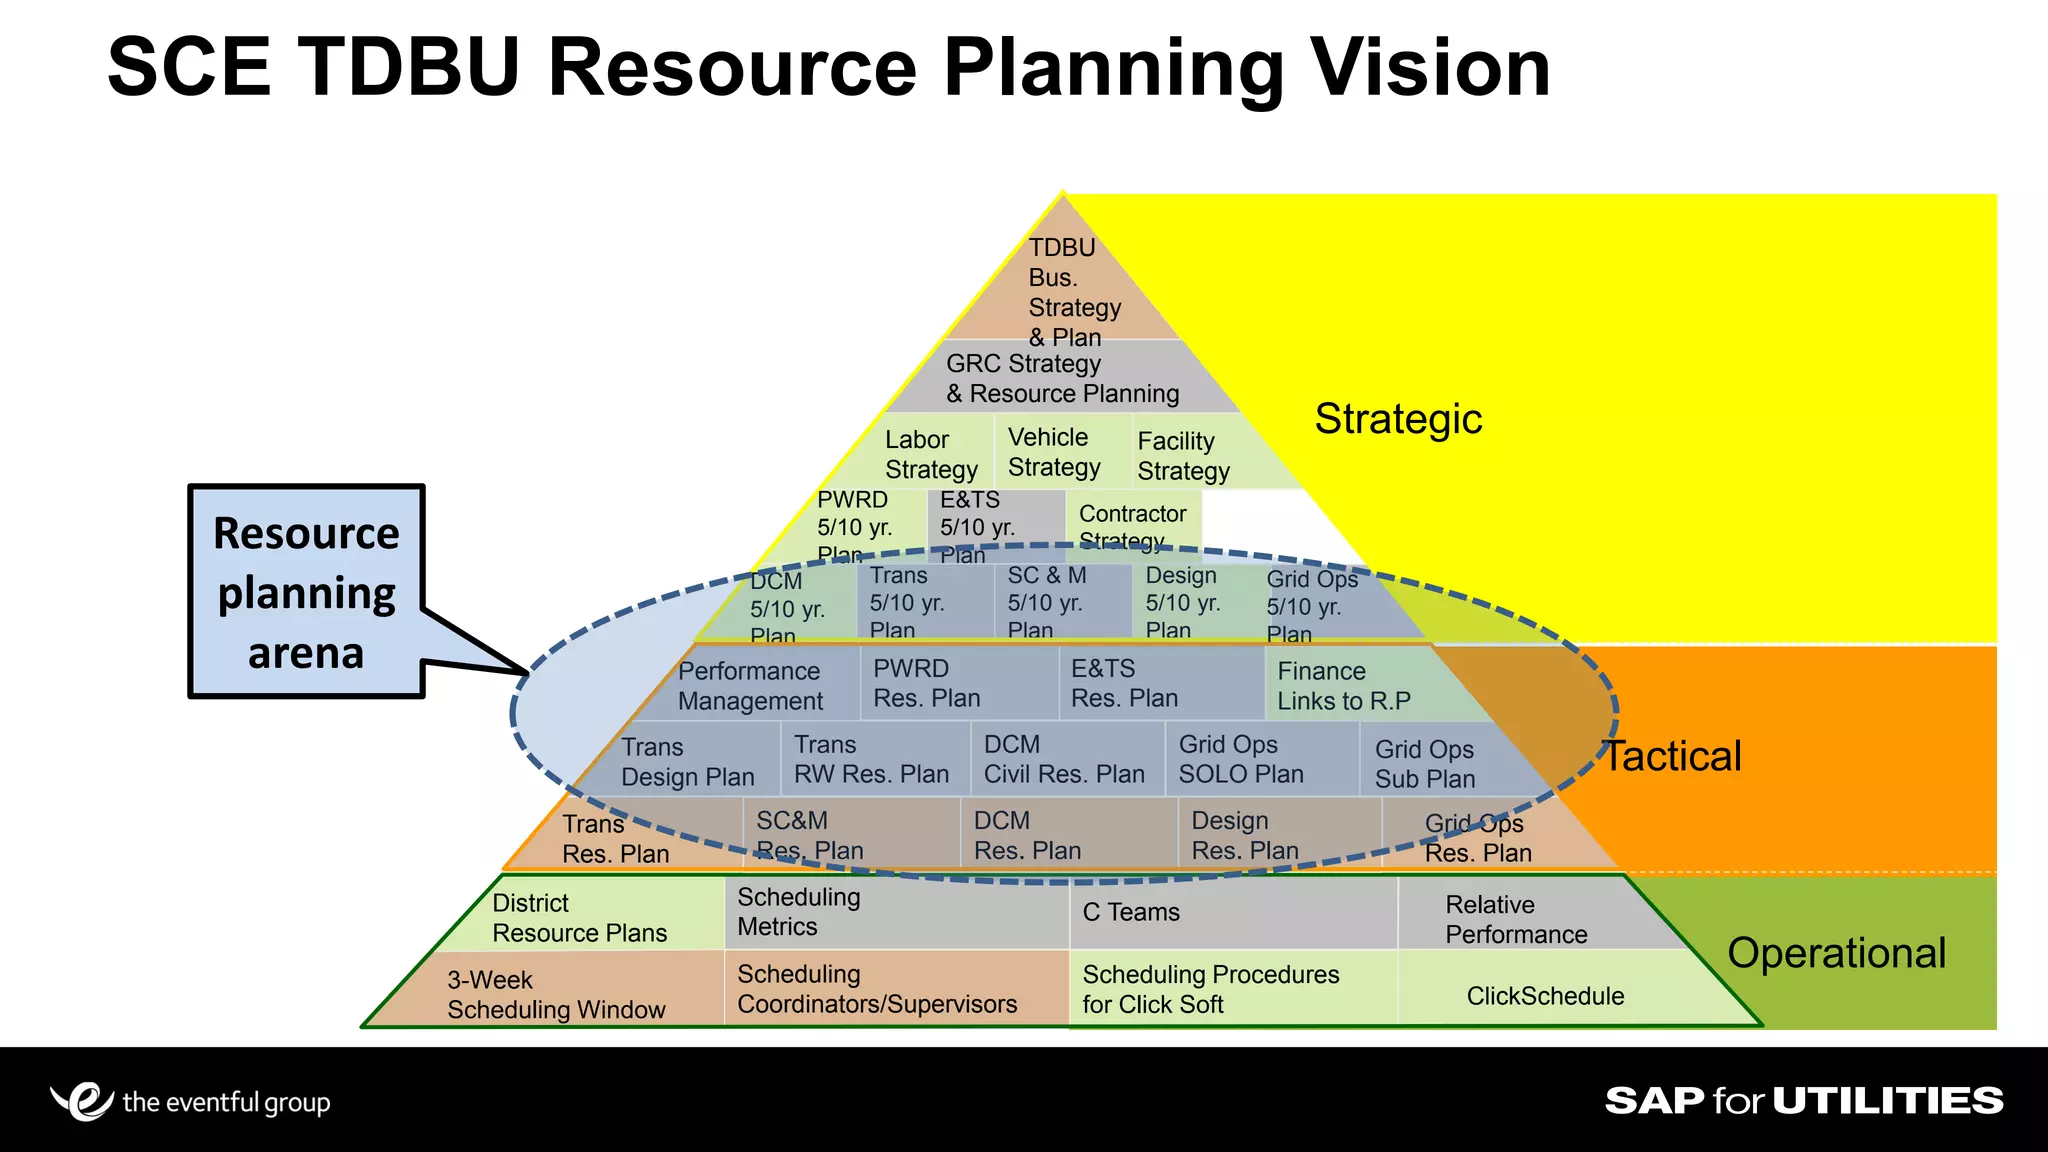
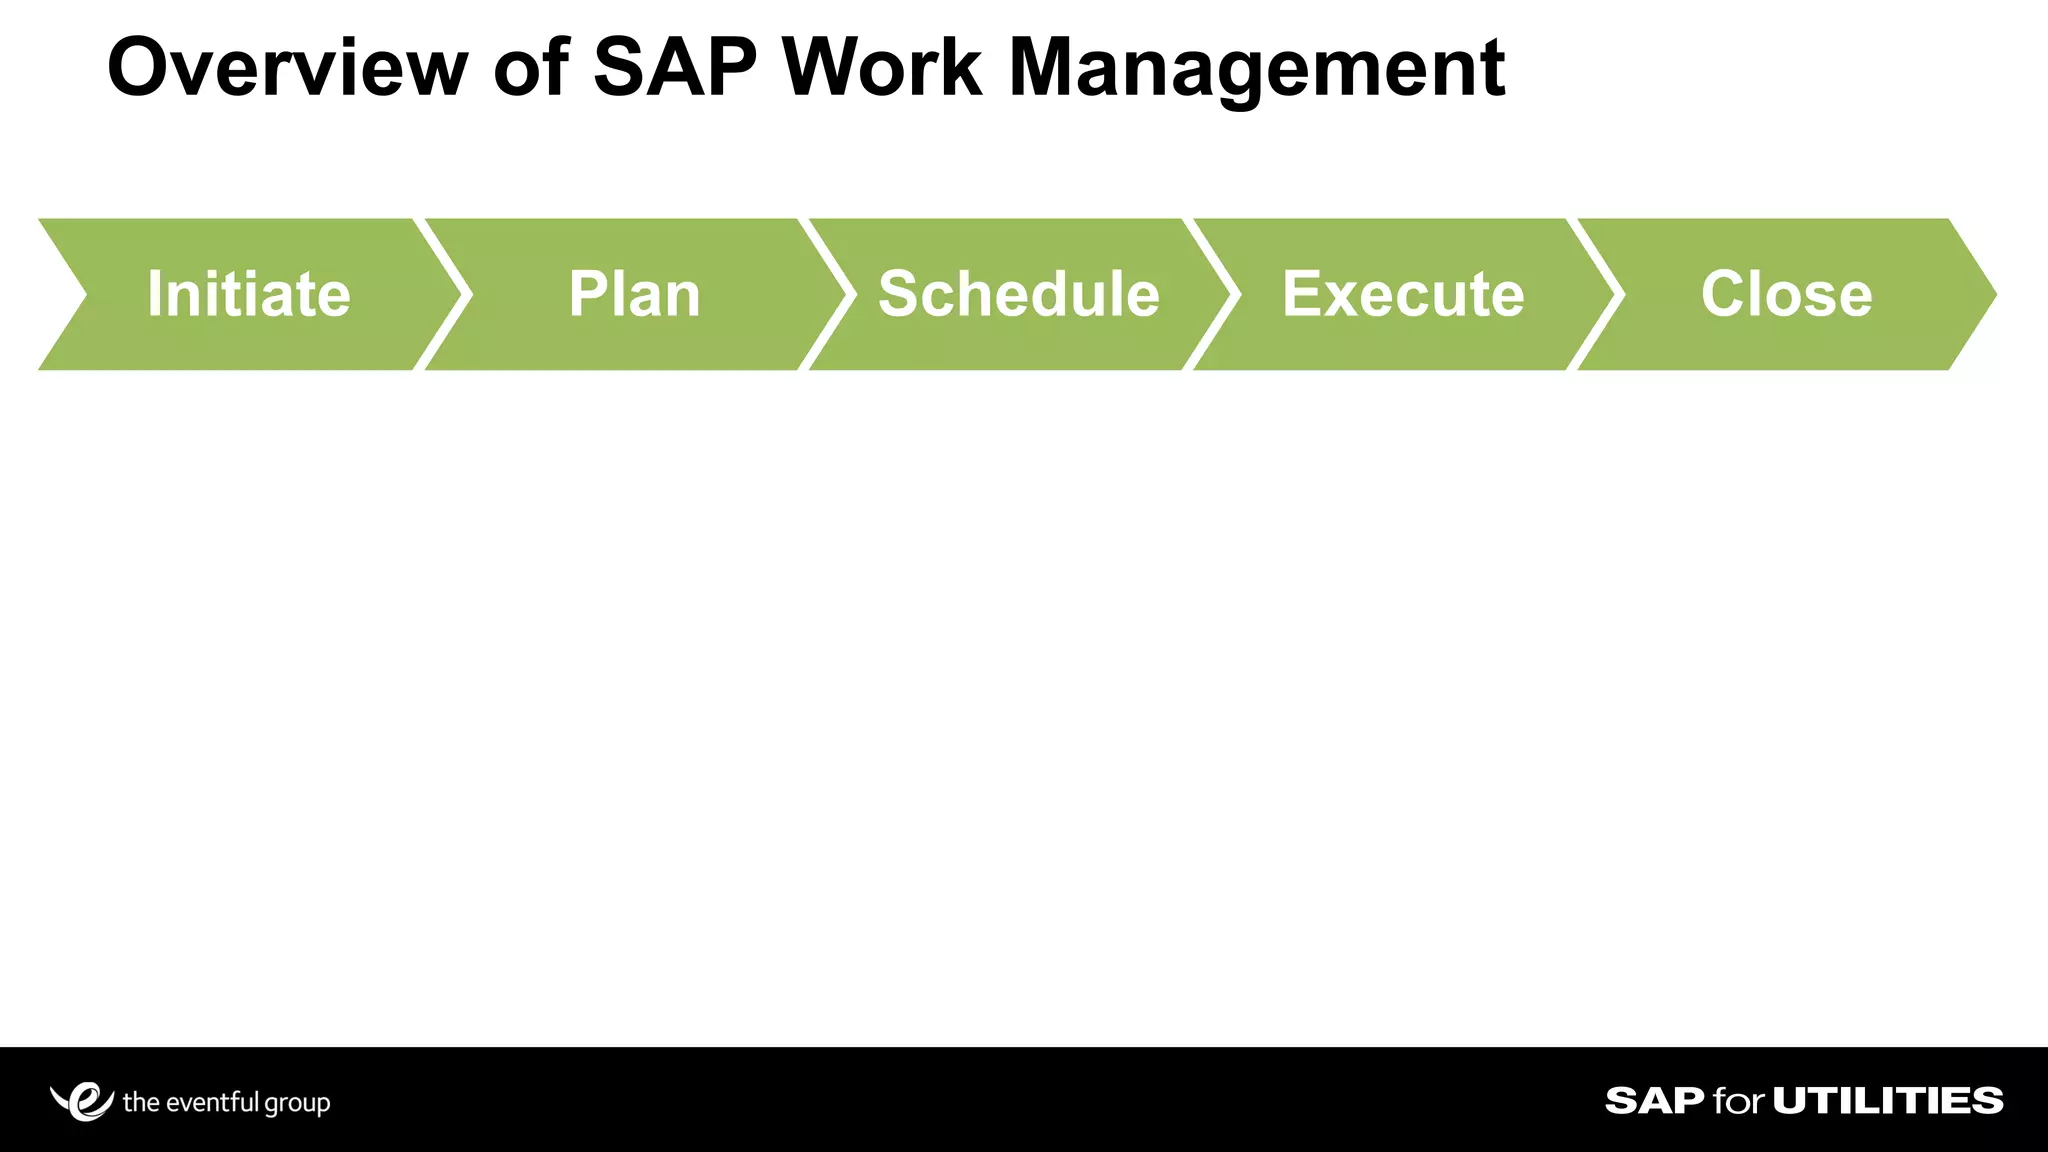
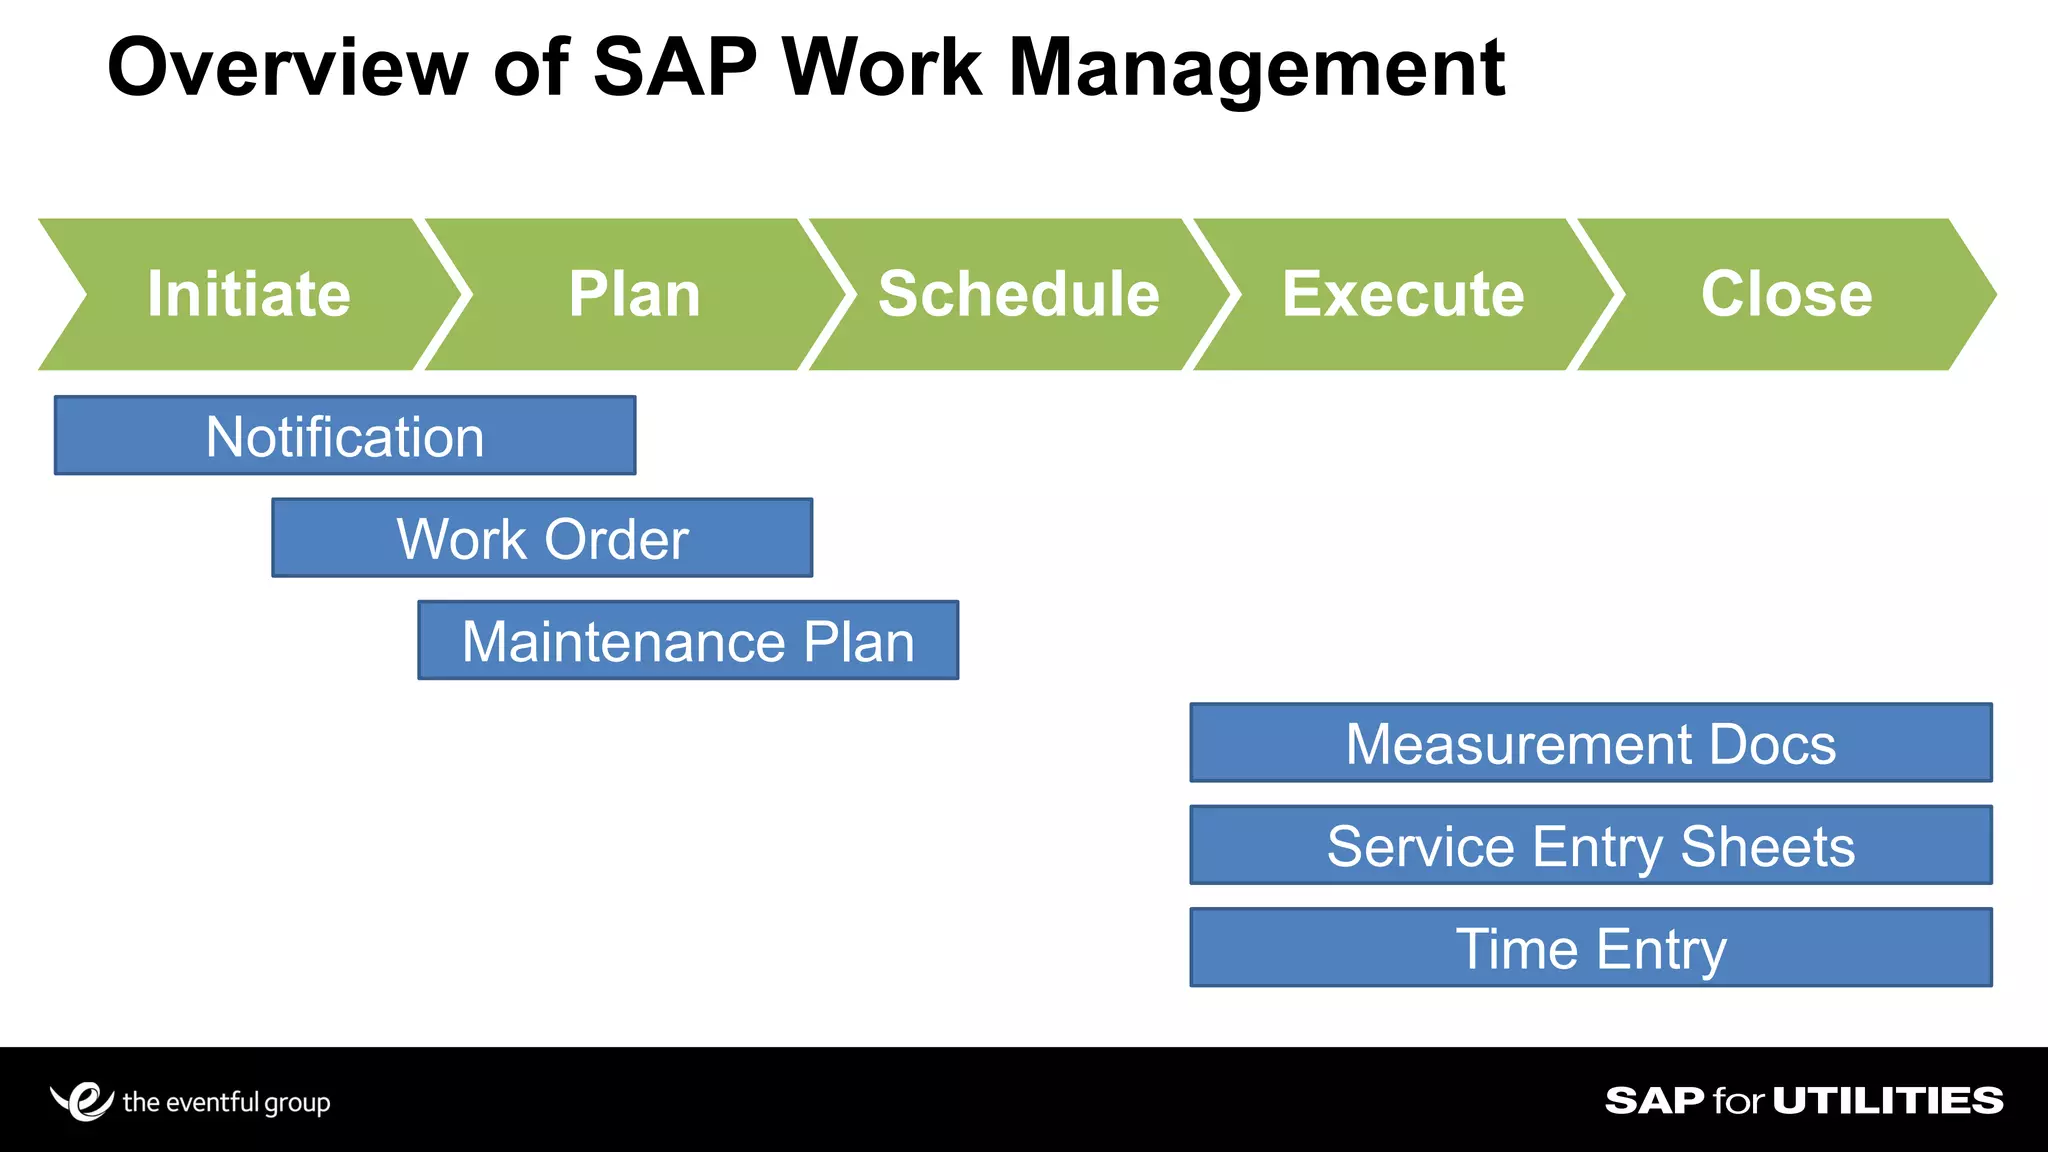
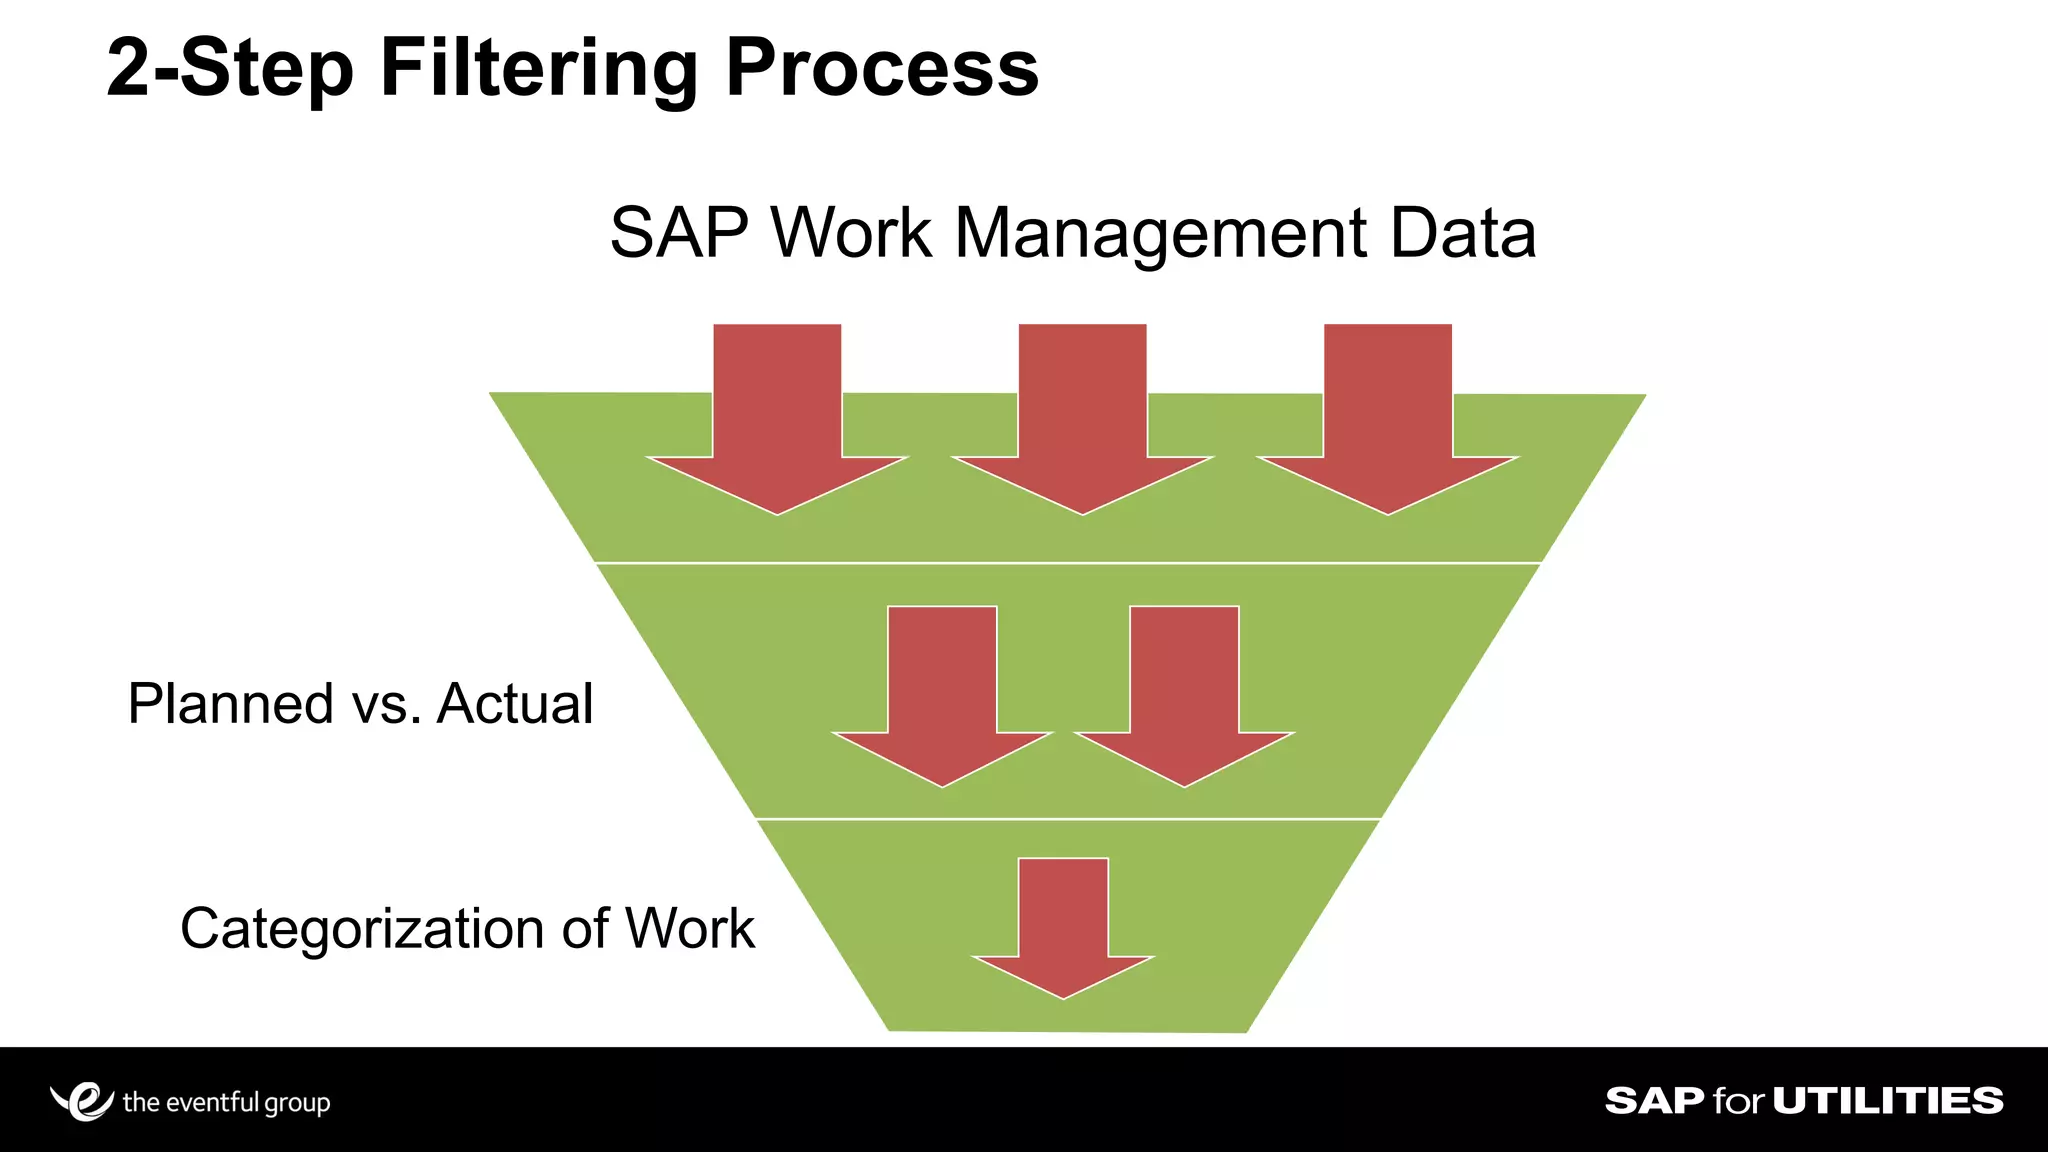
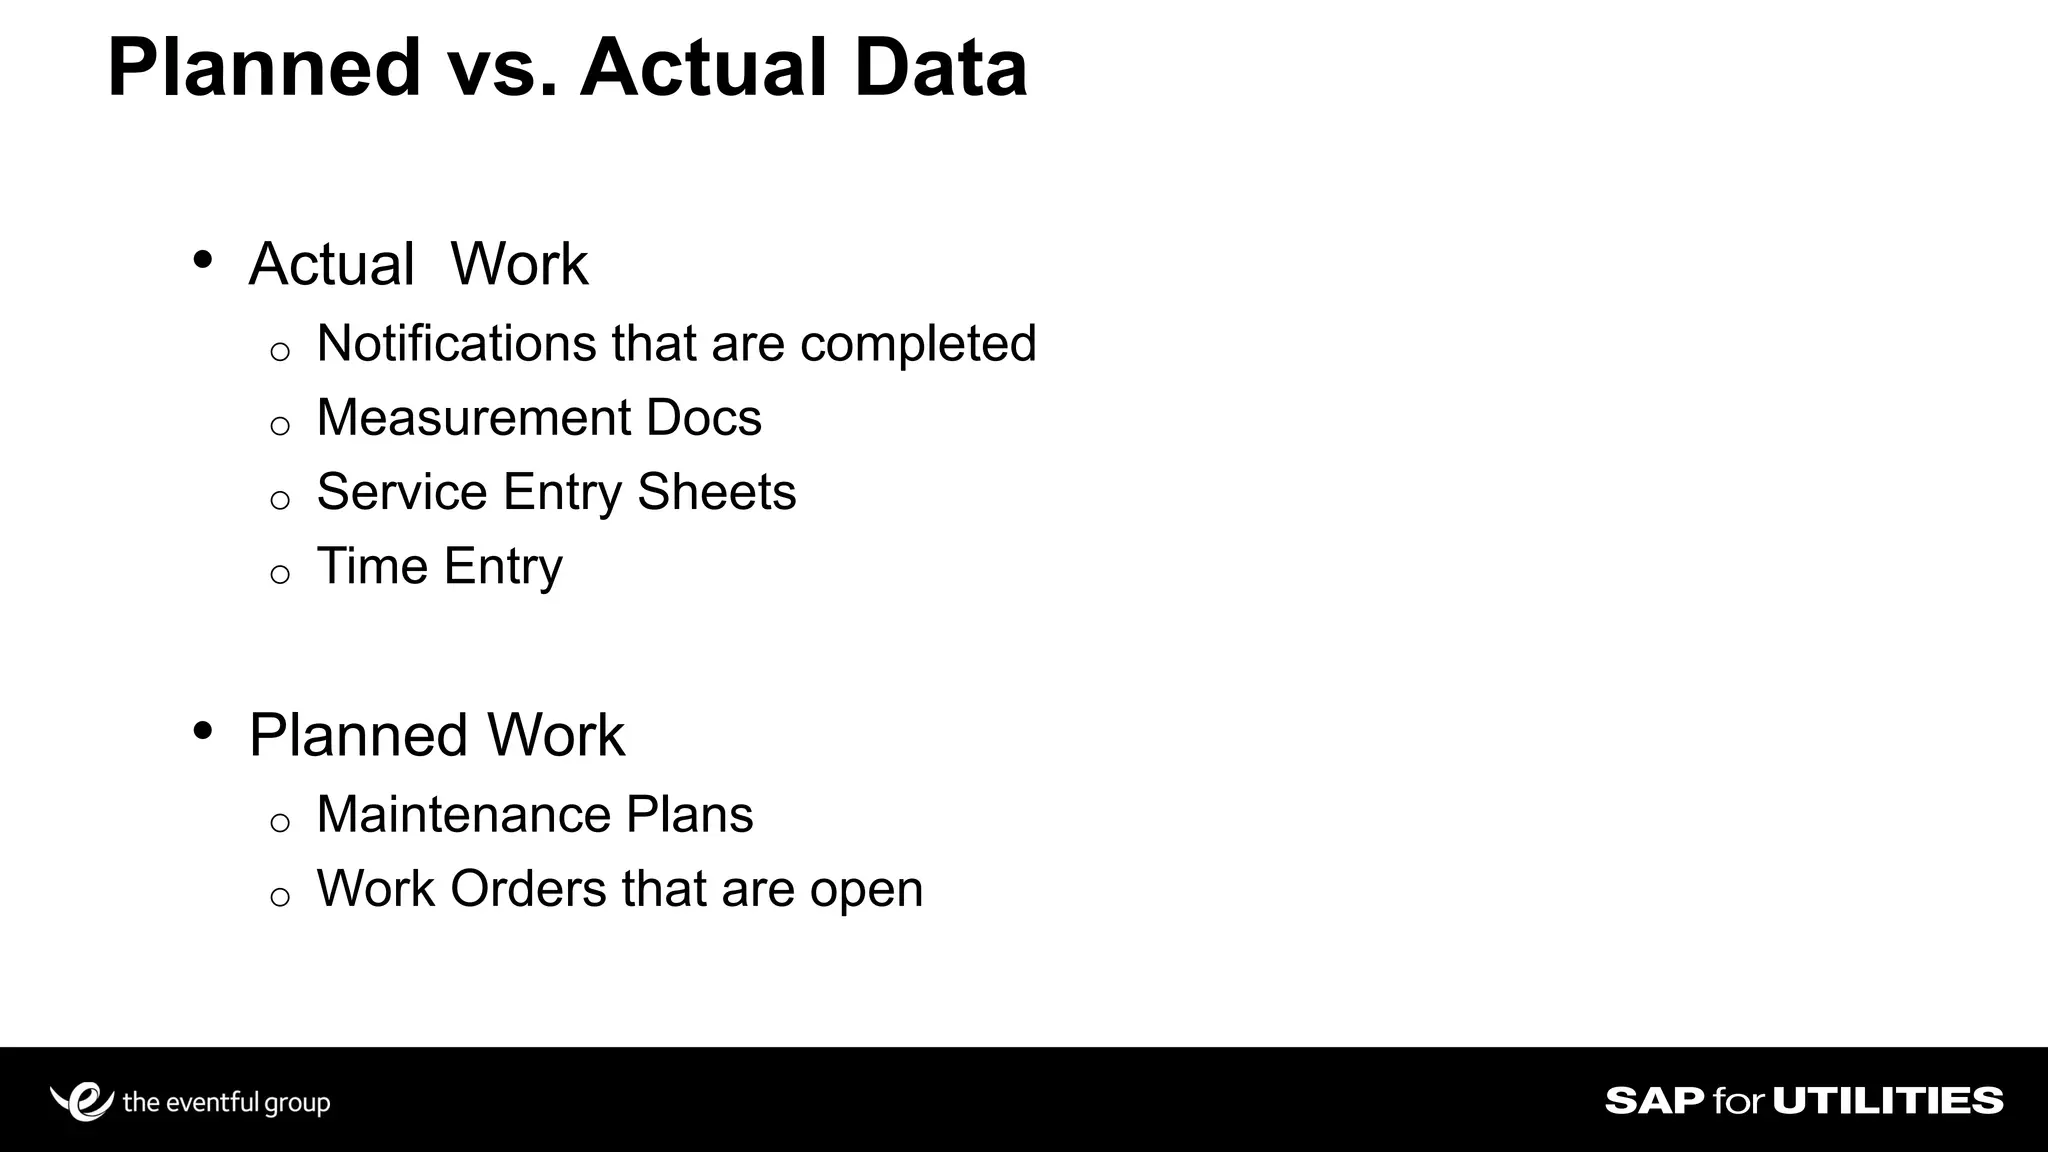
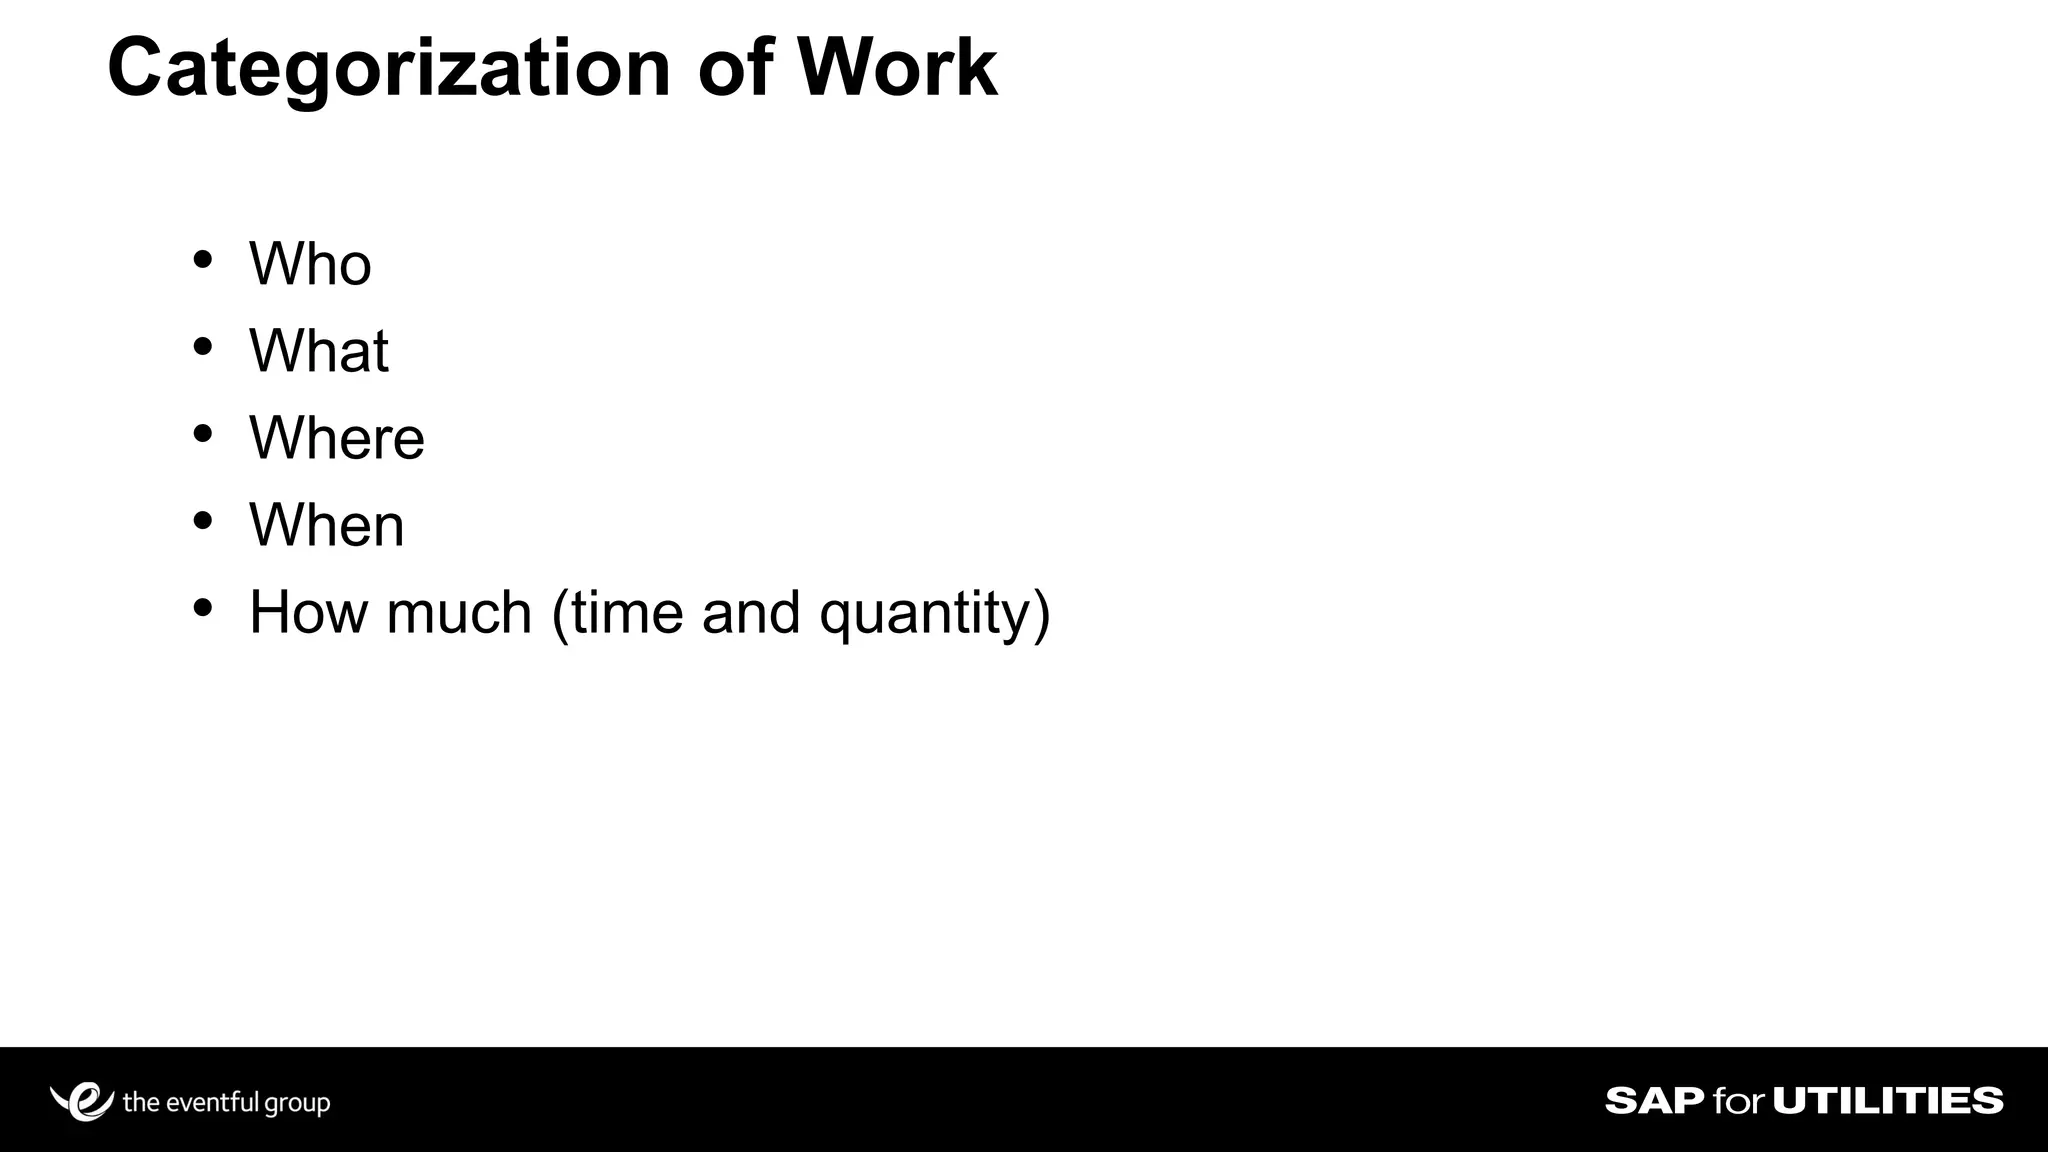
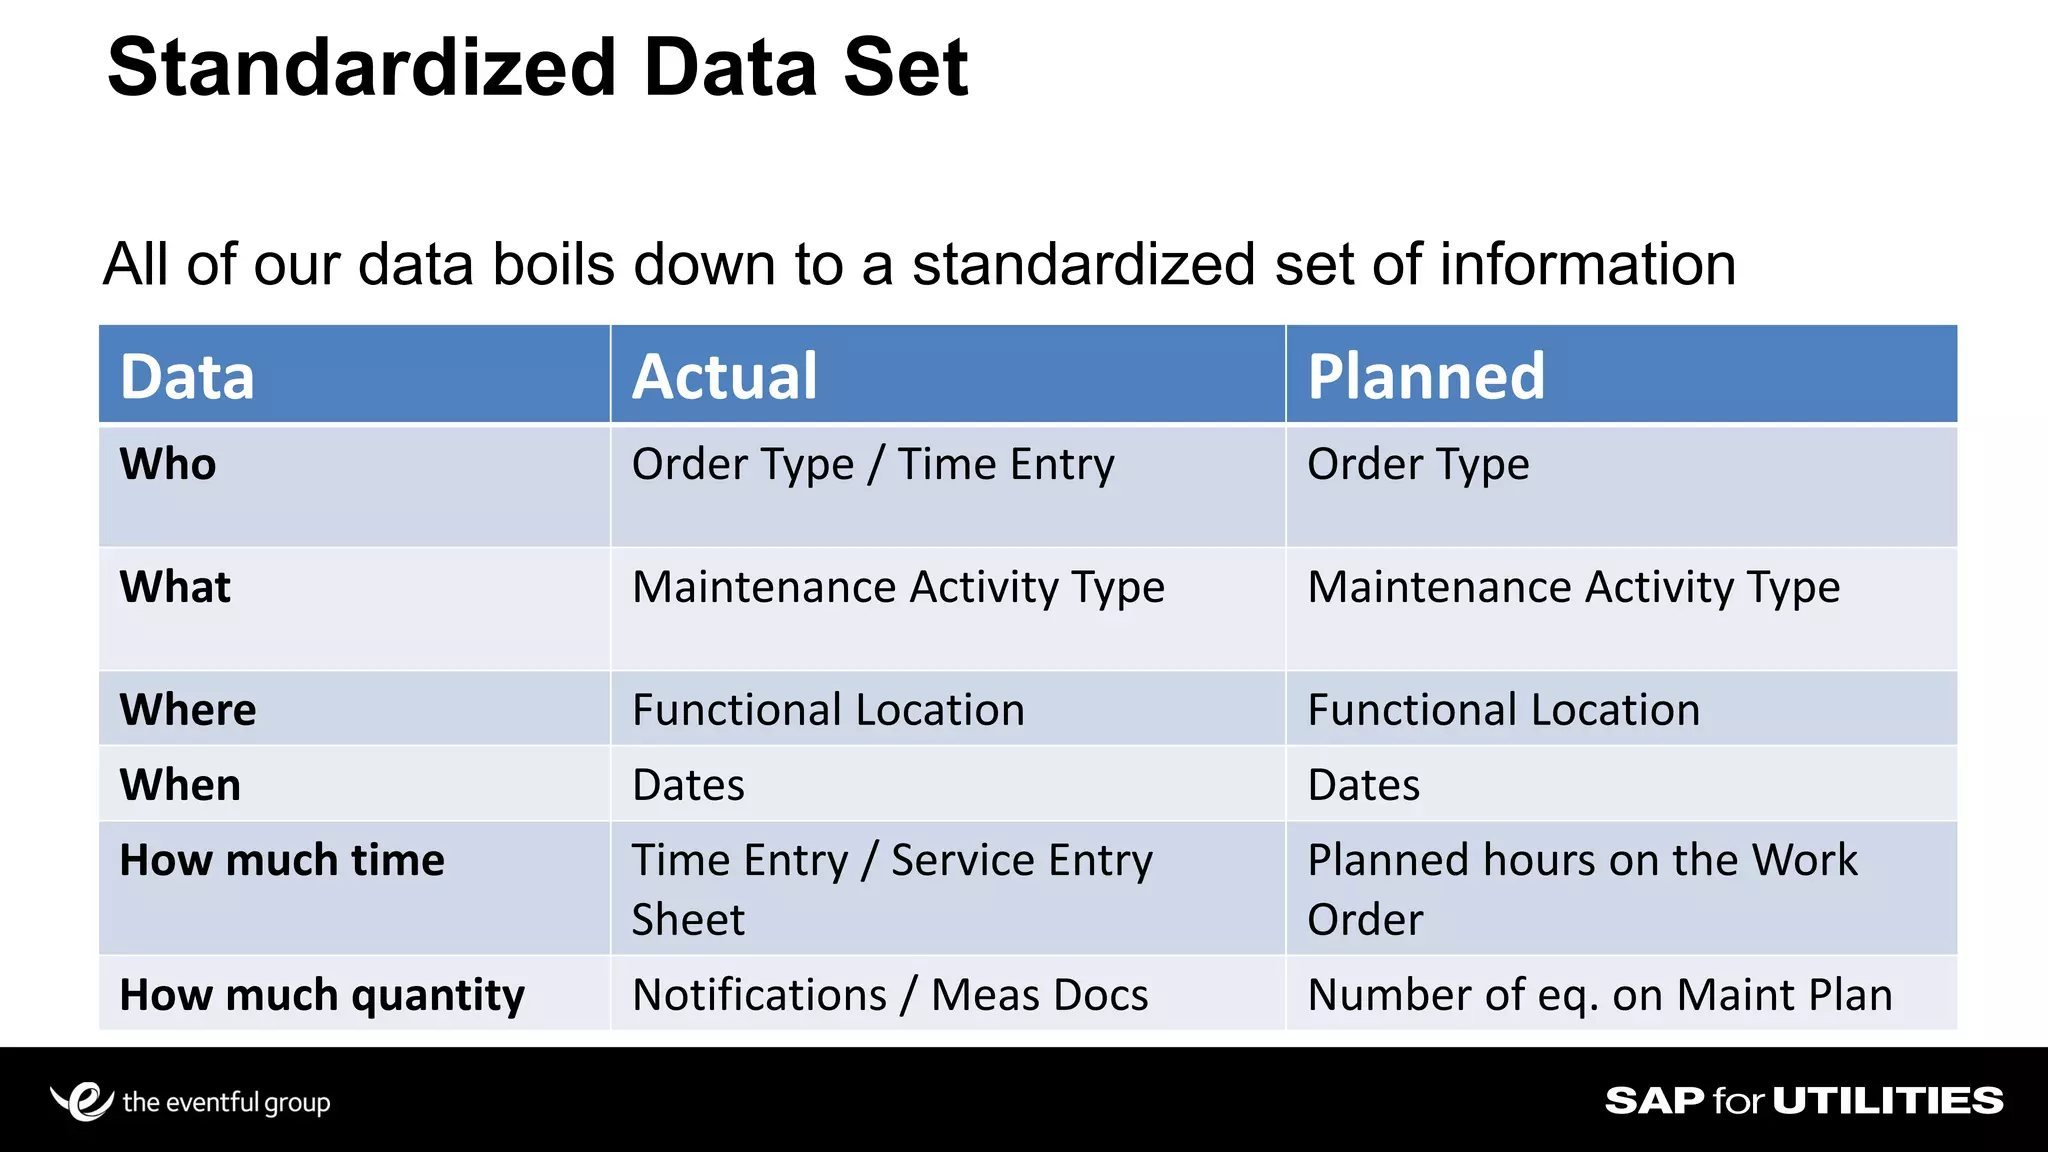
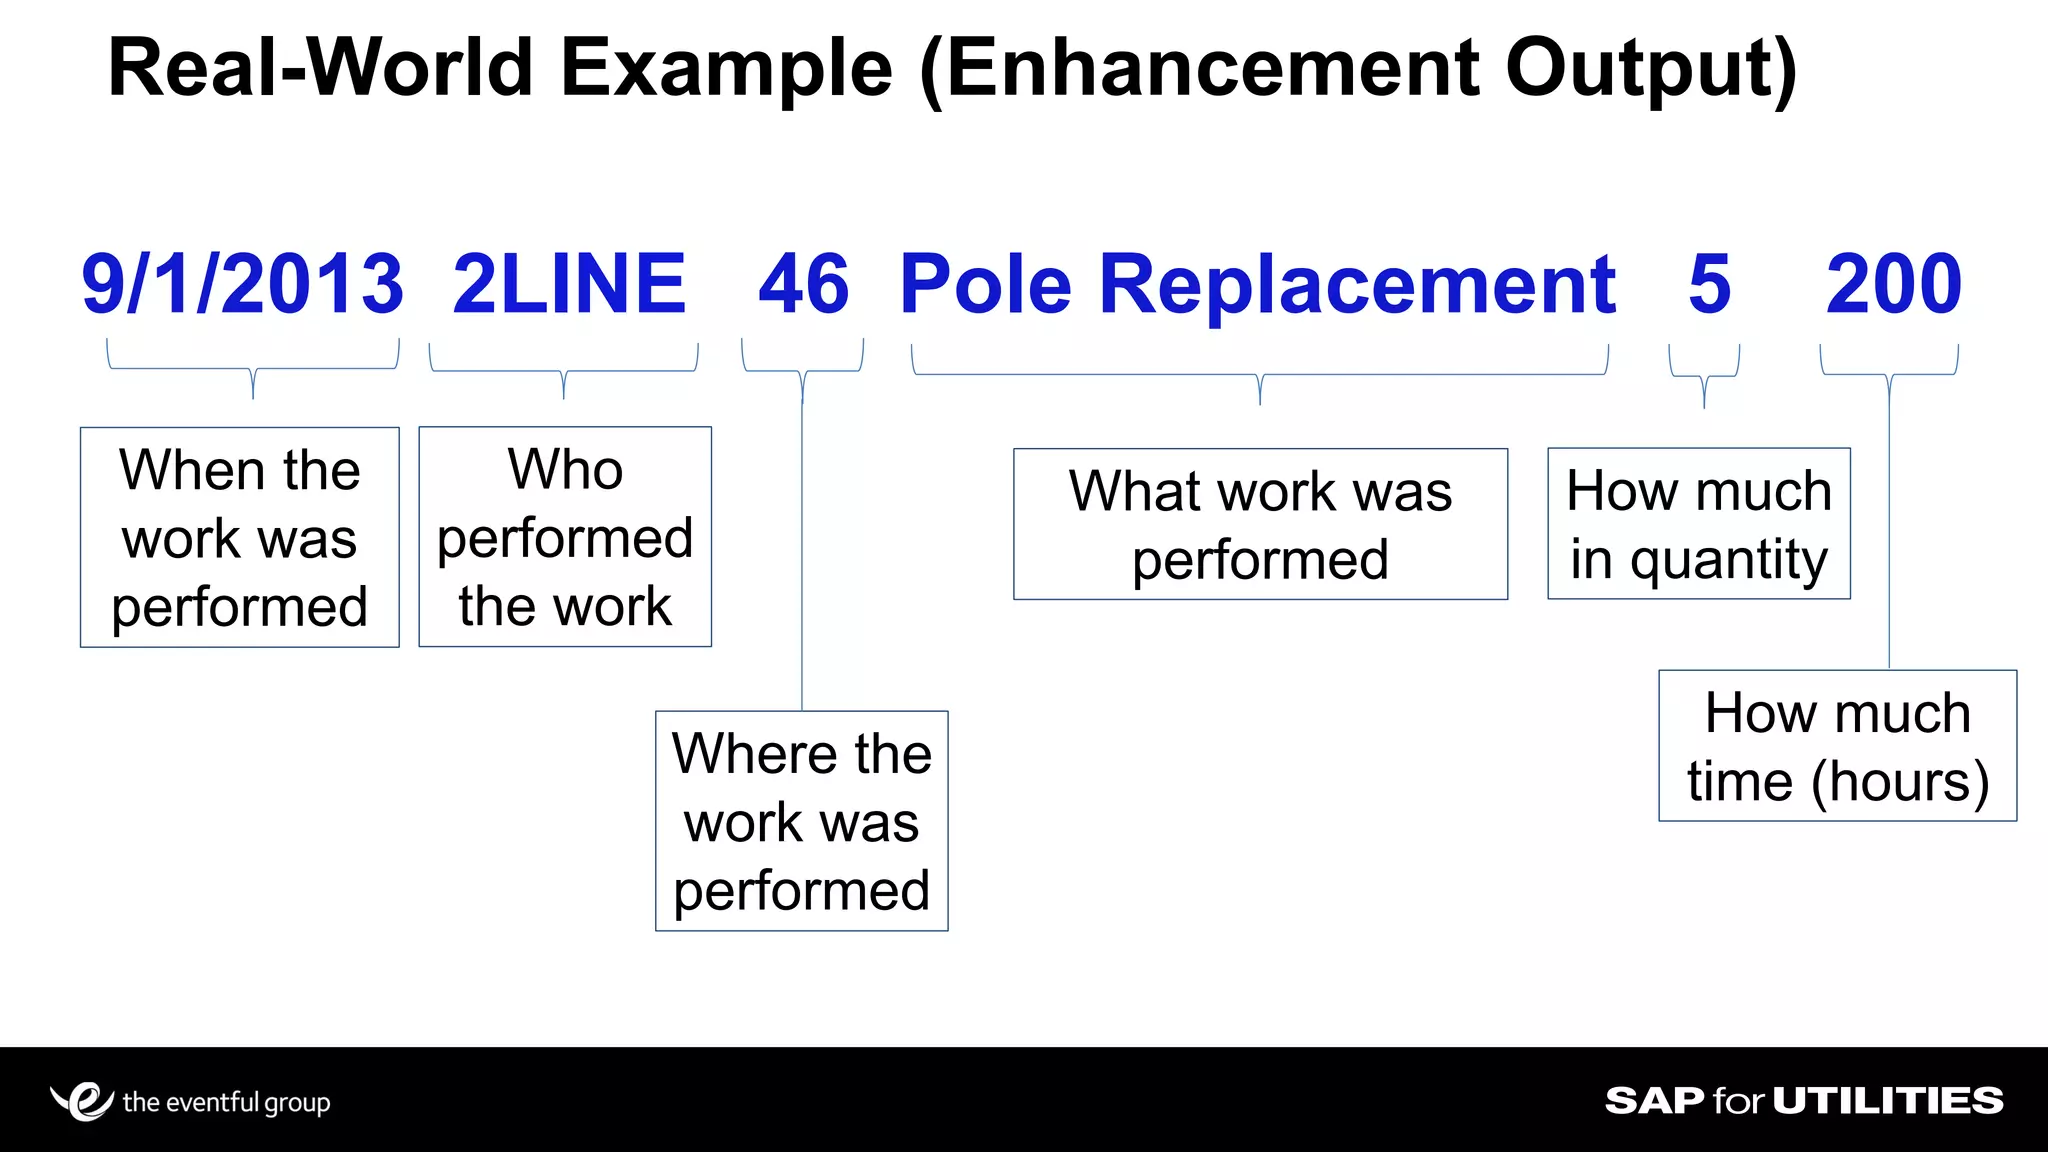
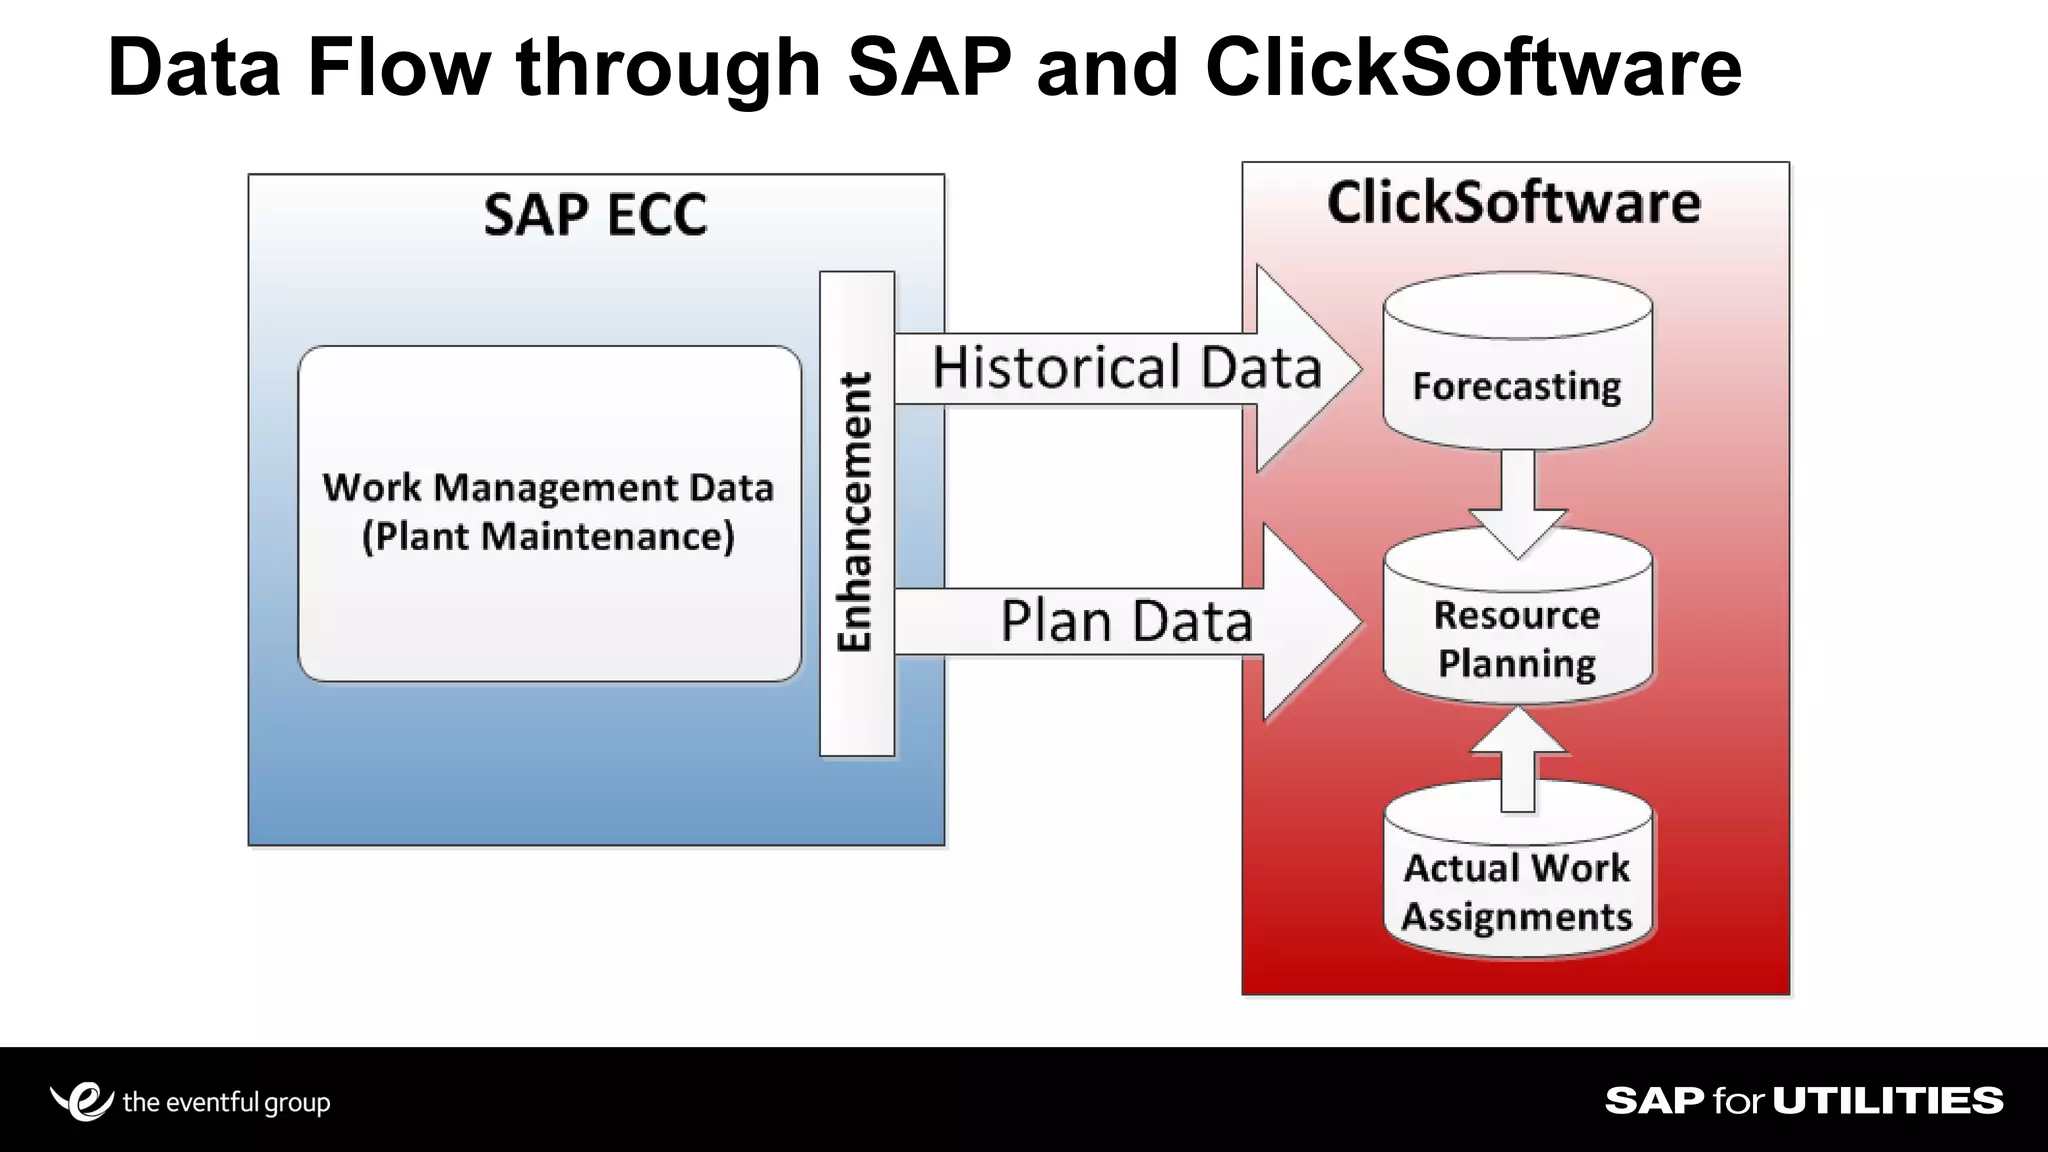
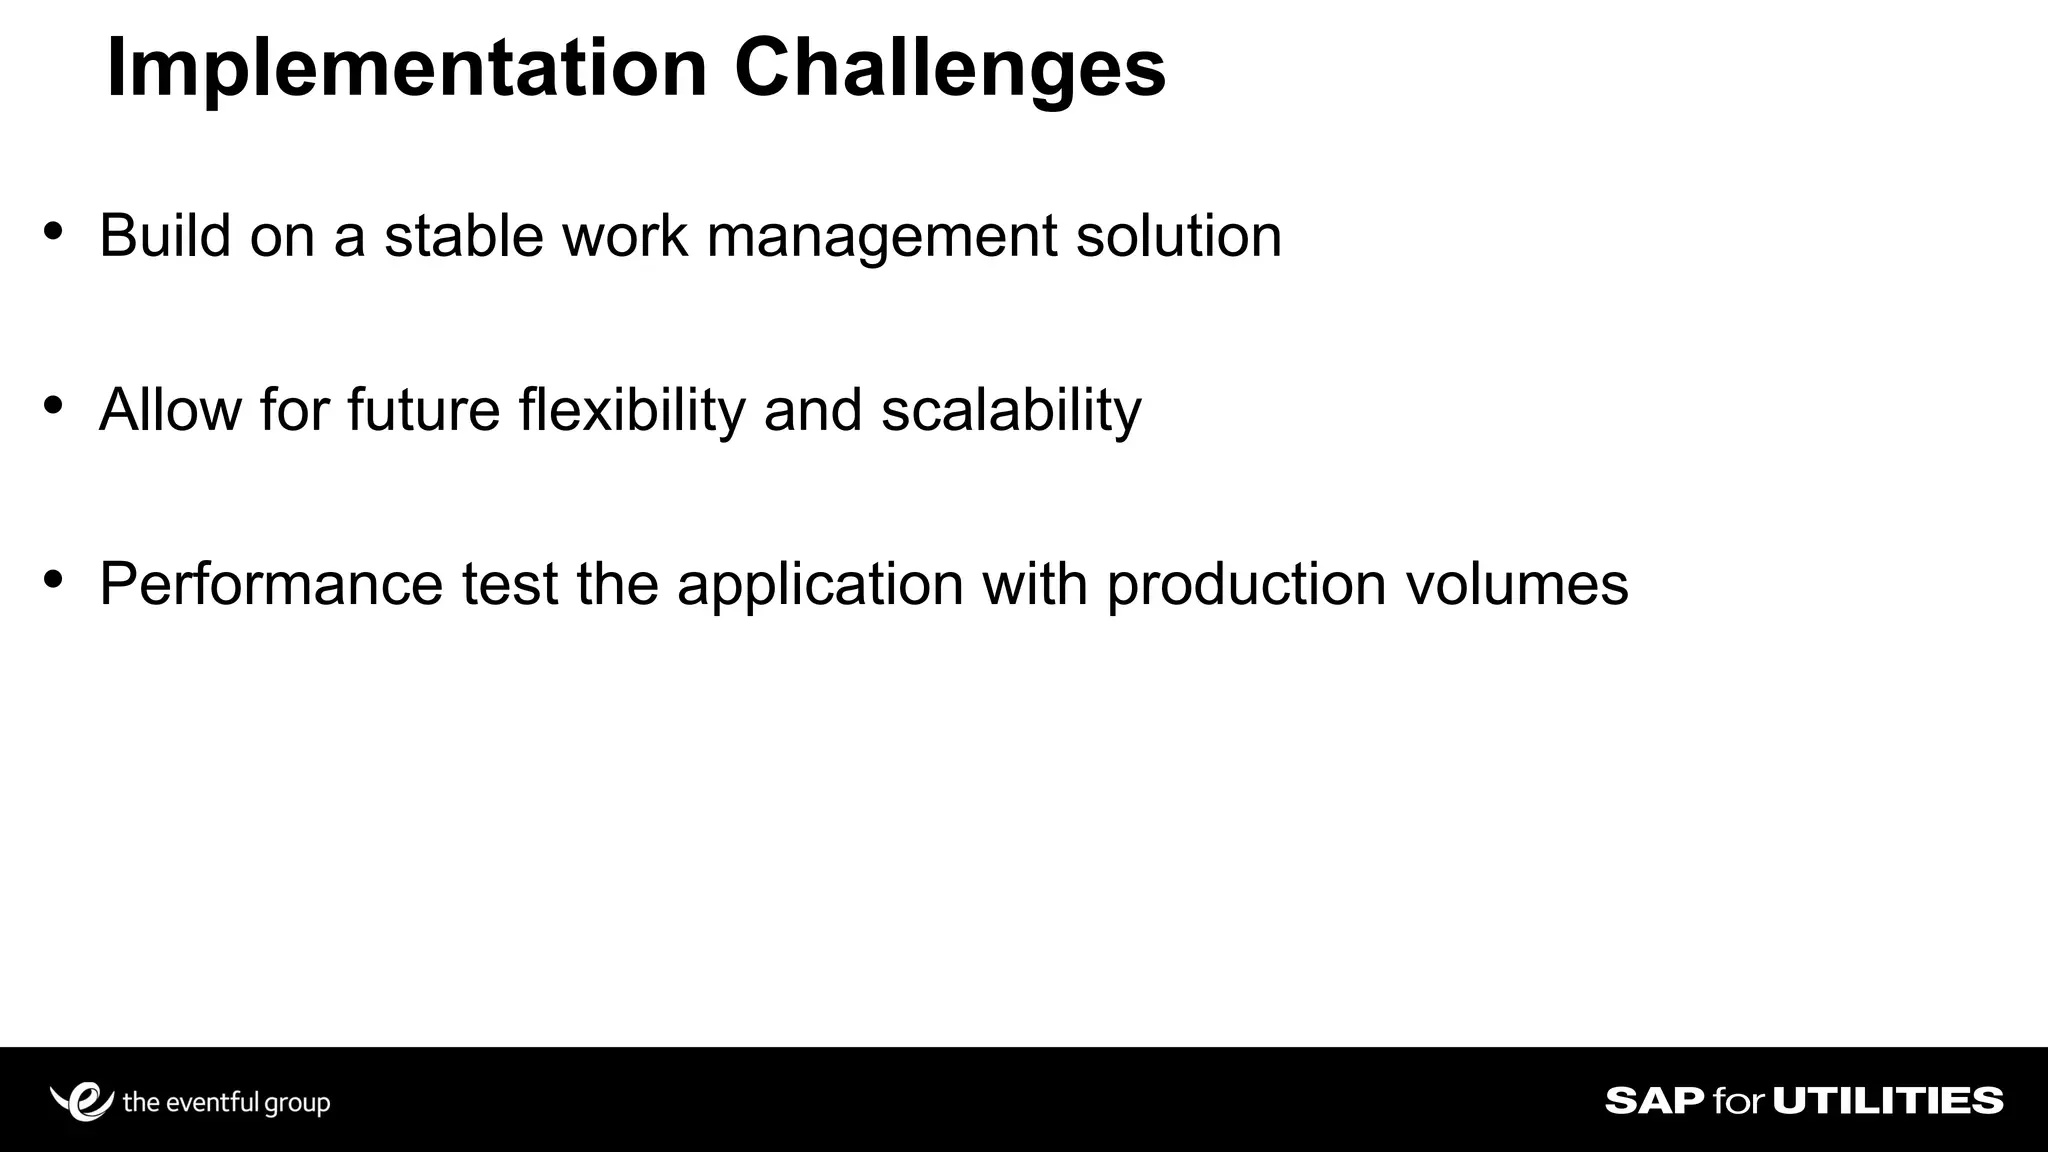
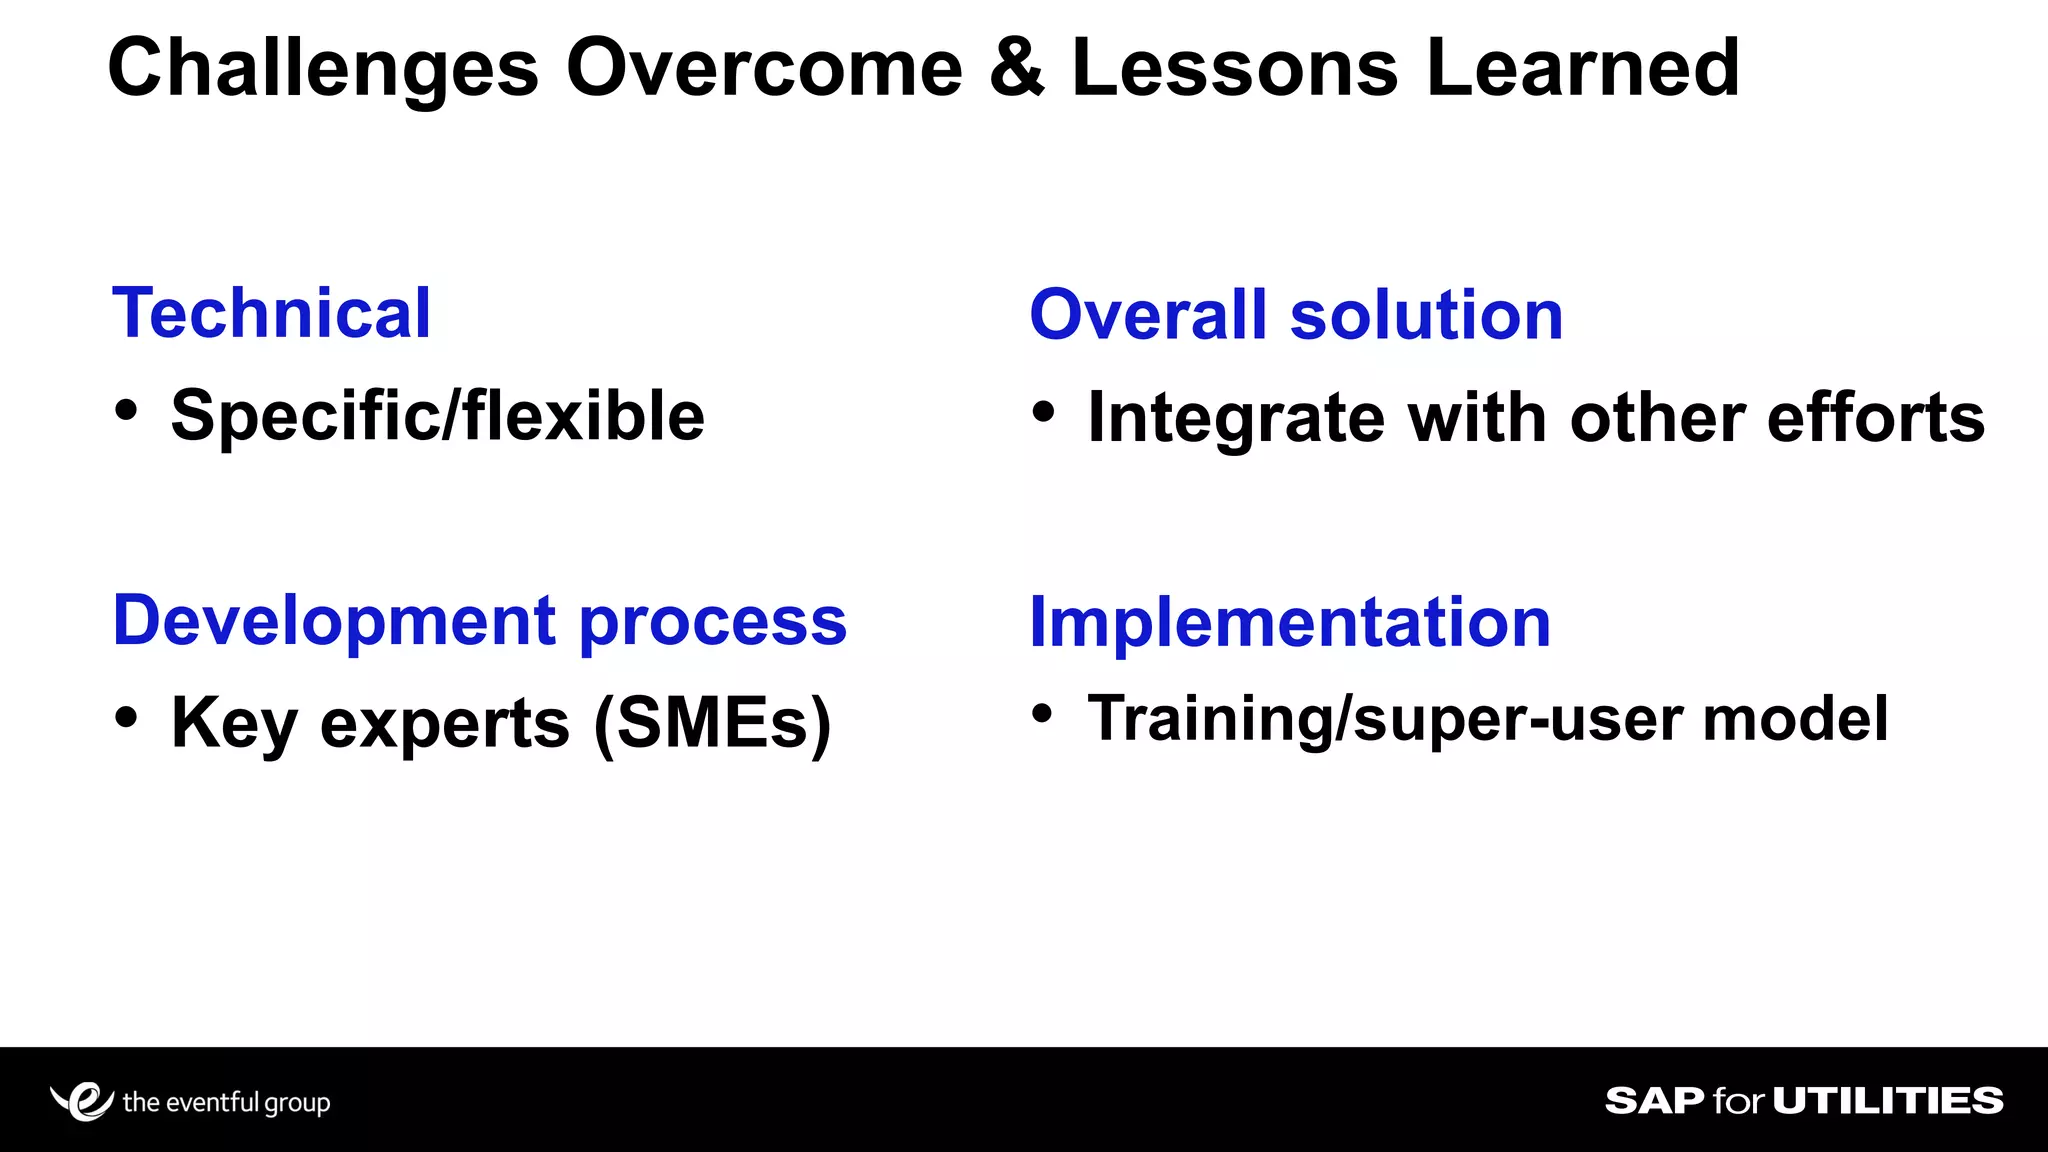
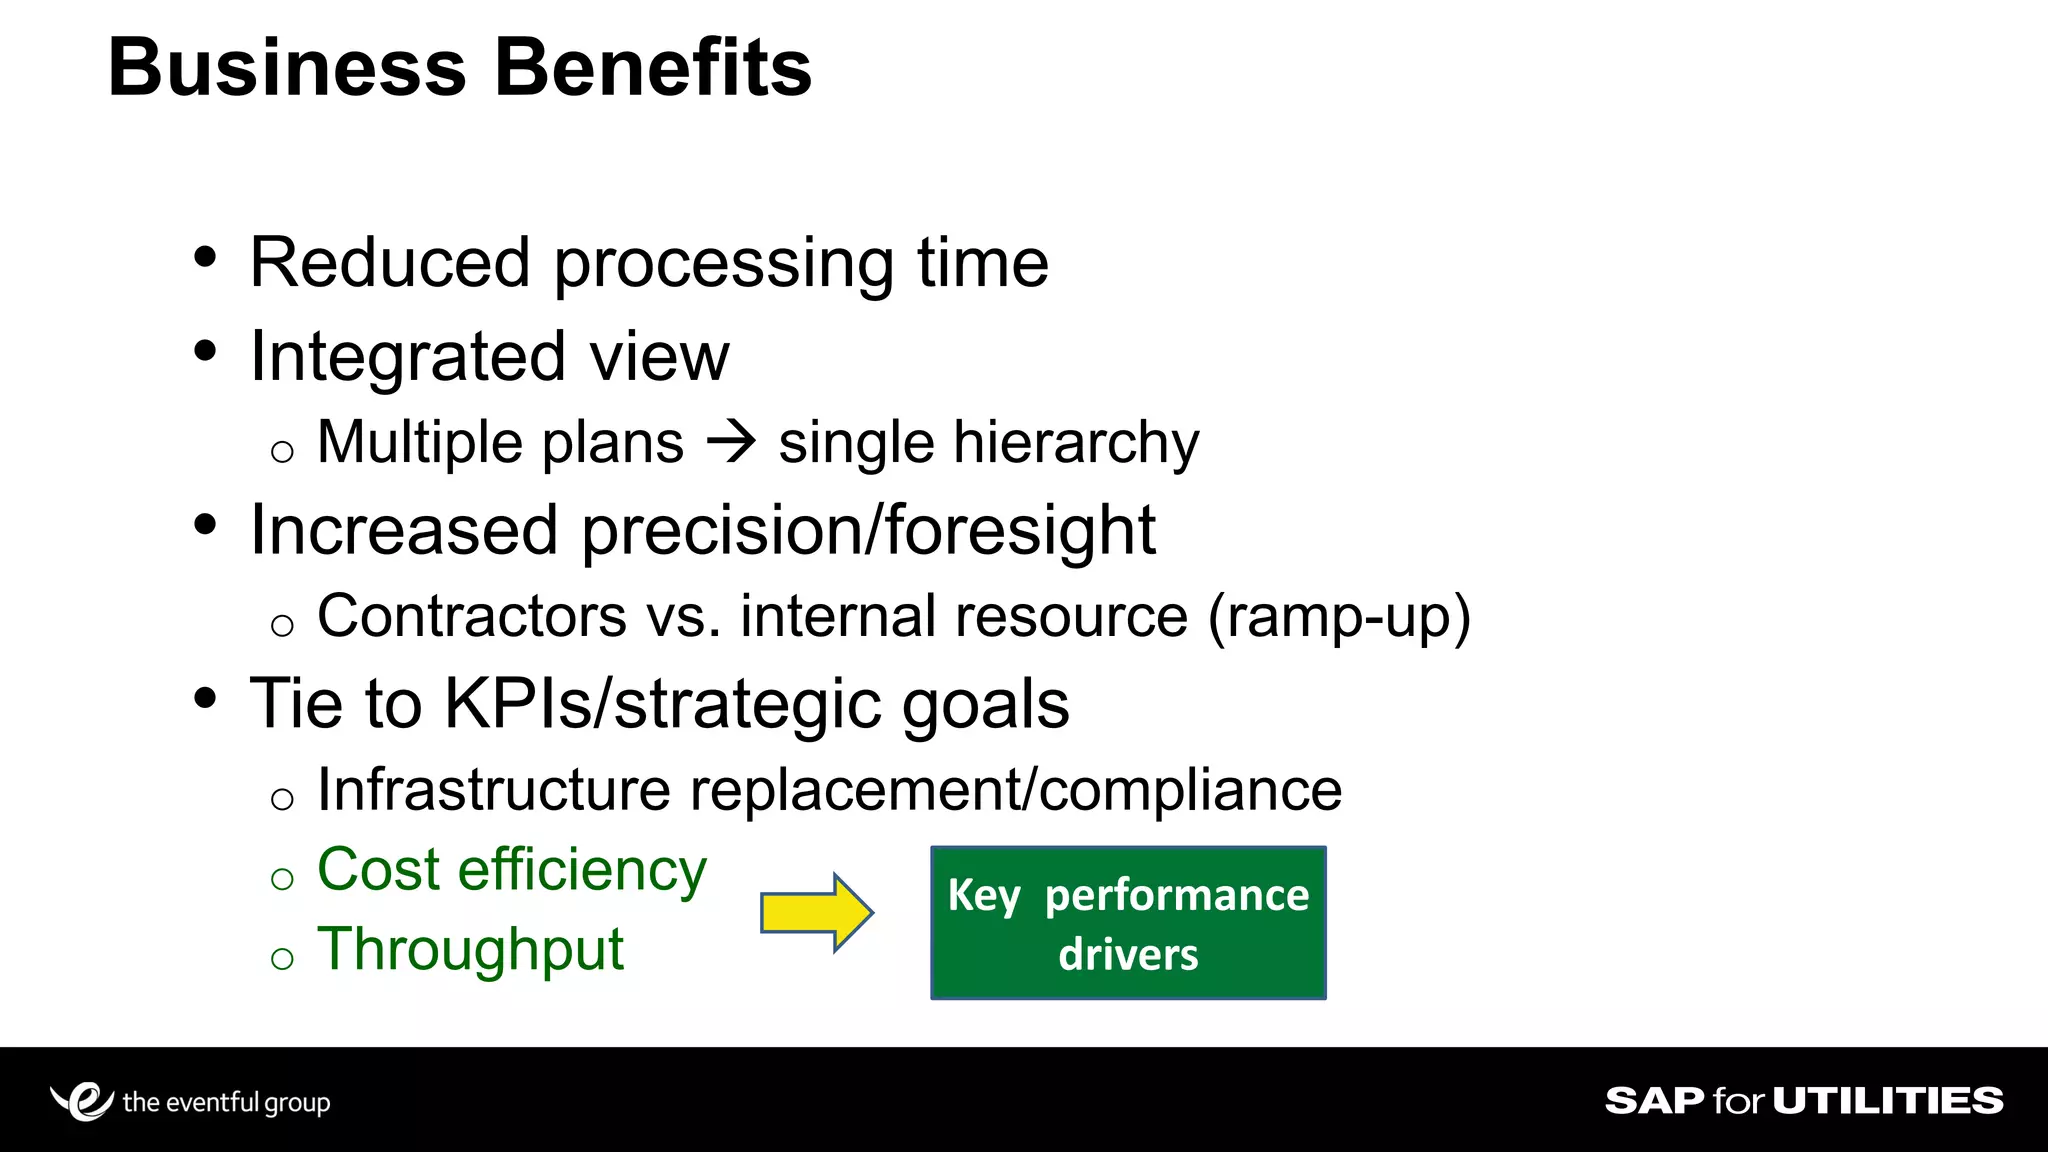
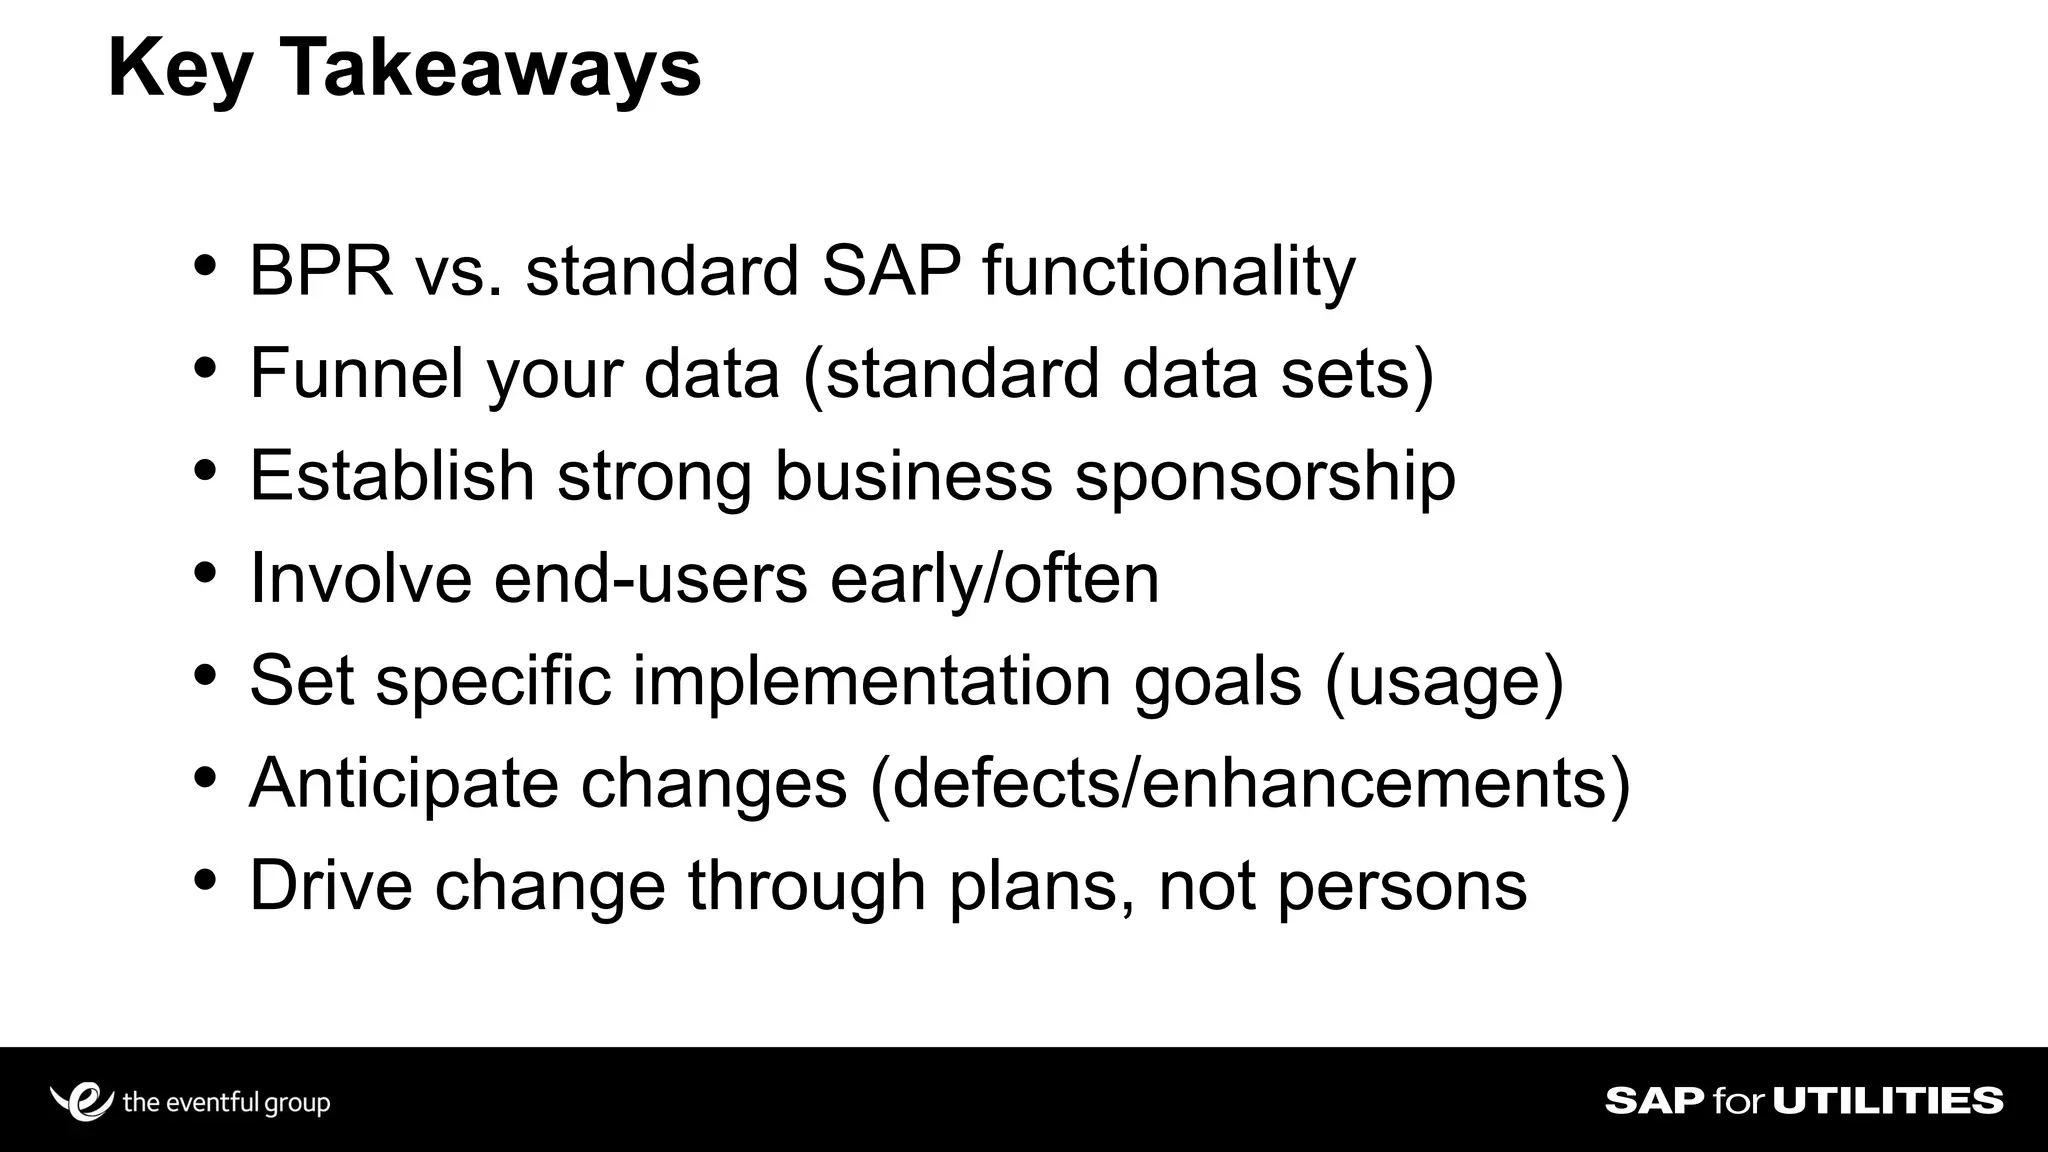
A collaboration of:
How to analyze your SAP Work Management
Data and Optimize your Workforce
Joseph Conti
Southern California Edison
Dennis Tu
Deloitte Consulting
• One of the nation’s largest
investor-owned electric utilities
• More than 13-million people served
across 50,000 square miles
• Approximately 16,000 employees
• Serves 400+ cities/communities
• Over 125 years of service
Southern California Edison (SCE)
3
Transmission & Distribution Business Unit (TDBU)
• Responsible for the delivery of safe, reliable power through
SCE's transmission, substation and distribution system
• ~3,200 field employees
• 4 Major Operational Business Lines (Power Delivery)
o Distribution
o Transmission
o Substation
o Grid Operations
Today’s focus
• Rate-challenged climate for SCE (and other utilities)
• The Rate Challenge Project
o Comprehensive effort to review and optimize SCE's cost structure and
operating efficiency as part of a company‐wide focus on operational
excellence (OpX)
• SAP ERP  WISER  Rate Challenge  OpX
• Resource planning and performance management
Time of transition
• Visibility – workloads (demands) and resources (capacity)
o Proactively optimize planning/scheduling/execution  end-to-end
• Increased precision/foresight – meeting goals/objectives
• Managing costs – contractor / overtime usage
• Forecasting – historical/future demands  baseline plans
• Plan vs. Actuals – compare actuals to plan and adjust
What is Resource Planning?
Resource Planning – a practitioner’s guide
6
• Tactical: compare plan vs. actual for specific demands
against future periods to identify gaps
• Tactical: compare plan vs. actual for demands that may
or may not have been completed
• Strategic: compare plan vs. actual for completed work
 Adjust plan to close gap
 Re-prioritize demands/re-allocate resources
 Refine forecasts  re-baseline  refine plans
SCE TDBU Resource Planning Vision
7
Operational
Tactical
Scheduling
Coordinators/Supervisors
Scheduling Procedures
for Click Soft
3-Week
Scheduling Window
ClickSchedule
Scheduling
Metrics
C TeamsDistrict
Resource Plans
Relative
Performance
Strategic
SC & M
5/10 yr.
Plan
E&TS
5/10 yr.
Plan
Vehicle
Strategy
Design
5/10 yr.
Plan
Trans
5/10 yr.
Plan
Contractor
Strategy
DCM
5/10 yr.
Plan
Grid Ops
5/10 yr.
Plan
Facility
Strategy
Labor
Strategy
PWRD
5/10 yr.
Plan
GRC Strategy
& Resource Planning
TDBU
Bus.
Strategy
& Plan
E&TS
Res. Plan
PWRD
Res. Plan
Grid Ops
SOLO Plan
Trans
RW Res. Plan
DCM
Civil Res. Plan
Design
Res. Plan
DCM
Res. Plan
SC&M
Res. Plan
Trans
Res. Plan
Grid Ops
Res. Plan
Trans
Design Plan
Grid Ops
Sub Plan
Performance
Management
Finance
Links to R.P
Resource
planning
arena
8
T
O
S
Operational Plans/Apps
Resource Plans
& Applications
Enabling the Vision – Now and Into the Future
Business Strategy
& Goals
9
T
O
SStrategic
Operational
Tactical
Integrated Performance Management
Alignment towards Company objectives
• Resource Planning & Performance Management
• Performance Management & Analysis
o Dedicated
o Independent
o Technical capability
o Key stewardship
Analytics is Key
10
function
group
How do we achieve this vision?
Overview of SAP Work Management
Initiate Plan Schedule Execute Close
Overview of SAP Work Management
Initiate Plan Schedule Execute Close
Notification
Work Order
Maintenance Plan
Service Entry Sheets
Time Entry
Measurement Docs
2-Step Filtering Process
SAP Work Management Data
Planned vs. Actual
Categorization of Work
• Actual Work
o Notifications that are completed
o Measurement Docs
o Service Entry Sheets
o Time Entry
• Planned Work
o Maintenance Plans
o Work Orders that are open
Planned vs. Actual Data
• Who
• What
• Where
• When
• How much (time and quantity)
Categorization of Work
Data Actual Planned
Who Order Type / Time Entry Order Type
What Maintenance Activity Type Maintenance Activity Type
Where Functional Location Functional Location
When Dates Dates
How much time Time Entry / Service Entry
Sheet
Planned hours on the Work
Order
How much quantity Notifications / Meas Docs Number of eq. on Maint Plan
Standardized Data Set
All of our data boils down to a standardized set of information
9/1/2013 2LINE 46 Pole Replacement 5 200
Real-World Example (Enhancement Output)
Slide 18
When the
work was
performed
Who
performed
the work
Where the
work was
performed
What work was
performed
How much
time (hours)
How much
in quantity
Data Flow through SAP and ClickSoftware
Slide 19
• Build on a stable work management solution
• Allow for future flexibility and scalability
• Performance test the application with production volumes
Implementation Challenges
Slide 20
Challenges Overcome & Lessons Learned
Technical
• Specific/flexible
Development process
• Key experts (SMEs)
Overall solution
• Integrate with other efforts
Implementation
• Training/super-user model
• Reduced processing time
• Integrated view
o Multiple plans  single hierarchy
• Increased precision/foresight
o Contractors vs. internal resource (ramp-up)
• Tie to KPIs/strategic goals
o Infrastructure replacement/compliance
o Cost efficiency
o Throughput
Business Benefits
Key performance
drivers
Key Takeaways
• BPR vs. standard SAP functionality
• Funnel your data (standard data sets)
• Establish strong business sponsorship
• Involve end-users early/often
• Set specific implementation goals (usage)
• Anticipate changes (defects/enhancements)
• Drive change through plans, not persons
A collaboration of:
Joseph Conti
Southern California Edison
Joseph.Conti@sce.com
Dennis Tu
Deloitte Consulting
detu@deloitte.com

How to analyze your sap data and optimize your workforce

  • 1.
    A collaboration of: Howto analyze your SAP Work Management Data and Optimize your Workforce Joseph Conti Southern California Edison Dennis Tu Deloitte Consulting
  • 2.
    • One ofthe nation’s largest investor-owned electric utilities • More than 13-million people served across 50,000 square miles • Approximately 16,000 employees • Serves 400+ cities/communities • Over 125 years of service Southern California Edison (SCE)
  • 3.
    3 Transmission & DistributionBusiness Unit (TDBU) • Responsible for the delivery of safe, reliable power through SCE's transmission, substation and distribution system • ~3,200 field employees • 4 Major Operational Business Lines (Power Delivery) o Distribution o Transmission o Substation o Grid Operations Today’s focus
  • 4.
    • Rate-challenged climatefor SCE (and other utilities) • The Rate Challenge Project o Comprehensive effort to review and optimize SCE's cost structure and operating efficiency as part of a company‐wide focus on operational excellence (OpX) • SAP ERP  WISER  Rate Challenge  OpX • Resource planning and performance management Time of transition
  • 5.
    • Visibility –workloads (demands) and resources (capacity) o Proactively optimize planning/scheduling/execution  end-to-end • Increased precision/foresight – meeting goals/objectives • Managing costs – contractor / overtime usage • Forecasting – historical/future demands  baseline plans • Plan vs. Actuals – compare actuals to plan and adjust What is Resource Planning?
  • 6.
    Resource Planning –a practitioner’s guide 6 • Tactical: compare plan vs. actual for specific demands against future periods to identify gaps • Tactical: compare plan vs. actual for demands that may or may not have been completed • Strategic: compare plan vs. actual for completed work  Adjust plan to close gap  Re-prioritize demands/re-allocate resources  Refine forecasts  re-baseline  refine plans
  • 7.
    SCE TDBU ResourcePlanning Vision 7 Operational Tactical Scheduling Coordinators/Supervisors Scheduling Procedures for Click Soft 3-Week Scheduling Window ClickSchedule Scheduling Metrics C TeamsDistrict Resource Plans Relative Performance Strategic SC & M 5/10 yr. Plan E&TS 5/10 yr. Plan Vehicle Strategy Design 5/10 yr. Plan Trans 5/10 yr. Plan Contractor Strategy DCM 5/10 yr. Plan Grid Ops 5/10 yr. Plan Facility Strategy Labor Strategy PWRD 5/10 yr. Plan GRC Strategy & Resource Planning TDBU Bus. Strategy & Plan E&TS Res. Plan PWRD Res. Plan Grid Ops SOLO Plan Trans RW Res. Plan DCM Civil Res. Plan Design Res. Plan DCM Res. Plan SC&M Res. Plan Trans Res. Plan Grid Ops Res. Plan Trans Design Plan Grid Ops Sub Plan Performance Management Finance Links to R.P Resource planning arena
  • 8.
    8 T O S Operational Plans/Apps Resource Plans &Applications Enabling the Vision – Now and Into the Future Business Strategy & Goals
  • 9.
  • 10.
    • Resource Planning& Performance Management • Performance Management & Analysis o Dedicated o Independent o Technical capability o Key stewardship Analytics is Key 10 function group
  • 11.
    How do weachieve this vision?
  • 12.
    Overview of SAPWork Management Initiate Plan Schedule Execute Close
  • 13.
    Overview of SAPWork Management Initiate Plan Schedule Execute Close Notification Work Order Maintenance Plan Service Entry Sheets Time Entry Measurement Docs
  • 14.
    2-Step Filtering Process SAPWork Management Data Planned vs. Actual Categorization of Work
  • 15.
    • Actual Work oNotifications that are completed o Measurement Docs o Service Entry Sheets o Time Entry • Planned Work o Maintenance Plans o Work Orders that are open Planned vs. Actual Data
  • 16.
    • Who • What •Where • When • How much (time and quantity) Categorization of Work
  • 17.
    Data Actual Planned WhoOrder Type / Time Entry Order Type What Maintenance Activity Type Maintenance Activity Type Where Functional Location Functional Location When Dates Dates How much time Time Entry / Service Entry Sheet Planned hours on the Work Order How much quantity Notifications / Meas Docs Number of eq. on Maint Plan Standardized Data Set All of our data boils down to a standardized set of information
  • 18.
    9/1/2013 2LINE 46Pole Replacement 5 200 Real-World Example (Enhancement Output) Slide 18 When the work was performed Who performed the work Where the work was performed What work was performed How much time (hours) How much in quantity
  • 19.
    Data Flow throughSAP and ClickSoftware Slide 19
  • 20.
    • Build ona stable work management solution • Allow for future flexibility and scalability • Performance test the application with production volumes Implementation Challenges Slide 20
  • 21.
    Challenges Overcome &Lessons Learned Technical • Specific/flexible Development process • Key experts (SMEs) Overall solution • Integrate with other efforts Implementation • Training/super-user model
  • 22.
    • Reduced processingtime • Integrated view o Multiple plans  single hierarchy • Increased precision/foresight o Contractors vs. internal resource (ramp-up) • Tie to KPIs/strategic goals o Infrastructure replacement/compliance o Cost efficiency o Throughput Business Benefits Key performance drivers
  • 23.
    Key Takeaways • BPRvs. standard SAP functionality • Funnel your data (standard data sets) • Establish strong business sponsorship • Involve end-users early/often • Set specific implementation goals (usage) • Anticipate changes (defects/enhancements) • Drive change through plans, not persons
  • 24.
    A collaboration of: JosephConti Southern California Edison Joseph.Conti@sce.com Dennis Tu Deloitte Consulting detu@deloitte.com