Download to read offline
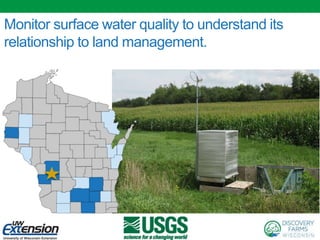
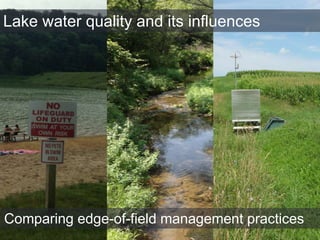
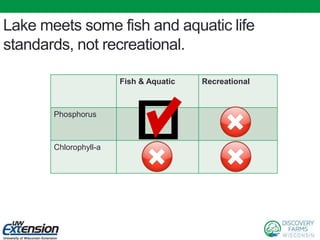
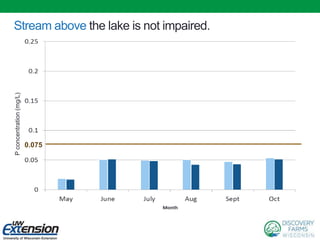
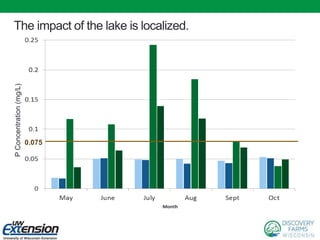
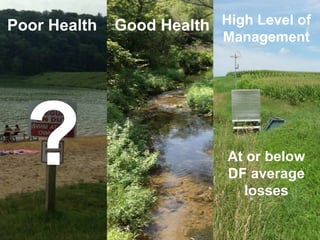
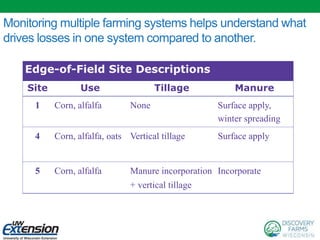
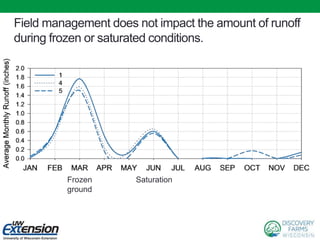
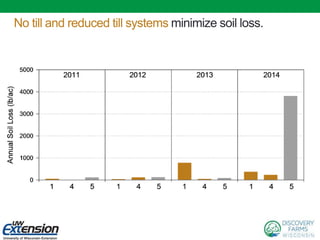
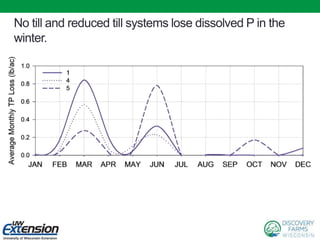

This document summarizes the results of a study monitoring water quality in the Jersey Valley Watershed. Key findings include: - The lake meets some but not all fish, aquatic life, and recreational water quality standards. - Phosphorus levels in streams entering the lake do not exceed standards. - The impact of the lake on water quality appears to be localized. - Different edge-of-field farming systems were compared, and no-till and reduced till systems were found to minimize soil loss and lose less dissolved phosphorus in winter. - Field management practices did not impact runoff amounts during frozen or saturated soil conditions.


