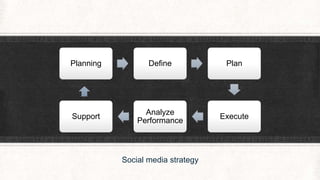
Social media in 2014 
Presentation by Majid Mahmood
Table of content 
 Introduction 
Facebook 
 Instagram 
Twitter 
 Google + 
YouTube 
Tumblr 
WordPress 
 Pinterest 
 LinkedIn 
 Flickr
Introduction 
People and business are using social media but what is the social 
media landscape now?
Facebook 
 June 2014: 829 Million Daily active users on average 
 June 2014: 654 million mobile daily active users on average 
 1.32 billion monthly active users as of June 30, 2014 
 1.07 billion mobile monthly active users as of June 30, 2014 
 Approximately 81.7% of daily active users are outside the US and Canada 
Source: http://newsroom.fb.com/company-info/
Instagram 
 200M Monthly Active users 
 65%+ People Outside U.S. 
 20Billion Photos Shared 
 1.6Billion Likes Daily 
 60Million Average Photos Per Day 
Source: http://instagram.com/press/
Twitter 
 271 million monthly active users 
 500 million Tweets are sent per day 
 78% of Twitter active users are on mobile 
 77% of accounts are outside the U.S. 
 Twitter supports 35+ languages 
 Vine: More than 40 million users 
Source: https://about.twitter.com/company
Google + 
 540 million active users 
 61% of brands have Google + page 
 The +1 button is pressed 5 billion times a day 
Source: https://leveragenewagemedia.com/blog/wp-content/uploads/2013/12/Social-infographic_2014.png 
http://www.dotdash.ie/who-is-using-google-plus 
http://www.socialmediadelivered.com/2012/08/16/whats-cool-about-google-infographic/
YouTube 
 1 billion + unique users visit YouTube each month 
 6 billion + hours of video are watched each month on YouTube—that's almost 
an hour for every person on Earth 
 100 hours of video are uploaded to YouTube every minute 
 80% of YouTube traffic comes from outside the US 
 YouTube is localized in 61 countries and across 61 languages 
 First video uploaded to YouTube titled “Me at the Zoo” on 23 April 2005 
Source: https://www.youtube.com/yt/press/statistics.html 
http://www.designinfographics.com/social-media-infographics/youtube-facts-figures
Tumblr 
 207.2 million blogs 
 93.7 billion posts 
 Found in 2007 
 120,000 new blogs per day 
 38,000 posts per minute 
 Average user spends 23 minutes on Tumblr 
Source: www.tumblr.com 
http://www.iambuckingham.com/xtumblebot-tumblr-bot-review/ 
http://www.jeffbullas.com/2011/11/28/social-media-marketing-10-inspiring-infographics/
WordPress 
 Over 409 million people view blogs on Wordpress.com 
 16.3 Billion number of page views across blogs published on Wordpress.com in 
September 2014 
 61.8 Million posts done on blogs published on Wordpress.com in September 2014 
 6.2 Million pages published on blogs published on Wordpress.com in September 
2014 
 55.4 Million comments published on blogs on Wordpress.com in September 2014 
 24.7 Million files uploaded on blogs on Wordpress.com in September 2014 
Source: http://en.wordpress.com/stats/ 
http://en.wordpress.com/stats/traffic/ 
https://wordpress.com/stats/posting/
Pinterest 
 70 million active users 
 80 % users are women 
 Average time spent on Pinterest per month: 98 minutes 
 80 % + pins are repin 
 15.5 % time is spent repining 
Source: http://www.modea.com/blog/pinterest-infographic 
http://socialfresh.com/pinterest-users/
LinkedIn 
 313 Million registered users 
 5.7 + billion professionally-oriented searches on the platform in 2012. 
 3 million + companies have LinkedIn Company Pages. 
 More than 1.5 million unique publishers actively using the LinkedIn Share button 
on their sites to send content into the LinkedIn platform. 
 LinkedIn members are sharing insights and knowledge in more than 2.1 million 
LinkedIn Groups. 
 In the second quarter of 2014, mobile accounted for 45 percent of unique visiting 
members to LinkedIn. 
Source: http://press.linkedin.com/about
Flickr 
 2500 + images uploaded every minute 
 292 Million Geo tagged images 
 228 Million Creative Common licensed pictures 
 Over 3 million pictures uploaded every day 
 Over 7.2 Billion images uploaded to Flickr 
 Source: http://www.newsilike.in/infographics/flickr-trend-report-2012/
Social media is constantly growing 
There is a need that companies use social 
media in a smart manner by developing 
strategies. 
Always analyze any strategy you have and 
do not forget to define your audience
Social media can be used to 
promote business and create 
a stronger brand image.
Planning Define Plan 
Social media strategy 
Execute 
Analyze 
Performance 
Support
Thank you

How does social media look like in 2014?

  • 1.
    Social media in2014 Presentation by Majid Mahmood
  • 2.
    Table of content  Introduction Facebook  Instagram Twitter  Google + YouTube Tumblr WordPress  Pinterest  LinkedIn  Flickr
  • 3.
    Introduction People andbusiness are using social media but what is the social media landscape now?
  • 4.
    Facebook  June2014: 829 Million Daily active users on average  June 2014: 654 million mobile daily active users on average  1.32 billion monthly active users as of June 30, 2014  1.07 billion mobile monthly active users as of June 30, 2014  Approximately 81.7% of daily active users are outside the US and Canada Source: http://newsroom.fb.com/company-info/
  • 5.
    Instagram  200MMonthly Active users  65%+ People Outside U.S.  20Billion Photos Shared  1.6Billion Likes Daily  60Million Average Photos Per Day Source: http://instagram.com/press/
  • 6.
    Twitter  271million monthly active users  500 million Tweets are sent per day  78% of Twitter active users are on mobile  77% of accounts are outside the U.S.  Twitter supports 35+ languages  Vine: More than 40 million users Source: https://about.twitter.com/company
  • 7.
    Google + 540 million active users  61% of brands have Google + page  The +1 button is pressed 5 billion times a day Source: https://leveragenewagemedia.com/blog/wp-content/uploads/2013/12/Social-infographic_2014.png http://www.dotdash.ie/who-is-using-google-plus http://www.socialmediadelivered.com/2012/08/16/whats-cool-about-google-infographic/
  • 8.
    YouTube  1billion + unique users visit YouTube each month  6 billion + hours of video are watched each month on YouTube—that's almost an hour for every person on Earth  100 hours of video are uploaded to YouTube every minute  80% of YouTube traffic comes from outside the US  YouTube is localized in 61 countries and across 61 languages  First video uploaded to YouTube titled “Me at the Zoo” on 23 April 2005 Source: https://www.youtube.com/yt/press/statistics.html http://www.designinfographics.com/social-media-infographics/youtube-facts-figures
  • 9.
    Tumblr  207.2million blogs  93.7 billion posts  Found in 2007  120,000 new blogs per day  38,000 posts per minute  Average user spends 23 minutes on Tumblr Source: www.tumblr.com http://www.iambuckingham.com/xtumblebot-tumblr-bot-review/ http://www.jeffbullas.com/2011/11/28/social-media-marketing-10-inspiring-infographics/
  • 10.
    WordPress  Over409 million people view blogs on Wordpress.com  16.3 Billion number of page views across blogs published on Wordpress.com in September 2014  61.8 Million posts done on blogs published on Wordpress.com in September 2014  6.2 Million pages published on blogs published on Wordpress.com in September 2014  55.4 Million comments published on blogs on Wordpress.com in September 2014  24.7 Million files uploaded on blogs on Wordpress.com in September 2014 Source: http://en.wordpress.com/stats/ http://en.wordpress.com/stats/traffic/ https://wordpress.com/stats/posting/
  • 11.
    Pinterest  70million active users  80 % users are women  Average time spent on Pinterest per month: 98 minutes  80 % + pins are repin  15.5 % time is spent repining Source: http://www.modea.com/blog/pinterest-infographic http://socialfresh.com/pinterest-users/
  • 12.
    LinkedIn  313Million registered users  5.7 + billion professionally-oriented searches on the platform in 2012.  3 million + companies have LinkedIn Company Pages.  More than 1.5 million unique publishers actively using the LinkedIn Share button on their sites to send content into the LinkedIn platform.  LinkedIn members are sharing insights and knowledge in more than 2.1 million LinkedIn Groups.  In the second quarter of 2014, mobile accounted for 45 percent of unique visiting members to LinkedIn. Source: http://press.linkedin.com/about
  • 13.
    Flickr  2500+ images uploaded every minute  292 Million Geo tagged images  228 Million Creative Common licensed pictures  Over 3 million pictures uploaded every day  Over 7.2 Billion images uploaded to Flickr  Source: http://www.newsilike.in/infographics/flickr-trend-report-2012/
  • 14.
    Social media isconstantly growing There is a need that companies use social media in a smart manner by developing strategies. Always analyze any strategy you have and do not forget to define your audience
  • 15.
    Social media canbe used to promote business and create a stronger brand image.
  • 16.
    Planning Define Plan Social media strategy Execute Analyze Performance Support
  • 17.