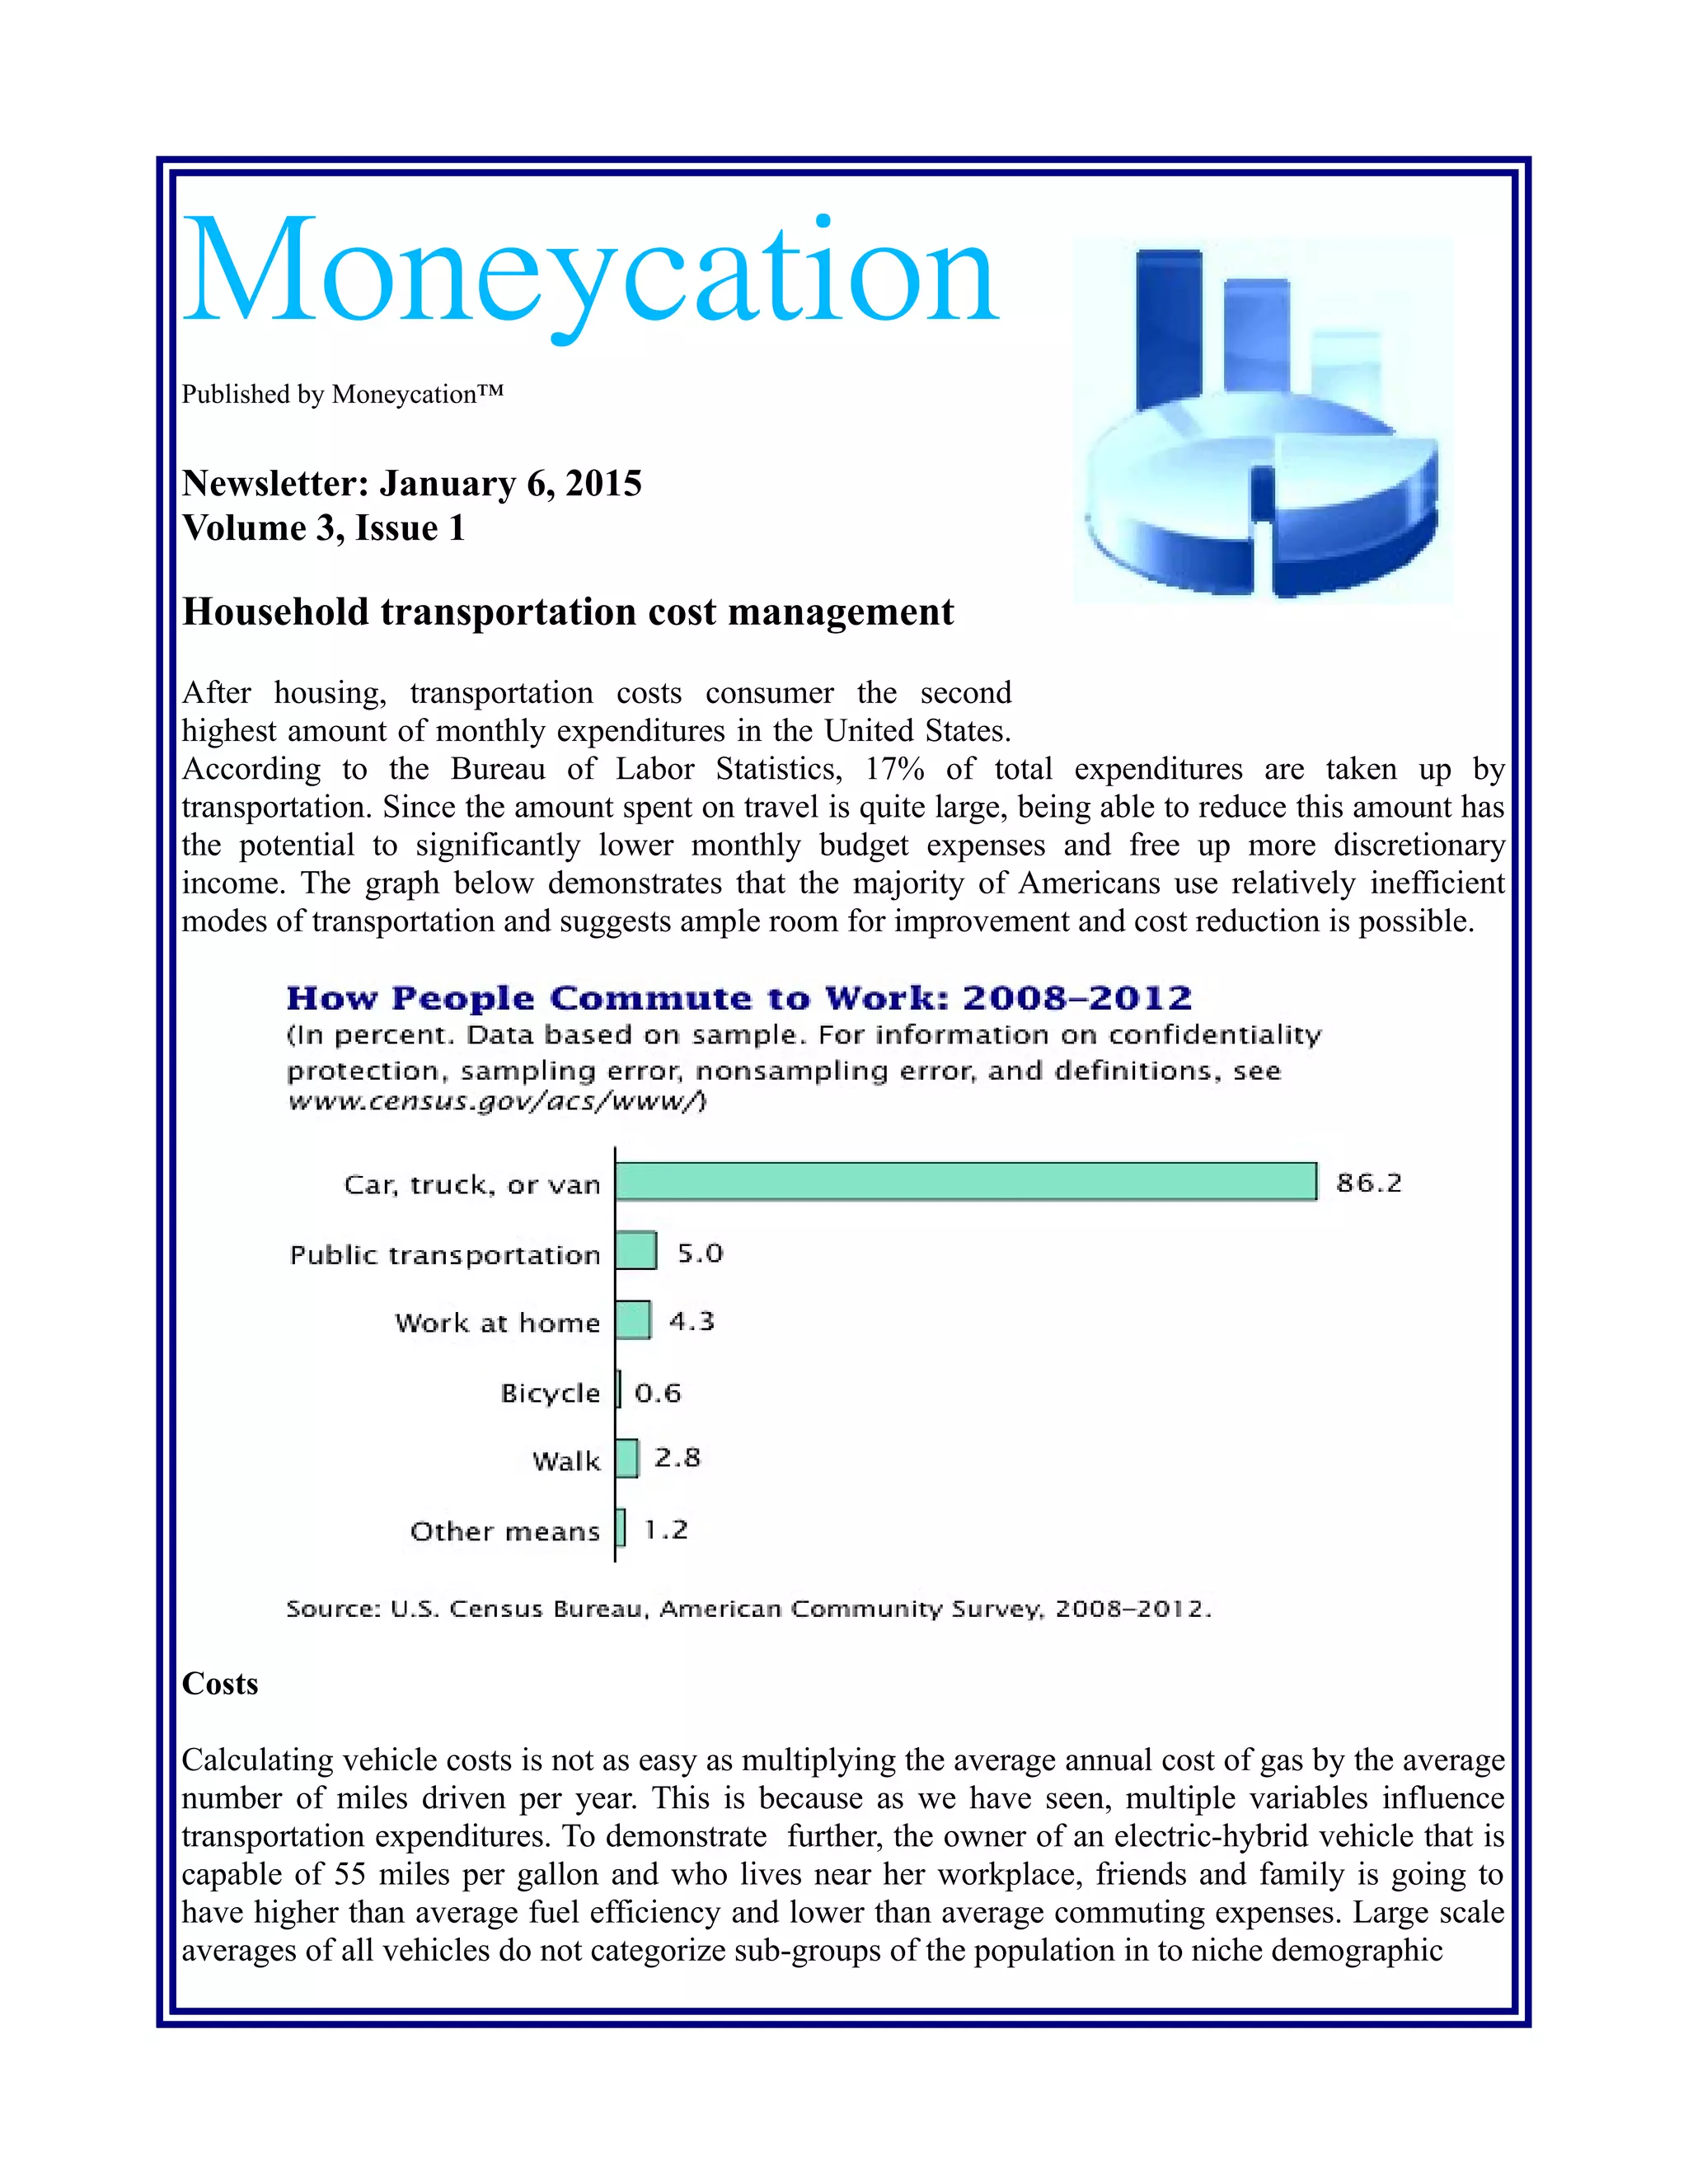
Moneycation
Published by Moneycation™
Newsletter: January 6, 2015
Volume 3, Issue 1
Household transportation cost management
After housing, transportation costs consumers the second highest amount of monthly expenditures
in the United States. According to the Bureau of Labor Statistics, 17% of total expenditures are
taken up by transportation. Since the amount spent on travel is quite large, being able to reduce this
amount has the potential to significantly lower monthly budget expenses and free up more
discretionary income. The graph below demonstrates that the majority of Americans use relatively
inefficient modes of transportation and suggests ample room for improvement and cost reduction is
possible.
Costs
Calculating vehicle costs is not as easy as multiplying the average annual cost of gas by the average
number of miles driven per year. This is because as we have seen, multiple variables influence
transportation expenditures. To demonstrate further, the owner of an electric-hybrid vehicle that is
capable of 55 miles per gallon and who lives near her workplace, friends and family is going to
have higher than average fuel efficiency and lower than average commuting expenses. Large scale
averages of all vehicles do not categorize sub-groups of the population in to niche demographic
groups such as eco-conscious drivers, recreational drivers, commuters and so forth. Nor do macro-
aggregate statistics account for multiple vehicle and single vehicle households; the effects of this
amount to an above and below average annual transportation costs.
Factors including gas prices, traffic and commute distance impact total transportation costs. Driving
habits such as over-accelerating and inefficient driving routs also impact household transportation
expenses. Adjusting, avoiding or eliminating these variables has a substantial impact on personal or
business travel expenses and does not necessarily require a great amount of sacrifice to personal
comfort or style. The following table illustrates how these factors affect expenses and by how
much. It also suggests ways to lower these costs.
Fuel Price Components
Source: USGov-PD
When evaluating costs and ways to reduce transportation expenses, statistics that are more
representative of the most appropriate driving scenario will likely provide a better or more accurate
estimate of annual costs. For instance, a study of commuters in a high-traffic metropolitan region
such as Washington D.C. Is less likely to accurately represent small-town commute patterns than
research that specifically targets accurately representative demographics. This data is useful for
gaging the extent to which an individual, household or business transportation costs fare against
larger groups.
To explain the above further, if a sub-demographic of Ford F350 trucks score above average for
annual vehicle expenditures, then there is a greater probability drivers in this category will have a
wider array of options for lowering vehicle expenses than a driver who is already conscious or
caring of such expenses and has already taken action to mitigate such expenses. The graph and table
on the next page highlight the difference in transport expenditures between trucks and cars in
addition to the total cost of operation and ownership beyond aggregate fuel economy averages.
Source: USGov-PD
Vehicle Cost Variables And Weighted Impact*
Variable Cost Alternatives Weight
Fuel Proportionate to efficiency and use Logistics services and/or
vehicular adaptations ex.
Size and mode
13% with tax*
Location
and distance
Benefits are linked to housing costs
and proximity to all destinations
Consider moving residence
and/or business address
Proportionate
to fuel use
Insurance Multi-policy discounts, vehicle
model & driving record apply
Raise deductibles, reduce
fleet or number of vehicles
27%
Depreciation Deductible as an expense for
business use of automobiles
Use maximum costs basis,
depreciate
improvements/repairs
0-35% per
year
for businesses
Maintenance
and repairs
Affected by use, storage and vehicle
requirements
Reduce wear and tear,
evaluate service warranties
7%
Fees Determined by federal and state
regulatory requirements
Multi-year registration
discounts, sell redundant or
inefficient vehicles
3%
Traffic Impacts fuel use and vehicle wear
and tear
Adjust travel schedule for
non-peak hours
10%
Method Driving style, reliance on transport,
type of fuel ex. diesel vs premium
Use speed caps to reduce
excess braking, acceleration
& boost fuel economy
50%
* Basted on USDOT data for intermediate sized vehicles
Regulation
Legislation governing transportation also influences cost via regulatory requirements. For instance,
as emission standards are raised, the efficiency of automobiles must be improved and part, if not all
of this cost is carried over to the consumer. Examples of laws that transportation regulations are
based on are listed below.
• Interstate Commerce Act
• Elkins Act
• Motor Carrier Act
• Civil Aeronautics Act
An example of how vehicle regulation impacts transportation costs is via dealer requirements. After
performing industry research, the National Automobile Dealers Association claimed dealer
regulatory compliance costs averaged $4.7 million per $56.7 million of profit or 8.2%; they also
state that is reasonable to assume these costs are passed on to consumers via higher costs. Thus, the
extent of automobile regulations, their effectiveness and efficiency are a notable variable in the total
cost of vehicular logistics such as private commuting.
Automobiles
Automobile expenses reach quite high in many instances. According to the American Automobile
Association, total average cost of driving a vehicle in 2013 was $7,962 or 39.8 cents per mile. Even
though vehicles are sunk costs, some of these expenses are recoverable or reducible via a change in
lifestyle and/or transportation habits. The following list demonstrates just how many costs are
associated with owning a new vehicle that has been financed.
• Sales tax
• Property tax
• Registration fees
• Inspection fees
• Loan interest
• Vehicle depreciation
• Maintenance
• Insurance
• Fuel costs
Although driving costs vary from state-to-state, commuting by car remains one of the most
expensive forms of travel for private citizens. In some cases of business use, automobile expenses
are tax deductible, which means the operating cost of the vehicle can be subtracted from taxable
income. To illustrate, if a leased car costs $5,000 per year to operate and it is tax deductible, then
the cost savings can range from a substantial $500-$2,000 depending on tax bracket.
By using fuel, consumers and commuters exposed themselves to a number of built in costs that are
not readily apparent at the pump. For instance, the following illustration shows additional costs
incorporated into the price of fuel. Minimizing fuel consumption and use also lowers these hidden
expenses.
There is some cost relief for car drivers via tax deductions, mileage credits and vehicle equity. More
specifically, if gas costs and vehicle expenses are used for employment, those costs are income tax
deductible in many instances. Also, most vehicles retain substantial resale value in their first few
years of operation and even in the first 10 years of use. After a vehicle has been paid off, the
remaining value becomes a personal asset, which is a positive financial variable.
Higher fuel economy is another way car drivers can reduce operating costs. The following
Environmental Protection Agency fuel economy rating demonstrates the fuel cost difference
between all electric automobiles and gas vehicles. However, since fuel costs only represent a
fraction of total ownership and operating costs, the impact on both the environment and personal
finances is a cumulative one that increases over time with use.
Source/License: USGov-PD
Alternatives
Bicycles
Transportation alternatives often help reduce the human carbon footprint and cost less. For
example, Tanya Mohn of Forbes Magazine cites data claiming that bicyclists save the U.S economy
$4.6 billion per year. This is made more clear in a comparison between average bicycle and car
operating costs of $308 per year for bicycles and $8,220 per year for cars. Even though bicycles are
substantially lower cost, there is a physical toll that is proportionate to the distance traveled.
Commuting by bicycle burns more calories, which costs more food and requires more energy,
which during a long workday is usually limited. So even though bicycles are a financially great
choice, they aren't necessarily the wisest in all cases.
Motorbikes
Motorbikes and scooters are also viable options to cars. Even though motorbikes are considered
riskier than cars, they still cost less to operate in terms of insurance, fuel and property tax.
According to Money Super Market, a motorcycle costs 27.7% less to own and operate than a
hatchback vehicle. Motorbikes also shorten commute times per Ridetowork.org
“Tests comparing car and motorcycle performance on real journeys suggest that traveling by
motorcycle can shorten journey times by as much as 33 minutes of every hour for town centre
and city travel, and 20 minutes of every hour for travel through a mixture of built-up and non
built-up areas.”
What is more, the Department of Motor Vehicles states motorcycle insurance can be reduced via
security features, wearing a helmet, automobile club membership and a good driving record among
other things. Unlike bicycles, motorcycles don't burn as many calories and take less time. However,
they do cost a little more and are potentially dangerous to drive. Another drawback of motorcycles
is gear costs and higher maintenance costs than cars per Torque news.
Scooters
Similar to motorbikes, scooters also cost less than cars. These vehicles typically have less power
than motorbikes. Occasionally, scooters such as the Honda SH150i have new purchase prices close
to that of motorbikes per Motorcycle USA. This particular high-performance scooter may be the
exception to the rule though.
Scooter insurance is usually more affordable than motorbikes. This is because scooters are less
risky and driven less per Esurance Insurance Services, Inc. Scooters are also very fuel efficient
compared to cars, SUVs and motorbikes. For example, Sustainable Enterprises Media, Inc. claims
the Stella scooter made by Genuine Scooter Co. achieves over 140 miles per gallon. This is
approximately five times more fuel efficient that many cars' average mpg and almost double the
efficiency of some motorbikes.
There are limits to the benefits of scooters as they are not always the best option despite high fuel
efficiency. This is due to varying circumstances among drivers such as climate, distance, speed
limitations and cargo. For short commutes in warm climates, or to reduce larger vehicle wear and
tear for frequent local transportation, scooters offer a more affordable to both motorbikes and cars
to reduce overall transportation costs.
Car-pooling
Car pooling benefits people and the environment and less than van-pooling per Rideshare Online.
More specifically, for a round trip commute of 5 miles at a cost of .37 cents per mile for 21 days per
month, the cost of car-pooling with just one other person and excluding parking is 50% lower than
driving alone. This amount will vary depending on how far the commute is, traffic, fuel costs,
vehicle efficiency and so on, but demonstrates the potential financial benefits of car-pooling.
Additional benefits of car-pooling are listed below:
• Less time via HOV lanes
• Lower gas costs
• Car-pooling incentive awards
• Reduced stress from driving
• Fewer road miles on lease or owned vehicles
• No workplace parking expenses
In order to benefit from car-pooling, commuters must find other individuals with similar goals
and/or destinations. Sometimes employers offer car-pooling programs, and other times community
car-pooling networks exist. Other car-pooling resources include smartphone apps, local
transportation departments and companies specializing in car-pool services.
Public transportation
Public transportation saves money in operational costs more than private commuting expenses. This
is because train, bus, trolly and other fares replace gas costs to differing extents. Depending on the
transit system, ridership, distance traveled and fare price the amount saved from not using personal
gas may or may not be negligible. Public transportation systems are based on supply and demand
modeling that quantifies the need, use of and operating costs of metropolitan transportation
projects. According to Hofstra University, some factors metro transit authorities consider before
changing or expanding public transportation are listed below:
• Population growth
• Commuter trends
• Economic benefits
• Return on investment
• Transportation needs
Despite comparable gas and fare costs, public transportation saves money in other ways. The
American Public Transportation Association or APTA claims Americans save $10,174 per year by
driving one instead of two cars. Expenses such as insurance, maintenance and tire replacement
costs are also lowered when vehicles are driven less. What is more, resale value of automobiles
tends to be higher when less road miles are put on the odometer each year.
Public transport costs are affected by passenger volume. The higher number of people per route, or
the closer to maximum capacity a bus, train or other mode of transportation becomes, the more
revenue is generated. When more revenue is generated per trip, a lower fare price is possible
because the operational expenses can also be paid with higher volume of lower cost fares. When
fares decline, the effect tends to be a ridership stimulus or incentive. The following metropolitan
commute graphic displays commuting volume over time and variances in public transportation use.
Image: Arturo Ramos; CC BY-SA 3.0
An additional influential variable on the price of public transit is the availability of trains per
Forbes. Moreover, of several cities surveyed, those with large rail transit systems had lower mass
transit costs in comparison to those without. Yet, even though fare prices differ between U.S. Cities
and some cities have lower commute costs than others, when they are compared with public
transportation costs in other countries, the U.S. falls financially short for the American consumer. A
Bloomberg report on the subject adds support to this view:
“American taxpayers will shell out many times what their counterparts in developed cities in
Europe and Asia would pay. In the case of the Second Avenue line and other new rail
infrastructure in New York City, they may have to pay five times as much.”
Public transportation comes down to the actual cost relative to alternatives for commuters and is a
matter of municipal funding, city management and demographic transit patterns for local regulators
and transit administration. Numerous commute cost calculators exist online to assist travelers with
their transportation budgets. These tools help accurately compare costs of transportation between
various modes of transport. One such calculator that does this is provided by Rio Metro Transit at
the following URL:
Rio Metro Transit Commute Cost Calculator: http://riometro.org/rider-tools/rider-info/learn-how-
to/calculate-your-commute-cost
Walking/running
By far, the cheapest, healthiest and greenest form of transportation is by foot, either walking or
jogging to destinations. The costs associated with this mode of travel are limited to food and
clothing that likely serve dual use functions. In other words, apparel items such as shoes used to
commute may also be used for other activities at different times. What is more, the calories used to
help fuel manual mobility can also facilitate other simultaneous tasks like making a business phone
call on the way to work.
A key variable surrounding walking or running as a mode of transport is distance. Since this
method is the slowest, it also takes the longest. This makes location a significant factor that can end
up saving a lot of money. If one works closer to work, the cost of transportation and living is more
easily reducing paid travel requirements substantially. Since Americans spend 12% of their budgets
on transportation, lowering this number by half to 6% would save a median income earner of
$51,939 approximately $3,116 or more of gross income per year. That's a sizable travel expense that
could be used to upgrade a home, relocate to a less travel intensive location, invest etc.
Despite the increase in urban bicycle lanes and more eco-conscious thinking, the greenest forms of
transportation have either declined or remained relatively flat between 1980-2012 per the following
U.S. Census graphic. Moreover, walking as a mode of transportation dropped 2.8% and bicycling
only increased .1% for the same time period. Of all the states, Oregon and the District of Columbia
have the highest amount of cyclists with 2% or more of commuters using this method. Alaska, New
York State and the District of Columbia have the highest amount of walkers with 6% or more of
commuters using it to commute to work.
Source/license: USGov-PD
For the purpose of clarification, the vehicle cost comparison table below details which vehicles
have the lowest overall costs.
Annual Transportation Cost Comparison Table
Fuel Maintenance&
Repairs
Upfront
costs
Tax/ Fees Insurance Financing Total
cost
Alternative
fuel
10.97
cents/mile
$813.20 $1,777-
2,665
$321.00 $741-
$1,043.00
$212.60 $5,290-
6,480
Mid-size sedan 14.1
cents/mile
$871.00 $2,081-
$3,122
$375.60 $630-
$1,300
$248.80-
$1,097.20
$6,039.4-
8598.8
SUV & M.W.
Trucks
22.1
cents/mile
$888.40 $2,318-
$3,478
$416.60 $794-$945 $277.20-
$1,250.00
$7,566.6
0-
$9,850.4
Minivans 22.5
cents/mile
$892.40 $2,546-
$3,819
$458.60 $764.00-
$1,021
$304-
$1,097.20
$7,890-
10,213.2
M-Bike¹ 6.3
cents/mile
$600/yr $6,150 $900/yr $400/yr $200-
$600
$9,069-
9,469
Scooter² 4.5
cents/mile
$285/yr $1,200-
$1,400/yr
$45-$295 $120-
$150/yr
$10-$160 $2,245-
$2.875
Bus N/A N/A N/A $3-
$5/day
N/A N/A $735-
$1,225/d
ay
Train N/A N/A N/A $5-$10 N/A N/A $1,225-
$2,450
Bicycle N/A $100/yr $462-
$1,062
N/A $0-
$100/yr
$25.40-
$112.45
$587.40 -
$1,374.4
5
Walking N/A N/A $45-$80 N/A N/A N/A $20-$40
¹Germz.org estimated cost per year ;² Motorcycle.com & MD MVA; Financing cost 4%; Fuel price $3.15/gallon;car
fuel efficiency, BTS data; alternative fuel, midsize sedan, minivan and truck fuel, repair, and tax costs based on KBB
2014 Toyota Sienna and mid-size 2014 Toyota Tacoma DC
Forecasting
Being able to forecast future transportation costs is also an important variable in accounting for and
planning budgets. Ownership and operating costs change from year to year and vary between
modes of travel. For example, inflation impacts vehicle expenses in a different way for each
component cost. Moreover, fuel cost increases sometimes rise faster and steeper than incremental
inflation adjustments to insurance premiums. According to the American Automobile Association,
fuel costs rose 14.8% between 2011-2012. This kind of price change becomes even more important
as transportation needs rise such as with a business fleet or large family.
Determining which transportation costs are likely to increase, and recognizing how, why and by
how much such expenses are likely to do so is helpful in modifying future transportation practices
for the purpose of lowering total cost. Finding ways to control and reduce the highest cost risks first
helps mitigate the overall impact of operation expenses. When evaluating what transportation cost
components are likely to rise and by how much different forecasting methods have their own pros
and cons.
• Moving average historical cost
• Weighted average percentage increase
• Time series forecasting
• Causal projections
Moving average forecasting alone has several techniques such as weighted moving average trend-
lines.
Used vs new
When the decision to drive a specific vehicle is made, additional choices such as whether to buy
new or used come to the forefront. Buying new has advantages in terms of repair costs as new car
warranties typically last for the first two to three years of use. However, any repair savings also
come at a cost of having a newer car. Since vehicles depreciate by as much as 24 percent per in the
first year per Edmunds, driving a one or two year old used automobile is not such a bad idea. Also,
the first year of use also costs more in insurance and property tax where applicable. How good a
deal a used car buyer obtains also influences the net costs of transportation. Properly following used
car buying tips helps with gaining a good deal on a purchase.
Financing vs leasing
Another option facing commuters is whether or not to lease a vehicle. Finding leases on older
model automobiles is not as easy as for new and newer models. This makes the cost of a lease more
profitable for dealerships since the full depreciation of the vehicle, plus profit margin via fees and
inventory costs are as good as, if not better, than a sale. Nevertheless, in some cases, a driver may
not be in need of an automobile for more than a limited amount of time. This tends to keep monthly
prices lower than had a new car been purchased. In other words, provided lease terms and
conditions are met, a new vehicle can be driver for the price of an older vehicle for a limited period
of time.
Conclusion
Transportation is often a necessity, but does not have to be the third largest piece of American'
budgets. Improving personal financial planning and business financial management ideally takes as
many transportation factors and scenarios in to account, and then adjusts them accordingly. This
involves a close look at driving habits, equipment, travel routes and modes of transport. It also
takes future transportation needs and costs into account in order to make it more cost effective in
advance.
By altering vehicle choice or number of household automobiles and changing short-distance
transportation patterns, travelers have the potential to reduce costs and even improve health if they
walk, bicycle, skate or run. These more physical ways of moving between locations may reduce
overall healthcare costs by limiting the number of doctor visits, prescriptions or illnesses
experienced each year. Rethinking driving routs or investing in a global positioning system that
does the thinking for you may also help lower transportation costs. This is especially the case for
commuters that frequently travel long distances or visit new work locations.
Forecasting future developments in transportation is also beneficial. For example, if the majority of
vehicle prototypes have increasing fuel efficiency and lower purchase prices in proportion to fuel
costs, then investing in a brand new motorbike may not be worthwhile two or three years down the
road. In other words, current decisions influence future finances and although a choice is cost
effective in the present, does not necessitate that it will be one or more years in the future. Carefully
calculating existing, alternative and future commute or transportation scenarios helps avoid
transport expense pitfalls and better budget for travel needs.
Sources:
1. “U.S. Department of Energy”; Alternative Fuels Data
2. “American Public Transportation Association”; 2014 Public Transportation Fact Book, Appendix A: Historical
Tables; September 2014
3. "Wikipedia”; Plug-In Electric Vehicles in The United States
4. “American Public Transportation Association”; 2013 Public Transportation Fact Book; 64th
Edition, October 2013
5. “The Hamilton Project”; Technical Appendix: Figure 7, Private Costs of Transportation Choices, Figure 9 External
Costs Of Transportation Use; Michael Greenstone and Adam Looney; June 2012
6. “Thoreau Institute”; Transportation Costs and The American Dream; July 31, 2003
7. “Bloomberg”; U.S. Taxpayers are Gouged On Mass Transit Costs; Stephen Smith; August 26, 2012
8. “Texas A&M Transportation Institute”; TTI's 2012 Urban Mobility Report; David Schrank, Bill Eisele and Tim
Lomax; December 2012
9. “American Automobile Association”; The Real Cost of Vehicle Ownership
10. “Florida State University”: Commute Cost Calculator; 2014
11. “American Automobile Association”; Your Driving Costs; How Much Are You Really Paying to Drive; 2013 Ed.
12. “MarketWatch”; What Your Car Really Costs You; Andrea Coombes; March 19, 2014
13. “Forbes”; Pedaling to Prosperity: Biking Saves U.S. Riders Billions A Year; Tanya Mohn, May 20, 2012
14. “Department of Motor Vehicles”; How to Save Money on Motorcycle Insurance
15. “Money Super Market”; Bike Vs. Car- Which is Best?
16. “Motorcycle USA”; Motorcycle vs. Scooter Comparison; January 17, 2011
17. “Esurance Insurance Services, Inc.”; Scooter or Motorcycle: 4 Questions To Help You Decide
18. “Sustainable Enterprises Media, Inc.” The 13 Best Fuel-Efficient Motorcycles You Can Get
19. “Edmunds”; Commuter Carpools Save Time and Money; Justin Smith; August 23, 2013
20. “Rideshare Online”; Commute Cost Calculator
21. “American Public Transportation Association”; Public Transportation Benefits
22. “U.S. Internal Revenue Service”; Business Use of Car
23. “The Simple Dollar”; Is It Really Cheaper to Ride the Bus?”; Tren; May 30, 2010
24. “National Automobile Dealers Association”; The Impact of Federal Regulations on Franchised Automobile
Dealerships; Center for Automotive Research; May 2014.
25. “Bloomberg”; U.S. Taxpayers are Gauged on Mass Transit Costs; Stephen Smith; August 26, 2012
26. “Forbes”; America's Most Expensive Commutes; Matt Woolsey; August 8, 2007
27. “U.S. Census”; Modes Less Traveled-Bicycling and Walking to Work in the United States: 2008-2012; American
Community Survey Reports; Brian McKenzie; May 2014
28. “U.S. Department of Transportation Federal Highway Administration”; The Vehicle Fleet
29. “U.S. Internal Revenue Service”; Publication 946: How to Depreciate Property; 2013
30. “American Automobile Association”; Cost of Owning and Operating Vehicle in U.S. Increased 1.9% According to
AAA's 2012 Costs' Study'; Heather Hunter
31. “Consumer Reports”; What That Car Really Costs to Own; August 2012
32. “University of Minnesota”; Forecasting Models: Chapter 2; IE3265; R. Lindeke
33. “Ride to Work”; Motorcycle Transportation Fact Sheet
34. “Torque News”; The Real Cost of Ownership
35. “Motorcycle USA; Scooting Through Vespanomics 101, December 11, 2008
36. “Forbes”; The Costs and Savings of Bicycle Commuting; J.D. Roth, June 15, 2011
37. “U.S. Department of Transportation”; National Transit Database
38. “Calculator Soup”; Amortization Schedule Calculator
39. “MotorScooterShop”; Scooter Cost: How Much Does a Motor Scooter Cost?
40. “Maryland Department of Transportation”; Department of Transportation MVA; Mopeds and Motor Scooters
41. “Edmunds”; Depreciation Infographic: How Fast Does My New Car Lose Value; September, 24, 2010
42. “Bankrate”; Table: Car-Ownership Costs By State; Chris Kahn
43. “CNBC”; Americans Borrowing Record Amount to Buy Cars; Phil LeBeau; March 4, 2014
44. “U.S. DoT: Bureau of Transportation Statistics”; Average Fuel Efficiency of U.S. Light Duty Vehicle ; 1980-2013
45. “University of California at Davis”; Electric and Gasoline Vehicle Lifecycle Cost and Energy-Use Model; April
2000
46. “Kelly Blue Book”; What Is 5-Year Cost to Own?
47. “Edmunds”; How Much Should a Car Down Payment Be?; Ronald Montoya; February 21, 2014
48. “PACommutes”; Alternative Transportation in Pennsylvania: Benefits
49. “Hofstra University”; The Geography of Transport Systems: Transport Supply and Demand; Dr. Jean-Paul Rodrigue
and Dr. Theo Notteboom
Disclaimer: The content in this newsletter is for informational purposes only, and does not constitute financial planning
or any other kind of advice, and should not be construed as such. Any opinions or statements expressed by cited third
parties do not necessarily reflect those of Moneycation™. All information within this newsletter is to be used or not
used at the sole discretion of the reader and its authenticity and accuracy are not guaranteed. The author of this
newsletter assumes no liability for actions, decisions or events relating in any way to this newsletter's content.
Copyright © 2014 Moneycation™; All Rights Reserved

Household transportation cost management

  • 1.
    Moneycation Published by Moneycation™ Newsletter:January 6, 2015 Volume 3, Issue 1 Household transportation cost management After housing, transportation costs consumers the second highest amount of monthly expenditures in the United States. According to the Bureau of Labor Statistics, 17% of total expenditures are taken up by transportation. Since the amount spent on travel is quite large, being able to reduce this amount has the potential to significantly lower monthly budget expenses and free up more discretionary income. The graph below demonstrates that the majority of Americans use relatively inefficient modes of transportation and suggests ample room for improvement and cost reduction is possible. Costs Calculating vehicle costs is not as easy as multiplying the average annual cost of gas by the average number of miles driven per year. This is because as we have seen, multiple variables influence transportation expenditures. To demonstrate further, the owner of an electric-hybrid vehicle that is capable of 55 miles per gallon and who lives near her workplace, friends and family is going to
  • 2.
    have higher thanaverage fuel efficiency and lower than average commuting expenses. Large scale averages of all vehicles do not categorize sub-groups of the population in to niche demographic groups such as eco-conscious drivers, recreational drivers, commuters and so forth. Nor do macro- aggregate statistics account for multiple vehicle and single vehicle households; the effects of this amount to an above and below average annual transportation costs. Factors including gas prices, traffic and commute distance impact total transportation costs. Driving habits such as over-accelerating and inefficient driving routs also impact household transportation expenses. Adjusting, avoiding or eliminating these variables has a substantial impact on personal or business travel expenses and does not necessarily require a great amount of sacrifice to personal comfort or style. The following table illustrates how these factors affect expenses and by how much. It also suggests ways to lower these costs. Fuel Price Components Source: USGov-PD When evaluating costs and ways to reduce transportation expenses, statistics that are more representative of the most appropriate driving scenario will likely provide a better or more accurate estimate of annual costs. For instance, a study of commuters in a high-traffic metropolitan region such as Washington D.C. Is less likely to accurately represent small-town commute patterns than research that specifically targets accurately representative demographics. This data is useful for gaging the extent to which an individual, household or business transportation costs fare against larger groups. To explain the above further, if a sub-demographic of Ford F350 trucks score above average for annual vehicle expenditures, then there is a greater probability drivers in this category will have a wider array of options for lowering vehicle expenses than a driver who is already conscious or caring of such expenses and has already taken action to mitigate such expenses. The graph and table on the next page highlight the difference in transport expenditures between trucks and cars in addition to the total cost of operation and ownership beyond aggregate fuel economy averages.
  • 3.
    Source: USGov-PD Vehicle CostVariables And Weighted Impact* Variable Cost Alternatives Weight Fuel Proportionate to efficiency and use Logistics services and/or vehicular adaptations ex. Size and mode 13% with tax* Location and distance Benefits are linked to housing costs and proximity to all destinations Consider moving residence and/or business address Proportionate to fuel use Insurance Multi-policy discounts, vehicle model & driving record apply Raise deductibles, reduce fleet or number of vehicles 27% Depreciation Deductible as an expense for business use of automobiles Use maximum costs basis, depreciate improvements/repairs 0-35% per year for businesses Maintenance and repairs Affected by use, storage and vehicle requirements Reduce wear and tear, evaluate service warranties 7% Fees Determined by federal and state regulatory requirements Multi-year registration discounts, sell redundant or inefficient vehicles 3% Traffic Impacts fuel use and vehicle wear and tear Adjust travel schedule for non-peak hours 10% Method Driving style, reliance on transport, type of fuel ex. diesel vs premium Use speed caps to reduce excess braking, acceleration & boost fuel economy 50% * Basted on USDOT data for intermediate sized vehicles
  • 4.
    Regulation Legislation governing transportationalso influences cost via regulatory requirements. For instance, as emission standards are raised, the efficiency of automobiles must be improved and part, if not all of this cost is carried over to the consumer. Examples of laws that transportation regulations are based on are listed below. • Interstate Commerce Act • Elkins Act • Motor Carrier Act • Civil Aeronautics Act An example of how vehicle regulation impacts transportation costs is via dealer requirements. After performing industry research, the National Automobile Dealers Association claimed dealer regulatory compliance costs averaged $4.7 million per $56.7 million of profit or 8.2%; they also state that is reasonable to assume these costs are passed on to consumers via higher costs. Thus, the extent of automobile regulations, their effectiveness and efficiency are a notable variable in the total cost of vehicular logistics such as private commuting. Automobiles Automobile expenses reach quite high in many instances. According to the American Automobile Association, total average cost of driving a vehicle in 2013 was $7,962 or 39.8 cents per mile. Even though vehicles are sunk costs, some of these expenses are recoverable or reducible via a change in lifestyle and/or transportation habits. The following list demonstrates just how many costs are associated with owning a new vehicle that has been financed. • Sales tax • Property tax • Registration fees • Inspection fees • Loan interest • Vehicle depreciation • Maintenance • Insurance • Fuel costs Although driving costs vary from state-to-state, commuting by car remains one of the most expensive forms of travel for private citizens. In some cases of business use, automobile expenses are tax deductible, which means the operating cost of the vehicle can be subtracted from taxable income. To illustrate, if a leased car costs $5,000 per year to operate and it is tax deductible, then the cost savings can range from a substantial $500-$2,000 depending on tax bracket. By using fuel, consumers and commuters exposed themselves to a number of built in costs that are not readily apparent at the pump. For instance, the following illustration shows additional costs
  • 5.
    incorporated into theprice of fuel. Minimizing fuel consumption and use also lowers these hidden expenses. There is some cost relief for car drivers via tax deductions, mileage credits and vehicle equity. More specifically, if gas costs and vehicle expenses are used for employment, those costs are income tax deductible in many instances. Also, most vehicles retain substantial resale value in their first few years of operation and even in the first 10 years of use. After a vehicle has been paid off, the remaining value becomes a personal asset, which is a positive financial variable. Higher fuel economy is another way car drivers can reduce operating costs. The following Environmental Protection Agency fuel economy rating demonstrates the fuel cost difference between all electric automobiles and gas vehicles. However, since fuel costs only represent a fraction of total ownership and operating costs, the impact on both the environment and personal finances is a cumulative one that increases over time with use. Source/License: USGov-PD Alternatives Bicycles Transportation alternatives often help reduce the human carbon footprint and cost less. For example, Tanya Mohn of Forbes Magazine cites data claiming that bicyclists save the U.S economy $4.6 billion per year. This is made more clear in a comparison between average bicycle and car operating costs of $308 per year for bicycles and $8,220 per year for cars. Even though bicycles are substantially lower cost, there is a physical toll that is proportionate to the distance traveled.
  • 6.
    Commuting by bicycleburns more calories, which costs more food and requires more energy, which during a long workday is usually limited. So even though bicycles are a financially great choice, they aren't necessarily the wisest in all cases. Motorbikes Motorbikes and scooters are also viable options to cars. Even though motorbikes are considered riskier than cars, they still cost less to operate in terms of insurance, fuel and property tax. According to Money Super Market, a motorcycle costs 27.7% less to own and operate than a hatchback vehicle. Motorbikes also shorten commute times per Ridetowork.org “Tests comparing car and motorcycle performance on real journeys suggest that traveling by motorcycle can shorten journey times by as much as 33 minutes of every hour for town centre and city travel, and 20 minutes of every hour for travel through a mixture of built-up and non built-up areas.” What is more, the Department of Motor Vehicles states motorcycle insurance can be reduced via security features, wearing a helmet, automobile club membership and a good driving record among other things. Unlike bicycles, motorcycles don't burn as many calories and take less time. However, they do cost a little more and are potentially dangerous to drive. Another drawback of motorcycles is gear costs and higher maintenance costs than cars per Torque news. Scooters Similar to motorbikes, scooters also cost less than cars. These vehicles typically have less power than motorbikes. Occasionally, scooters such as the Honda SH150i have new purchase prices close to that of motorbikes per Motorcycle USA. This particular high-performance scooter may be the exception to the rule though. Scooter insurance is usually more affordable than motorbikes. This is because scooters are less risky and driven less per Esurance Insurance Services, Inc. Scooters are also very fuel efficient compared to cars, SUVs and motorbikes. For example, Sustainable Enterprises Media, Inc. claims the Stella scooter made by Genuine Scooter Co. achieves over 140 miles per gallon. This is approximately five times more fuel efficient that many cars' average mpg and almost double the efficiency of some motorbikes. There are limits to the benefits of scooters as they are not always the best option despite high fuel efficiency. This is due to varying circumstances among drivers such as climate, distance, speed limitations and cargo. For short commutes in warm climates, or to reduce larger vehicle wear and tear for frequent local transportation, scooters offer a more affordable to both motorbikes and cars to reduce overall transportation costs. Car-pooling Car pooling benefits people and the environment and less than van-pooling per Rideshare Online. More specifically, for a round trip commute of 5 miles at a cost of .37 cents per mile for 21 days per
  • 7.
    month, the costof car-pooling with just one other person and excluding parking is 50% lower than driving alone. This amount will vary depending on how far the commute is, traffic, fuel costs, vehicle efficiency and so on, but demonstrates the potential financial benefits of car-pooling. Additional benefits of car-pooling are listed below: • Less time via HOV lanes • Lower gas costs • Car-pooling incentive awards • Reduced stress from driving • Fewer road miles on lease or owned vehicles • No workplace parking expenses In order to benefit from car-pooling, commuters must find other individuals with similar goals and/or destinations. Sometimes employers offer car-pooling programs, and other times community car-pooling networks exist. Other car-pooling resources include smartphone apps, local transportation departments and companies specializing in car-pool services. Public transportation Public transportation saves money in operational costs more than private commuting expenses. This is because train, bus, trolly and other fares replace gas costs to differing extents. Depending on the transit system, ridership, distance traveled and fare price the amount saved from not using personal gas may or may not be negligible. Public transportation systems are based on supply and demand modeling that quantifies the need, use of and operating costs of metropolitan transportation projects. According to Hofstra University, some factors metro transit authorities consider before changing or expanding public transportation are listed below: • Population growth • Commuter trends • Economic benefits • Return on investment • Transportation needs Despite comparable gas and fare costs, public transportation saves money in other ways. The American Public Transportation Association or APTA claims Americans save $10,174 per year by driving one instead of two cars. Expenses such as insurance, maintenance and tire replacement costs are also lowered when vehicles are driven less. What is more, resale value of automobiles tends to be higher when less road miles are put on the odometer each year. Public transport costs are affected by passenger volume. The higher number of people per route, or the closer to maximum capacity a bus, train or other mode of transportation becomes, the more revenue is generated. When more revenue is generated per trip, a lower fare price is possible because the operational expenses can also be paid with higher volume of lower cost fares. When fares decline, the effect tends to be a ridership stimulus or incentive. The following metropolitan commute graphic displays commuting volume over time and variances in public transportation use.
  • 8.
    Image: Arturo Ramos;CC BY-SA 3.0 An additional influential variable on the price of public transit is the availability of trains per Forbes. Moreover, of several cities surveyed, those with large rail transit systems had lower mass transit costs in comparison to those without. Yet, even though fare prices differ between U.S. Cities and some cities have lower commute costs than others, when they are compared with public transportation costs in other countries, the U.S. falls financially short for the American consumer. A Bloomberg report on the subject adds support to this view: “American taxpayers will shell out many times what their counterparts in developed cities in Europe and Asia would pay. In the case of the Second Avenue line and other new rail infrastructure in New York City, they may have to pay five times as much.” Public transportation comes down to the actual cost relative to alternatives for commuters and is a matter of municipal funding, city management and demographic transit patterns for local regulators and transit administration. Numerous commute cost calculators exist online to assist travelers with their transportation budgets. These tools help accurately compare costs of transportation between various modes of transport. One such calculator that does this is provided by Rio Metro Transit at the following URL: Rio Metro Transit Commute Cost Calculator: http://riometro.org/rider-tools/rider-info/learn-how- to/calculate-your-commute-cost
  • 9.
    Walking/running By far, thecheapest, healthiest and greenest form of transportation is by foot, either walking or jogging to destinations. The costs associated with this mode of travel are limited to food and clothing that likely serve dual use functions. In other words, apparel items such as shoes used to commute may also be used for other activities at different times. What is more, the calories used to help fuel manual mobility can also facilitate other simultaneous tasks like making a business phone call on the way to work. A key variable surrounding walking or running as a mode of transport is distance. Since this method is the slowest, it also takes the longest. This makes location a significant factor that can end up saving a lot of money. If one works closer to work, the cost of transportation and living is more easily reducing paid travel requirements substantially. Since Americans spend 12% of their budgets on transportation, lowering this number by half to 6% would save a median income earner of $51,939 approximately $3,116 or more of gross income per year. That's a sizable travel expense that could be used to upgrade a home, relocate to a less travel intensive location, invest etc. Despite the increase in urban bicycle lanes and more eco-conscious thinking, the greenest forms of transportation have either declined or remained relatively flat between 1980-2012 per the following U.S. Census graphic. Moreover, walking as a mode of transportation dropped 2.8% and bicycling only increased .1% for the same time period. Of all the states, Oregon and the District of Columbia have the highest amount of cyclists with 2% or more of commuters using this method. Alaska, New York State and the District of Columbia have the highest amount of walkers with 6% or more of commuters using it to commute to work. Source/license: USGov-PD For the purpose of clarification, the vehicle cost comparison table below details which vehicles
  • 10.
    have the lowestoverall costs. Annual Transportation Cost Comparison Table Fuel Maintenance& Repairs Upfront costs Tax/ Fees Insurance Financing Total cost Alternative fuel 10.97 cents/mile $813.20 $1,777- 2,665 $321.00 $741- $1,043.00 $212.60 $5,290- 6,480 Mid-size sedan 14.1 cents/mile $871.00 $2,081- $3,122 $375.60 $630- $1,300 $248.80- $1,097.20 $6,039.4- 8598.8 SUV & M.W. Trucks 22.1 cents/mile $888.40 $2,318- $3,478 $416.60 $794-$945 $277.20- $1,250.00 $7,566.6 0- $9,850.4 Minivans 22.5 cents/mile $892.40 $2,546- $3,819 $458.60 $764.00- $1,021 $304- $1,097.20 $7,890- 10,213.2 M-Bike¹ 6.3 cents/mile $600/yr $6,150 $900/yr $400/yr $200- $600 $9,069- 9,469 Scooter² 4.5 cents/mile $285/yr $1,200- $1,400/yr $45-$295 $120- $150/yr $10-$160 $2,245- $2.875 Bus N/A N/A N/A $3- $5/day N/A N/A $735- $1,225/d ay Train N/A N/A N/A $5-$10 N/A N/A $1,225- $2,450 Bicycle N/A $100/yr $462- $1,062 N/A $0- $100/yr $25.40- $112.45 $587.40 - $1,374.4 5 Walking N/A N/A $45-$80 N/A N/A N/A $20-$40 ¹Germz.org estimated cost per year ;² Motorcycle.com & MD MVA; Financing cost 4%; Fuel price $3.15/gallon;car fuel efficiency, BTS data; alternative fuel, midsize sedan, minivan and truck fuel, repair, and tax costs based on KBB 2014 Toyota Sienna and mid-size 2014 Toyota Tacoma DC Forecasting Being able to forecast future transportation costs is also an important variable in accounting for and planning budgets. Ownership and operating costs change from year to year and vary between modes of travel. For example, inflation impacts vehicle expenses in a different way for each component cost. Moreover, fuel cost increases sometimes rise faster and steeper than incremental inflation adjustments to insurance premiums. According to the American Automobile Association, fuel costs rose 14.8% between 2011-2012. This kind of price change becomes even more important as transportation needs rise such as with a business fleet or large family. Determining which transportation costs are likely to increase, and recognizing how, why and by
  • 11.
    how much suchexpenses are likely to do so is helpful in modifying future transportation practices for the purpose of lowering total cost. Finding ways to control and reduce the highest cost risks first helps mitigate the overall impact of operation expenses. When evaluating what transportation cost components are likely to rise and by how much different forecasting methods have their own pros and cons. • Moving average historical cost • Weighted average percentage increase • Time series forecasting • Causal projections Moving average forecasting alone has several techniques such as weighted moving average trend- lines. Used vs new When the decision to drive a specific vehicle is made, additional choices such as whether to buy new or used come to the forefront. Buying new has advantages in terms of repair costs as new car warranties typically last for the first two to three years of use. However, any repair savings also come at a cost of having a newer car. Since vehicles depreciate by as much as 24 percent per in the first year per Edmunds, driving a one or two year old used automobile is not such a bad idea. Also, the first year of use also costs more in insurance and property tax where applicable. How good a deal a used car buyer obtains also influences the net costs of transportation. Properly following used car buying tips helps with gaining a good deal on a purchase. Financing vs leasing Another option facing commuters is whether or not to lease a vehicle. Finding leases on older model automobiles is not as easy as for new and newer models. This makes the cost of a lease more profitable for dealerships since the full depreciation of the vehicle, plus profit margin via fees and inventory costs are as good as, if not better, than a sale. Nevertheless, in some cases, a driver may not be in need of an automobile for more than a limited amount of time. This tends to keep monthly prices lower than had a new car been purchased. In other words, provided lease terms and conditions are met, a new vehicle can be driver for the price of an older vehicle for a limited period of time. Conclusion Transportation is often a necessity, but does not have to be the third largest piece of American' budgets. Improving personal financial planning and business financial management ideally takes as many transportation factors and scenarios in to account, and then adjusts them accordingly. This involves a close look at driving habits, equipment, travel routes and modes of transport. It also takes future transportation needs and costs into account in order to make it more cost effective in advance. By altering vehicle choice or number of household automobiles and changing short-distance
  • 12.
    transportation patterns, travelershave the potential to reduce costs and even improve health if they walk, bicycle, skate or run. These more physical ways of moving between locations may reduce overall healthcare costs by limiting the number of doctor visits, prescriptions or illnesses experienced each year. Rethinking driving routs or investing in a global positioning system that does the thinking for you may also help lower transportation costs. This is especially the case for commuters that frequently travel long distances or visit new work locations. Forecasting future developments in transportation is also beneficial. For example, if the majority of vehicle prototypes have increasing fuel efficiency and lower purchase prices in proportion to fuel costs, then investing in a brand new motorbike may not be worthwhile two or three years down the road. In other words, current decisions influence future finances and although a choice is cost effective in the present, does not necessitate that it will be one or more years in the future. Carefully calculating existing, alternative and future commute or transportation scenarios helps avoid transport expense pitfalls and better budget for travel needs. Sources: 1. “U.S. Department of Energy”; Alternative Fuels Data 2. “American Public Transportation Association”; 2014 Public Transportation Fact Book, Appendix A: Historical Tables; September 2014 3. "Wikipedia”; Plug-In Electric Vehicles in The United States 4. “American Public Transportation Association”; 2013 Public Transportation Fact Book; 64th Edition, October 2013 5. “The Hamilton Project”; Technical Appendix: Figure 7, Private Costs of Transportation Choices, Figure 9 External Costs Of Transportation Use; Michael Greenstone and Adam Looney; June 2012 6. “Thoreau Institute”; Transportation Costs and The American Dream; July 31, 2003 7. “Bloomberg”; U.S. Taxpayers are Gouged On Mass Transit Costs; Stephen Smith; August 26, 2012 8. “Texas A&M Transportation Institute”; TTI's 2012 Urban Mobility Report; David Schrank, Bill Eisele and Tim Lomax; December 2012 9. “American Automobile Association”; The Real Cost of Vehicle Ownership 10. “Florida State University”: Commute Cost Calculator; 2014 11. “American Automobile Association”; Your Driving Costs; How Much Are You Really Paying to Drive; 2013 Ed. 12. “MarketWatch”; What Your Car Really Costs You; Andrea Coombes; March 19, 2014 13. “Forbes”; Pedaling to Prosperity: Biking Saves U.S. Riders Billions A Year; Tanya Mohn, May 20, 2012 14. “Department of Motor Vehicles”; How to Save Money on Motorcycle Insurance 15. “Money Super Market”; Bike Vs. Car- Which is Best? 16. “Motorcycle USA”; Motorcycle vs. Scooter Comparison; January 17, 2011 17. “Esurance Insurance Services, Inc.”; Scooter or Motorcycle: 4 Questions To Help You Decide 18. “Sustainable Enterprises Media, Inc.” The 13 Best Fuel-Efficient Motorcycles You Can Get 19. “Edmunds”; Commuter Carpools Save Time and Money; Justin Smith; August 23, 2013 20. “Rideshare Online”; Commute Cost Calculator 21. “American Public Transportation Association”; Public Transportation Benefits 22. “U.S. Internal Revenue Service”; Business Use of Car 23. “The Simple Dollar”; Is It Really Cheaper to Ride the Bus?”; Tren; May 30, 2010 24. “National Automobile Dealers Association”; The Impact of Federal Regulations on Franchised Automobile Dealerships; Center for Automotive Research; May 2014. 25. “Bloomberg”; U.S. Taxpayers are Gauged on Mass Transit Costs; Stephen Smith; August 26, 2012 26. “Forbes”; America's Most Expensive Commutes; Matt Woolsey; August 8, 2007 27. “U.S. Census”; Modes Less Traveled-Bicycling and Walking to Work in the United States: 2008-2012; American Community Survey Reports; Brian McKenzie; May 2014 28. “U.S. Department of Transportation Federal Highway Administration”; The Vehicle Fleet 29. “U.S. Internal Revenue Service”; Publication 946: How to Depreciate Property; 2013 30. “American Automobile Association”; Cost of Owning and Operating Vehicle in U.S. Increased 1.9% According to
  • 13.
    AAA's 2012 Costs'Study'; Heather Hunter 31. “Consumer Reports”; What That Car Really Costs to Own; August 2012 32. “University of Minnesota”; Forecasting Models: Chapter 2; IE3265; R. Lindeke 33. “Ride to Work”; Motorcycle Transportation Fact Sheet 34. “Torque News”; The Real Cost of Ownership 35. “Motorcycle USA; Scooting Through Vespanomics 101, December 11, 2008 36. “Forbes”; The Costs and Savings of Bicycle Commuting; J.D. Roth, June 15, 2011 37. “U.S. Department of Transportation”; National Transit Database 38. “Calculator Soup”; Amortization Schedule Calculator 39. “MotorScooterShop”; Scooter Cost: How Much Does a Motor Scooter Cost? 40. “Maryland Department of Transportation”; Department of Transportation MVA; Mopeds and Motor Scooters 41. “Edmunds”; Depreciation Infographic: How Fast Does My New Car Lose Value; September, 24, 2010 42. “Bankrate”; Table: Car-Ownership Costs By State; Chris Kahn 43. “CNBC”; Americans Borrowing Record Amount to Buy Cars; Phil LeBeau; March 4, 2014 44. “U.S. DoT: Bureau of Transportation Statistics”; Average Fuel Efficiency of U.S. Light Duty Vehicle ; 1980-2013 45. “University of California at Davis”; Electric and Gasoline Vehicle Lifecycle Cost and Energy-Use Model; April 2000 46. “Kelly Blue Book”; What Is 5-Year Cost to Own? 47. “Edmunds”; How Much Should a Car Down Payment Be?; Ronald Montoya; February 21, 2014 48. “PACommutes”; Alternative Transportation in Pennsylvania: Benefits 49. “Hofstra University”; The Geography of Transport Systems: Transport Supply and Demand; Dr. Jean-Paul Rodrigue and Dr. Theo Notteboom Disclaimer: The content in this newsletter is for informational purposes only, and does not constitute financial planning or any other kind of advice, and should not be construed as such. Any opinions or statements expressed by cited third parties do not necessarily reflect those of Moneycation™. All information within this newsletter is to be used or not used at the sole discretion of the reader and its authenticity and accuracy are not guaranteed. The author of this newsletter assumes no liability for actions, decisions or events relating in any way to this newsletter's content. Copyright © 2014 Moneycation™; All Rights Reserved