SlideShare a Scribd company logo
1 of 15
ITEMS Counting Year 2015 Year 2016 Year 2017
Revenues from sales 53 154,048,895 187,754,283 216,708,677
Cost of goods sold 54 (104,700,887) (118,244,730) (130,480,72)
Gross Profit 55 49,348,008 69,509,553 86,227,952
Operating expenses 56 (34,742,191) (42,388,520) (51,370,553)
Operating Profit 57 14,605,817 27,121,033 34,857,399
Financial income 58 1,444,895 808,215 1,469,509
Profit before tax 59 16,050,712 27,929,248 36,353,908
Income tax expense 60 (3,204,999) (5,666,822) (7,476,087)
Profit of the year 61 12,845,713 22,262,426 28,877,821
Balance Sheet Items Counting Year 2015 Year 2016 Year 2017
Assets
Money and its equivalents Current assets
Money and its equivalents 1 13,716,517 17,544,076 15,431,422
Short-term financial instruments 2 10,764,546 16,243,056 34,798,353
Available-for-sale financial assets 3 612,426 1,175,309 1,410,525
A/R 4 22,549,741 24,903,927 26,415,175
Advances 5 1,340,947 1,563,279 1,827,147
Prepaid expenses 6 2,174,832 2,112,066 2,343,362
Inventory 7 14,673,434 16,569,333 18,132,160
Assets held for sale 8 0 0 2,574,370
Other current assets 9 923,288 1,365,023 2,023,680
Total current assets 10 66,755,731 81,476,069 104,956,194
Non-current assets
Available-for-sale financial assets 11 3,009,614 4,882,060 5,911,475
Investments in other enterprises (j.v) 12 8,593,193 8,202,305 6,085,750
Land, factories and equipment 13 57,925,451 63,938,701 71,540,214
Intangible assets 14 3,132,514 3,482,126 3,772,008
Deposits 15 739,299 760,613 0
Prepayment of long-term expenses 16 3,224,914 3,282,120 3,284,168
Income tax prepayment (profit) 17 1,664,724 2,349,062 4,379,589
Other fixed assets 18 412,746 678,919 2,927,627
Total non-current assets 19 78,702,455 87,575,906 87,309,447
TOTAL PROPERTY 20 145,458,186 169,051,975 192,265,641
Liabilities and Capital
Short-term liabilities
ACCOUNTS PAYABLE 21 17,280,823 15,768,229 16,709,661
Short-term loans 22 9,012,904 7,883,253 6,101,125
Unearned income 23 1,354,433 1,416,928 1,616,899
Withholding tax 24 1,601,223 902,226 1,114,419
Accrual costs 25 7,304,386 8,864,864 10,750,052
Profit tax payable 26 1,178,973 3,008,994 3,208,583
Loans and bonds 27 0 0 2,298,712
Current installment of long-term loans 28 28,281 932,695 0
Provisions 29 3,281,240 4,719,310 6,383,470
Liabilities held for sale 30 0 0 0
Other short-term liabilities 31 334,839 321,120 443,450
Total current liabilities 32 41,377,102 43,817,619 48,626,371
HORIZONTAL ANALYSIS OF INCOME STATEMENT AND
BALANCE SHEET FROM 2015-2017
HORIZONTAL ANALYSIS:
IS A FINANCIAL ANALYSIS TECHNIQUE USED TO
EVALUATE A COMPANY'S PERFORMANCE OVER TIME. BY
COMPARING PRIOR-PERIOD FINANCIAL RESULTS WITH
MORE CURRENT FINANCIAL RESULTS, A COMPANY IS
BETTER ABLE TO SPOT THE DIRECTION OF CHANGE IN
ACCOUNT BALANCES AND THE MAGNITUDE IN WHICH
THAT CHANGE HAS OCCURRED.
ITEMS NUMBERs YEAR 2015(%) YEAR 2016 YEAR 2017
Revenues from
sales
1 86.63902415% 71.08570692 100.00%
Cost of goods
sold
2 -0.67% -1% 100.00%
Gross Profit 3 80.6113927% 57.22971131% 100.00%
Operating
expenses
4 82.51521061% 67.63055675% 100.00%
Operating
Profit
5 77.80567047% 41.90162611% 100.00%
Financial
income
6 54.99898265% 98.32501876% 100.00%
Profit before
tax
7 76.82598526% 44.15126979% 100.00%
Income tax
expense
8 75.79930517% 42.87000673% 100.00%
Profit of the
year
9 77.09177919% 44.4829719% 100.00%
Balance Sheet Items YEAR 2015 YEAR 2016 YEAR 2017
Assets % % %
Money and its equivalents Current assets
Money and its equivalents 88.88692824 113.6905983 100
Short-term financial instruments 30.93406748 46.67765742 100
Available-for-sale financial assets 43.4183017 83.32422325 100
A/R 85.36661597 94.27886433 100
Advances 73.39020889 85.55846902 100
Prepaid expenses 92.80819609 90.12973668 100
Inventory 80.92490911 91.38091104 100
Assets held for sale 0 0 100
Other current assets 45.62420936 67.45251225 100
Total current assets 63.60342201 77.62864286 100
Non-current assets
Available-for-sale financial assets 50.91138844 82.58615659 100
Investments in other enterprises (j.v) 141.2018732 134.7788687 100
Land, factories and equipment 80.96907706 89.37448943 100
Intangible assets 83.0463244 92.31491556 100
Deposits 0 0 100
Prepayment of long-term expenses 98.1957683 99.93764022 100
Income tax prepayment (profit) 38.01096404 53.63658553 100
Other fixed assets 14.09831239 23.19007852 100
Total non-current assets 90.1419694 100.3051892 100
Liabilities and Capital
Short-term liabilities
ACCOUNTS PAYABLE 103.4181543 94.36594195 100
Short-term loans 147.7252802 129.2098261 100
Unearned income 83.76732251 87.63243715 100
Withholding tax 143.6823134 80.95931602 100
Accrual costs 67.94744807 82.46345227 100
Profit tax payable 36.74435101 93.77952822 100
Loans and bonds 0 0 100
Current installment of long-term loans 0 0 100
Provisions 51.40213708 73.93016651 100
Liabilities held for sale 0 0 100
Other short-term liabilities 75.50772353 72.41402638 100
Total current liabilities 85.09189797 90.11081456 100
Long-term liabilities
0 0 100
Long-term loans 128.029502 182.9618798 100
LIABILITIES PAYABLE 95.81788156 109.0083793 100
Net defined benefit obligations 0
0
100
Liabilities Other unsecured long-term bonds 0
0
100
Pension liability 0 0 100
Profit tax (income) payable 38.23816854 56.19876749 100
Provisions 77.64068585 87.32516582 100
Other long-term liabilities 33.69359804 43.65538594 100
Equity
Ordinary shares 98.52484009
98.52484009
100
Premium from shares 98.52489229
98.52489229
100
Retained earnings 64.7258643
79.55284794
100
Other reserves 60.76533698
85.33800463
100
Other comprehensive income 0
0
100
Uncontrolled interest 74.65735943
77.53714212
100
EQUITY 66.53898688
79.78363622
100
Preferential shares 98.5248262
98.5248262
100
Total long-term liabilities 68.71209518
83.72202371
100
Total liabilities and capital 71.70478124
83.33552905
100
VERTICAL ANALYSIS
INCOME STATEMENT AND BALANCE SHEET 2015-2017 OF
SUMSUNG COMPAN
VERTICAL ANALYSIS:
IS A TECHNIQUE USED IN FINANCIAL
STATEMENT ANALYSIS TO SHOW THE
RELATIVE SIZE OF EACH ACCOUNT
COMPARED TO THE TOTAL AMOUNT.
VERTICAL ANALYSIS EXPRESSES EACH ITEM
ON A FINANCIAL STATEMENT AS A
PERCENTAGE OF THE TOTAL.
ITEMS YEAR 2015 YEAR 2016 YEAR 2017
Revenues from sales 100% 100% 100%
Cost of goods sold -67.9660098% -62.97% 6%
Gross Profit 32.03399025% 37% 40%
Operating expenses -22.5527038% -23% -24%
Operating Profit 9.481286445% 1% 16%
Financial income 0.937945709% 0% 0%
Profit before tax 10.41923215% 15% 17%
Income tax expense -2.08050762% -3% -3%
Profit of the year 8.338724533% 12% 13%
Balance Sheet Items YEAR 2015(%) YEAR 2016(%) YEAR
2017(%)
Assets
Money and its equivalents Current assets
Money and its equivalents 9.4 10 8
Short-term financial instruments 7.400440151 10 18
Available-for-sale financial assets 0.421032337 1 1
A/R 15.50255893 15 14
Advances 0.921877989 1 1
Prepaid expenses 1.495159578 1 1
Inventory 10.08773339 10 9
Assets held for sale 0 1.338965
187
Other current assets 0.634744613 1 1
Total current assets 45.89341641 48 55
Non-current assets
Available-for-sale financial assets 2.069057839 3 3
Investments in other enterprises (j.v) 5.907672326 5 3
Land, factories and equipment 39.82275085 38 37
Intangible assets 2.153549474 2 -2
Deposits 0.508255342 0
Prepayment of long-term expenses 2.217072884 2 2
Income tax prepayment (profit) 1.144469105 1 2
Other fixed assets 0.283755773 0 2
Total non-current assets 54.10658359 51.0 45
Liabilities and Capital
Short-term liabilities 2015 2016 2017
ACCOUNTS PAYABLE 11.88026846 9.327444415 8.237161617
Short-term loans 6.196216416 4.663212601 3.007598578
Unearned income 0.931149382 0.838161163 0.79706335
Withholding tax 1.100813261 0.533697403 0.549361798
Accrual costs 5.02163969 5.243868934 5.299324487
Profit tax payable 0.810523651 1.779922417 1.581696764
Loans and bonds 0 0 1.133168546
Current installment of long-term loans 0.019442701 0.551720854 0
Provisions 2.25579604 2.791632573 3.146782814
Liabilities held for sale 0 0 0
Other short-term liabilities 0.230196051 0.189953415 0.21860224
Total current liabilities 28.44604566 25.91961378 23.97076019
Long-term liabilities
0 0 0.612433807
Long-term loans 0.821644373 1.010304671 0.460173859
LIABILITIES PAYABLE 0.657767724 0.64387831 0.492236835
Net defined benefit obligations 0 0 0.866472827
Liabilities Other unsecured long-term
bonds
2.363585092 2.000881682 0
Pension liability 0.718348021 0.955389607 0
Profit tax (income) payable 1.497713577 1.89398438 2.80853473
Provisions 0.233133665 0.225617595 0.215309773
Other long-term liabilities 0.233867897 0.260722775 0.497704233
TOTAL OBLIGATIONS 34.972106 32.91039279 29.92362626
Ordinary shares 0.499387501 0.429690336 0.036344613
Premium from shares 2.826627441 2.432128344 2.057172533
Retained earnings 62.65898985 66.26423383 69.41505082
Other reserves -3.744470593 -4.524753408 -4.41857905
Other comprehensive income 0 0 o
Uncontrolled interest 2.71068003 2.422330174 2.603477006
EQUITY 65.027894 67.08960721 70.07637374
Preferential shares 0.076679768 0.065977934 0.0558063
Total long-term liabilities 5.704415976 5.980474348 5.952866064
Total liabilities and capital 100 100 100

More Related Content

Similar to HORIZONTAL ANALYSIS OF INCOME STATEMENT AND BALANCE SHEET[1].pptx

Financial ratios asian paints
Financial ratios   asian paintsFinancial ratios   asian paints
Financial ratios asian paints
Salil Nagvekar
 
ITC PPT.pptx itc report their csr activities and management discussion analys...
ITC PPT.pptx itc report their csr activities and management discussion analys...ITC PPT.pptx itc report their csr activities and management discussion analys...
ITC PPT.pptx itc report their csr activities and management discussion analys...
ShwetaManwadkar2
 
AT&T Financial and Operational Results
AT&T Financial and Operational ResultsAT&T Financial and Operational Results
AT&T Financial and Operational Results
finance1
 
AT&TFinancial and Operational Results
AT&TFinancial and Operational ResultsAT&TFinancial and Operational Results
AT&TFinancial and Operational Results
finance1
 

Similar to HORIZONTAL ANALYSIS OF INCOME STATEMENT AND BALANCE SHEET[1].pptx (20)

UAC annual report 2018
UAC annual report 2018UAC annual report 2018
UAC annual report 2018
 
Project
ProjectProject
Project
 
Balance sheet projection
Balance sheet projectionBalance sheet projection
Balance sheet projection
 
bpcl and hpcl
bpcl and hpclbpcl and hpcl
bpcl and hpcl
 
120981064 new-doll
120981064 new-doll120981064 new-doll
120981064 new-doll
 
Nordnet's report presentation, January-September 2015
Nordnet's report presentation, January-September 2015Nordnet's report presentation, January-September 2015
Nordnet's report presentation, January-September 2015
 
Financial management
Financial managementFinancial management
Financial management
 
Financial management VN
Financial management VNFinancial management VN
Financial management VN
 
Valuation of Indian hospitality industry
Valuation of Indian hospitality industryValuation of Indian hospitality industry
Valuation of Indian hospitality industry
 
Finance present
Finance presentFinance present
Finance present
 
STC Financial Statement
STC Financial StatementSTC Financial Statement
STC Financial Statement
 
Financial ratios asian paints
Financial ratios   asian paintsFinancial ratios   asian paints
Financial ratios asian paints
 
Roll no. 20
Roll no. 20Roll no. 20
Roll no. 20
 
Financial anlysis of Airtel and Vodafone
Financial anlysis of Airtel and VodafoneFinancial anlysis of Airtel and Vodafone
Financial anlysis of Airtel and Vodafone
 
Security analysis
Security analysisSecurity analysis
Security analysis
 
ITC PPT.pptx itc report their csr activities and management discussion analys...
ITC PPT.pptx itc report their csr activities and management discussion analys...ITC PPT.pptx itc report their csr activities and management discussion analys...
ITC PPT.pptx itc report their csr activities and management discussion analys...
 
wasif file
wasif filewasif file
wasif file
 
Roll no..18.
Roll no..18.Roll no..18.
Roll no..18.
 
AT&T Financial and Operational Results
AT&T Financial and Operational ResultsAT&T Financial and Operational Results
AT&T Financial and Operational Results
 
AT&TFinancial and Operational Results
AT&TFinancial and Operational ResultsAT&TFinancial and Operational Results
AT&TFinancial and Operational Results
 

More from ssuser9e852e1 (13)

Management Representation International SA .ppt
Management Representation International SA .pptManagement Representation International SA .ppt
Management Representation International SA .ppt
 
financial-statement-analysis and other.pptx
financial-statement-analysis and other.pptxfinancial-statement-analysis and other.pptx
financial-statement-analysis and other.pptx
 
ISA_580_presentation Written Represent.pptx
ISA_580_presentation Written Represent.pptxISA_580_presentation Written Represent.pptx
ISA_580_presentation Written Represent.pptx
 
04-Filing System Siddique Akbar Minhas .ppt
04-Filing System Siddique Akbar Minhas .ppt04-Filing System Siddique Akbar Minhas .ppt
04-Filing System Siddique Akbar Minhas .ppt
 
9780273713654_pp03b_time value of money.ppt
9780273713654_pp03b_time value of money.ppt9780273713654_pp03b_time value of money.ppt
9780273713654_pp03b_time value of money.ppt
 
111182584X_336067 Strategy in Leadership.ppt
111182584X_336067 Strategy in Leadership.ppt111182584X_336067 Strategy in Leadership.ppt
111182584X_336067 Strategy in Leadership.ppt
 
111182584X_336067_strategic leadership.ppt
111182584X_336067_strategic leadership.ppt111182584X_336067_strategic leadership.ppt
111182584X_336067_strategic leadership.ppt
 
Week 5,6 on policy makingslides in pakistan.ppt
Week 5,6 on policy makingslides in pakistan.pptWeek 5,6 on policy makingslides in pakistan.ppt
Week 5,6 on policy makingslides in pakistan.ppt
 
Role of Municipal Courts in the Judicial System.ppt
Role of Municipal Courts in the Judicial System.pptRole of Municipal Courts in the Judicial System.ppt
Role of Municipal Courts in the Judicial System.ppt
 
Brigham_FFM16_Concise11_ch10ppt_PPT.pptx
Brigham_FFM16_Concise11_ch10ppt_PPT.pptxBrigham_FFM16_Concise11_ch10ppt_PPT.pptx
Brigham_FFM16_Concise11_ch10ppt_PPT.pptx
 
Tanks Clean - Schools Municipal Services.pptx
Tanks Clean - Schools Municipal Services.pptxTanks Clean - Schools Municipal Services.pptx
Tanks Clean - Schools Municipal Services.pptx
 
AGibson_13E_Ch05 (1).pptx
AGibson_13E_Ch05 (1).pptxAGibson_13E_Ch05 (1).pptx
AGibson_13E_Ch05 (1).pptx
 
Week 5.ppt
Week 5.pptWeek 5.ppt
Week 5.ppt
 

Recently uploaded

Abortion pills in Muscut<Oman(+27737758557) Cytotec available.inn Kuwait City.
Abortion pills in Muscut<Oman(+27737758557) Cytotec available.inn Kuwait City.Abortion pills in Muscut<Oman(+27737758557) Cytotec available.inn Kuwait City.
Abortion pills in Muscut<Oman(+27737758557) Cytotec available.inn Kuwait City.
daisycvs
 
Presentation4 (2) survey responses clearly labelled
Presentation4 (2) survey responses clearly labelledPresentation4 (2) survey responses clearly labelled
Presentation4 (2) survey responses clearly labelled
CaitlinCummins3
 
Constitution of Company Article of Association
Constitution of Company Article of AssociationConstitution of Company Article of Association
Constitution of Company Article of Association
seri bangash
 
NewBase 17 May 2024 Energy News issue - 1725 by Khaled Al Awadi_compresse...
NewBase   17 May  2024  Energy News issue - 1725 by Khaled Al Awadi_compresse...NewBase   17 May  2024  Energy News issue - 1725 by Khaled Al Awadi_compresse...
NewBase 17 May 2024 Energy News issue - 1725 by Khaled Al Awadi_compresse...
Khaled Al Awadi
 
PEMATANG SIANTAR 0851/8063/4797 JUAL OBAT ABORSI CYTOTEC PEMATANG SIANTAR
PEMATANG SIANTAR 0851/8063/4797 JUAL OBAT ABORSI CYTOTEC PEMATANG SIANTARPEMATANG SIANTAR 0851/8063/4797 JUAL OBAT ABORSI CYTOTEC PEMATANG SIANTAR
PEMATANG SIANTAR 0851/8063/4797 JUAL OBAT ABORSI CYTOTEC PEMATANG SIANTAR
doktercalysta
 
RATINGS OF EACH VIDEO FOR UNI PROJECT IWDSFODF
RATINGS OF EACH VIDEO FOR UNI PROJECT IWDSFODFRATINGS OF EACH VIDEO FOR UNI PROJECT IWDSFODF
RATINGS OF EACH VIDEO FOR UNI PROJECT IWDSFODF
CaitlinCummins3
 

Recently uploaded (20)

بروفايل شركة ميار الخليج للاستشارات الهندسية.pdf
بروفايل شركة ميار الخليج للاستشارات الهندسية.pdfبروفايل شركة ميار الخليج للاستشارات الهندسية.pdf
بروفايل شركة ميار الخليج للاستشارات الهندسية.pdf
 
The Truth About Dinesh Bafna's Situation.pdf
The Truth About Dinesh Bafna's Situation.pdfThe Truth About Dinesh Bafna's Situation.pdf
The Truth About Dinesh Bafna's Situation.pdf
 
Innomantra Viewpoint - Building Moonshots : May-Jun 2024.pdf
Innomantra Viewpoint - Building Moonshots : May-Jun 2024.pdfInnomantra Viewpoint - Building Moonshots : May-Jun 2024.pdf
Innomantra Viewpoint - Building Moonshots : May-Jun 2024.pdf
 
Guide to Networking Essentials 8th Edition by Greg Tomsho solution manual.doc
Guide to Networking Essentials 8th Edition by Greg Tomsho solution manual.docGuide to Networking Essentials 8th Edition by Greg Tomsho solution manual.doc
Guide to Networking Essentials 8th Edition by Greg Tomsho solution manual.doc
 
stock price prediction using machine learning
stock price prediction using machine learningstock price prediction using machine learning
stock price prediction using machine learning
 
Hyundai capital 2024 1q Earnings release
Hyundai capital 2024 1q Earnings releaseHyundai capital 2024 1q Earnings release
Hyundai capital 2024 1q Earnings release
 
hyundai capital 2023 consolidated financial statements
hyundai capital 2023 consolidated financial statementshyundai capital 2023 consolidated financial statements
hyundai capital 2023 consolidated financial statements
 
Abortion pills in Muscut<Oman(+27737758557) Cytotec available.inn Kuwait City.
Abortion pills in Muscut<Oman(+27737758557) Cytotec available.inn Kuwait City.Abortion pills in Muscut<Oman(+27737758557) Cytotec available.inn Kuwait City.
Abortion pills in Muscut<Oman(+27737758557) Cytotec available.inn Kuwait City.
 
Presentation4 (2) survey responses clearly labelled
Presentation4 (2) survey responses clearly labelledPresentation4 (2) survey responses clearly labelled
Presentation4 (2) survey responses clearly labelled
 
Series A Fundraising Guide (Investing Individuals Improving Our World) by Accion
Series A Fundraising Guide (Investing Individuals Improving Our World) by AccionSeries A Fundraising Guide (Investing Individuals Improving Our World) by Accion
Series A Fundraising Guide (Investing Individuals Improving Our World) by Accion
 
How to refresh to be fit for the future world
How to refresh to be fit for the future worldHow to refresh to be fit for the future world
How to refresh to be fit for the future world
 
Constitution of Company Article of Association
Constitution of Company Article of AssociationConstitution of Company Article of Association
Constitution of Company Article of Association
 
NewBase 17 May 2024 Energy News issue - 1725 by Khaled Al Awadi_compresse...
NewBase   17 May  2024  Energy News issue - 1725 by Khaled Al Awadi_compresse...NewBase   17 May  2024  Energy News issue - 1725 by Khaled Al Awadi_compresse...
NewBase 17 May 2024 Energy News issue - 1725 by Khaled Al Awadi_compresse...
 
Progress Report - UKG Analyst Summit 2024 - A lot to do - Good Progress1-1.pdf
Progress Report - UKG Analyst Summit 2024 - A lot to do - Good Progress1-1.pdfProgress Report - UKG Analyst Summit 2024 - A lot to do - Good Progress1-1.pdf
Progress Report - UKG Analyst Summit 2024 - A lot to do - Good Progress1-1.pdf
 
PEMATANG SIANTAR 0851/8063/4797 JUAL OBAT ABORSI CYTOTEC PEMATANG SIANTAR
PEMATANG SIANTAR 0851/8063/4797 JUAL OBAT ABORSI CYTOTEC PEMATANG SIANTARPEMATANG SIANTAR 0851/8063/4797 JUAL OBAT ABORSI CYTOTEC PEMATANG SIANTAR
PEMATANG SIANTAR 0851/8063/4797 JUAL OBAT ABORSI CYTOTEC PEMATANG SIANTAR
 
Elevate Your Online Presence with SEO Services
Elevate Your Online Presence with SEO ServicesElevate Your Online Presence with SEO Services
Elevate Your Online Presence with SEO Services
 
RATINGS OF EACH VIDEO FOR UNI PROJECT IWDSFODF
RATINGS OF EACH VIDEO FOR UNI PROJECT IWDSFODFRATINGS OF EACH VIDEO FOR UNI PROJECT IWDSFODF
RATINGS OF EACH VIDEO FOR UNI PROJECT IWDSFODF
 
Creative Ideas for Interactive Team Presentations
Creative Ideas for Interactive Team PresentationsCreative Ideas for Interactive Team Presentations
Creative Ideas for Interactive Team Presentations
 
PitchBook’s Guide to VC Funding for Startups
PitchBook’s Guide to VC Funding for StartupsPitchBook’s Guide to VC Funding for Startups
PitchBook’s Guide to VC Funding for Startups
 
Blinkit: Revolutionizing the On-Demand Grocery Delivery Service.pptx
Blinkit: Revolutionizing the On-Demand Grocery Delivery Service.pptxBlinkit: Revolutionizing the On-Demand Grocery Delivery Service.pptx
Blinkit: Revolutionizing the On-Demand Grocery Delivery Service.pptx
 

HORIZONTAL ANALYSIS OF INCOME STATEMENT AND BALANCE SHEET[1].pptx

  • 1. ITEMS Counting Year 2015 Year 2016 Year 2017 Revenues from sales 53 154,048,895 187,754,283 216,708,677 Cost of goods sold 54 (104,700,887) (118,244,730) (130,480,72) Gross Profit 55 49,348,008 69,509,553 86,227,952 Operating expenses 56 (34,742,191) (42,388,520) (51,370,553) Operating Profit 57 14,605,817 27,121,033 34,857,399 Financial income 58 1,444,895 808,215 1,469,509 Profit before tax 59 16,050,712 27,929,248 36,353,908 Income tax expense 60 (3,204,999) (5,666,822) (7,476,087) Profit of the year 61 12,845,713 22,262,426 28,877,821
  • 2. Balance Sheet Items Counting Year 2015 Year 2016 Year 2017 Assets Money and its equivalents Current assets Money and its equivalents 1 13,716,517 17,544,076 15,431,422 Short-term financial instruments 2 10,764,546 16,243,056 34,798,353 Available-for-sale financial assets 3 612,426 1,175,309 1,410,525 A/R 4 22,549,741 24,903,927 26,415,175 Advances 5 1,340,947 1,563,279 1,827,147 Prepaid expenses 6 2,174,832 2,112,066 2,343,362 Inventory 7 14,673,434 16,569,333 18,132,160 Assets held for sale 8 0 0 2,574,370 Other current assets 9 923,288 1,365,023 2,023,680 Total current assets 10 66,755,731 81,476,069 104,956,194 Non-current assets Available-for-sale financial assets 11 3,009,614 4,882,060 5,911,475 Investments in other enterprises (j.v) 12 8,593,193 8,202,305 6,085,750 Land, factories and equipment 13 57,925,451 63,938,701 71,540,214 Intangible assets 14 3,132,514 3,482,126 3,772,008 Deposits 15 739,299 760,613 0 Prepayment of long-term expenses 16 3,224,914 3,282,120 3,284,168 Income tax prepayment (profit) 17 1,664,724 2,349,062 4,379,589 Other fixed assets 18 412,746 678,919 2,927,627 Total non-current assets 19 78,702,455 87,575,906 87,309,447 TOTAL PROPERTY 20 145,458,186 169,051,975 192,265,641
  • 3. Liabilities and Capital Short-term liabilities ACCOUNTS PAYABLE 21 17,280,823 15,768,229 16,709,661 Short-term loans 22 9,012,904 7,883,253 6,101,125 Unearned income 23 1,354,433 1,416,928 1,616,899 Withholding tax 24 1,601,223 902,226 1,114,419 Accrual costs 25 7,304,386 8,864,864 10,750,052 Profit tax payable 26 1,178,973 3,008,994 3,208,583 Loans and bonds 27 0 0 2,298,712 Current installment of long-term loans 28 28,281 932,695 0 Provisions 29 3,281,240 4,719,310 6,383,470 Liabilities held for sale 30 0 0 0 Other short-term liabilities 31 334,839 321,120 443,450 Total current liabilities 32 41,377,102 43,817,619 48,626,371
  • 4. HORIZONTAL ANALYSIS OF INCOME STATEMENT AND BALANCE SHEET FROM 2015-2017
  • 5. HORIZONTAL ANALYSIS: IS A FINANCIAL ANALYSIS TECHNIQUE USED TO EVALUATE A COMPANY'S PERFORMANCE OVER TIME. BY COMPARING PRIOR-PERIOD FINANCIAL RESULTS WITH MORE CURRENT FINANCIAL RESULTS, A COMPANY IS BETTER ABLE TO SPOT THE DIRECTION OF CHANGE IN ACCOUNT BALANCES AND THE MAGNITUDE IN WHICH THAT CHANGE HAS OCCURRED.
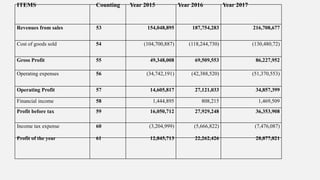
  • 6. ITEMS NUMBERs YEAR 2015(%) YEAR 2016 YEAR 2017 Revenues from sales 1 86.63902415% 71.08570692 100.00% Cost of goods sold 2 -0.67% -1% 100.00% Gross Profit 3 80.6113927% 57.22971131% 100.00% Operating expenses 4 82.51521061% 67.63055675% 100.00% Operating Profit 5 77.80567047% 41.90162611% 100.00% Financial income 6 54.99898265% 98.32501876% 100.00% Profit before tax 7 76.82598526% 44.15126979% 100.00% Income tax expense 8 75.79930517% 42.87000673% 100.00% Profit of the year 9 77.09177919% 44.4829719% 100.00%
  • 7. Balance Sheet Items YEAR 2015 YEAR 2016 YEAR 2017 Assets % % % Money and its equivalents Current assets Money and its equivalents 88.88692824 113.6905983 100 Short-term financial instruments 30.93406748 46.67765742 100 Available-for-sale financial assets 43.4183017 83.32422325 100 A/R 85.36661597 94.27886433 100 Advances 73.39020889 85.55846902 100 Prepaid expenses 92.80819609 90.12973668 100 Inventory 80.92490911 91.38091104 100 Assets held for sale 0 0 100 Other current assets 45.62420936 67.45251225 100 Total current assets 63.60342201 77.62864286 100 Non-current assets Available-for-sale financial assets 50.91138844 82.58615659 100 Investments in other enterprises (j.v) 141.2018732 134.7788687 100 Land, factories and equipment 80.96907706 89.37448943 100 Intangible assets 83.0463244 92.31491556 100 Deposits 0 0 100 Prepayment of long-term expenses 98.1957683 99.93764022 100 Income tax prepayment (profit) 38.01096404 53.63658553 100 Other fixed assets 14.09831239 23.19007852 100 Total non-current assets 90.1419694 100.3051892 100
  • 8. Liabilities and Capital Short-term liabilities ACCOUNTS PAYABLE 103.4181543 94.36594195 100 Short-term loans 147.7252802 129.2098261 100 Unearned income 83.76732251 87.63243715 100 Withholding tax 143.6823134 80.95931602 100 Accrual costs 67.94744807 82.46345227 100 Profit tax payable 36.74435101 93.77952822 100 Loans and bonds 0 0 100 Current installment of long-term loans 0 0 100 Provisions 51.40213708 73.93016651 100 Liabilities held for sale 0 0 100 Other short-term liabilities 75.50772353 72.41402638 100 Total current liabilities 85.09189797 90.11081456 100 Long-term liabilities 0 0 100 Long-term loans 128.029502 182.9618798 100 LIABILITIES PAYABLE 95.81788156 109.0083793 100 Net defined benefit obligations 0 0 100 Liabilities Other unsecured long-term bonds 0 0 100 Pension liability 0 0 100 Profit tax (income) payable 38.23816854 56.19876749 100 Provisions 77.64068585 87.32516582 100 Other long-term liabilities 33.69359804 43.65538594 100
  • 9. Equity Ordinary shares 98.52484009 98.52484009 100 Premium from shares 98.52489229 98.52489229 100 Retained earnings 64.7258643 79.55284794 100 Other reserves 60.76533698 85.33800463 100 Other comprehensive income 0 0 100 Uncontrolled interest 74.65735943 77.53714212 100 EQUITY 66.53898688 79.78363622 100 Preferential shares 98.5248262 98.5248262 100 Total long-term liabilities 68.71209518 83.72202371 100 Total liabilities and capital 71.70478124 83.33552905 100
  • 10. VERTICAL ANALYSIS INCOME STATEMENT AND BALANCE SHEET 2015-2017 OF SUMSUNG COMPAN
  • 11. VERTICAL ANALYSIS: IS A TECHNIQUE USED IN FINANCIAL STATEMENT ANALYSIS TO SHOW THE RELATIVE SIZE OF EACH ACCOUNT COMPARED TO THE TOTAL AMOUNT. VERTICAL ANALYSIS EXPRESSES EACH ITEM ON A FINANCIAL STATEMENT AS A PERCENTAGE OF THE TOTAL.
  • 12. ITEMS YEAR 2015 YEAR 2016 YEAR 2017 Revenues from sales 100% 100% 100% Cost of goods sold -67.9660098% -62.97% 6% Gross Profit 32.03399025% 37% 40% Operating expenses -22.5527038% -23% -24% Operating Profit 9.481286445% 1% 16% Financial income 0.937945709% 0% 0% Profit before tax 10.41923215% 15% 17% Income tax expense -2.08050762% -3% -3% Profit of the year 8.338724533% 12% 13%
  • 13. Balance Sheet Items YEAR 2015(%) YEAR 2016(%) YEAR 2017(%) Assets Money and its equivalents Current assets Money and its equivalents 9.4 10 8 Short-term financial instruments 7.400440151 10 18 Available-for-sale financial assets 0.421032337 1 1 A/R 15.50255893 15 14 Advances 0.921877989 1 1 Prepaid expenses 1.495159578 1 1 Inventory 10.08773339 10 9 Assets held for sale 0 1.338965 187 Other current assets 0.634744613 1 1 Total current assets 45.89341641 48 55 Non-current assets Available-for-sale financial assets 2.069057839 3 3 Investments in other enterprises (j.v) 5.907672326 5 3 Land, factories and equipment 39.82275085 38 37 Intangible assets 2.153549474 2 -2 Deposits 0.508255342 0 Prepayment of long-term expenses 2.217072884 2 2 Income tax prepayment (profit) 1.144469105 1 2 Other fixed assets 0.283755773 0 2 Total non-current assets 54.10658359 51.0 45
  • 14. Liabilities and Capital Short-term liabilities 2015 2016 2017 ACCOUNTS PAYABLE 11.88026846 9.327444415 8.237161617 Short-term loans 6.196216416 4.663212601 3.007598578 Unearned income 0.931149382 0.838161163 0.79706335 Withholding tax 1.100813261 0.533697403 0.549361798 Accrual costs 5.02163969 5.243868934 5.299324487 Profit tax payable 0.810523651 1.779922417 1.581696764 Loans and bonds 0 0 1.133168546 Current installment of long-term loans 0.019442701 0.551720854 0 Provisions 2.25579604 2.791632573 3.146782814 Liabilities held for sale 0 0 0 Other short-term liabilities 0.230196051 0.189953415 0.21860224 Total current liabilities 28.44604566 25.91961378 23.97076019 Long-term liabilities 0 0 0.612433807 Long-term loans 0.821644373 1.010304671 0.460173859 LIABILITIES PAYABLE 0.657767724 0.64387831 0.492236835 Net defined benefit obligations 0 0 0.866472827 Liabilities Other unsecured long-term bonds 2.363585092 2.000881682 0 Pension liability 0.718348021 0.955389607 0 Profit tax (income) payable 1.497713577 1.89398438 2.80853473 Provisions 0.233133665 0.225617595 0.215309773 Other long-term liabilities 0.233867897 0.260722775 0.497704233 TOTAL OBLIGATIONS 34.972106 32.91039279 29.92362626
  • 15. Ordinary shares 0.499387501 0.429690336 0.036344613 Premium from shares 2.826627441 2.432128344 2.057172533 Retained earnings 62.65898985 66.26423383 69.41505082 Other reserves -3.744470593 -4.524753408 -4.41857905 Other comprehensive income 0 0 o Uncontrolled interest 2.71068003 2.422330174 2.603477006 EQUITY 65.027894 67.08960721 70.07637374 Preferential shares 0.076679768 0.065977934 0.0558063 Total long-term liabilities 5.704415976 5.980474348 5.952866064 Total liabilities and capital 100 100 100