The document discusses various topics related to financial statement analysis using ratios, including:
- Types of ratios that measure liquidity, borrowing capacity, profitability, and cash flow
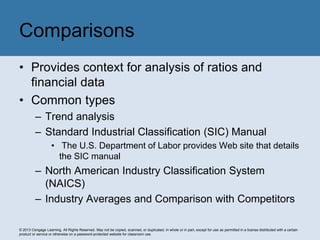
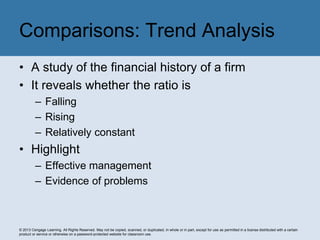
- How ratios should be interpreted by comparing to prior periods, competitors, industry standards, and analyzing trends
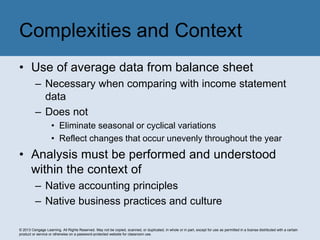
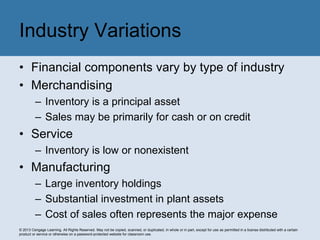
- Considerations for analysis such as accounting principles, business practices, and industry variations
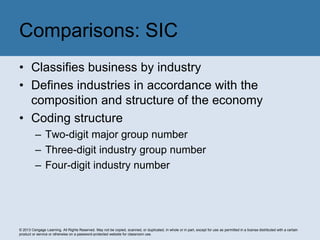
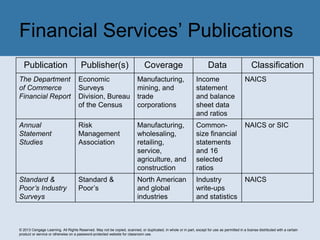
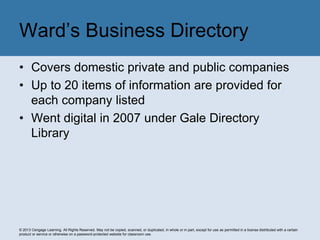
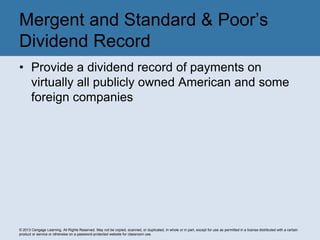
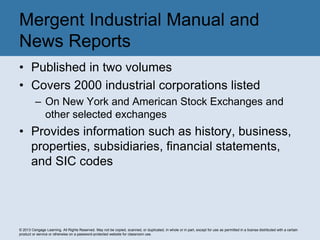
- Tools for comparisons including trend analysis, SIC and NAICS industry classifications, and industry average data sources


![HORIZONTAL ANALYSIS OF INCOME STATEMENT AND BALANCE SHEET[1].pptx](https://cdn.slidesharecdn.com/ss_thumbnails/horizontalanalysisofincomestatementandbalancesheet1-240509222743-3acfefa6-thumbnail.jpg?width=640&height=640&fit=bounds)


