SlideShare a Scribd company logo
1
“WIPRO LTD”
Submitted By: Bhumika Mangroliya
Submitted To: Miss Nilam Thakar
En no.167600585021
Profit and Loss Account
Parameters March '16 March'15 March'14
Operating Income 44,684.60 41,210.00 38,765.10
Less :Inter divisional transfers 0 0 0
Less: Excise 0 0.2 7.9
Net Sales 44,684.60 41,209.80 38,757.20
EXPENDITURE:
Stock Adjustments -53.1 -254.3 0.9
Raw Materials Consumed 2,655.70 2,799.80 2,491.10
Power & Fuel Cost 249.2 242.6 246.8
Employee Cost 21,379.70 19,726.30 18,337.50
Cost of Software developments 6,486.30 5,207.60 4,419.70
Operating Expenses 109.9 156.2 574.7
General and Administration Expenses 3,221.00 3,064.40 2,579.40
Selling and Marketing Expenses 226.7 156.7 140.7
Miscellaneous Expenses 1,303.20 914 1,045.50
Expenses Capitalised1
0 0 0
Total Expenditure 35,578.60 32,013.30 29,836.30
2
PBIDT (Excl OI) 9,106.00 9,196.50 8,920.90
Other Income 2,772.70 2,501.80 1,798.70
Operating Profit 11,878.70 11,698.30 10,719.60
Interest 527.8 362.9 374.7
PBDT 11,350.90 11,335.40 10,344.90
Depreciation 868.8 778.4 736.7
Profit Before Taxation & Exceptional Items 10,482.10 10,557.00 9,608.20
Exceptional Income / Expenses 0 0 0
Profit Before Tax 10,482.10 10,557.00 9,608.20
Provision for Tax 2,383.10 2,363.90 2,220.80
PAT 8,099.00 8,193.10 7,387.40
Extraordinary Items 0 0 0
Adj to Profit After Tax 134.2 0 0
Profit Balance B/F 15,994.70 12,176.90 7,837.10
Appropriations 24,227.90 20,370.00 15,224.50
Equity Dividend (%) 300 600 400
Earnings Per Share (in ₹) 32.78 33.19 29.96
Book Value (in ₹) 164.81 139.92 118.92
Comment:
Opening Income
35,000.00
36,000.00
37,000.00
38,000.00
39,000.00
40,000.00
41,000.00
42,000.00
43,000.00
44,000.00
45,000.00
46,000.00
2016 2015 2014
3
Net Sales
Stock Adjustments
Raw Materials Consumed
35,000.00
36,000.00
37,000.00
38,000.00
39,000.00
40,000.00
41,000.00
42,000.00
43,000.00
44,000.00
45,000.00
46,000.00
2016 2015 2016
-300
-250
-200
-150
-100
-50
0
50
2016 2015 2014
4
Power & Fuel Cost
Employee Cost
2,300.00
2,350.00
2,400.00
2,450.00
2,500.00
2,550.00
2,600.00
2,650.00
2,700.00
2,750.00
2,800.00
2,850.00
2016 2015 2014
238
240
242
244
246
248
250
2016 2015 2016
5
Cost of Software developments
Operating expenses
0
1000
2000
3000
4000
5000
6000
7000
2016 2015 2014
16500
17000
17500
18000
18500
19000
19500
20000
20500
21000
21500
22000
2016 2015 2014
6
General and Administration Expenses
Miscellaneous Expenses
0
100
200
300
400
500
600
700
2016 2015 2014
0
500
1000
1500
2000
2500
3000
3500
2016 2015 2014
7
PBIDT (Excl OI)
Other Income
0
200
400
600
800
1000
1200
1400
2016 2015 2014
8750
8800
8850
8900
8950
9000
9050
9100
9150
9200
9250
2016 2015
8
Interest
0
500
1000
1500
2000
2500
3000
2016 2015 2014
0
100
200
300
400
500
600
2016 2015 2014
9
Depreciation
Profit Before Taxation & Exceptional Items
PAT
650
700
750
800
850
900
2016 2015 2014
9000
9200
9400
9600
9800
10000
10200
10400
10600
10800
2016 2015 2014
10
Profit Balance B/F
Appropriations
6800
7000
7200
7400
7600
7800
8000
8200
8400
2014 2015 2016
0
2000
4000
6000
8000
10000
12000
14000
16000
18000
2016 2015 2014
11
Equity Dividend
Earnings Per Share
0
5000
10000
15000
20000
25000
30000
2016 2015 2014
0
100
200
300
400
500
600
700
2016 2015 2014
12
Balance Sheet
Parameters MAR'16 MAR'15 MAR'14
EQUITY AND LIABILITIES
Share Capital 494.10 493.70 493.20
Share Warrants & Out standings
Shareholder's Funds 40,905.20 34,621.60 29,355.9
Long-Term Borrowings 0.00 0.00 0.00
Secured Loans 120.10 114.30 106.00
Unsecured Loans 1,026.40 948.90 900.10
Deferred Tax Assets / Liabilities -218.20 -109.20 -10.80
Other Long Term Liabilities 46.40 28.10 62.90
Long Term Trade Payables 0.00 0.00 0.00
Long Term Provisions 399.10 273.60 288.90
Total Non-Current Liabilities 1,373.80 1,255.70 1,347.10
Trade Payables 5,993.10 5,728.80 5,356.60
Current Liabilities
Other Current Liabilities 2,665.20 2,551.10 2,404.80
Short Term Borrowings 5,549.50 4,970.40 3,504.20
Short Term Provisions 2,399.30 4,115.00 3,619.60
Total Current Liabilities 16,607.10 17,365.30 14,885.2
28
29
30
31
32
33
34
2016 2015 2014
13
Total Liabilities 58,886.10 53,242.60 45,588.2
Non-Current Assets 0.00 0.00 0.00
ASSETS
Gross Block 10,304.90 9,453.80 9,043.40
Less: Accumulated Depreciation 6,116.20 5,415.40 5,068.40
Less: Impairment of Assets 0.00 0.00 0.00
Net Block 4,188.70 4,038.40 3,975.00
Lease Adjustment A/c 0.00 0.00 0.00
Capital Work in Progress 325.10 361.20 275.10
Intangible assets under development 0.00 0.00 0.00
Pre-operative Expenses pending 0.00 0.00 0.00
Assets in transit 0.00 0.00 0.00
Non Current Investments 5,732.80 5,579.70 5,196.80
Long Term Loans & Advances 2,936.50 2,810.80 2,896.20
Other Non Current Assets 674.30 597.00 640.90
Total Non-Current Assets 13,857.40 13,387.10 12,984.0
Total Reserves 40,220.90 34,046.40 28,831.8
Current Assets Loans & Advances
Currents Investments 12,730.20 5,188.80 5,839.20
Inventories 526.20 479.40 228.30
Cash and Bank 12,007.80 15,667.50 10,554.9
Other Current Assets 6,571.20 6,044.70 4,963.90
Short Term Loans and Advances 4,488.50 4,330.90 2,467.00
Total Current Assets 45,028.70 39,855.50 32,604.2
Net Current Assets (Including Current Investments) 28,421.60 22,490.20 17,719.0
Total Current Assets Excluding Current Investments 32,298.50 34,666.70 26,765.0
Miscellaneous Expenses not written off 0.00 0.00 0.00
Total Assets 58,886.10 53,242.60 45,588.2
Contingent Liabilities 3,374.20 2,935.90 2,732.00
Total Debt 6,812.90 6,102.60 4,583.00
Book Value (in ₹) 164.80 0.00 118.92
Adjusted Book Value (in ₹) 164.80 0.00 118.92
Comment:
Share capital
14
Shareholder's Funds
Secured Loans
492.6
492.8
493
493.2
493.4
493.6
493.8
494
494.2
2016 2015 2014
0
5000
10000
15000
20000
25000
30000
35000
40000
45000
2016 2015 2014
15
Unsecured Loans
Deferred Tax Assets
95
100
105
110
115
120
125
2016 2015 2014
820
840
860
880
900
920
940
960
980
1000
1020
1040
2016 2015 2014
16
Other Long Term Liabilities
Long Term Provisions
-250
-200
-150
-100
-50
0
2016 2015 2014
0
10
20
30
40
50
60
70
2016 2015 2014
17
Total Non-Current Liabilities
Trade Payables
0
50
100
150
200
250
300
350
400
450
2016 2015 2014
1180
1200
1220
1240
1260
1280
1300
1320
1340
1360
1380
1400
2016 2015 2014
18
Other Current Liabilities
Short Term Borrowings
5000
5200
5400
5600
5800
6000
6200
2016 2015 2014
2250
2300
2350
2400
2450
2500
2550
2600
2650
2700
2016 2015 2014
19
Short Term Provisions
Total Current Liabilities
0
1000
2000
3000
4000
5000
6000
2016 2015 2014
0
500
1000
1500
2000
2500
3000
3500
4000
4500
2016 2015 2014
20
Total Liabilities
Gross Block
13500
14000
14500
15000
15500
16000
16500
17000
17500
18000
2016 2015 2014
0
10000
20000
30000
40000
50000
60000
70000
2016 2015 2014
21
Capital Work in Progress
Other Non Current Assets
8400
8600
8800
9000
9200
9400
9600
9800
10000
10200
10400
2016 2015 2014
0
50
100
150
200
250
300
350
400
2016 2015 2014
22
Total Reserves
Currents Investments
540
560
580
600
620
640
660
680
700
2016 2014 2014
0
5000
10000
15000
20000
25000
30000
35000
40000
45000
2016 2015 2014
23
Inventories
Cash and Bank
0.00
2,000.00
4,000.00
6,000.00
8,000.00
10,000.00
12,000.00
14,000.00
2016 2015 2014
0
100
200
300
400
500
600
2016 2015 2014
24
Other Current Assets
Short Term Loans and Advances
0
2000
4000
6000
8000
10000
12000
14000
16000
18000
2016 2015 2014
0.00
1,000.00
2,000.00
3,000.00
4,000.00
5,000.00
6,000.00
7,000.00
2016 2015 2014
25
Net Current Assets (Including Current
Investments)
Total Current Assets Excluding Current
Investments
0.00
500.00
1,000.00
1,500.00
2,000.00
2,500.00
3,000.00
3,500.00
4,000.00
4,500.00
5,000.00
2016 2015 2014
0.00
5,000.00
10,000.00
15,000.00
20,000.00
25,000.00
30,000.00
2016 2015 2014
26
Total Assets
Contingent Liabilities
0.00
5,000.00
10,000.00
15,000.00
20,000.00
25,000.00
30,000.00
35,000.00
40,000.00
2016 2015 2014
0.00
10,000.00
20,000.00
30,000.00
40,000.00
50,000.00
60,000.00
70,000.00
2016 2015 2014
27
Total Debt
2
2
www.moneycontrol.com › MARKETS › Computers - Software
0.00
500.00
1,000.00
1,500.00
2,000.00
2,500.00
3,000.00
3,500.00
4,000.00
2016 2015 2014
0.00
1,000.00
2,000.00
3,000.00
4,000.00
5,000.00
6,000.00
7,000.00
8,000.00
2016 2015 2014

More Related Content

Similar to Roll no. 20

NTPC Financial Modelling
NTPC Financial ModellingNTPC Financial Modelling
NTPC Financial Modelling
SHAHID HASSAN
 
NTPC Financial Modelling
NTPC Financial ModellingNTPC Financial Modelling
NTPC Financial Modelling
Shreya Banerjee
 
Cma report sample by banking91.com
Cma report sample by banking91.comCma report sample by banking91.com
Cma report sample by banking91.com
PulkitSharma799311
 
HORIZONTAL ANALYSIS OF INCOME STATEMENT AND BALANCE SHEET[1].pptx
HORIZONTAL ANALYSIS OF INCOME STATEMENT AND BALANCE SHEET[1].pptxHORIZONTAL ANALYSIS OF INCOME STATEMENT AND BALANCE SHEET[1].pptx
HORIZONTAL ANALYSIS OF INCOME STATEMENT AND BALANCE SHEET[1].pptx
ssuser9e852e1
 
Work sample
Work sampleWork sample
Work sample
Sam Khoukha - CFC
 
Financial anlysis of Airtel and Vodafone
Financial anlysis of Airtel and VodafoneFinancial anlysis of Airtel and Vodafone
Financial anlysis of Airtel and Vodafone
namankanthed
 
DABUR- DONE BY SNEHA
DABUR- DONE BY SNEHADABUR- DONE BY SNEHA
DABUR- DONE BY SNEHA
Sneha kamineni
 
Wipro prediction of development and bankruptcy
Wipro prediction of development and bankruptcyWipro prediction of development and bankruptcy
Wipro prediction of development and bankruptcy
Shahbaz Alam
 
Harkirat fm assignment
Harkirat fm assignmentHarkirat fm assignment
Harkirat fm assignmentAman Brar
 
Final work improved 6_revised (1)
Final work improved 6_revised (1)Final work improved 6_revised (1)
Final work improved 6_revised (1)Qasim Ali Pracha
 
Williams sonoma model
Williams sonoma model Williams sonoma model
Williams sonoma model
Trishala Rasya
 
Financial ratios asian paints
Financial ratios   asian paintsFinancial ratios   asian paints
Financial ratios asian paintsSalil Nagvekar
 
Acc 291 acc291
Acc 291 acc291Acc 291 acc291
Acc 291 acc291
GOODCourseHelp
 
Yes bank balance sheet
Yes bank balance sheetYes bank balance sheet
Yes bank balance sheet
Anujsingh11841
 
Financial Annual Report Common Size
Financial Annual Report Common SizeFinancial Annual Report Common Size
Financial Annual Report Common SizeTaylor Wiley
 
Financial Accounting Common Sizing Analysis Report
Financial Accounting Common Sizing Analysis ReportFinancial Accounting Common Sizing Analysis Report
Financial Accounting Common Sizing Analysis ReportNicholas Espinosa
 

Similar to Roll no. 20 (20)

BHARTI AIRTEL PPT
BHARTI AIRTEL PPTBHARTI AIRTEL PPT
BHARTI AIRTEL PPT
 
NTPC Financial Modelling
NTPC Financial ModellingNTPC Financial Modelling
NTPC Financial Modelling
 
NTPC Financial Modelling
NTPC Financial ModellingNTPC Financial Modelling
NTPC Financial Modelling
 
Cma report sample by banking91.com
Cma report sample by banking91.comCma report sample by banking91.com
Cma report sample by banking91.com
 
HORIZONTAL ANALYSIS OF INCOME STATEMENT AND BALANCE SHEET[1].pptx
HORIZONTAL ANALYSIS OF INCOME STATEMENT AND BALANCE SHEET[1].pptxHORIZONTAL ANALYSIS OF INCOME STATEMENT AND BALANCE SHEET[1].pptx
HORIZONTAL ANALYSIS OF INCOME STATEMENT AND BALANCE SHEET[1].pptx
 
Work sample
Work sampleWork sample
Work sample
 
Forcast Model
Forcast ModelForcast Model
Forcast Model
 
Financial anlysis of Airtel and Vodafone
Financial anlysis of Airtel and VodafoneFinancial anlysis of Airtel and Vodafone
Financial anlysis of Airtel and Vodafone
 
DABUR- DONE BY SNEHA
DABUR- DONE BY SNEHADABUR- DONE BY SNEHA
DABUR- DONE BY SNEHA
 
Wipro prediction of development and bankruptcy
Wipro prediction of development and bankruptcyWipro prediction of development and bankruptcy
Wipro prediction of development and bankruptcy
 
FINANCIAL ANALYSIS OF NOVARTIS INDIA
FINANCIAL ANALYSIS OF NOVARTIS INDIAFINANCIAL ANALYSIS OF NOVARTIS INDIA
FINANCIAL ANALYSIS OF NOVARTIS INDIA
 
Harkirat fm assignment
Harkirat fm assignmentHarkirat fm assignment
Harkirat fm assignment
 
Final work improved 6_revised (1)
Final work improved 6_revised (1)Final work improved 6_revised (1)
Final work improved 6_revised (1)
 
Williams sonoma model
Williams sonoma model Williams sonoma model
Williams sonoma model
 
Financial ratios asian paints
Financial ratios   asian paintsFinancial ratios   asian paints
Financial ratios asian paints
 
Acc 291 acc291
Acc 291 acc291Acc 291 acc291
Acc 291 acc291
 
Yes bank balance sheet
Yes bank balance sheetYes bank balance sheet
Yes bank balance sheet
 
Finance present
Finance presentFinance present
Finance present
 
Financial Annual Report Common Size
Financial Annual Report Common SizeFinancial Annual Report Common Size
Financial Annual Report Common Size
 
Financial Accounting Common Sizing Analysis Report
Financial Accounting Common Sizing Analysis ReportFinancial Accounting Common Sizing Analysis Report
Financial Accounting Common Sizing Analysis Report
 

Recently uploaded

How to Make a Field invisible in Odoo 17
How to Make a Field invisible in Odoo 17How to Make a Field invisible in Odoo 17
How to Make a Field invisible in Odoo 17
Celine George
 
A Strategic Approach: GenAI in Education
A Strategic Approach: GenAI in EducationA Strategic Approach: GenAI in Education
A Strategic Approach: GenAI in Education
Peter Windle
 
The approach at University of Liverpool.pptx
The approach at University of Liverpool.pptxThe approach at University of Liverpool.pptx
The approach at University of Liverpool.pptx
Jisc
 
Acetabularia Information For Class 9 .docx
Acetabularia Information For Class 9  .docxAcetabularia Information For Class 9  .docx
Acetabularia Information For Class 9 .docx
vaibhavrinwa19
 
The Accursed House by Émile Gaboriau.pptx
The Accursed House by Émile Gaboriau.pptxThe Accursed House by Émile Gaboriau.pptx
The Accursed House by Émile Gaboriau.pptx
DhatriParmar
 
Francesca Gottschalk - How can education support child empowerment.pptx
Francesca Gottschalk - How can education support child empowerment.pptxFrancesca Gottschalk - How can education support child empowerment.pptx
Francesca Gottschalk - How can education support child empowerment.pptx
EduSkills OECD
 
Sha'Carri Richardson Presentation 202345
Sha'Carri Richardson Presentation 202345Sha'Carri Richardson Presentation 202345
Sha'Carri Richardson Presentation 202345
beazzy04
 
Home assignment II on Spectroscopy 2024 Answers.pdf
Home assignment II on Spectroscopy 2024 Answers.pdfHome assignment II on Spectroscopy 2024 Answers.pdf
Home assignment II on Spectroscopy 2024 Answers.pdf
Tamralipta Mahavidyalaya
 
The geography of Taylor Swift - some ideas
The geography of Taylor Swift - some ideasThe geography of Taylor Swift - some ideas
The geography of Taylor Swift - some ideas
GeoBlogs
 
The Roman Empire A Historical Colossus.pdf
The Roman Empire A Historical Colossus.pdfThe Roman Empire A Historical Colossus.pdf
The Roman Empire A Historical Colossus.pdf
kaushalkr1407
 
2024.06.01 Introducing a competency framework for languag learning materials ...
2024.06.01 Introducing a competency framework for languag learning materials ...2024.06.01 Introducing a competency framework for languag learning materials ...
2024.06.01 Introducing a competency framework for languag learning materials ...
Sandy Millin
 
special B.ed 2nd year old paper_20240531.pdf
special B.ed 2nd year old paper_20240531.pdfspecial B.ed 2nd year old paper_20240531.pdf
special B.ed 2nd year old paper_20240531.pdf
Special education needs
 
The Challenger.pdf DNHS Official Publication
The Challenger.pdf DNHS Official PublicationThe Challenger.pdf DNHS Official Publication
The Challenger.pdf DNHS Official Publication
Delapenabediema
 
TESDA TM1 REVIEWER FOR NATIONAL ASSESSMENT WRITTEN AND ORAL QUESTIONS WITH A...
TESDA TM1 REVIEWER  FOR NATIONAL ASSESSMENT WRITTEN AND ORAL QUESTIONS WITH A...TESDA TM1 REVIEWER  FOR NATIONAL ASSESSMENT WRITTEN AND ORAL QUESTIONS WITH A...
TESDA TM1 REVIEWER FOR NATIONAL ASSESSMENT WRITTEN AND ORAL QUESTIONS WITH A...
EugeneSaldivar
 
Welcome to TechSoup New Member Orientation and Q&A (May 2024).pdf
Welcome to TechSoup   New Member Orientation and Q&A (May 2024).pdfWelcome to TechSoup   New Member Orientation and Q&A (May 2024).pdf
Welcome to TechSoup New Member Orientation and Q&A (May 2024).pdf
TechSoup
 
Digital Tools and AI for Teaching Learning and Research
Digital Tools and AI for Teaching Learning and ResearchDigital Tools and AI for Teaching Learning and Research
Digital Tools and AI for Teaching Learning and Research
Vikramjit Singh
 
Introduction to AI for Nonprofits with Tapp Network
Introduction to AI for Nonprofits with Tapp NetworkIntroduction to AI for Nonprofits with Tapp Network
Introduction to AI for Nonprofits with Tapp Network
TechSoup
 
Supporting (UKRI) OA monographs at Salford.pptx
Supporting (UKRI) OA monographs at Salford.pptxSupporting (UKRI) OA monographs at Salford.pptx
Supporting (UKRI) OA monographs at Salford.pptx
Jisc
 
Overview on Edible Vaccine: Pros & Cons with Mechanism
Overview on Edible Vaccine: Pros & Cons with MechanismOverview on Edible Vaccine: Pros & Cons with Mechanism
Overview on Edible Vaccine: Pros & Cons with Mechanism
DeeptiGupta154
 
Lapbook sobre os Regimes Totalitários.pdf
Lapbook sobre os Regimes Totalitários.pdfLapbook sobre os Regimes Totalitários.pdf
Lapbook sobre os Regimes Totalitários.pdf
Jean Carlos Nunes Paixão
 

Recently uploaded (20)

How to Make a Field invisible in Odoo 17
How to Make a Field invisible in Odoo 17How to Make a Field invisible in Odoo 17
How to Make a Field invisible in Odoo 17
 
A Strategic Approach: GenAI in Education
A Strategic Approach: GenAI in EducationA Strategic Approach: GenAI in Education
A Strategic Approach: GenAI in Education
 
The approach at University of Liverpool.pptx
The approach at University of Liverpool.pptxThe approach at University of Liverpool.pptx
The approach at University of Liverpool.pptx
 
Acetabularia Information For Class 9 .docx
Acetabularia Information For Class 9  .docxAcetabularia Information For Class 9  .docx
Acetabularia Information For Class 9 .docx
 
The Accursed House by Émile Gaboriau.pptx
The Accursed House by Émile Gaboriau.pptxThe Accursed House by Émile Gaboriau.pptx
The Accursed House by Émile Gaboriau.pptx
 
Francesca Gottschalk - How can education support child empowerment.pptx
Francesca Gottschalk - How can education support child empowerment.pptxFrancesca Gottschalk - How can education support child empowerment.pptx
Francesca Gottschalk - How can education support child empowerment.pptx
 
Sha'Carri Richardson Presentation 202345
Sha'Carri Richardson Presentation 202345Sha'Carri Richardson Presentation 202345
Sha'Carri Richardson Presentation 202345
 
Home assignment II on Spectroscopy 2024 Answers.pdf
Home assignment II on Spectroscopy 2024 Answers.pdfHome assignment II on Spectroscopy 2024 Answers.pdf
Home assignment II on Spectroscopy 2024 Answers.pdf
 
The geography of Taylor Swift - some ideas
The geography of Taylor Swift - some ideasThe geography of Taylor Swift - some ideas
The geography of Taylor Swift - some ideas
 
The Roman Empire A Historical Colossus.pdf
The Roman Empire A Historical Colossus.pdfThe Roman Empire A Historical Colossus.pdf
The Roman Empire A Historical Colossus.pdf
 
2024.06.01 Introducing a competency framework for languag learning materials ...
2024.06.01 Introducing a competency framework for languag learning materials ...2024.06.01 Introducing a competency framework for languag learning materials ...
2024.06.01 Introducing a competency framework for languag learning materials ...
 
special B.ed 2nd year old paper_20240531.pdf
special B.ed 2nd year old paper_20240531.pdfspecial B.ed 2nd year old paper_20240531.pdf
special B.ed 2nd year old paper_20240531.pdf
 
The Challenger.pdf DNHS Official Publication
The Challenger.pdf DNHS Official PublicationThe Challenger.pdf DNHS Official Publication
The Challenger.pdf DNHS Official Publication
 
TESDA TM1 REVIEWER FOR NATIONAL ASSESSMENT WRITTEN AND ORAL QUESTIONS WITH A...
TESDA TM1 REVIEWER  FOR NATIONAL ASSESSMENT WRITTEN AND ORAL QUESTIONS WITH A...TESDA TM1 REVIEWER  FOR NATIONAL ASSESSMENT WRITTEN AND ORAL QUESTIONS WITH A...
TESDA TM1 REVIEWER FOR NATIONAL ASSESSMENT WRITTEN AND ORAL QUESTIONS WITH A...
 
Welcome to TechSoup New Member Orientation and Q&A (May 2024).pdf
Welcome to TechSoup   New Member Orientation and Q&A (May 2024).pdfWelcome to TechSoup   New Member Orientation and Q&A (May 2024).pdf
Welcome to TechSoup New Member Orientation and Q&A (May 2024).pdf
 
Digital Tools and AI for Teaching Learning and Research
Digital Tools and AI for Teaching Learning and ResearchDigital Tools and AI for Teaching Learning and Research
Digital Tools and AI for Teaching Learning and Research
 
Introduction to AI for Nonprofits with Tapp Network
Introduction to AI for Nonprofits with Tapp NetworkIntroduction to AI for Nonprofits with Tapp Network
Introduction to AI for Nonprofits with Tapp Network
 
Supporting (UKRI) OA monographs at Salford.pptx
Supporting (UKRI) OA monographs at Salford.pptxSupporting (UKRI) OA monographs at Salford.pptx
Supporting (UKRI) OA monographs at Salford.pptx
 
Overview on Edible Vaccine: Pros & Cons with Mechanism
Overview on Edible Vaccine: Pros & Cons with MechanismOverview on Edible Vaccine: Pros & Cons with Mechanism
Overview on Edible Vaccine: Pros & Cons with Mechanism
 
Lapbook sobre os Regimes Totalitários.pdf
Lapbook sobre os Regimes Totalitários.pdfLapbook sobre os Regimes Totalitários.pdf
Lapbook sobre os Regimes Totalitários.pdf
 

Roll no. 20

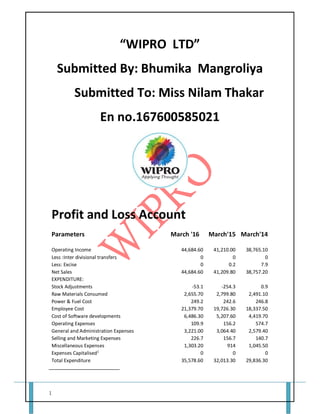
  • 1. 1 “WIPRO LTD” Submitted By: Bhumika Mangroliya Submitted To: Miss Nilam Thakar En no.167600585021 Profit and Loss Account Parameters March '16 March'15 March'14 Operating Income 44,684.60 41,210.00 38,765.10 Less :Inter divisional transfers 0 0 0 Less: Excise 0 0.2 7.9 Net Sales 44,684.60 41,209.80 38,757.20 EXPENDITURE: Stock Adjustments -53.1 -254.3 0.9 Raw Materials Consumed 2,655.70 2,799.80 2,491.10 Power & Fuel Cost 249.2 242.6 246.8 Employee Cost 21,379.70 19,726.30 18,337.50 Cost of Software developments 6,486.30 5,207.60 4,419.70 Operating Expenses 109.9 156.2 574.7 General and Administration Expenses 3,221.00 3,064.40 2,579.40 Selling and Marketing Expenses 226.7 156.7 140.7 Miscellaneous Expenses 1,303.20 914 1,045.50 Expenses Capitalised1 0 0 0 Total Expenditure 35,578.60 32,013.30 29,836.30
  • 2. 2 PBIDT (Excl OI) 9,106.00 9,196.50 8,920.90 Other Income 2,772.70 2,501.80 1,798.70 Operating Profit 11,878.70 11,698.30 10,719.60 Interest 527.8 362.9 374.7 PBDT 11,350.90 11,335.40 10,344.90 Depreciation 868.8 778.4 736.7 Profit Before Taxation & Exceptional Items 10,482.10 10,557.00 9,608.20 Exceptional Income / Expenses 0 0 0 Profit Before Tax 10,482.10 10,557.00 9,608.20 Provision for Tax 2,383.10 2,363.90 2,220.80 PAT 8,099.00 8,193.10 7,387.40 Extraordinary Items 0 0 0 Adj to Profit After Tax 134.2 0 0 Profit Balance B/F 15,994.70 12,176.90 7,837.10 Appropriations 24,227.90 20,370.00 15,224.50 Equity Dividend (%) 300 600 400 Earnings Per Share (in ₹) 32.78 33.19 29.96 Book Value (in ₹) 164.81 139.92 118.92 Comment: Opening Income 35,000.00 36,000.00 37,000.00 38,000.00 39,000.00 40,000.00 41,000.00 42,000.00 43,000.00 44,000.00 45,000.00 46,000.00 2016 2015 2014
  • 3. 3 Net Sales Stock Adjustments Raw Materials Consumed 35,000.00 36,000.00 37,000.00 38,000.00 39,000.00 40,000.00 41,000.00 42,000.00 43,000.00 44,000.00 45,000.00 46,000.00 2016 2015 2016 -300 -250 -200 -150 -100 -50 0 50 2016 2015 2014
  • 4. 4 Power & Fuel Cost Employee Cost 2,300.00 2,350.00 2,400.00 2,450.00 2,500.00 2,550.00 2,600.00 2,650.00 2,700.00 2,750.00 2,800.00 2,850.00 2016 2015 2014 238 240 242 244 246 248 250 2016 2015 2016
  • 5. 5 Cost of Software developments Operating expenses 0 1000 2000 3000 4000 5000 6000 7000 2016 2015 2014 16500 17000 17500 18000 18500 19000 19500 20000 20500 21000 21500 22000 2016 2015 2014
  • 6. 6 General and Administration Expenses Miscellaneous Expenses 0 100 200 300 400 500 600 700 2016 2015 2014 0 500 1000 1500 2000 2500 3000 3500 2016 2015 2014
  • 7. 7 PBIDT (Excl OI) Other Income 0 200 400 600 800 1000 1200 1400 2016 2015 2014 8750 8800 8850 8900 8950 9000 9050 9100 9150 9200 9250 2016 2015
  • 9. 9 Depreciation Profit Before Taxation & Exceptional Items PAT 650 700 750 800 850 900 2016 2015 2014 9000 9200 9400 9600 9800 10000 10200 10400 10600 10800 2016 2015 2014
  • 10. 10 Profit Balance B/F Appropriations 6800 7000 7200 7400 7600 7800 8000 8200 8400 2014 2015 2016 0 2000 4000 6000 8000 10000 12000 14000 16000 18000 2016 2015 2014
  • 11. 11 Equity Dividend Earnings Per Share 0 5000 10000 15000 20000 25000 30000 2016 2015 2014 0 100 200 300 400 500 600 700 2016 2015 2014
  • 12. 12 Balance Sheet Parameters MAR'16 MAR'15 MAR'14 EQUITY AND LIABILITIES Share Capital 494.10 493.70 493.20 Share Warrants & Out standings Shareholder's Funds 40,905.20 34,621.60 29,355.9 Long-Term Borrowings 0.00 0.00 0.00 Secured Loans 120.10 114.30 106.00 Unsecured Loans 1,026.40 948.90 900.10 Deferred Tax Assets / Liabilities -218.20 -109.20 -10.80 Other Long Term Liabilities 46.40 28.10 62.90 Long Term Trade Payables 0.00 0.00 0.00 Long Term Provisions 399.10 273.60 288.90 Total Non-Current Liabilities 1,373.80 1,255.70 1,347.10 Trade Payables 5,993.10 5,728.80 5,356.60 Current Liabilities Other Current Liabilities 2,665.20 2,551.10 2,404.80 Short Term Borrowings 5,549.50 4,970.40 3,504.20 Short Term Provisions 2,399.30 4,115.00 3,619.60 Total Current Liabilities 16,607.10 17,365.30 14,885.2 28 29 30 31 32 33 34 2016 2015 2014
  • 13. 13 Total Liabilities 58,886.10 53,242.60 45,588.2 Non-Current Assets 0.00 0.00 0.00 ASSETS Gross Block 10,304.90 9,453.80 9,043.40 Less: Accumulated Depreciation 6,116.20 5,415.40 5,068.40 Less: Impairment of Assets 0.00 0.00 0.00 Net Block 4,188.70 4,038.40 3,975.00 Lease Adjustment A/c 0.00 0.00 0.00 Capital Work in Progress 325.10 361.20 275.10 Intangible assets under development 0.00 0.00 0.00 Pre-operative Expenses pending 0.00 0.00 0.00 Assets in transit 0.00 0.00 0.00 Non Current Investments 5,732.80 5,579.70 5,196.80 Long Term Loans & Advances 2,936.50 2,810.80 2,896.20 Other Non Current Assets 674.30 597.00 640.90 Total Non-Current Assets 13,857.40 13,387.10 12,984.0 Total Reserves 40,220.90 34,046.40 28,831.8 Current Assets Loans & Advances Currents Investments 12,730.20 5,188.80 5,839.20 Inventories 526.20 479.40 228.30 Cash and Bank 12,007.80 15,667.50 10,554.9 Other Current Assets 6,571.20 6,044.70 4,963.90 Short Term Loans and Advances 4,488.50 4,330.90 2,467.00 Total Current Assets 45,028.70 39,855.50 32,604.2 Net Current Assets (Including Current Investments) 28,421.60 22,490.20 17,719.0 Total Current Assets Excluding Current Investments 32,298.50 34,666.70 26,765.0 Miscellaneous Expenses not written off 0.00 0.00 0.00 Total Assets 58,886.10 53,242.60 45,588.2 Contingent Liabilities 3,374.20 2,935.90 2,732.00 Total Debt 6,812.90 6,102.60 4,583.00 Book Value (in ₹) 164.80 0.00 118.92 Adjusted Book Value (in ₹) 164.80 0.00 118.92 Comment: Share capital
  • 14. 14 Shareholder's Funds Secured Loans 492.6 492.8 493 493.2 493.4 493.6 493.8 494 494.2 2016 2015 2014 0 5000 10000 15000 20000 25000 30000 35000 40000 45000 2016 2015 2014
  • 15. 15 Unsecured Loans Deferred Tax Assets 95 100 105 110 115 120 125 2016 2015 2014 820 840 860 880 900 920 940 960 980 1000 1020 1040 2016 2015 2014
  • 16. 16 Other Long Term Liabilities Long Term Provisions -250 -200 -150 -100 -50 0 2016 2015 2014 0 10 20 30 40 50 60 70 2016 2015 2014
  • 17. 17 Total Non-Current Liabilities Trade Payables 0 50 100 150 200 250 300 350 400 450 2016 2015 2014 1180 1200 1220 1240 1260 1280 1300 1320 1340 1360 1380 1400 2016 2015 2014
  • 18. 18 Other Current Liabilities Short Term Borrowings 5000 5200 5400 5600 5800 6000 6200 2016 2015 2014 2250 2300 2350 2400 2450 2500 2550 2600 2650 2700 2016 2015 2014
  • 19. 19 Short Term Provisions Total Current Liabilities 0 1000 2000 3000 4000 5000 6000 2016 2015 2014 0 500 1000 1500 2000 2500 3000 3500 4000 4500 2016 2015 2014
  • 20. 20 Total Liabilities Gross Block 13500 14000 14500 15000 15500 16000 16500 17000 17500 18000 2016 2015 2014 0 10000 20000 30000 40000 50000 60000 70000 2016 2015 2014
  • 21. 21 Capital Work in Progress Other Non Current Assets 8400 8600 8800 9000 9200 9400 9600 9800 10000 10200 10400 2016 2015 2014 0 50 100 150 200 250 300 350 400 2016 2015 2014
  • 22. 22 Total Reserves Currents Investments 540 560 580 600 620 640 660 680 700 2016 2014 2014 0 5000 10000 15000 20000 25000 30000 35000 40000 45000 2016 2015 2014
  • 24. 24 Other Current Assets Short Term Loans and Advances 0 2000 4000 6000 8000 10000 12000 14000 16000 18000 2016 2015 2014 0.00 1,000.00 2,000.00 3,000.00 4,000.00 5,000.00 6,000.00 7,000.00 2016 2015 2014
  • 25. 25 Net Current Assets (Including Current Investments) Total Current Assets Excluding Current Investments 0.00 500.00 1,000.00 1,500.00 2,000.00 2,500.00 3,000.00 3,500.00 4,000.00 4,500.00 5,000.00 2016 2015 2014 0.00 5,000.00 10,000.00 15,000.00 20,000.00 25,000.00 30,000.00 2016 2015 2014
  • 26. 26 Total Assets Contingent Liabilities 0.00 5,000.00 10,000.00 15,000.00 20,000.00 25,000.00 30,000.00 35,000.00 40,000.00 2016 2015 2014 0.00 10,000.00 20,000.00 30,000.00 40,000.00 50,000.00 60,000.00 70,000.00 2016 2015 2014
  • 27. 27 Total Debt 2 2 www.moneycontrol.com › MARKETS › Computers - Software 0.00 500.00 1,000.00 1,500.00 2,000.00 2,500.00 3,000.00 3,500.00 4,000.00 2016 2015 2014 0.00 1,000.00 2,000.00 3,000.00 4,000.00 5,000.00 6,000.00 7,000.00 8,000.00 2016 2015 2014