Higher-order spectral graph clustering with motifs
•
4 likes•1,046 views

Higher-order spectral graph clustering uses motifs to find clusters in networks. It forms a weighted matrix based on a motif (e.g., triangles) and runs spectral clustering on that matrix. This captures clusters defined by the motif better than standard edge-based clustering. The technique has theoretical guarantees via a motif Cheeger inequality. Applications show it outperforms edge methods on food webs, gene networks, and transportation networks. Experiments on stochastic block models suggest the motif weighting improves cluster detection, potentially by making eigenvectors more localized to clusters. Open questions remain around eigenvalue distributions and convergence properties.

Recommended
More Related Content
What's hot
What's hot (11)
Similar to Higher-order spectral graph clustering with motifs
Similar to Higher-order spectral graph clustering with motifs (20)
More from Austin Benson
More from Austin Benson (20)
Recently uploaded
Recently uploaded (20)
Higher-order spectral graph clustering with motifs
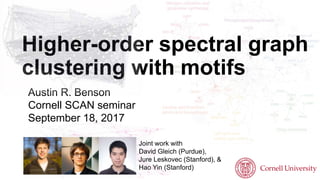
- 1. Higher-order spectral graph clustering with motifs Austin R. Benson Cornell SCAN seminar September 18, 2017 Joint work with David Gleich (Purdue), Jure Leskovec (Stanford), & Hao Yin (Stanford)
- 2. 2 Brains nodes are neurons edges are synapses Social networks nodes are people edges are friendships Electrical grid nodes are power plants edges are transmission linesTim Meko, Washington Post Currency nodes are accounts edges are transactions Background. Networks are sets of nodes and edges (graphs) that model real-world systems.
- 3. 3 G = (V, E) A To study relationships in the network • centrality • reachability • clustering • and more… we often use matrix computations Just like most other things in life, I often think about networks as matrices.
- 4. Given an undirected graph G = (V, E) Instead of using its symmetric adjacency matrix A consider using the weighted matrix Hadamard / element-wise
- 5. Given a directed graph G = (V, E) Instead of using its non-symmetric adjacency matrix A = B + U consider using a weighted matrix
- 6. what why where The matrix counts the number of triangles that edges participate in. The matrix comes up in our higher-order network clustering framework when using triangles as the motif. We often get better empirical results in real-world networks and better numerical properties in model partitioning problems (stochastic block model).
- 7. 7 Key insight [Flake 2000; Newman 2004, 2006; many others…]. Networks for real-world systems have modules, clusters, communities. • We want algorithms to uncover the clusters automatically. • Main idea has been to optimize metrics involving the number of nodes and edges in a cluster. Conductance, modularity, density, ratio cut, … Co-author network Brain network, de Reus et al., RSTB, 2014. Background. Networks are sets of nodes and edges (graphs) that model real-world systems.
- 8. 8 Key insight [Milo+02]. Networks modelling real-world systems contain certain small subgraphs patterns way more frequently than expected. [Mangan+ 2003; Alon 2007] Signed feed-forward loops in genetic transcription. Triangles in social relationships. [Simmel 1908; Rapoport 1953; Granovetter 1973] Bi-directed length-2 paths in brain networks. [Sporns-Kötter 2004; Sporns+ 2007; Honey+ 2007] We call these small subgraph patterns motifs. Background. Networks are sets of nodes and edges (graphs) that model real-world systems.
- 9. 9 Motifs are the fundamental units of complex networks. We should design our clustering algorithms around motifs.
- 10. Network Motif Different motifs give different clusters. 10 Higher-order graph clustering is our technique for finding coherent groups of nodes based on motifs.
- 11. Conductance is one of the most important cluster quality scores [Schaeffer 2007] used in Markov chain theory, spectral clustering, bioinformatics, vision, etc. The conductance of a set of vertices S is the ratio of edges leaving to total edges small conductance good cluster (edges leaving S) (edge end points in S) 11 S S Background. Graph clustering and conductance.
- 12. Cheeger Inequality Finding the best conductance set is NP-hard. • Cheeger realized the eigenvalues of the Laplacian provided surface area to volume bounds in manifolds. • Alon and Milman independently realized the same thing for a graph (conductance)! Laplacian 12 [Cheeger 1970; Alon-Milman 1985] Background. Spectral clustering has theoretical guarantees.
- 13. We can find a set S that achieves the Cheeger bound. 1. Compute the eigenvector z associated with λ2 and scale to f = D-1/2z 2. Sort the vertices by their values in f: σ1, σ2, …, σn 3. Let Sr = {σ1, …, σr} and compute the conductance of φ(Sr) of each Sr. 4. Pick the set Sm with minimum conductance. 13 [Mihail 1989; Chung 1992] 0 20 40 0 0.2 0.4 0.6 0.8 1 Si fi Background. The sweep cut realizes the guarantee.
- 14. 0 20 40 0 0.2 0.4 0.6 0.8 1 Si fi 14 Background. The sweep cut visualized.
- 15. 15 Signed feed-forward loops in genetic transcription [Mangan+03] • Gene X activates transcription in gene Y. • Gene X suppresses transcription in gene Z. • Gene Y suppresses transcription in gene Z.X Y Z Spectral clustering is theoretically justified for undirected graphs • Various extensions to multiple clusters [Ng-Jordan-Weiss 2002; Dhillon-Guan-Kulis 2004; Lee-Gharan-Trevisan 2014] • Weighted graphs are okay (weighted cut, weighted volume) • Approximate eigenvectors are okay [Mihail89; Fairbanks+ 2017] Current network models are more richly annotated • directed, signed, colored, layered, multiplex, higher-order, etc. Modern datasets are much more rich than the simple networks for which spectral clustering is justified.
- 16. [Benson-Gleich-Leskovec 2016; Yin-Benson-Leskovec-Gleich 2017] 16 • A generalized conductance metric for motifs. • A “new” spectral clustering algorithm to minimize the generalized conductance. • AND an associated motif Cheeger inequality guarantee. • Several applications Aquatic layers in food webs, functional groups in genetic regulation Hub structure in transportation. • Extensions to localized clustering. Our contributions. New and preliminary! Studies on stochastic block models.
- 17. Need new notions of cut and volume… 17 M = triangle motif Motif conductance.
- 18. Motif M 18 9 10 3 5 6 7 8 1 2 4 9 10 3 5 6 7 8 1 2 4 There is a symmetric matrix that is appropriate for studying motif conductance—even if the network and motif are directed.
- 19. 1 11 1 1 1 3 1 1 1 1 1 2 1 1 19 9 10 3 5 6 7 8 1 2 4 motif M graph G weighted graph W(M) bidirectional edges unidirectional links There is a symmetric matrix that is appropriate for studying motif conductance—even if the network and motif are directed.
- 20. 20 Key insight. [Benson-Gleich-Leskovec 2016] Classical spectral clustering on weighted graph W(M) finds clusters of low motif conductance. Using matrix tools for higher-order clustering. 1 11 1 1 1 3 1 1 1 1 1 2 1 1 weighted graph W(M)
- 21. 1. Pick your favorite motif. 2. Form weighted matrix W(M). 3. Compute the Fiedler eigenvector f(M) associated with λ2 of the normalized Laplacian matrix of W(M). 4. Run a sweep on f(M) 21 f(M) Higher-order spectral clustering.
- 22. 22 (there are faster algorithms to compute these matrices, but this is a useful jumping off point.) There are nice matrix computations for 3-node motifs.
- 23. bidirection al unidirection al 23 There are nice matrix computations for 3-node motifs.
- 24. Theorem. If the motif has three nodes, then the sweep procedure on the weighted graph finds a set S of nodes for which 24 Key Proof Step Implication. Just run spectral clustering with the weighted matrix coming from your favorite motif. The three-node motif Cheeger inequality.
- 25. 25 Awesome advantages! • Works for arbitrary non-negative combos of motifs and weighted motifs, too. • We inherit 40+ years of research! • Fast algorithms (ARPACK, etc.) • Local methods! [Yin-Benson-Leskovec-Gleich 2017] • Overlapping! via [Whang-Dillon-Gleich 2015] • Easy to implement • Scalable (1.4B edges graphs are not a problem) bit.ly/motif-spectral-julia
- 26. 26 1. We do not know the motif of interest. food webs and new applications 2. We know the motif of interest from domain knowledge. yeast transcription regulation networks, connectome, social networks 3. We seek richer information from our data. transportation networks and new applications Lots of fun applications.
- 27. Florida bay food web • Nodes are species. • Edges represent carbon exchange i → j if j eats i. • Motifs represent energy flow patterns. 27 http://marinebio.org/oceans/marine-zones/ Application 1. Food webs.
- 28. Which motif clusters the food web? Our approach • Run motif spectral clustering for all 3-node motifs as well as for just edges. • Look at sweep cuts to see which motif gives the best clusters. 28 Application 1. Food webs.
- 29. 29 Our finding. Motif M6 organizes the food web into good clusters Application 1. Food webs.
- 30. Micronutrient sources Pelagic fishes and benthic prey Benthic macro- invertebrates Benthic Fishes Motif M6 reveals aquatic layers 61% accuracy vs. 48% with edge- based methods 30 Application 1. Food webs.
- 31. • Nodes are groups of genes. • Edge i → j means i regulates transcription to j. • Sign + / - denotes activation / suppression. • Coherent feedforward loops encode biological function. [Mangan-Zaslaver-Alon 2003; Mangan-Alon 2003; Alon 2007] 31 Application 2. Yeast transcription regulation networks.
- 32. Clustering based on coherent feedforward loops identifies functions studied individually by biologists [Mangan+ 2003] 97% accuracy vs. 68–82% with edge-based methods 32 Application 2. Yeast transcription regulation networks.
- 33. • North American air transport network. • Nodes are cites. • i → j if you can travel from i to j in < 8 hours. [Frey-Dueck 2007] 33 Application 3. Transportation networks.
- 34. Important motifs from literature [Rosvall+ 2014] Weighted adjacency matrix already reveals hub-like structure. 34 Application 3. Transportation networks.
- 35. Top 8 U.S. hubs East coast non-hubs West coast non- hubs Primary spectral coordinate Atlanta, the top hub, is next to Salina, a non-hub. MOTIF SPECTRAL EMBEDDING EDGE SPECTRAL EMBEDDING 35 Application 3. Transportation networks.
- 36. 36 In localized clustering, we aim to find a small set of nodes of low conductance containing a particular seed node without looking at the entire graph. Seed node Local cluster A major benefit of our theory is that it easily generalizes to related problems.
- 37. 37 Random walk procedure • With probability a, hop to a random neighbor. • With probability 1- a, jump back to the seed node. • Stationary distribution tells us what is “close” to the seed. If the seed is in a good cluster, the stationary distribution is localized and we can approximate it in sublinear time using results of [Andersen-Chung-Lang 2006]. Uses sweep cut on approx. x. Background. Localized clustering works in theory and practice with the (fast) personalized PageRank method.
- 38. 38 We use our same trick and generalize the theory to triangles (and other motifs). Now random walks look like With probability a, hop to a random neighbor adjacent triangle and then to a random endpoint of that triangle (not the one we came from). With probability 1- a, go back to the seed node. Higher-order localized clustering. [Yin-Benson-Leskovec-Gleich 2017]
- 39. 39 Nodes are people at a research institute. Each person is in a department. Edges are email correspondence. Using each person as a seed, can we recover their department? Average F1 0.40 0.50 Using the triangle motif in higher-order localized clustering better captures community structure in email data.
- 40. what why where The matrix counts the number of triangles that edges participate in. The matrix comes up in our higher-order network clustering framework when using triangles as the motif. We often get better empirical results in real-world networks and better numerical properties in model partitioning problems (stochastic block model).
- 41. 41 SSBM m = 200, k = 5, p = 0.3, q = 0.13 The symmetric stochastic block model (SSBM) • k blocks, each of size m-by-m • within-block edges exist with prob. p • between-block edges with prob. q The task. Given a graph that is an SSBM and given m, k, p, q, find the k blocks. Theory (lots!). See in-prep. survey “Community Detection and the Stochastic Block Model” from E. Abbe. • Exact recovery (get all correct) • Detectability (find a non-trivial portion) • Uses non-backtracking random walks. The stochastic block model is a standard model used to study recovery of planted cluster structure.
- 42. We are currently looking at the SSBM using our motif- weighting based on triangles. 42 Based also on Tsourakakis, Pachocki, & Mitzenmacher, WWW, 2017. → triangle conductance of a block < edge-conductance of the block.
- 43. We use a mixing parameter thought of as the expected fraction of neighbors outside of a block 43 From the eyeball test, just using the motif weighting highlights the blocks better for a range of parameters. Exp. details Randomly sample SSBM(50, 10, p=0.2, q) for varying q. Plot 2D histogram (density).
- 44. Detectability Exact recovery Exp. details. We take normalized Laplacian and shift to reverse the spectrum. Then we deflate given knowledge of the leading eigenvector. Accuracy is the most accurate block in the extremal m (size of block) entries. Note: threshold is for all block recovery. Accuracy The power method identifies a cluster better using the motif weighting than the adjacency.
- 45. Most accurate block Nodes whose value is greater than the smallest green node value Nodes whose value is smaller than the smallest green node value. The power method identifies a cluster better using the motif weighting than the adjacency.
- 46. 46 We don’t converge faster for the usual reasons that we would think of the power method converging faster.
- 47. 47 There is a gap deeper in the spectrum that could explain what is going on.
- 48. 48 semi-circle law (not a Marchenko-Pastur law) The motif weighting shifts all eigenvalues down, but it pushes the lowest ones down the most.
- 49. 49 • Eigenvalues show that we’ll converge to the “cluster subspace” faster. • Conjecture. Higher accuracy for motifs because the eigenvectors we converge to are more localized—or sharper—around the clusters. • But we don’t know why they are sharper! We would like a numerical explanation for why we get better results with motifs. Top non-trivial eigenvectors of normalized Laplacian fighting less with motif weighting?
- 50. 50 The iterative algorithm for personalized PageRank tends to localize more. Nodes whose value is greater than the smallest node value in the seed’s block. Rest of the nodes.
- 51. 51 Papers • “Higher-order organization of complex networks.” Benson, Gleich, and Leskovec. Science, 2016. • “Local higher-order graph clustering.” Yin, Benson, Leskovec, and Gleich. KDD, 2017. 1. A generalized conductance metric for motifs. 2. A “new” spectral clustering algorithm to minimize the generalized conductance. 3. AND an associated motif Cheeger inequality guarantee. 4. Extensions to localized clustering. 5. Applications with food webs, genetic regulation networks, transportation systems, social networks. 6. Eigenvalues with motifs in SSBMs. Open questions • What is the distribution law for the eigenvalues of the Laplacian of A2 ⊙ A? • Relationship between convergence of the power method and localization? • How to work with element- wise prods like matvecs for http://cs.cornell.edu/~arb @austinbenson arb@cs.cornell.edu Thanks! Austin Benson Code & Data snap.stanford.edu/higher-order github.com/arbenson/higher-order-organization-julia bit.ly/motif-spectral-julia github.com/dgleich/motif-ssbm 9 10 8 7 2 0 4 3 11 6 5 1
Editor's Notes
- Title: medium 30 Text: light 26 Subtext: light 22 References: thin 22 Annotation: thin 20 blue
- What is this weighted matrix? Why do I should look at it? How do you do this?
- \phi(S) = \frac{ \text{cut}(S) }{ \raisebox{-0.1cm}{ min($\text{vol}(S)$, $\text{vol}(S)$) } }
- \phi(S) = \frac{ \text{cut}(S) }{ \raisebox{-0.1cm}{ min($\text{vol}(S)$, $\text{vol}(S)$) } } text{vol}_M(S) = \#(\text{motif end points in $S$}) \text{cut}_M(S) = \#(\text{motifs cut}) \text{cut}(S) = \#(\text{edges cut}) \text{vol}(S) = \#(\text{edge end points in $S$})
- $\phi(S) = \frac{\text{cut}(S)}{\min(\text{vol}(S), \text{vol}(\bar{S}))}$
- D &= \text{diag}(W^{(M)}e) \\ \mathcal{L}^{(M)} &= D^{-1/2}(D - W^{(M)})D^{-1/2} \\ \mathcal{L}^{(M)}z &= \lambda_2 z \\ f^{(M)} &= D^{-1/2}z
- $\phi(S) = \frac{\text{cut}(S)}{\min(\text{vol}(S), \text{vol}(\bar{S}))}$
- $\phi(S) = \frac{\text{cut}(S)}{\min(\text{vol}(S), \text{vol}(\bar{S}))}$
- $\phi(S) = \frac{\text{cut}(S)}{\min(\text{vol}(S), \text{vol}(\bar{S}))}$
- $\phi(S) = \frac{\text{cut}(S)}{\min(\text{vol}(S), \text{vol}(\bar{S}))}$
- What is this weighted matrix? Why do I should look at it? How do you do this?
- Mu = 0.41 in this Y-axis is value of Bottom plot is sorted vector