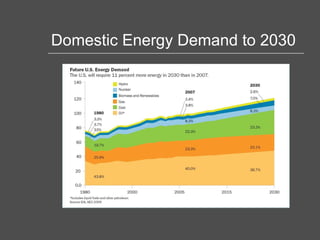
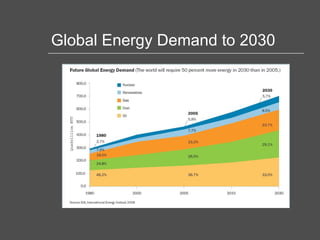
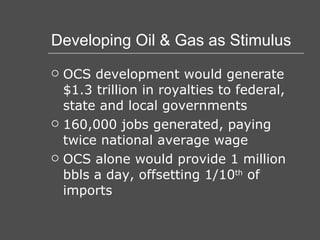
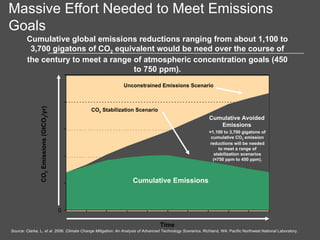
Energy: Climate, Stimulus and National Security Iain Murray Heritage Resource Bank Los Angeles, CA April 23, 2009
The Energy Conundrum Global and Domestic energy demand is increasing The West has erected barriers to domestic energy development Demands to erect more barriers are increasing ‘Acceptable’ energy cannot meet demand
Domestic Energy Demand to 2030
Global Energy Demand to 2030
Drill Baby Drill Removed Barriers
Developing Oil & Gas as Stimulus OCS development would generate $1.3 trillion in royalties to federal, state and local governments 160,000 jobs generated, paying twice national average wage OCS alone would provide 1 million bbls a day, offsetting 1/10 th  of imports
But Delay Has Replaced Moratoria Interior Department extended comment period for the five year offshore oil and natural gas lease plan Interior pushed back second round of oil shale R&D leases VA governor delaying offshore lease sale scheduled for 2011
Delay the New Watchword Nuclear permitting process takes 14 years (recent UK govt review suggests 4 years) Coal power plant permits being delayed all over country unless CCS technology used (doesn’t exist) LNG terminal permit in Long Island Sound blocked Energy fine in principle, blocked in practice
Western Europe Similar Story High gas prices mean electricity main energy issue Nuclear plants being phased out (except in France) Coal plants being phased out Greater demand for NG NG supply dominated by Russia
Putin’s Energy Plan Dec 2008 – ‘Era of cheap gas is coming to an end’ Gas Exporting Countries Forum (GECF) founded in Moscow GECF members: Algeria, Bolivia, Brunei, Egypt, Indonesia, Iran, Libya, Malaysia, Nigeria, Qatar, Russia, Trinidad and Tobago, the United Arab Emirates and Venezuela
Environment Driving Western Policy Unifying factor behind US delay and European switch to gas is environmental alarmism Climate alarmism rules out domestic production of fossil fuels Environmental movement not budging on nuclear
Environmental Energy Goals Are Fantasy Massive effort is required to cut emissions ‘Approved’ environmental fuels cannot meet energy demands Developing world is not going to comply, even if we completely eliminate emissions
Massive Effort Needed to Meet Emissions Goals Source: Clarke, L.  et al.  2006.  Climate Change Mitigation: An Analysis of Advanced Technology Scenarios . Richland, WA: Pacific Northwest National Laboratory. Cumulative global emissions reductions ranging from about 1,100 to 3,700 gigatons of CO 2  equivalent would be need over the course of the century to meet a range of atmospheric concentration goals (450 to 750 ppm). 1st GtC Avoided CO 2  Emissions (GtCO 2 /yr) Cumulative Emissions  Cumulative Avoided Emissions Unconstrained Emissions Scenario CO 2  Stabilization Scenario ≈ 1,100 to 3,700 gigatons of cumulative CO 2  emission reductions will be needed to meet a range of stabilization scenarios (≈750 ppm to 450 ppm). Time 0
How Big is One Gigaton* of CO 2 ? *Gigaton = 10 9  Metric Tons Install 1,000 sequestration sites like Norway’s Sleipner project (1 MtCO2/year)—Only 3 sequestration projects of this scale exist today. Geologic Sequestration Build 273 “zero-emission” 500 MW coal-fired power plants—Equivalent to about 7% of current global installed coal-fired generating capacity of 2 million MW. Coal-Fired Power Plants Convert a barren area of about 4,800,000 km 2 —Equivalent to about 2 times the size of the United Kingdom. Biomass Fuels from Plantations Install capacity to produce 273 times the current global solar PV generation instead of new coal-fired power plants without CCS. Solar Photovoltaics Actions that Provide One Gigaton CO 2 / Year of Mitigation or Offsets Technology Convert a barren area of about 900,000 km 2 —Equivalent to more that the size of Germany and France combined. CO 2   Storage in New Forest Install capacity to produce 14 times the current global wind generation capacity (about 74 GW)   instead of new coal-fired power plants without CCS—Equivalent to more than 1 million 1 MW wind turbines. Wind Energy Deploy 273 million new cars at 40 miles per gallon (mpg) instead of 20 mpg (or at 14 km/L instead of 7 km/L). Efficiency Build 136 new nuclear power plants of 1 GW each instead of new coal-fired power plants without CCS—Equivalent to about one third of existing worldwide nuclear capacity of 375 GW. Nuclear
2050 Reference Emissions Annex I Countries  Non-Annex I Countries Annex I Emissions at 20% 2000 Emissions Annex I Emissions at 50% 2000 Emissions -100% -84% -59% -62% -71% -85% 1  Measured as MMTCO 2  per million people, excluding LULUCF. 2  50% of 2000 global CO 2  emissions equals 12.3 Gt. 3  Equals reduction from 2050 reference for that group ( i.e ., Annex I or Non-Annex I). Source: Climate  Change Science Program . 2007.  Scenarios of Greenhouse Gas Emissions and Atmospheric Concentrations  (MINICAM Model results). Annex I Emissions at “0” To Achieve a 50% Reduction in Global CO 2  Emissions by 2050, Per Capita Emissions from Developing Countries Must Go Down Percent Reductions from 2050 Reference 3 2000 Annex I Reference Emissions/ Capita (12.7) 2000 Non-Annex I Reference Emissions/ Capita (4.4) 2050 Annex I Emissions/ Capita (0)  2050 Non-Annex I Emissions/ Capita (1.7)  2050 Annex I Emissions/ Capita (2.1)  2050 Non-Annex I Emissions/ Capita (1.3)  2050 Annex I Emissions/ Capita (5.2)  2050 Non-Annex I Emissions/ Capita (0.7)  CO 2 , Emissions per Capita (MMTCO2 per million pop.) 2000 2000
How Do We Respond?  We Need to Re-legitimize Energy
Human Achievement Hour
The Prague Network Patron: President Vaclav Klaus Three Areas of interest - Energy Security - Energy Poverty - Environmental Alarmism
For More Information Competitive Enterprise Institute GlobalWarming.org Institute for Energy Research MasterResource Blog Planet Gore Blog on National Review Online
Extra Slides Follow
Scale of Changes in Transport Sector Source: International Energy Agency,  Energy Technology Perspectives 2008, Scenarios and Strategies to 2050 .
Most of Our Oil is North American 42% of oil produced domestically Third of all imports is from Canada and Mexico Value of imports currently $235bn
Environmental Disaster of Biofuels Land Use Scenario  ≈ 550 ppmv Source:  Global Energy Technology Strategy, Addressing Climate Change: Phase 2 Findings from an International Public-Private Sponsored Research Program , Battelle Memorial Institute, 2007. Land Use Scenario with 0.5% annual agricultural activity growth. By 2050, land use required for bioenergy crops may account for approximately 4 to 5% of total land use; by 2095 approximately 20%.

Heritage Resource Bank Apr09

  • 1.
    Energy: Climate, Stimulusand National Security Iain Murray Heritage Resource Bank Los Angeles, CA April 23, 2009
  • 2.
    The Energy ConundrumGlobal and Domestic energy demand is increasing The West has erected barriers to domestic energy development Demands to erect more barriers are increasing ‘Acceptable’ energy cannot meet demand
  • 3.
  • 4.
  • 5.
    Drill Baby DrillRemoved Barriers
  • 6.
    Developing Oil &Gas as Stimulus OCS development would generate $1.3 trillion in royalties to federal, state and local governments 160,000 jobs generated, paying twice national average wage OCS alone would provide 1 million bbls a day, offsetting 1/10 th of imports
  • 7.
    But Delay HasReplaced Moratoria Interior Department extended comment period for the five year offshore oil and natural gas lease plan Interior pushed back second round of oil shale R&D leases VA governor delaying offshore lease sale scheduled for 2011
  • 8.
    Delay the NewWatchword Nuclear permitting process takes 14 years (recent UK govt review suggests 4 years) Coal power plant permits being delayed all over country unless CCS technology used (doesn’t exist) LNG terminal permit in Long Island Sound blocked Energy fine in principle, blocked in practice
  • 9.
    Western Europe SimilarStory High gas prices mean electricity main energy issue Nuclear plants being phased out (except in France) Coal plants being phased out Greater demand for NG NG supply dominated by Russia
  • 10.
    Putin’s Energy PlanDec 2008 – ‘Era of cheap gas is coming to an end’ Gas Exporting Countries Forum (GECF) founded in Moscow GECF members: Algeria, Bolivia, Brunei, Egypt, Indonesia, Iran, Libya, Malaysia, Nigeria, Qatar, Russia, Trinidad and Tobago, the United Arab Emirates and Venezuela
  • 11.
    Environment Driving WesternPolicy Unifying factor behind US delay and European switch to gas is environmental alarmism Climate alarmism rules out domestic production of fossil fuels Environmental movement not budging on nuclear
  • 12.
    Environmental Energy GoalsAre Fantasy Massive effort is required to cut emissions ‘Approved’ environmental fuels cannot meet energy demands Developing world is not going to comply, even if we completely eliminate emissions
  • 13.
    Massive Effort Neededto Meet Emissions Goals Source: Clarke, L. et al. 2006. Climate Change Mitigation: An Analysis of Advanced Technology Scenarios . Richland, WA: Pacific Northwest National Laboratory. Cumulative global emissions reductions ranging from about 1,100 to 3,700 gigatons of CO 2 equivalent would be need over the course of the century to meet a range of atmospheric concentration goals (450 to 750 ppm). 1st GtC Avoided CO 2 Emissions (GtCO 2 /yr) Cumulative Emissions Cumulative Avoided Emissions Unconstrained Emissions Scenario CO 2 Stabilization Scenario ≈ 1,100 to 3,700 gigatons of cumulative CO 2 emission reductions will be needed to meet a range of stabilization scenarios (≈750 ppm to 450 ppm). Time 0
  • 14.
    How Big isOne Gigaton* of CO 2 ? *Gigaton = 10 9 Metric Tons Install 1,000 sequestration sites like Norway’s Sleipner project (1 MtCO2/year)—Only 3 sequestration projects of this scale exist today. Geologic Sequestration Build 273 “zero-emission” 500 MW coal-fired power plants—Equivalent to about 7% of current global installed coal-fired generating capacity of 2 million MW. Coal-Fired Power Plants Convert a barren area of about 4,800,000 km 2 —Equivalent to about 2 times the size of the United Kingdom. Biomass Fuels from Plantations Install capacity to produce 273 times the current global solar PV generation instead of new coal-fired power plants without CCS. Solar Photovoltaics Actions that Provide One Gigaton CO 2 / Year of Mitigation or Offsets Technology Convert a barren area of about 900,000 km 2 —Equivalent to more that the size of Germany and France combined. CO 2 Storage in New Forest Install capacity to produce 14 times the current global wind generation capacity (about 74 GW) instead of new coal-fired power plants without CCS—Equivalent to more than 1 million 1 MW wind turbines. Wind Energy Deploy 273 million new cars at 40 miles per gallon (mpg) instead of 20 mpg (or at 14 km/L instead of 7 km/L). Efficiency Build 136 new nuclear power plants of 1 GW each instead of new coal-fired power plants without CCS—Equivalent to about one third of existing worldwide nuclear capacity of 375 GW. Nuclear
  • 15.
    2050 Reference EmissionsAnnex I Countries Non-Annex I Countries Annex I Emissions at 20% 2000 Emissions Annex I Emissions at 50% 2000 Emissions -100% -84% -59% -62% -71% -85% 1 Measured as MMTCO 2 per million people, excluding LULUCF. 2 50% of 2000 global CO 2 emissions equals 12.3 Gt. 3 Equals reduction from 2050 reference for that group ( i.e ., Annex I or Non-Annex I). Source: Climate Change Science Program . 2007. Scenarios of Greenhouse Gas Emissions and Atmospheric Concentrations (MINICAM Model results). Annex I Emissions at “0” To Achieve a 50% Reduction in Global CO 2 Emissions by 2050, Per Capita Emissions from Developing Countries Must Go Down Percent Reductions from 2050 Reference 3 2000 Annex I Reference Emissions/ Capita (12.7) 2000 Non-Annex I Reference Emissions/ Capita (4.4) 2050 Annex I Emissions/ Capita (0) 2050 Non-Annex I Emissions/ Capita (1.7) 2050 Annex I Emissions/ Capita (2.1) 2050 Non-Annex I Emissions/ Capita (1.3) 2050 Annex I Emissions/ Capita (5.2) 2050 Non-Annex I Emissions/ Capita (0.7) CO 2 , Emissions per Capita (MMTCO2 per million pop.) 2000 2000
  • 16.
    How Do WeRespond? We Need to Re-legitimize Energy
  • 17.
  • 18.
    The Prague NetworkPatron: President Vaclav Klaus Three Areas of interest - Energy Security - Energy Poverty - Environmental Alarmism
  • 19.
    For More InformationCompetitive Enterprise Institute GlobalWarming.org Institute for Energy Research MasterResource Blog Planet Gore Blog on National Review Online
  • 20.
  • 21.
    Scale of Changesin Transport Sector Source: International Energy Agency, Energy Technology Perspectives 2008, Scenarios and Strategies to 2050 .
  • 22.
    Most of OurOil is North American 42% of oil produced domestically Third of all imports is from Canada and Mexico Value of imports currently $235bn
  • 23.
    Environmental Disaster ofBiofuels Land Use Scenario ≈ 550 ppmv Source: Global Energy Technology Strategy, Addressing Climate Change: Phase 2 Findings from an International Public-Private Sponsored Research Program , Battelle Memorial Institute, 2007. Land Use Scenario with 0.5% annual agricultural activity growth. By 2050, land use required for bioenergy crops may account for approximately 4 to 5% of total land use; by 2095 approximately 20%.